
 Submit a Paper
 Propose a Special lssue
 Open Access
ARTICLE

An Experimental Analysis of Gas-Liquid Flow Breakdown in a T-Junction
1 Technical Inspection Center, Sinopec Shengli Oilfield Company, Dongying, 257000, China
2 New Energy Development Center, Sinopec Shengli Oilfield Company, Dongying, 257000, China
3 China National Oil and Gas Exploration and Development Company, Ltd., Beijing, 100034, China
* Corresponding Author: Lihui Ma. Email:
(This article belongs to the Special Issue: Multiphase Flow and Vortex Dynamics in Fluid Machinery)
Fluid Dynamics & Materials Processing 2024, 20(6), 1381-1392. https://doi.org/10.32604/fdmp.2024.046405
Received 02 December 2023; Accepted 16 January 2024; Issue published 27 June 2024
 View Full Text
 Download PDF
Abstract
When a gas-liquid two-phase flow (GLTPF) enters a parallel separator through a T-junction, it generally splits unevenly. This phenomenon can seriously affect the operation efficiency and safety of the equipment located downstream. In order to investigate these aspects and, more specifically, the so-called bias phenomenon (all gas and liquid flowing to one pipe, while the other pipe is a liquid column that fluctuates up and down), laboratory experiments were carried out by using a T-junction connected to two parallel vertical pipes. Moreover, a GLTPF prediction model based on the principle of minimum potential energy was introduced. The research results indicate that this model can accurately predict the GLTPF state in parallel risers. The boundary of the slug flow and the churn flow in the opposite pipe can be predicted. Overall, according to the results, the pressure drop curves of the two-phase flow in the parallel risers are basically the same when there is no bias phenomenon, but the pressure drop in the parallel riser displays a large deviation when there is a slug flow-churn flow. Only when the parallel riser is in a state of asymmetric flow and one of the risers produces churn flow, the two-phase flow is prone to produce the bias phenomenon.Keywords
Some special phenomena in pipelines, such as unstable flow [1,2] and erosion [3–5], can have adverse effects on pipelines and downstream equipment. In T-junction systems, gas-liquid two-phase flows (GLTPF) are often split into multiple branches. The distribution of these flows can be uneven, influenced by factors such as the unpredictable nature of the two-phase flow at the T-junction’s entrance and the unequal conditions in the pipelines downstream of the T-junction. The so-called uneven distribution phenomenon has two meanings: one is in which the GLTPF passes through the T-junction, the GLTPF has a different gas-liquid ratio in the downstream parallel pipelines, and the other is an uneven flow distribution in the downstream parallel pipelines [6,7].
In the past half century, researchers have carried out much research on the uneven gas-liquid ratio distribution of GLTPF, mainly considering the branch pipe structure, branch pipe direction, gas-liquid flow velocity, inlet GLTPF pattern and other influencing factors. Many prediction models have been established to predict the gas liquid two-phase flow distribution (such as a dividing line model, double-line model, or models based on the T-tube in the momentum balance mechanism model), while the mechanism of gas liquid two-phase flow splitting exhibits great differences; however, the GLTPF split model has certain reliability for the prediction of an equal gas-liquid ratio. However, relatively few studies on the even flow distribution in branch pipelines exist. For this reason, in recent years, many research institutions have conducted much research on the phenomenon of evenly distributed flow.
The phase distribution in the impact T-tube has been studied previously. As long as the mass shunt ratio is 0.5 at the outlet of two p-parallel pipes, there will be no uneven distribution of GLTPF particles in the impact T-pipe. The way to maintain the same mass split ratio is to maintain the consistency of the downstream equipment, including the pipe diameter, pipe length, separator size and opening of each valve. El-Shaboury et al. [8] studied the shunt of stable two-phase flow (stratified flow, wavy flow and annular flow) at an impact T-tube. Alvarez et al. [9] conducted slug flow experiments. These two studies showed that by keeping the downstream equipment operating under the same conditions, the GLTPF always exhibited a uniform distribution, independent of the flow pattern at the inlet. Dabirian et al. [10] and Mi et al. [11] studied the shunt characteristics of slug flow from a single tube into a parallel separator. The experimental results showed that the pipeline conditions at the gas phase outlet of the separator were symmetrical, and the shunt results of slug flow between the two separators had an equal flow distribution. If the opening of the gas phase outlet of the two separators is adjusted, the flow is asymmetrically distributed, and the degree of liquid phase deflection is always smaller than that of the gas phase.
As mentioned above, there are more studies on equal gas-liquid ratio distributions in the literature than on equivalent flow distributions. El-Shaboury et al. [12,13] summarized the literature on gas-liquid two-phase shunt characteristics at impact T-tubes and discussed in detail the influence of the inlet gas surface velocity, liquid surface velocity, mass and pressure. A new parameter, the momentum flux ratio, is proposed to explain the shunt behavior of the GLTPF. Mohamed et al. [14] studied the influence of the pipe diameter and system pressure on the GLTPF in an impact T-tube. The experiment showed that the influence of the pipe diameter on the phase distribution is small throughout the whole test range. On the other hand, at a small inlet velocity, the system pressure has a significant effect on the separation of the gas-liquid phase, but this effect decreases with increasing inlet velocity.
Research by Tshuva et al. [15] focused on how air and water distribute in two parallel pipes, exploring various tilt angles from 0° to 90° and observing flow patterns like plug and slug flow. They found that in pipes with an upward incline and low gas-liquid velocities, a distinct asymmetric flow of gas-liquid two-phase occurs, intensifying with the pipe’s incline. This asymmetry leads to gas and liquid predominantly flowing in one pipe, while the other exhibits fluctuating liquid levels, termed as ‘extreme bias current.’ They theorized this using the minimum pressure drop principle. Similar findings were reported by Taitel et al. [16] in their experiments with four inclined pipes. Further, Pustylnik et al. [17] employed pressure drop and stability analyses to understand this behavior. Pustylnik et al. [18] also explored how orifice plates at pipe tops influence flow division, observing a reduction in asymmetric flow with these additions. Notably, these findings on asymmetric flows are based more on experimental observations than on quantitative measurements.
To understand the separation of GLTPF particles from a single pipe to a double riser, Shell Company conducted experimental tests at the Shell Technical Center in Amsterdam [19]. The gas and liquid components are segregated and then quantified independently at the top of the two risers. In all the experiments, the horizontal flow tube was either a stratified flow or a wavy flow with periodic plugs. Churn flow, slug flow and bubble flow were observed in the two risers. At low gas-liquid velocities, a reversal occurs, in which all the gas and liquid phases flow out of one riser (the other is a stationary column of liquid), and after some time, the gas and liquid phases flow out of the other riser. Beekers [20] investigated high gas-liquid velocity scenarios and observed that at sufficiently high velocities, where an annular flow pattern is established in the two risers, the flow rates of both gas and liquid phases tend to be uniformly distributed when passing through the T-junction with an impact design.
To the best of our knowledge, the asymmetric flow in the structure of an impact T-tube with two risers is caused mainly by the different pressure drops and flow states in the two risers. Although the above research results can effectively eliminate the uneven flow distribution phenomenon of a GLTPF in a horizontal pipeline, there is a lack of research on multiphase flow and bias phenomena in pipelines with parallel risers connected to a T-junction. In this paper, an improved GLTPF model based on the principle of minimum potential energy was established, and a split model of the GLTPF was established. Three flow states (slug flow-slug flow (S-S), slug flow-churn flow (S-C) and churn flow-churn flow (C-C)) were observed, and the pressure drop in the parallel riser was measured.
Fig. 1 illustrates the schematic of the GLTPF division experiment setup. Fig. 2 presents a real-life depiction of the laboratory pipeline, mirroring field pipeline structures. This study focuses on the division characteristics and influencing factors of GLTPF within this pipeline configuration. The experimental setup consists of an inlet pipeline leading to a T-junction, followed by two 0.7 m horizontal pipelines, a 90° elbow of 0.3 m length and 0.5 m height, and two 2.3 m tall risers spaced 2.4 m apart. All pipelines have a diameter of 40 mm. The system includes two separators, each with a 300 mm diameter and 3.5 m height. Four mass flow meters at the separators’ outlets measure the separated gas-liquid flows. The experiment varied superficial liquid velocities between 0.03–0.4 m/s and gas velocities from 0.1–5 m/s, using appropriate flowmeters and valves (V2–V4) for gas flow adjustment, valve V5 for liquid flow, valve V8 for pressure regulation in separators, and valves V9 and V10 for liquid level control in separators. Data recording commenced once the liquid level in the separators stabilized.
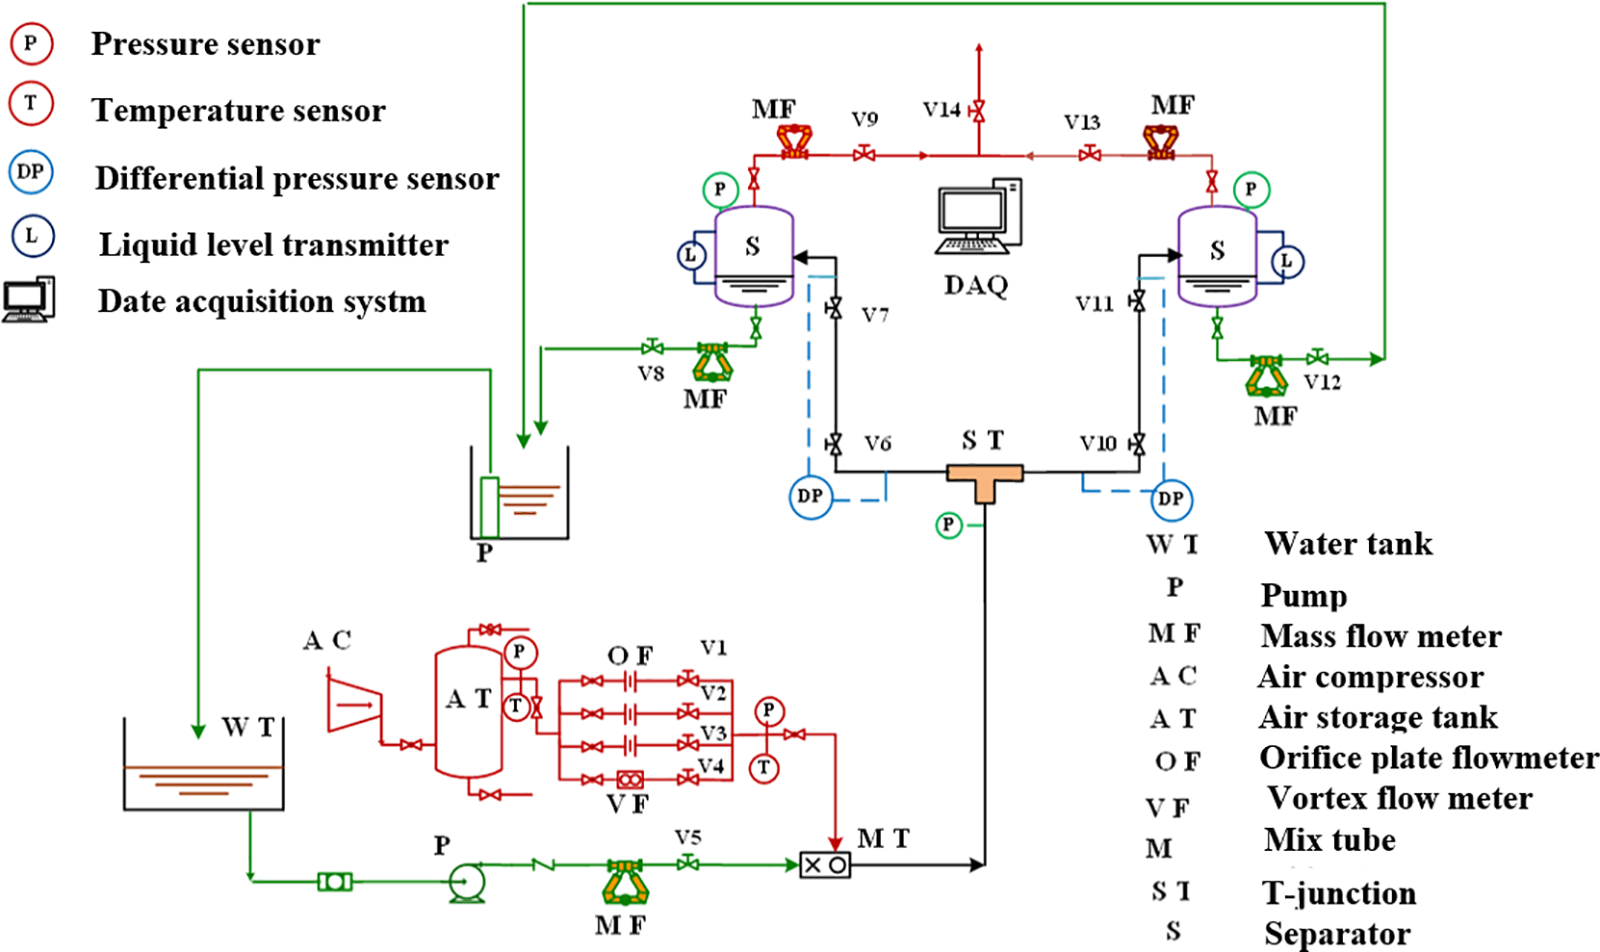
Figure 1: Flow diagram of the GLTPF splitting experimental facility
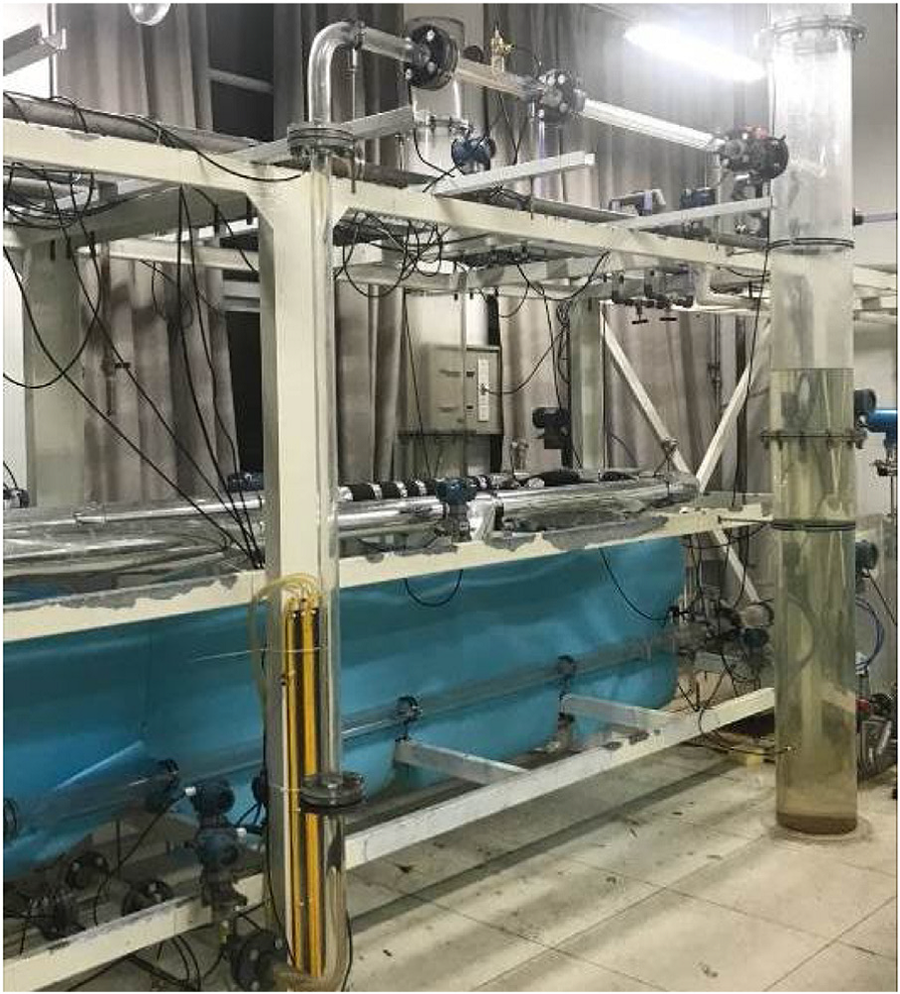
Figure 2: The GLTPF splitting experimental facility in the laboratory
For two-phase flow splitting at the T-junction, the gas-liquid mass flow rate should satisfy the following relationship:
After the branch pipe and two separators were opened, the effect of the gas phase valve on the shunt characteristics of the liquid phase was tested in a horizontal single tube-impact T-tube-parallel riser structure.
During the experiment, a Gopro camera and high-speed camera arrangement technology were used to photograph the gas-liquid flow state in the parallel riser, and relevant analysis was carried out. Three flow states were mainly observed during the experiment, as shown in Fig. 3.
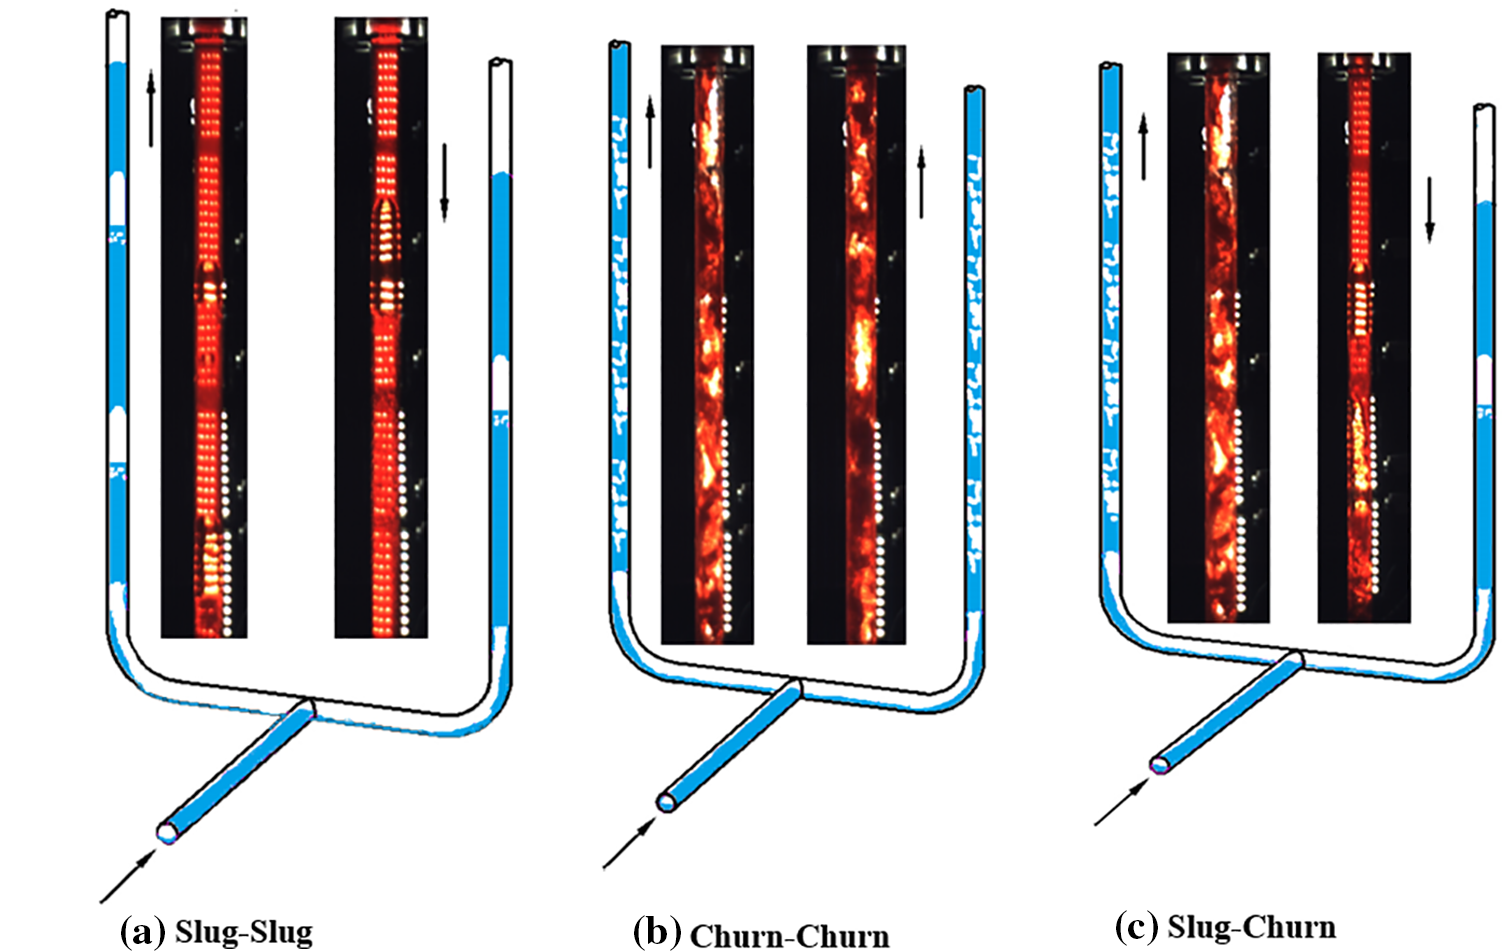
Figure 3: Flow diagram of the gas-liquid two-phase splitting experimental facility
The flow distributions corresponding to the three different flow states also differ, and the GLTPF distribution results under the various flow states in the parallel riser are shown in Fig. 4. The variation curve of the gas-liquid two-phase cumulative flow in the two separators when the flow state in the shunt riser is S-S. As shown in the figure, there is a certain pulsation in the growth of the liquid-phase cumulative flow rate. When the liquid phase flows out of one riser, the liquid phase in the other riser is in a state of cutoff flow, and the liquid phase flow in the two separators is in an alternating state of rise, indicating that the liquid plug in the parallel riser is in an alternating state of outflow. The growth trends of gas flow and liquid flow are the same, and there is also a cross trend. The two different conditions of slug flow depend mainly on the crossing time of the two flow curves. Therefore, over a long time, the GLTPF rate is the same for the two separators, and there is no bias. Fig. 4 shows the shunt results of two-phase flow when the flow state in the shunt riser is C-C. It can be seen that the slope of the gas phase flow cumulative curve and liquid phase flow cumulative curve in the two separators is basically the same, indicating that the GLTPF increment in the two separators is the same within a certain period of time. Therefore, there is no bias phenomenon in two-phase flow under this flow state. Fig. 5 shows the shunt results of S-C in the transition state.The slopes of the gas-liquid flow distribution curves for the two separators exhibit large differences, indicating that the increase in the GLTPF concentration in the separator is not the same. The distribution ratio of the liquid-phase flow is 4, whereas that of the gas-phase flow is 4. Therefore, in this transitional flow state, the GLTPF is in a bias state.
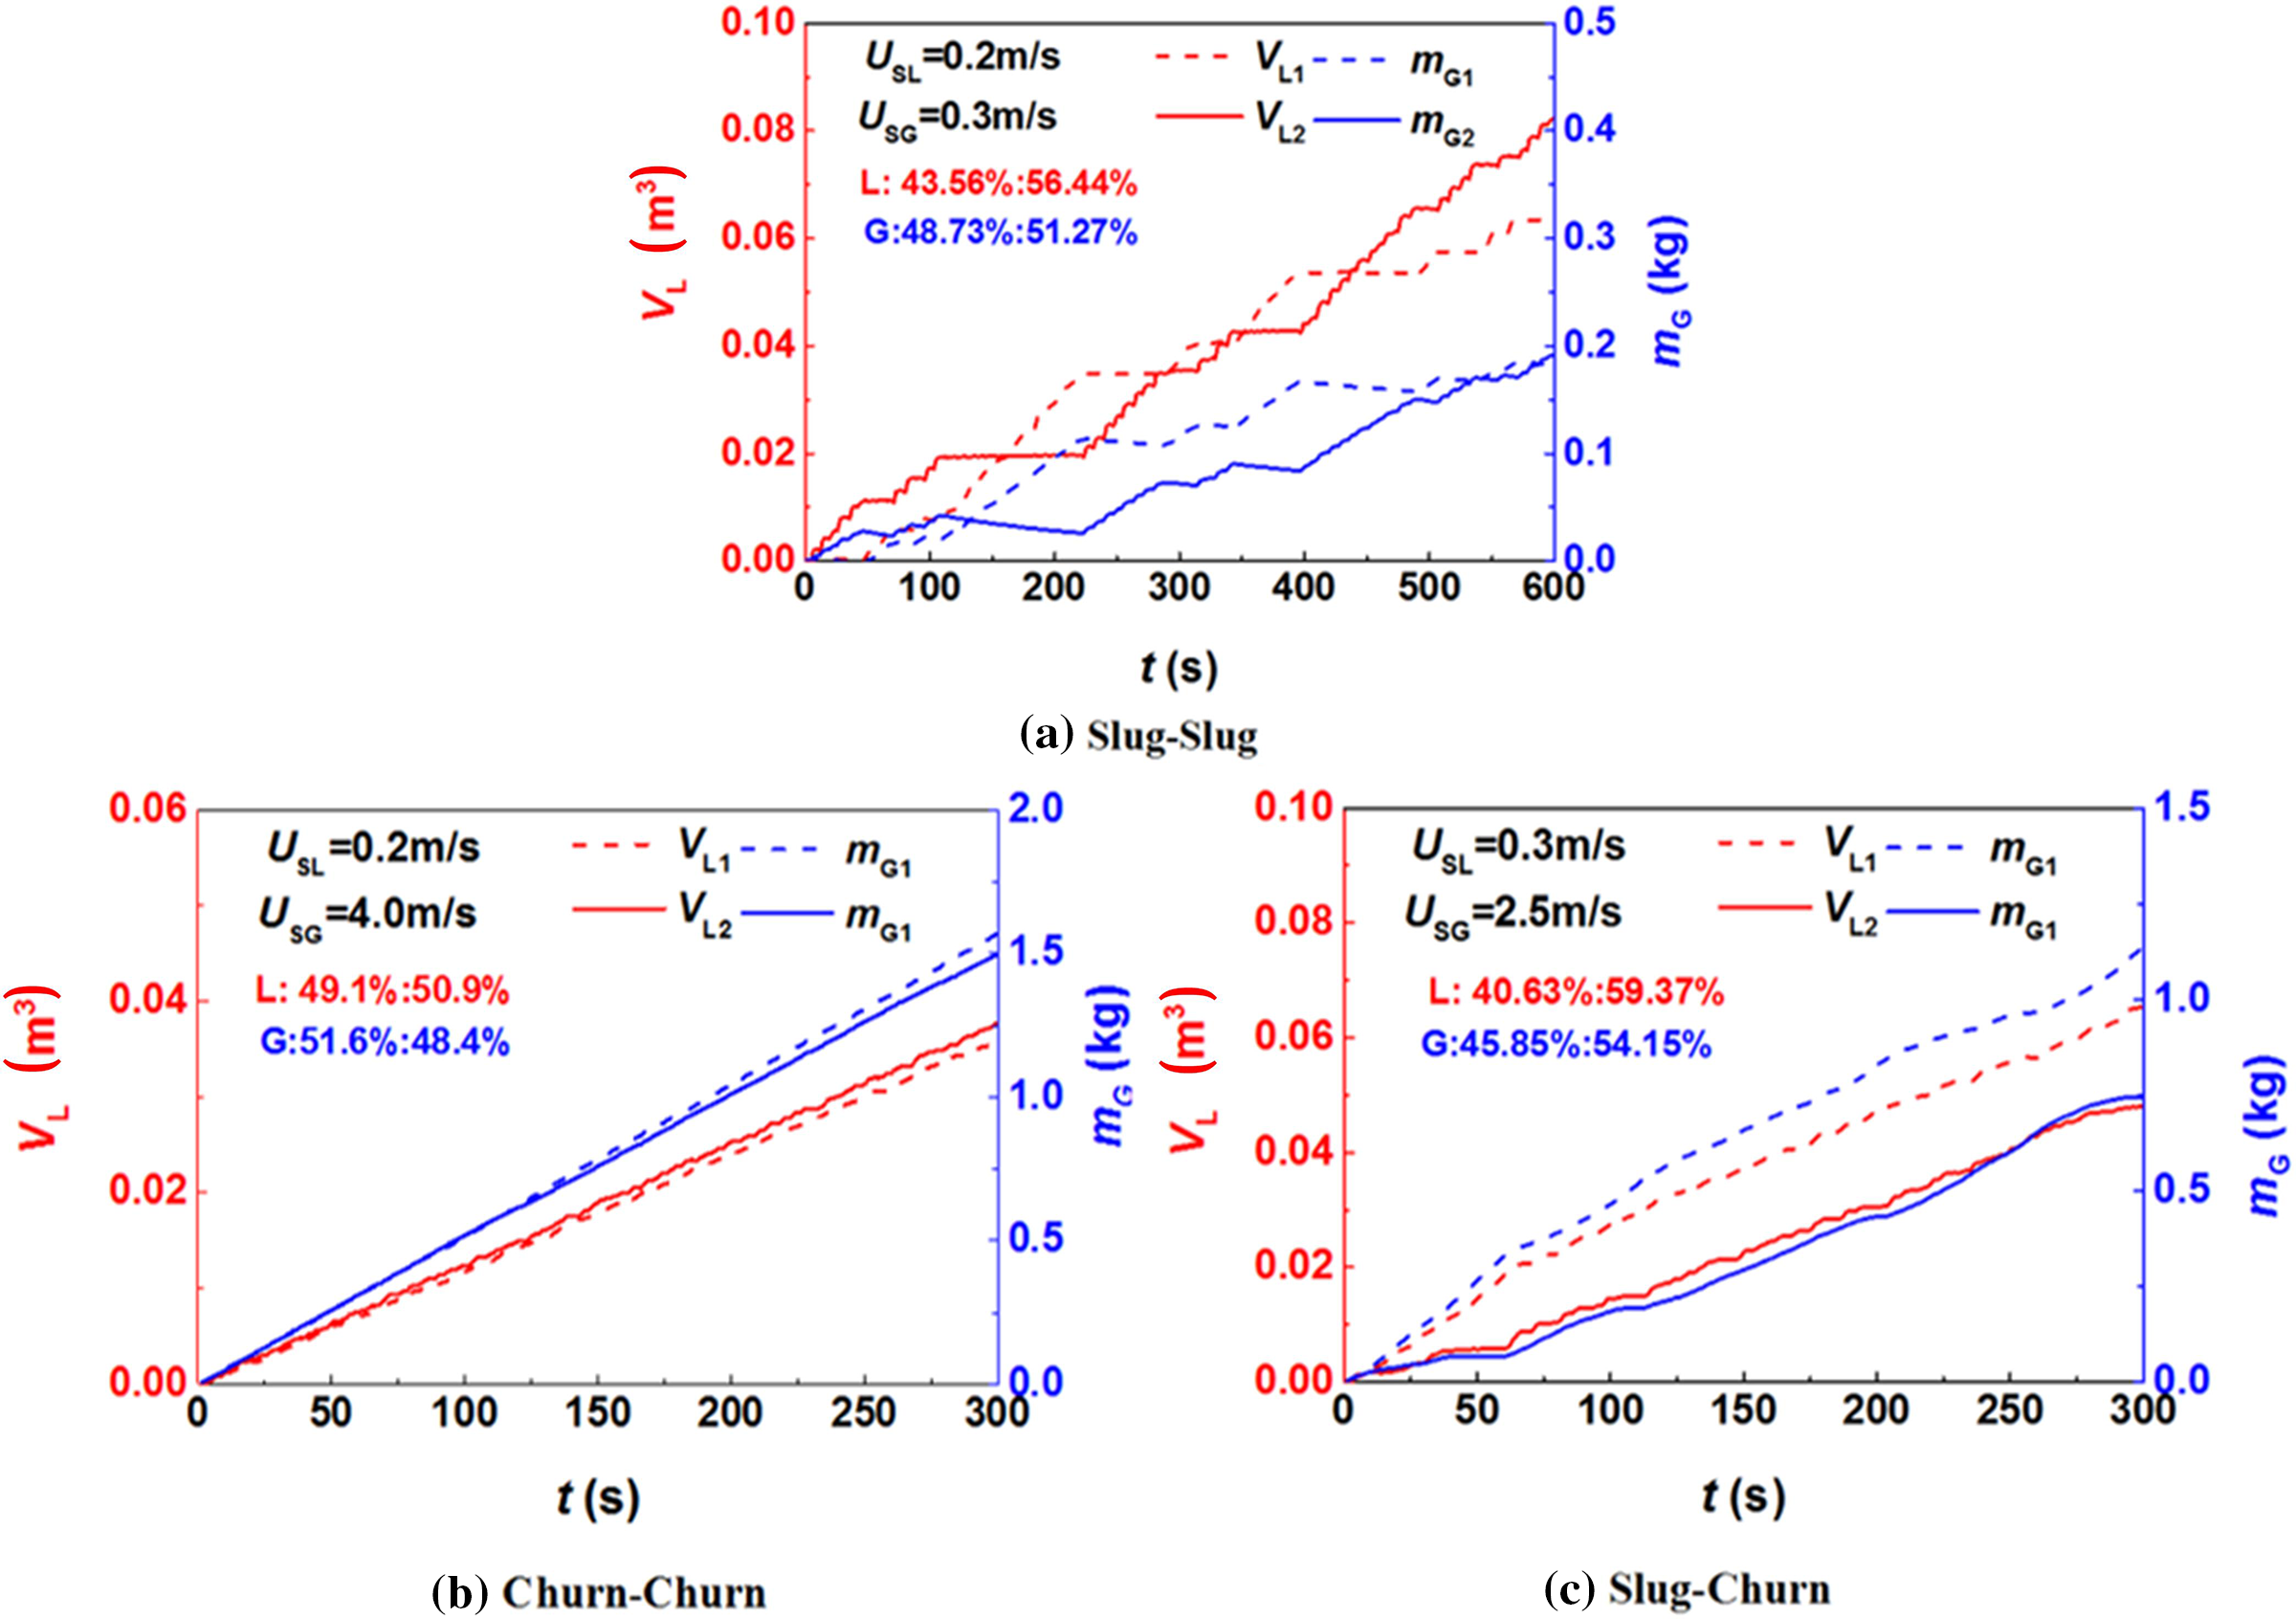
Figure 4: Gas-liquid splitting results
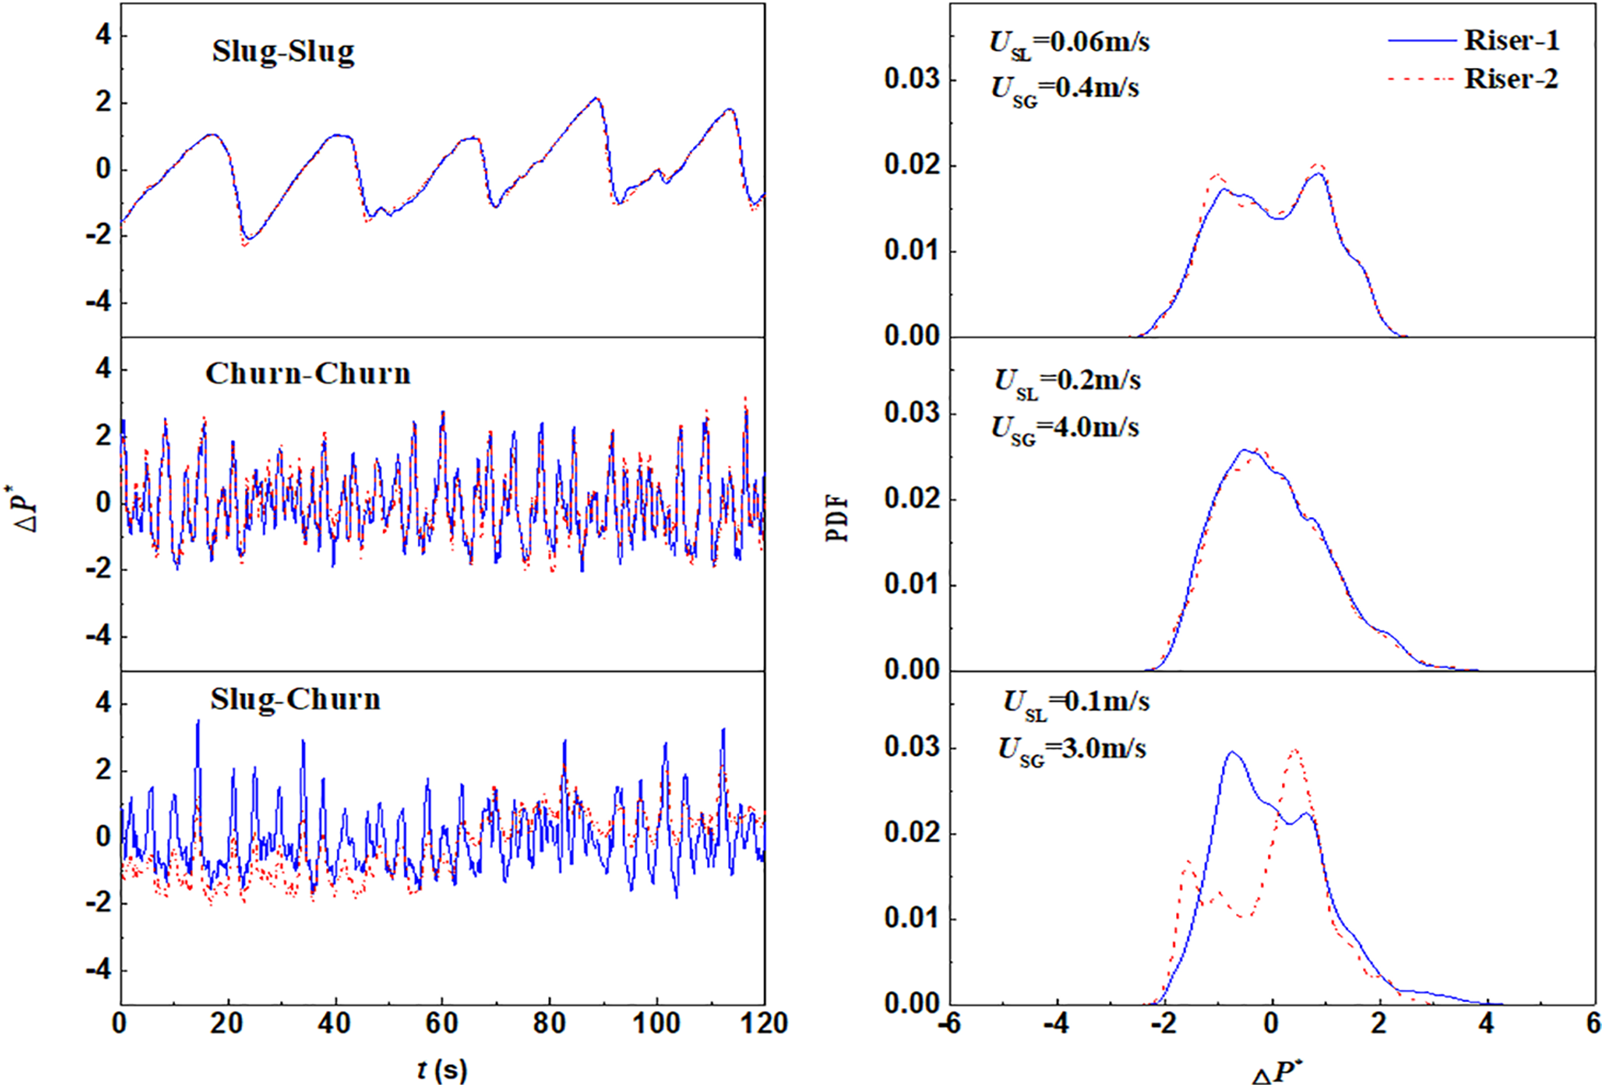
Figure 5: Pressure drop of the dual riser and its PDF
Fig. 5 displays the pressure drop curves and their probability density distributions for the parallel risers. When the risers are in an S-S flow state, both the pressure drop and probability density distribution curves of the gas-liquid phases in the risers exhibit similar patterns, akin to those observed in C-C bonds. This suggests a consistency in pressure drops when the flow pattern in parallel risers is identical. Conversely, in a transitional flow state (S-C), the pressure drop and its probability density curve in the shunt riser show variation. Hence, an asynchronous pressure drop in parallel risers indicates a bias in GLTPF distribution.
Taitel et al. [16] utilized the drift flow model to estimate the pressure drop in branch pipelines, assuming constant physical properties. The model helps explain symmetric and asymmetric flows in two-phase flows within parallel risers by applying the minimum potential energy principle. For accurate pressure drop calculations in these risers, specific assumptions were made, as outlined in their study [21].
A drift flow model is used to calculate the pressure drop in the pipeline caused by the GLTPF. The velocity of long bubbles in the drift flow model UG is calculated by the following formula:
The distributed parameter C is 2 for laminar flow and 1.2 for turbulent flow. US is the mixing velocity of the gas-liquid two phases and is the sum of the apparent velocity USG of the gas phase in the pipeline and the apparent velocity USL of the liquid phase. Its calculation formula is as follows:
The drift velocity UD is the velocity of a long bubble in a static liquid column. The calculation formula is as follows:
where g is the acceleration of gravity, d is the inner diameter of the pipeline, and β is the included angle between the parallel pipeline and the horizontal pipeline. In this study, the parallel pipeline is vertically upward, so β = 90°.
The calculation equation of the section gas content is as follows:
Since acceleration loss is ignored in this study, only friction loss and pressure drop caused by gravity are considered in the calculation of pipeline pressure drop. Therefore, the formula for calculating the pressure drop in the pipeline is as follows:
where f is the friction coefficient, ρ is the mixing density of the gas and liquid phases, and l is the length of the parallel risers. The calculation formula of the friction coefficient is as follows:
In turbulent flow, c = 16 and n = 1, and in laminar flow, c = 0.046 and n = 0.2. The Reynolds number is defined by the traditional methods of the uniform flow model and drift flow model, and its calculation formula is as follows:
The mixing density of the two phases is calculated as follows:
The calculation formula for viscosity is as follows:
(1) Split prediction model:
In this paper, the Woldesemayat model is used to study the GLTPF diversion model, and the calculation formula is as follows:
The formula for calculating the distribution coefficient C0 is as follows:
The calculation formula of the drift velocity UD is as follows:
where
(2) Churn flow prediction model:
Taitel et al. [22] believed that the formation of churn flow is an inlet effect and that as long as the inlet length is sufficient, a stable slug flow will eventually form. The inlet length required to form a stable slug flow is proposed, and its calculation formula is shown as follows:
where UC = 1.2US, US is the sum of the liquid-phase apparent velocity and gas-phase apparent velocity, and UG is the velocity of the long bubble.
The coordinate x in the vertical direction is assumed to change as follows:
where ε is the decay rate and β is not sensitive to the final result; thus, β = LN 100 = 4.6 and LS is the length of the liquid plug when the slug flow is stable.
The velocity difference between the two bubbles can be calculated as follows:
The relationship between the merging time ti of each bubble and the length of the liquid plug in the bubble merging process is calculated:
where li is the length of the liquid plug in the bubble merging process, where i = 0, 1, 2, 3, ..., let li from 0 to ls/4, i.e., li = ls/4, ls/8, ls/16, ..., 0. The infinite series of ti can be obtained, the sum of which is multiplied by UG to estimate the required entry length, as shown below:
The simplified model is as follows:
Fig. 6 shows the comparison between the improved model and the experimental results. It can be seen that the transform boundary of the improved model shifts to the right compared with the original model boundary, which is in high agreement with the experimental results and falls only on the transform boundary of slug flow and churn flow. Therefore, the improved model is more suitable for transform boundary prediction of the flow pattern in a neutral pipe in this study than is the original prediction model.
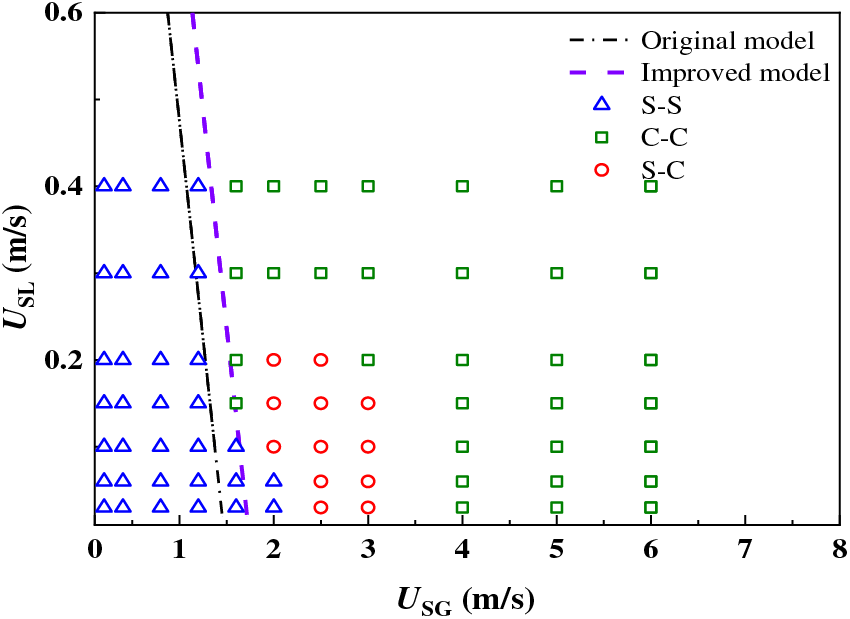
Figure 6: Comparison of the experimental results and the improved model
This research identifies three main flow states in parallel risers: symmetric (S-S), churn (C-C), and transitional (S-C). In high gas-liquid velocities, the C-C state presents, ensuring symmetrical and synchronized flows without deviation. In the S-S state, liquid plugs in risers don’t exit simultaneously, leading to alternating flows that ultimately balance out, showing no deviation. The S-C state, however, is marked by significant deviation, with one riser in churn flow and the other displaying a fluctuating liquid column with minor bubble discharge.
Therefore, this study’s experiments suggest that severe bias in parallel risers is linked to asymmetric flow states, where liquid phases do not discharge simultaneously. Bias also implies one riser exhibiting churn flow. The enhanced bias model proposed includes two components: a split prediction model and a perturbation flow prediction model. The split prediction, based on minimum potential energy principles, forecasts the shunt state in parallel risers. The improved model also predicts the transition boundary between slug and churn flows. The intersection of these predictions delineates the bias prediction region.
A comparison between the experimental results and the improved model is shown in Fig. 7. It shows that the overall prediction effect of the bias current improvement model established in this paper is relatively accurate, but the prediction range of the model is larger than that of the experimental results. A large deviation in the prediction results mainly occurs at the boundary between the slug flow and the churn flow. The reason for this difference may be that the inlet effect model calculates the gas-liquid velocity at the entrance of the two risers when predicting the boundary of the slug flow and the churn flow, ignoring the influence of the pressure drop in the inlet pipe, resulting in a large prediction range of the bias model.
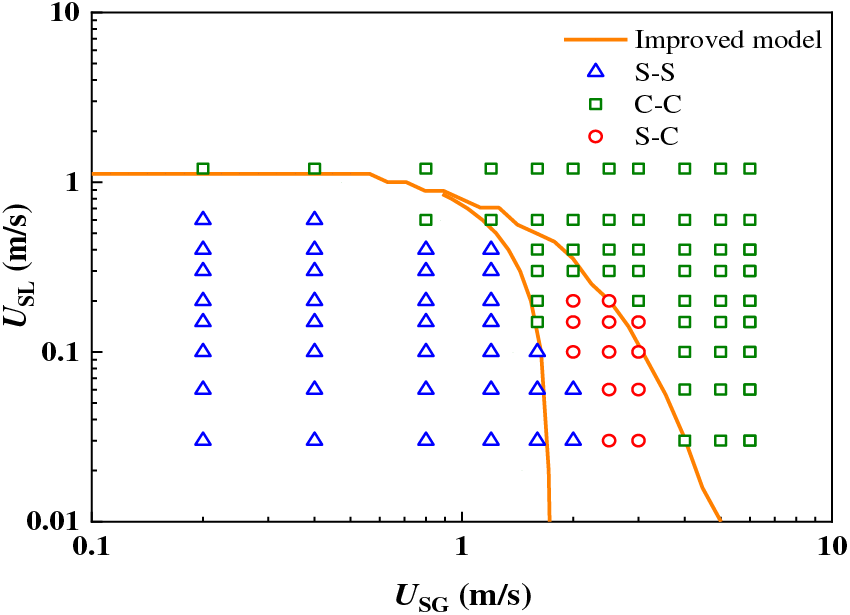
Figure 7: Comparison of the experimental results and model results (flow pattern)
Henkes et al. [19] studied the shunt state of a GLTPF in a parallel riser with an impact T-tube. Three flow states were observed during the experiment, namely, the alternating state, transition state and uniform state. An alternating state occurs when the flow rate of gas and liquid is low, and the two phases alternately flow out of one riser, while the other riser is a stagnant column of liquid. The flow rate in the two risers is the same for a certain period of time. A uniform state occurs when the gas-liquid velocity is high and two risers flow out at the same time. At this time, the valve at the top of one riser is closed and then opened. The gas-liquid phase can still be evenly distributed in the parallel riser without being affected. When two-phase flow generates bias, it occurs mainly in the transition state. At this time, the GLTPF in the parallel riser first flows in a uniform state. However, when the valve at the top of the opposite pipe is adjusted (the valves at the top of a certain riser are all open or closed or open), the GLTPF in the parallel riser cannot be restored to a uniform flow state. At this point, all the flow flows out of one riser, and the other riser is a fluctuating column of liquid.
Fig. 8 shows the experimental results of Henkes et al. and the prediction model used in this paper. It can be seen from the figure that the alternating state observed by Henkes et al. in the case of low gas-liquid velocity occurs in the asymmetric flow region of the predicted model, while the uniform state with high gas-liquid velocity occurs in the symmetrical flow region of the model. The transition region observed by Henkes et al. [19] is in the bias prediction region of the improved model, and the experimental results are in good agreement with the improved model in this paper.
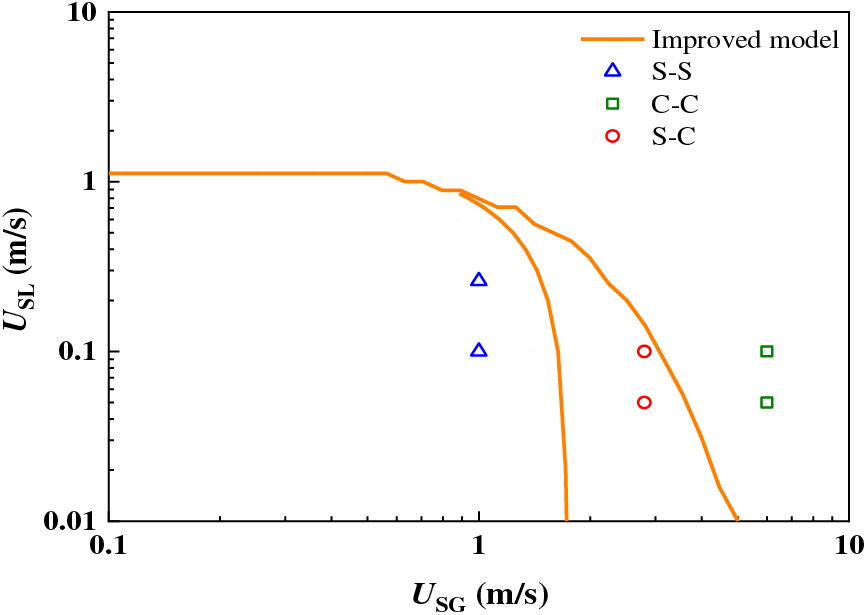
Figure 8: Comparison between the experimental results and model results (flow pattern transition)
In this paper, laboratory experiments were carried out on horizontal single tube-impact T-tube-parallel riser structures. Three flow states were observed, and the pressure drop in the parallel riser was measured. A split prediction model of a GLTPF is established based on the principle of minimum potential energy. The main conclusions are as follows:
(1) S-S and S-C belong to the asymmetric flow state when only one riser in the parallel riser has a liquid phase to flow out. C-C belongs to the symmetrical flow state. The flow of two gas-liquid phases in the parallel riser is synchronized without bias. The S-S situation is asymmetrical, but the liquid plug in the two risers is constantly flowing out alternately, and the gas-liquid flow is the same for a period of time. Only in the asymmetric flow state of S-C does the two-phase flow produce a bias phenomenon, and the gas-liquid two phases tend to flow out from the riser on one side of the churn flow.
(2) The pressure drop curves of the two-phase flow in the parallel riser are basically the same when there is no bias phenomenon, but the pressure drop of the two-phase flow in the parallel riser has a large deviation when there is S-C flow.
(3) The improved model can predict the transition boundary between the asymmetric flow region and the symmetric flow region. Asymmetric flow occurs when the gas-liquid velocity is low. Based on the modification of the inlet effect model, the boundary generated by local churn flow is accurately predicted. Only when the parallel riser is in a state of asymmetric flow and one of the risers produces churn flow will the two-phase flow produce a bias phenomenon.
In future work, we will optimize the pipeline structure based on the established improved model to eliminate the phenomenon of flow deviation caused by the asymmetric flow state of a GLTPF in parallel risers.
Acknowledgement: This work was supported by the Research Project of the Technical Inspection Center of Sinopec Shengli Oilfield Company.
Funding Statement: The authors received no specific funding for this study.
Author Contributions: Study conception: Lihui Ma, Zhuo Han; Experiments: Lihui Ma, Zhuo Han, Wei Li, Xiangran Mi; Numerical simulations: Guangfeng Qi, Ran Cheng; Data collection: Yuanyuan Wang; Analysis and interpretation of results: Xiaohan Zhang; Draft manuscript preparation: Yunfei Li. All the authors reviewed the results and approved the final version of the manuscript.
Availability of Data and Materials: Data will be made available on request.
Conflicts of Interest: The authors declare that they have no conflicts of interest to report regarding the present study.
References
1. Yin, P., Zhang, P., Cao, X., Li, X., Li, Y. et al. (2022). Effect of SDBS surfactant on gas-liquid flow pattern and pressure drop in upward-inclined pipelines. Experimental Thermal and Fluid Science, 130, 110507. https://doi.org/10.1016/j.expthermflusci.2021.110507 [Google Scholar] [CrossRef]
2. Yin, P., Cao, X., Zhang, P., Yang, W., Bian, J. et al. (2020). Investigation of slug flow characteristics in hilly terrain pipeline using ultrasonic Doppler method. Chemical Engineering Science, 211, 115300. https://doi.org/10.1016/j.ces.2019.115300 [Google Scholar] [CrossRef]
3. Zhao, X., Cao, X., Xie, Z., Cao, H., Wu, C. et al. (2022). Numerical study on the particle erosion of elbows mounted in series in the gas-solid flow. Journal of Natural Gas Science and Engineering, 99, 104423. https://doi.org/10.1016/j.jngse.2022.104423 [Google Scholar] [CrossRef]
4. Zang, X., Cao, X., Zhang, J., Xie, Z., Xiong, N. et al. (2022). Investigation of surface damage of ductile materials caused by rotating particles. Wear, 488, 204185. [Google Scholar]
5. Cao, X., Xiong, N., Li, J., Xie, Z., Zang, X. et al. (2022). Experimental study on the erosion of pipelines under different load conditions. Fluid Dynamics & Materials Processing, 18(2), 233–241. https://doi.org/10.32604/fdmp.2022.018505 [Google Scholar] [CrossRef]
6. Ma, L., He, L., Luo, X., Mi, X., Xu, Y. et al. (2020). Experimental investigation of gas-liquid two-phase splitting in parallel pipelines with risers. Chemical Engineering Research and Design, 161, 159–167. https://doi.org/10.1016/j.cherd.2020.07.009 [Google Scholar] [CrossRef]
7. Ma, L., He, L., Luo, X., Mi, X. (2021). Numerical simulation and experimental analysis of the influence of asymmetric pressure conditions on the splitting of a gas-liquid two-phase flow at a T-Junction. Fluid Dynamics & Materials Processing, 17(5), 959–970. https://doi.org/10.32604/fdmp.2021.016710 [Google Scholar] [CrossRef]
8. El-Shaboury, A. M. F., Soliman, H. M., Sims, G. E. (2007). Two-phase flow in a horizontal equal-sided impacting tee junction. International Journal of Multiphase Flow, 33(4), 411–431. https://doi.org/10.1016/j.ijmultiphaseflow.2006.10.002 [Google Scholar] [CrossRef]
9. Alvarez, L. P., Mohan, R. S., Shoham, O., Avila, C. (2010). Multiphase flow splitting in parallel/looped pipelines. SPE Annual Technical Conference and Exhibition, SPE-135723-MS. Florence, Italy. [Google Scholar]
10. Dabirian, R., Thompson, L., Mohan, R., Shonam, O. (2016). Pressure-minimization method for prediction of two-phase-flow splitting. Oil and Gas Facilities, 5(5), 166197. [Google Scholar]
11. Mi, X., He, L., Luo, X., Ma, L., Xu, Y. et al. (2020). Experimental investigation on gas-liquid slug flow from single pipeline to parallel separators. Journal of Petrochemical Universities, 33(5), 59–66. [Google Scholar]
12. El-Shaboury, A. M. F. (2005). Phase distribution and pressure drop of two-phase flows in a horizontal impacting tee Junction (Ph.D. Thesis). University of Manitoba, Canada. [Google Scholar]
13. El-Shaboury, A. M. F., Soliman, H. M., Sims, G. E. (2001). Current state of knowledge on two-phase flow in horizontal impacting TEE junctions. Multiphase Science and Technology, 13(1), 40. [Google Scholar]
14. Mohamed, M. A., Soliman, H. M., Sims, G. E. (2014). Effects of pipe size and system pressure on the phase redistribution in horizontal impacting tee junctions. Experimental Thermal and Fluid Science, 54, 219–224. https://doi.org/10.1016/j.expthermflusci.2013.12.019 [Google Scholar] [CrossRef]
15. Tshuva, M., Barnea, D., Taitel, Y. (1999). Two-phase flow in inclined parallel pipes. International Journal of Multiphase Flow, 25(6–7), 1491–1503. [Google Scholar]
16. Taitel, Y., Pustylnik, L., Tshuva, M., Barnea, D. (2003). Flow distribution of gas and liquid in parallel pipes. International Journal of Multiphase Flow, 29(7), 1193–1202. https://doi.org/10.1016/S0301-9322(03)00067-3 [Google Scholar] [CrossRef]
17. Pustylnik, L., Barnea, D., Taitel, Y. (2006). Prediction of two-phase flow distribution in parallel pipes using stability analysis. AIChE Journal, 52(10), 3345–3552. https://doi.org/10.1002/aic.v52:10 [Google Scholar] [CrossRef]
18. Pustylnik, L., Barnea, D., Taitel, Y. (2010). Adiabatic flow distribution of gas and liquid in parallel pipes—Effect of additional restrictions. Chemical Engineering Science, 65(8), 2552–2557. https://doi.org/10.1016/j.ces.2009.12.032 [Google Scholar] [CrossRef]
19. Henkes, R. A. W. M., Worthen, R. A., Ellepola, J. H. (2015). Lab experiments and simulations for multiphase flow splitting from a single flowline into a dual riser. Abu Dhabi International Petroleum Exhibition and Conference, SPE-177787-MS. Abu Dhabi, UAE. [Google Scholar]
20. Beekers, J. P. A. (2016). An experimental and numerical investigation of multiphase flow splitting at an impacting T junction between a single flowline and two risers (Ph.D. Thesis). Delft University of Technology, Netherlands. [Google Scholar]
21. Jin, G., Zong, Z., Sun, Z., Zou, L., Wang, H. (2022). Analysis of flow-induced vibration characteristics for flexible riser attached with non-rotating water-drop fairing. Ocean Engineering, 262, 112166. https://doi.org/10.1016/j.oceaneng.2022.112166 [Google Scholar] [CrossRef]
22. Taitel, Y., Lee, N., Dukler, A. E. (1978). Transient gas-liquid flow in horizontal pipes: modeling the flow pattern transitions. AIChE Journal, 24(5), 920–934. https://doi.org/10.1002/aic.v24:5 [Google Scholar] [CrossRef]
Cite This Article
 Copyright © 2024 The Author(s). Published by Tech Science Press.
This work is licensed under a Creative Commons Attribution 4.0 International License , which permits unrestricted use, distribution, and reproduction in any medium, provided the original work is properly cited.
 Downloads
 Citation Tools