
 Submit a Paper
 Propose a Special lssue
 Open Access
ARTICLE

An Experimental Study on the Effect of a Nanofluid on Oil-Water Relative Permeability
1 Baikouquan Oil Production Plant, PetroChina Xinjiang Oilfield Company, Karamay, 834000, China
2 Research Institute of Petroleum Exploration Development, PetroChina Liaohe Oilfield, Panjin, 124010, China
3 Petroleum Engineering School, Southwest Petroleum University, Chengdu, 610500, China
4 Oil and Gas Development, Haosheng Xincheng Energy Technology, Ltd. of Sicuan, Chengdu, 610213, China
* Corresponding Author: Yannan Wu. Email:
Fluid Dynamics & Materials Processing 2024, 20(6), 1265-1277. https://doi.org/10.32604/fdmp.2023.044833
Received 09 August 2023; Accepted 18 December 2023; Issue published 27 June 2024
 View Full Text
 Download PDF
Abstract
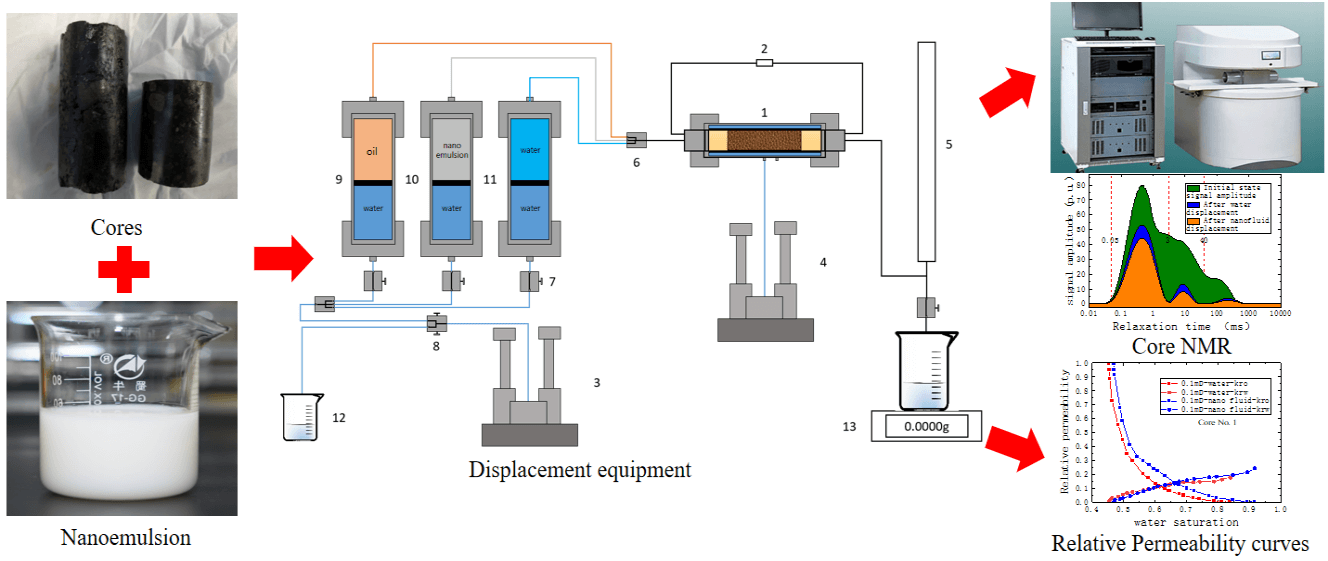
The low porosity and low permeability of tight oil reservoirs call for improvements in the current technologies for oil recovery. Traditional chemical solutions with large molecular size cannot effectively flow through the nano-pores of the reservoir. In this study, the feasibility of Nanofluids has been investigated using a high pressure high temperature core-holder and nuclear magnetic resonance (NMR). The results of the experiments indicate that the specified Nanofluids can enhance the tight oil recovery significantly. The water and oil relative permeability curve shifts to the high water saturation side after Nanofluid flooding, thereby demonstrating an increase in the water wettability of the core. In the Nanofluid flooding process the oil recovery was enhanced by 15.1%, compared to waterflooding stage. The T2 spectra using the NMR show that after Nanofluid flooding, a 7.18% increment in oil recovery factor was gained in the small pores, a 4.9% increase in the middle pores, and a 0.29% increase in the large pores. These results confirm that the Nanofluids can improve the flow state in micro-sized pores inside the core and increase the ultimate oil recovery factor.Graphic Abstract
Keywords
Nomenclature
| fo | Oil ratio when the water saturation of Sw, % (cf. Eq. (1)) |
| kro | Oil phase relative permeability when the water saturation of Sw, % (cf. Eq. (1)) |
| krw | Water phase relative permeability when the water saturation of Sw, % (cf. Eq. (1)) |
| Sw | Water saturation, % (cf. Eq. (1)) |
| μo | Oil phase flow rate, mL/min (cf. Eq. (1)) |
| μw | Water phase flow rate, mL/min (cf. Eq. (1)) |
Since 1987, Mohanty et al. [1–3] have proposed the pore network model, which can ensure that the model has more than one connected pore path in the simulation process, accurately reflecting the flow mechanism of the two-phase fluid in tight oil reservoirs, it can be helpful to study the phase flow behaviors in the tight oil formation in both numerical and experiments. Binshan et al. [4] believed that the mechanism of nanofluid improving oil recovery lies in the adsorption of particles in nanofluids, which changes the effective radius of the pores and consequently alters the flow behavior of oil and water phases. The results indicate the effects of the nanofluid in the tight formation and can be used as guidance for nanofluid injection experiments.
Mona et al. [5] carried out experimental studies on the application of surfactants to reduce the interfacial tension and the critical micelle concentration. Haghighi et al. [6] conducted an experimental study on the interfacial tension and wettability, and the results indicate that with surfactant injection in the tight formation, the contact angle changed from 148.93° to 65.54° and the interfacial tension reduced from 30 to 14 dynes/cm. Thus, the oil recovery factor was enhanced by 19%. Nourinia et al. [7] studied the oil production using nanofluids applied in carbonate reservoirs. The injection of nanofluids results in interfacial tension reduction and alteration of the rock wettability from oil-wet to water-wet, thus, the oil recovery factor can be increased up to 13%. Kharazi et al. [8] conducted experimental studies using different nanofluids to enhance tight oil recovery under different salts and pH. The results indicated that with nanoGSAILs, the rock wettability changed from oil-wet to water-wet, so a higher oil recovery factor can be enhanced, and the nano Gemini ionic liquids are the better choice.
Chen et al. [9] respectively simulated the dynamic flow behavior of oil and water phases using the simulation study approach. They differentiated the wettability of the pore walls of the model and clarified the changes in two-phase flow with different wettability. Their study can be guidance for the pore scale investigation in this study. Zhang et al. [10] used advanced micro-visualization techniques to study the effect of nanoparticles on fluid flow and oil displacement in porous media. They concluded that two different contact lines were observed, including inner and outer contact lines, for the inner contact line was mainly due to the Laplace capillary pressure, for the outer contact line relates to the solid substrate can be negligible. Shi et al. [11] established a digital rock core using the Lattice Boltzmann Method and explained the changes in the flow of oil and water phases when nanofluids act on them from the perspective of particle transport. They predicted the fluid flow behavior in the tight formation. Zhang et al. [10] modified the nanoparticles using coupling agents to reduce the particle size and increase the stability of nanoparticles in the aqueous solutions. The nanofluid flooding process was studied using a physical model, and the influence of different injection conditions on the flow capacity of oil and water phases was studied. They indicated that the modified nanoparticles showed better performance in the oil recovery and gained a higher oil recovery factor.
Huang et al. [12] characterized the distribution of fluids in different pore sizes of tight reservoirs using NMR technology. The transformed T2 spectrum was used to study the recovery rate and flow state of oil in different pores. They concluded that different from spontaneous imbibition, the injection pressure during displacement has a significant impact on the flow state of oil and water. Chai et al. [13] observed through electron microscopy that nanoparticles can form an adsorption layer on the oil-water interface, leading to interfacial tension reduction. The oil phase permeability was increased, so that the water relative permeability was weakened, thereby increasing the recovery rate of crude oil. Li et al. [14] described the effect of nanofluids in reducing interfacial tension and the phase mixing effect that occurs during oil-water flow at low interfacial tension. After nanofluids injection, the oil and water two phase flow in the tight formation changed to oil-water mixed-phase flow. Sarmad et al. [15,16] investigated the influence of silica nanoparticles on the wettability of oil-wet calcite under high-temperature and high-pressure conditions, and summarized the flow behavior after the change in wettability. Cao et al. [17] conducted flowability experiments on different types of nanofluids and demonstrated through experimental results that alkaline nanofluids capable of reducing interfacial tension can improve the flowability of oil and water, ultimately increasing oil recovery. Yang et al. [18] conducted two-phase flow experiments on the one-dimensional core to verify the wetting reversal, emulsification reduction, and interfacial tension reduction effects.
Field production practices and laboratory injection of nanofluids in the MH area of Xinjiang oilfield have shown that the properties of the rock cores change with the injection of nanofluids, thereby affecting the dynamic flow of oil and water phases. During the development of oilfields using nanofluid injection, the influence of nanofluids on the flow behavior of oil and water phases is still not clear. This paper investigates the changes in the flow behavior of oil and water phases after nanofluid injection through the following research work. In the study, the influence of nanofluids on the phase infiltration of oil and water will be carried out, and the pressure reduction and enhanced injection capabilities will be investigated. After nanofluid displacement, the structure of the rock core’s pore channels changes due to the transport and adsorption of nanoparticles, resulting in a reduction in the effective radius of the channels. The oil phase is displaced from the original small pores through imbibition, leading to a weakening of the dynamic flow capacity and an enhancement of the static imbibition capacity.
2 Relative Permeability Calculation
The calculation method for the relative permeability of two-phase fluids in rocks is specified in “GB/T28912-2012” [19], which is commonly referred to as the J.B.N method. The main equation is Eq. (1).
where, kro is oil phase relative permeability when the water saturation of Sw, %; krw is water phase relative permeability when the water saturation of Sw, %; fo is oil ratio when the water saturation of Sw, %; Sw is water saturation, %; μo is oil phase flow rate, mL/min; μw is water phase flow rate, mL/min.
3 Experimental Setup and Experimental Procedure
The setup of the experiments is shown in Fig. 1. In this figure, the setup mainly includes (1) Core holder, diameter of the core is 3.8 cm, length: 5 cm; (2) Displacement pump, pressure range of 0 to 70 MPa, flow rate range of 0 to 20 mL/min; (3) Pressure sensor, pressure range of 0 to 110 MPa, accuracy of 0.01 MPa; (4) Oil-water separator, with a graduation value of 0.01 mL; (5) Balance scale, sensitivity of 0.001 g; (6) Stopwatch, graduation value of 0.01 s; (7) Vernier caliper, graduation value of 0.02 mm [20].

Figure 1: Setup of the experiment (modified from [20]). 1—Core holder; 2—Pressure sensor; 3—Displacement pump; 4—Confining pressure pump; 5—Oil-water separator; 6—Valves; 7—Two path valve; 8—Three path valve; 9—Oil tank; 10—Nanofluid tank; 11—Brine tank; 12—Liquid measure; 13—Balance
3.2 Experimental Fluids and Core Sample
Properties of the experimental core sample are shown in Table 1.
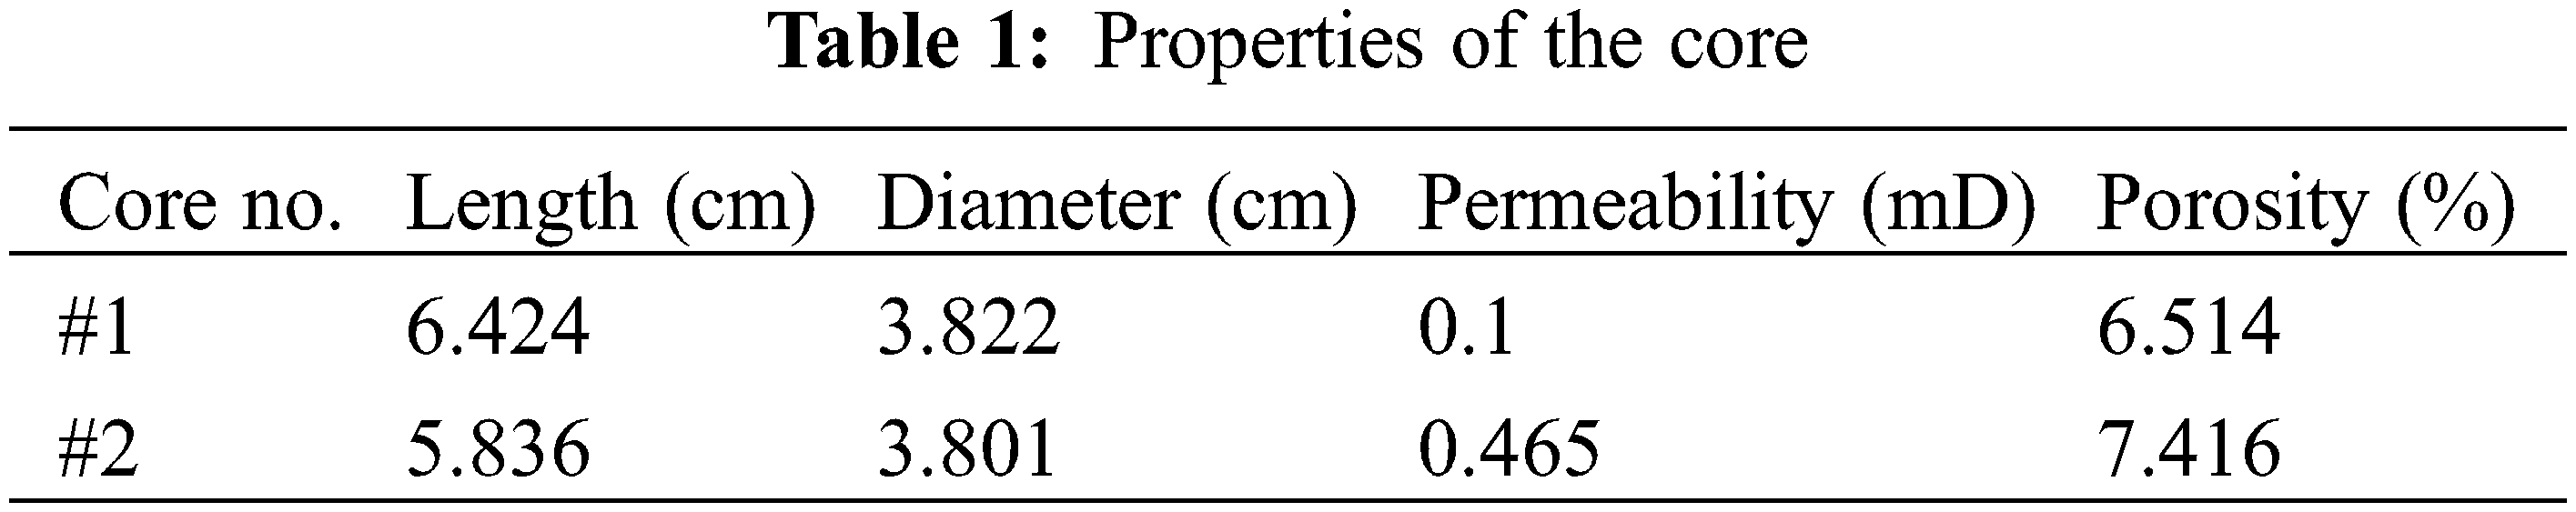
The displacing fluids used in the experiment include water and nanofluid. The nanofluid consists of GPAQ-1 provided by the JBT company. The properties are as follows: The size of individual droplets ranges from 10 to 30 nm, and the average micelle diameter in a 0.2 vol.% nanofluid is 60 nm. After 3 h of interaction with oil-wet rock, the wetting behavior of the 0.2 vol.% nanofluid reverses. The interfacial tension of the nanofluid remains stable when the salinity is less than 100 mg/L. The concentration of the displacing fluid in the phase permeability test is 0.2 vol.%.
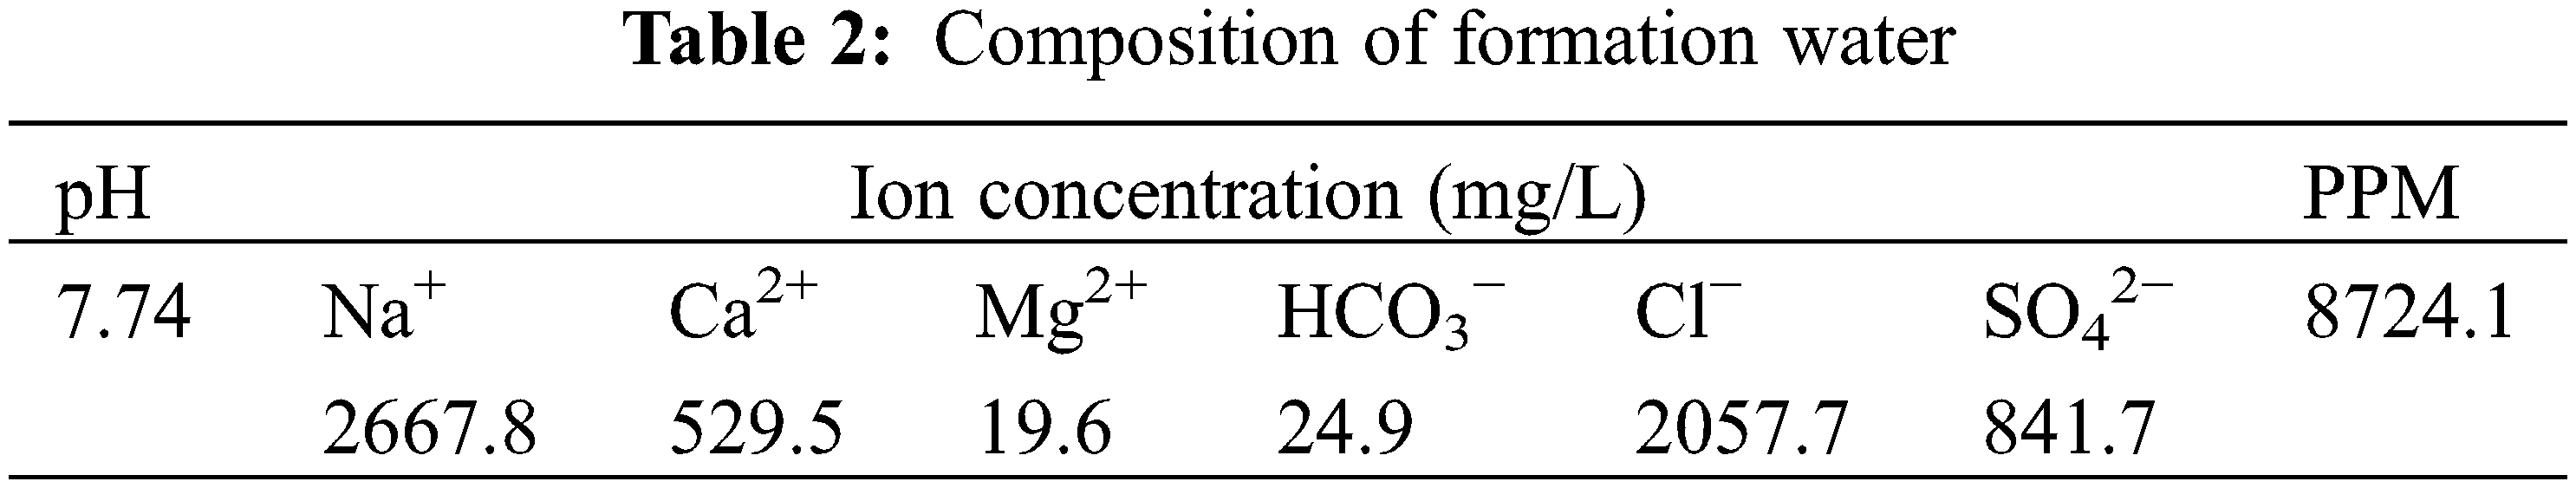
The displacing aqueous phase used in the experiment is the formation water from the M18 block of Xinjiang Oilfield. The ion composition analysis results are shown in Table 2. Based on the ion composition in Table 2, deionized water was mixed with NaCl 959.5 mg/L, CaCl2 529.5 mg/L, MgCl2 19.6 mg/L, NaHCO3 24.9 mg/L, and Na2SO4 841.7 mg/L to obtain experimental water with ion concentrations similar to the formation water.
The oil used in the experiment is the degassed light crude oil from M18 area of Xinjiang Oilfield, with a density of 0.829 g/cm3, viscosity of 5.65 mPa·s, and wax content of 7.53%.
Nanofluid was applied in the M18 well area of Xinjiang Oilfield and achieved pressure reduction and enhanced oil recovery. In order to elucidate its action mechanism, the oil-water seepage of the saturated formation oil-water core was measured, followed by displacement with the nanofluid. This allows the nanofluid to act fully on the pore channels inside the core. The core was then saturated with formation oil-water distribution. Subsequently, a phase permeability experiment of water displacement on the Nano-fluid-treated core was conducted.
3.3.1 Measurement of Relative Permeability Curve
The specific experimental procedure of measurement of relative-permeability cure are as follows [21,22]:
(1) Weigh the dry weight of the core after drying. Vacuum and saturate the core immersed in formation water for 1 day, and saturate the transfer cylinder submerged in formation water at 20 MPa for 2 days. Weigh the wet weight to determine the porosity and pore volume.
(2) After connecting the apparatus, apply a pressure of 10 MPa and check for any pressure leakage points in the displacement system. Insert the core into the core holder.
(3) Inject nanofluid, formation water, and oil into three transfer cylinders respectively, connect them to the displacement system, and keep the valves at both ends closed. Set the confining pressure to a pressure tracking mode consistently higher than the displacement pressure and keep it constant for 1 day at room temperature.
(4) Inject oil and optimize the pressure differential and displacement rate by increasing the pressure difference between the inlet and outlet of the core holder until the water production rate at the outlet is below 0.5% per minute. Record the cumulative water production throughout the process and calculate the unflooded water saturation of the core.
(5) Age the core saturated with oil at a temperature of 20°C and a pressure of 25 MPa for 2 days to allow sufficient contact between the oil-water phases and the pore wall of the core sample, simulating the wettability of the rock under reservoir conditions.
(6) Displace the core with formation water at a constant rate and record the water displacement rate at the outlet of the core, cumulative liquid production, cumulative oil production, water production time, and the pressure difference between the inlet and outlet of the core during the displacement.
(7) In the early stage of water production, when the oil production rate varies significantly, record more frequently (every 5, 10, 15, 20, and 30 s). As the oil production variation decreases, gradually increase the time intervals between recordings (every 3, 5, 10, 20, and 30 min). When the water production rate at the outlet of the core holder exceeds 99.5%, stop the experiment and calculate the water phase permeability at residual oil saturation based on flow rate and basic core data.
(8) Replace the formation water with nanofluid, displace the core under a constant pressure scheme, allow the nanofluid to fully interact and equilibrate within the core, and repeat steps (6) to (7) to complete the experiment on the changes in oil-water distribution inside the core after nanofluid displacement.
(1) The preparation process is the same as described in the displacement experiment section. Before starting the experiment, the T2 signal of the core is recorded using NMR.
(2) The core is displaced using the nanofluid containing manganese chloride. The experiment is terminated when the water production rate exceeds 98% within one hour. After the displacement is complete, the core is removed from the holder, and the signal status inside the core is recorded using NMR.
(3) A control experiment is conducted by replacing the nanofluid containing manganese chloride with formation water containing manganese chloride, as used in step 2, and repeating the experiment.
4 Nanofluid Displacement Experiment
Based on the determination of oil-water relative permeability in the oil-water two-phase seepage in the M18 area of Xinjiang Oilfield. The key to obtain the oil-water relative permeability curve lies in the accurate application of standardized procedures during the displacement experiment, correction and calculation of the fixed volume inside the tubing and core holder, and the use of appropriate equations. Sequentially, one should correct the fixed volume inside the displacement system (see 3.3.1 of this paper for specific steps), and then compare and describe the dynamic seepage states of the two phases before and after nanofluid displacement.
According to the Chinese national standard GB/T 28912-2012, the non-steady-state method of oil-water relative permeability is based on the Buckley-Leverett one-dimensional theory of waterflooding at the front of oil displacement. During waterflooding, the distribution of oil-water saturation inside the porous medium changes with time, which is referred to as the unsteady process. Under simulated conditions, constant pressure difference or constant rate waterflooding experiments are conducted on rock samples, and the production of each fluid and the pressure difference between the two ends of the rock sample are recorded over time.
4.2 Characteristics of Nanofluid Displacement
The constant flow non-steady-state method is used to conduct the oil-water seepage experiment. Due to the heterogeneity of the internal structure of the rock sample, the pressure changes continuously during the displacement process [18]. The nanofluid is injected into the rock sample, and its pressure changes are recorded. After displacing 3 PV with the nanofluid, the waterflooding resumes until the pressure stabilizes again. The trend of pressure changes is shown in Figs. 2 and 3.
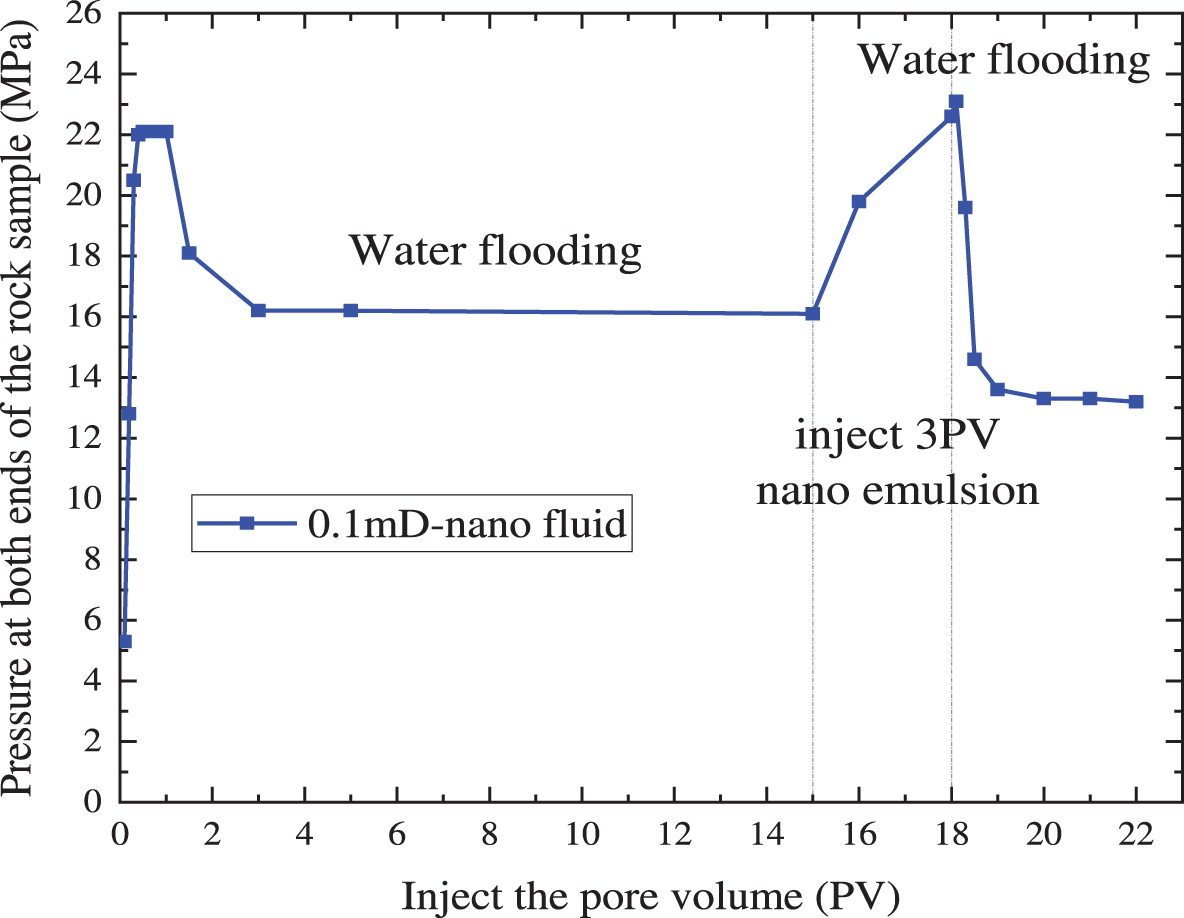
Figure 2: Pressure changes with nanofluid displacement with 0.1 mD core
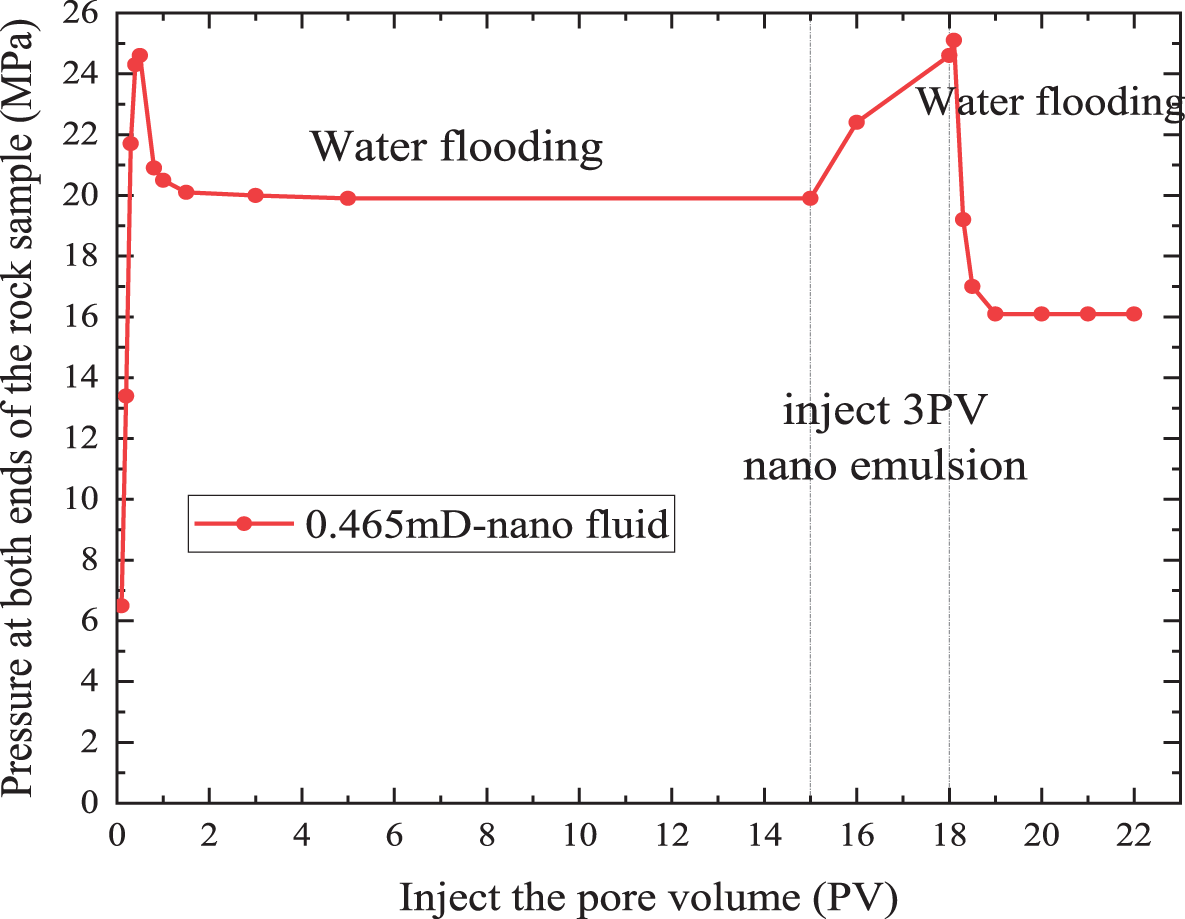
Figure 3: Pressure changes with nanofluid displacement with 0.465 mD core
The following can be investigated from the displacement pressure trend charts. (1) In the initial stage of the waterflooding process, the pressure rapidly increases as the water phase gradually enters the rock core and displaces the oil phase [23]. (2) As the water reaches the end of the rock sample and the produced fluid becomes a two-phase mixture of oil and water, the pressure reaches its maximum during water flooding. (3) As the proportion of water in the produced fluid gradually increases, the displacement pressure gradually decreases to a stable stage. (4) After injecting 0.2 vol.% nanofluid, the displacement pressure increases again. (5) The particles in the nanofluid cause a transient high pressure during the initial stage of waterflooding by pore blockage, but as the blocked pores are cleared, the pressure gradually decreases and stabilizes [24]. The subsequent waterflooding pressure is lower than the waterflooding pressure without nanofluid, indicating that the 0.2 vol.% nanofluid indeed has a pressure reduction and enhanced oil recovery effect.
4.3 Analysis of Relative Permeability Curves
This experiment tested the variation of oil-water relative permeability before and after nanofluid displacement, as shown in Figs. 4 and 5. From the graphs, it can be seen that before and after the displacement with 0.2 vol.% nanofluid, the oil-water relative permeability curves exhibit significant changes due to the variation of the rock sample’s internal properties. Overall, after the displacement with 0.2 vol.% nanofluid, both the oil phase and water phase relative permeabilities have increased, indicating that during the nanofluid displacement process, nanofluid molecules adhere to the pore walls of the rock sample, forming an adsorption layer. The formed adsorption layer is smoother than the original pore wall, resulting in lower flow resistance and enhanced oil phase permeability, as manifested by an increase in the oil phase relative permeability and an upward shift of the oil phase relative permeability curve. As the adsorption layer of the nanofluid continues to thicken, it increases the flow resistance of the nanofluid in the rock core’s pores, causing the nanofluid to flow through the rock core wall more slowly and increasing the contact time with the rock core wall [25]. With the injection of nanofluid, the wettability of the rock core is gradually altered, and the equal saturation point of the relative permeability curve moves upward and to the right. After nanofluid displacement, waterflooding is conducted, and the displacing water phase carries the nanoparticles adsorbed on the pore walls to the outlet, resulting in a period of low water phase permeability. The starting position of the water phase relative permeability curve shifts to the left [26]. As the nanoparticles are flushed out, the temporarily reduced water phase permeability is restored, and the water phase relative permeability curve rises.
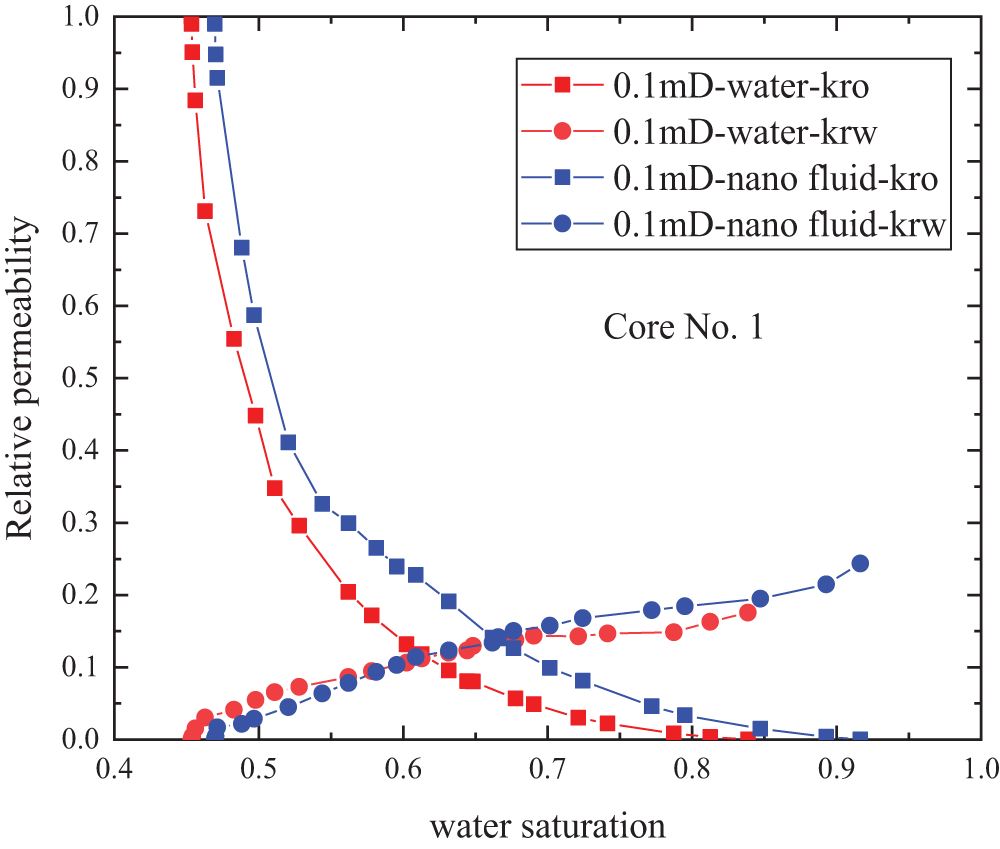
Figure 4: Changing of relative permeability curve of 0.1 mD core
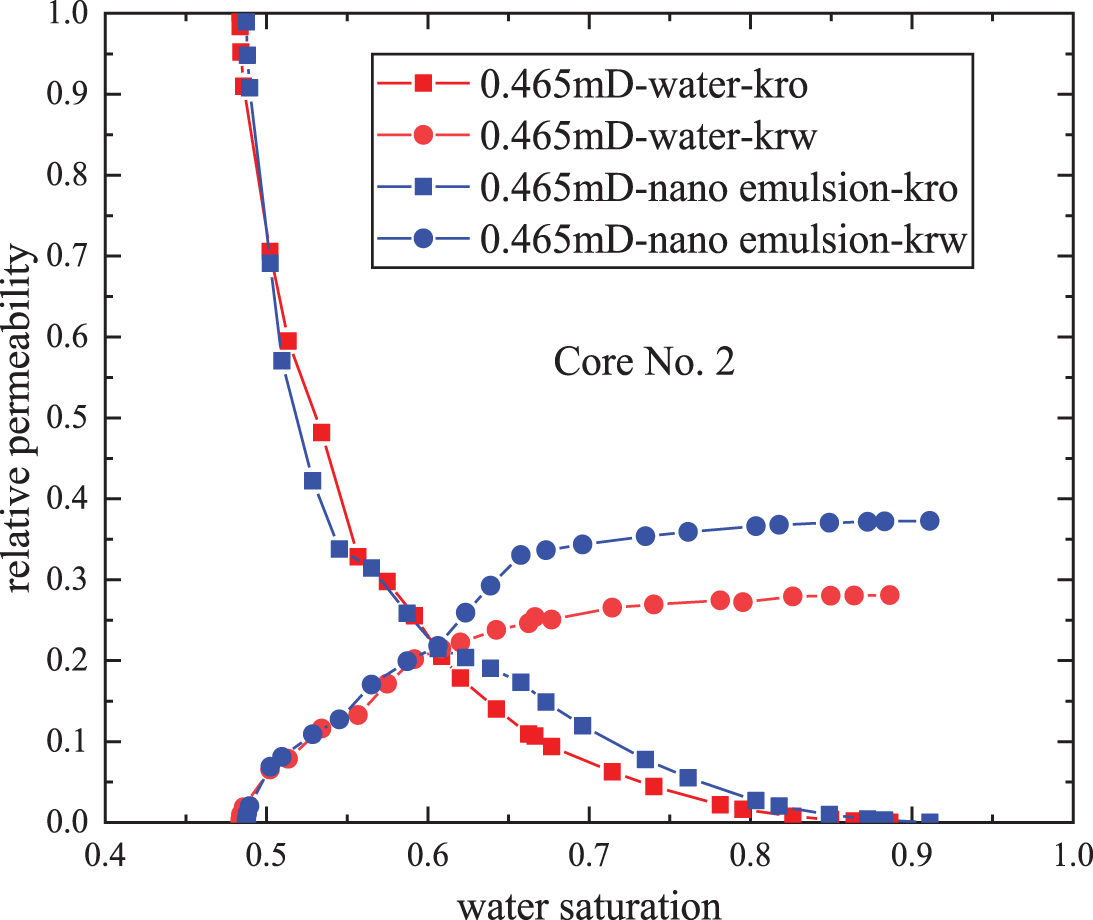
Figure 5: Changing of relative permeability curve of 0.465 mD core
Due to the small size of nanofluid particles, the particles can enter smaller pores and have a stronger ability to carry residual oil inside small pores, enabling the displacement of initially hard-to-produce crude oil. This reduces the residual oil saturation and increases the degree of oil recovery. By comparing Figs. 6 and 7, it can be observed that the increase in irreducible water saturation after displacement ranges from 0.4% to 3.6%, with an average increase of 1.7%. The decrease in residual oil saturation ranges from 18.3% to 47.9%, with an average decrease of 37.5%. The increase in oil recovery ranges from 5.2% to 22.9%, with an average increase of 15.1%.
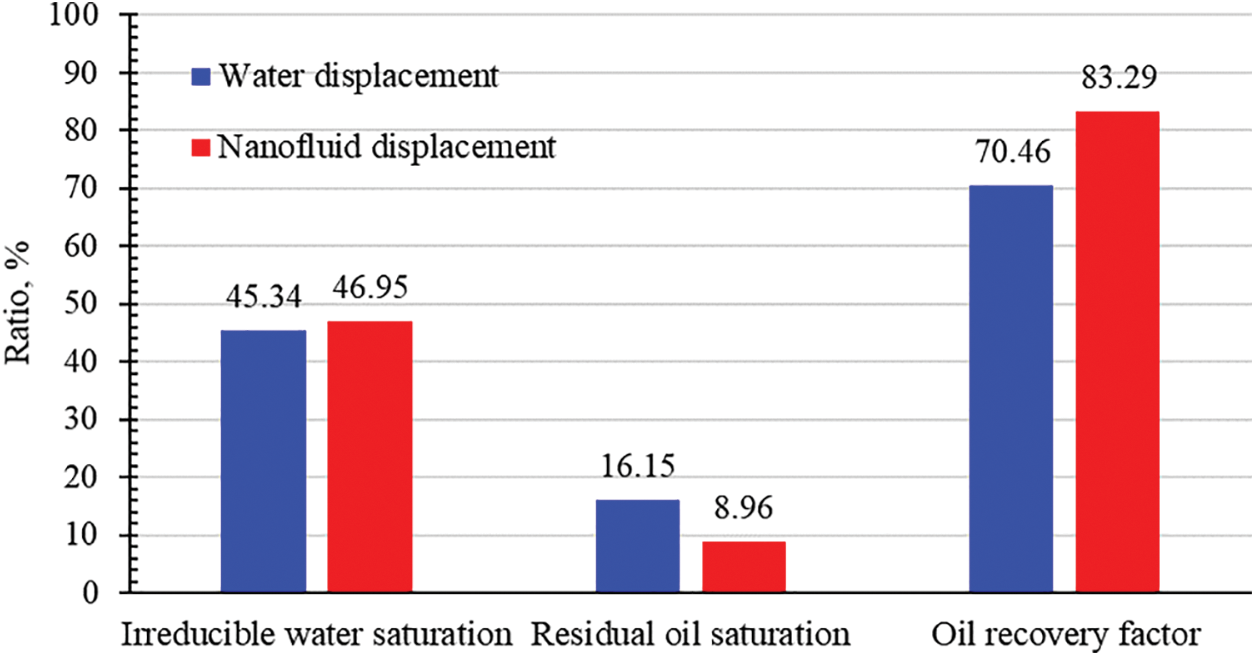
Figure 6: The comparison of water/nanofluid displacement for core #1
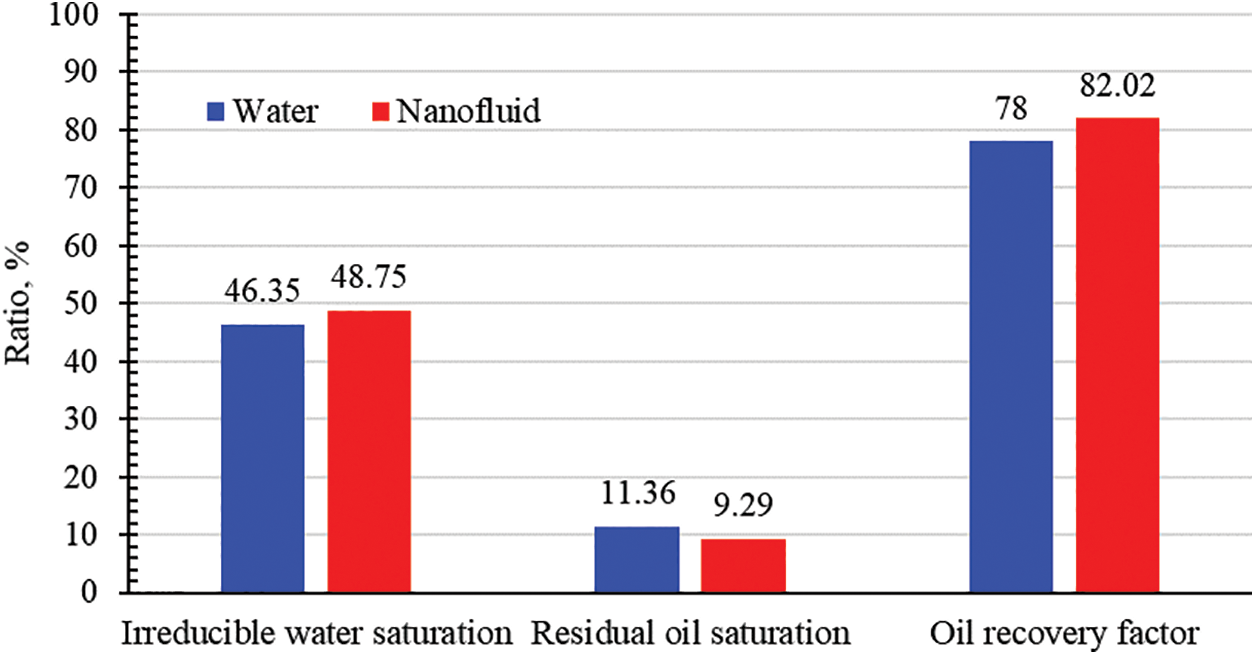
Figure 7: The comparison of water/nanofluid displacement for core #2
5 Nuclear Magnetic Resonance Study of Core
Nanofluids can alter the wettability of the core, causing oil droplets attached to the pore walls to detach and increase the effective flow space. The impact of nanofluids on pore structure is studied using nuclear magnetic resonance (NMR) technology. The working principle is as follows: in the T2 spectrum, which is dominated by surface relaxation, the transverse relaxation time is used to determine the pore size of the rock sample. A longer transverse relaxation time indicates larger pore diameters. The signal intensity obtained reflects the quantity of hydrogen protons, with a larger quantity representing a greater volume of fluid inside the pores. In the T2 spectrum curve, each peak represents the signal of hydrogen protons within a certain range of pore sizes, and the peak area represents the fluid content detected, as well as the proportion occupied by pores within that range. To distinguish between oil and water signals, this experiment employs a method that shields the hydrogen signal in water. A solid compound, manganese chloride, which is soluble in water but not in oil, is added to the nanofluid and formation water at a concentration of 50 g/L. As a result, all the detected signals in the NMR represent hydrogen protons in the oil phase.
The instrument used for NMR measurements in this paper is the Macro MR12-150H-I. The instrument parameters are as follows: the coil probe diameter is 125 mm, the resonance frequency is 12.54 MHz, the magnetic field strength is 0.35 T, and the temperature of the magnet is 32°C.
5.2 Characteristics of Nanofluid Displacement
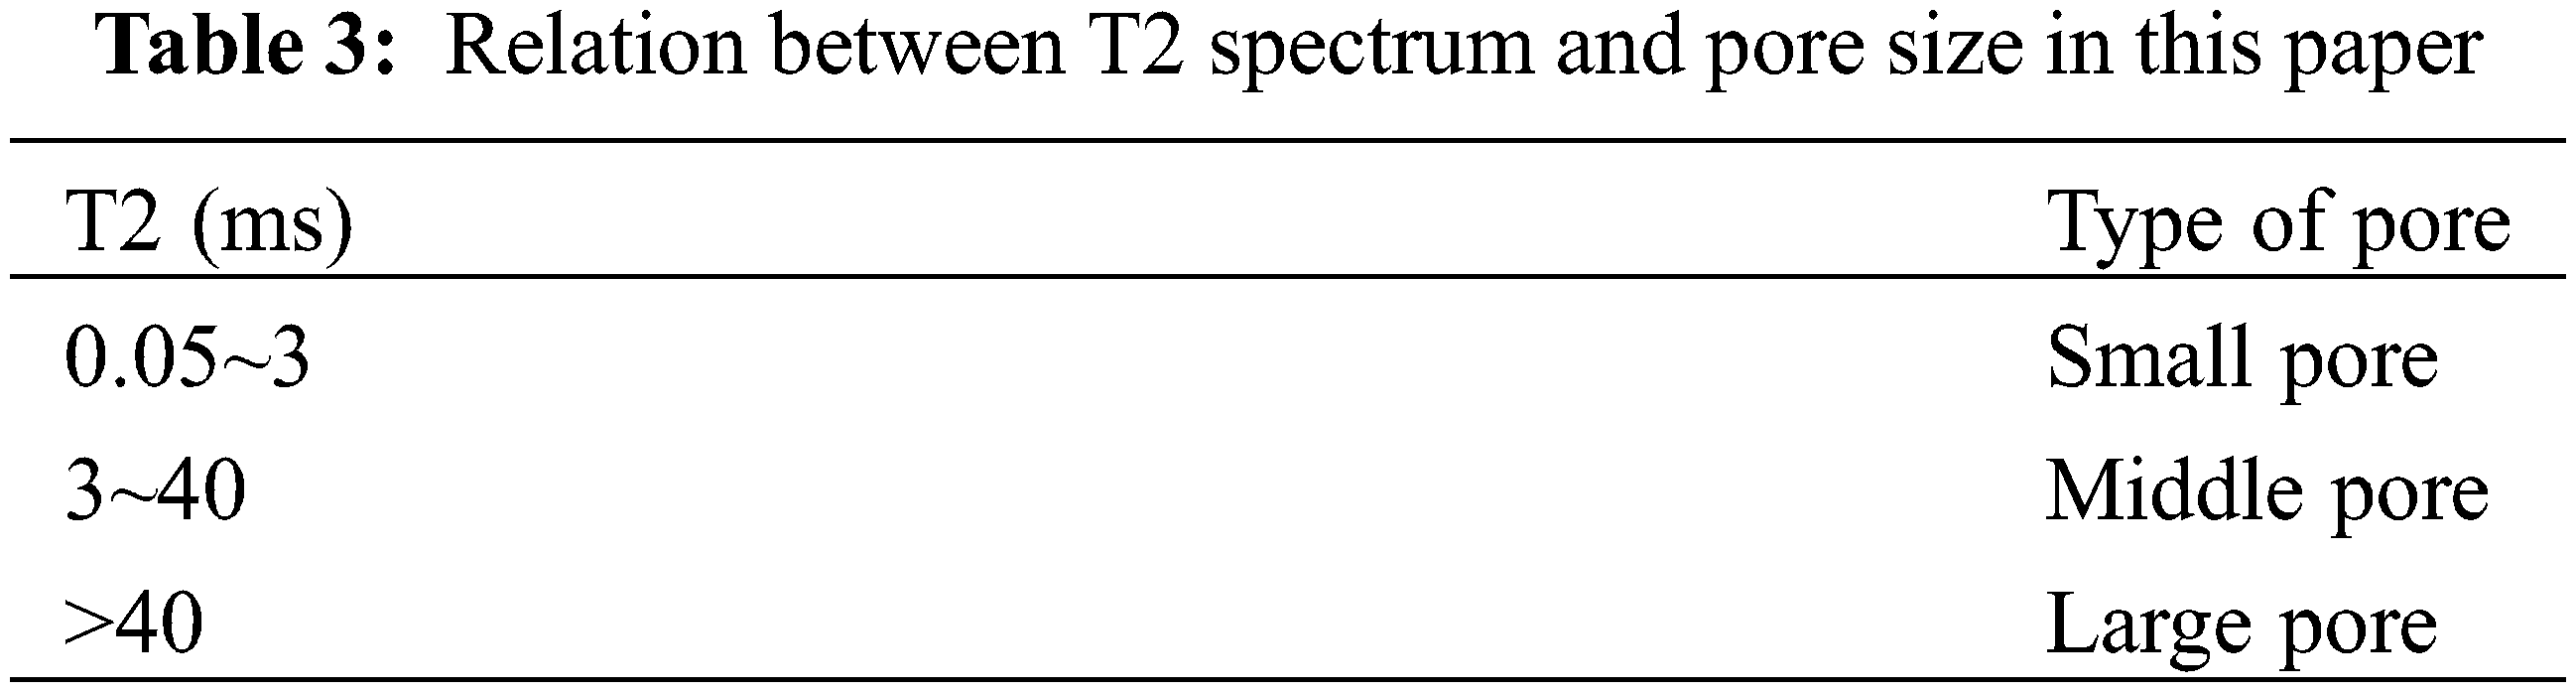
The core was used in the NMR test id core #2. During the experiment, the formation water contained a solution of 50 g/L manganese chloride, which shields the hydrogen signal in water. Therefore, the measured T2 spectrum data represents the signal of oil within different-scale pores in the core, reflecting the changes in oil distribution before and after displacement. According to previous studies, the relaxation time in the T2 spectrum is positively correlated with the pore size of the core. Based on the actual experimental data, the T2 spectrum of the core is divided into three intervals corresponding to different pore size ranges, as shown in Table 3.
The tight rock and gravel rock exhibit a multi-scale distribution characteristic, with different pore sizes [7,27]. Fig. 8 shows a comparison of the T2 spectra before and after water/nanofluid displacement of the core samples. From the graph, it can be observed that the relaxation times are distributed from 0.01 to 2000 ms. At the initial moment, the T2 spectrum exhibits three peaks. The left peak is in the range of 0.05 to 3 ms, while the middle and right peaks are not clearly distinguishable in the initial moment and fall within the range of 3 to 2000 ms. After the water and nanofluid displacement, the three peaks become distinguishable. The left peak is in the range of 0.05 to 3 ms, the middle peak is in the range of 3 to 40 ms, and the right peak is above 40 ms. Based on the changes in the area in the T2 spectrum before and after displacement, the oil recovery rate in the small pores after waterflooding is 58.23% (representing the degree of oil recovery within the small pores, not the total pore volume recovery). The oil recovery rate in the middle pores is 86.98%, and in the large pores, it is 65.12%. After nanofluid displacement, the oil recovery rate in the small pores is 65.41%, indicating an increase in oil recovery degree of 7.18% compared to waterflooding. The oil recovery rate in the middle pores is 91.88%, indicating an increase of 4.90% compared to waterflooding. The oil recovery rate in the large pores is 65.41%, indicating an increase of 0.29% compared to waterflooding, as shown in Fig. 9.
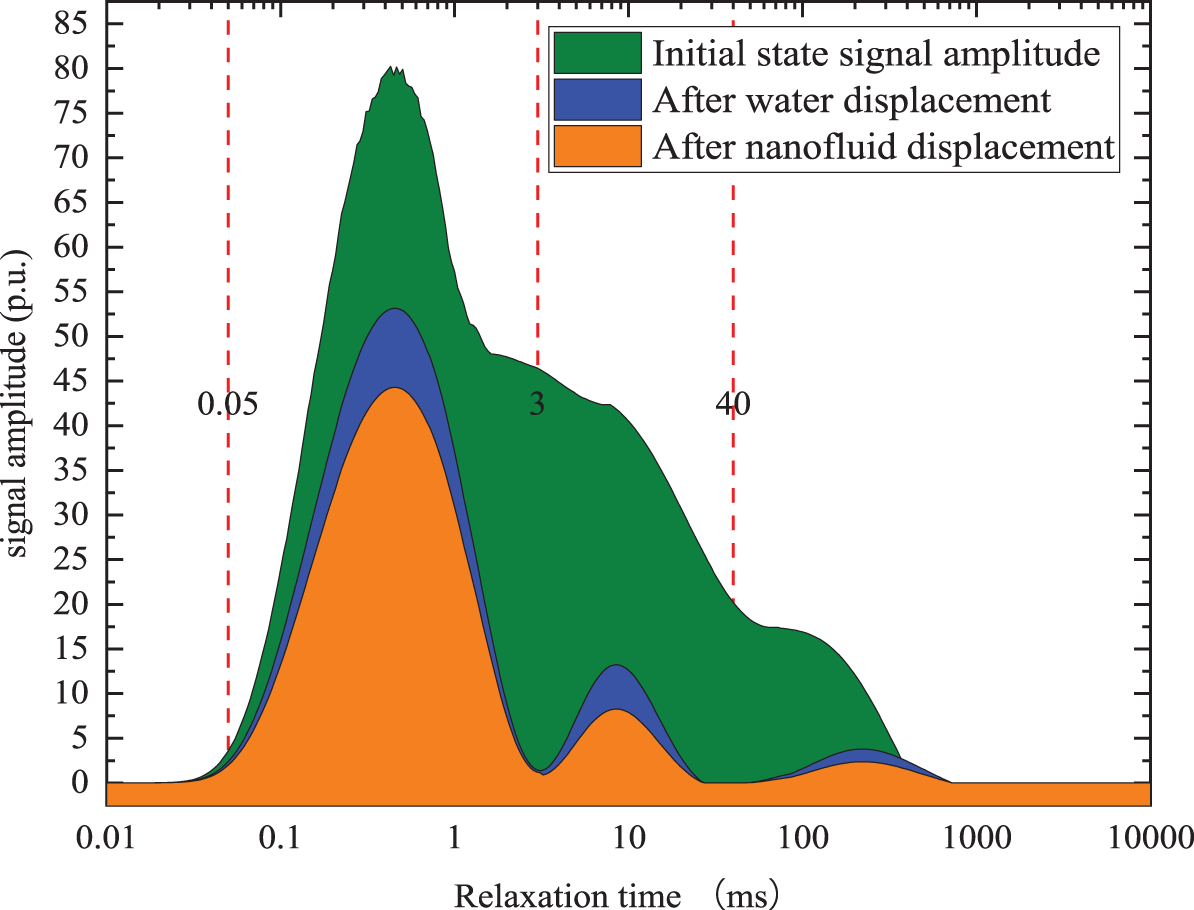
Figure 8: T2 spectra before and after water/nanofluid displacement
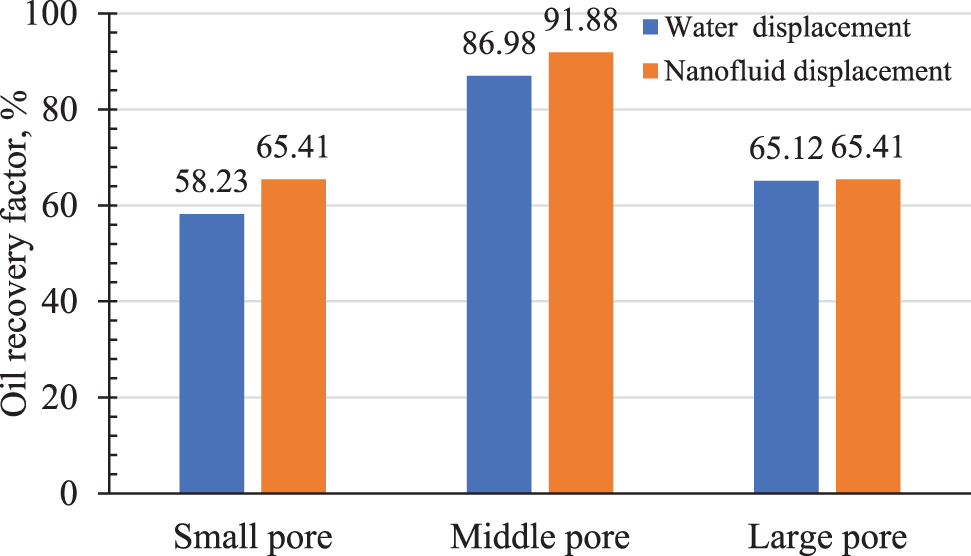
Figure 9: Oil recovery factors in different pore sizes
Based on the NMR experimental data, it is confirmed that nanofluids improve the oil recovery factor in the small and middle pores, increase the effective radius of the small pores, and displace the oil attached to the pore walls. If the nanofluid can alter the wettability of the core to strongly water-wet and then re-saturate with oil, the effective radius of the core will increase, leading to an increased volume of oil saturation and enhanced NMR T2 signal.
6 The Challenges of the Nanofluids
The challenges of the application of nanofluids mainly the followings, (1) the cost of the nanofluids is high, (2) the in-situ flocculation of the nanofluid in the reservoir is difficult to solve, (3) most of the studies of nanofluids have been conducted in the lab scale, the efficiency of field application cannot reach as high as the lab scale.
(1) The injection of Nanofliuds in the tight oil reservoir can be an efficient approach to enhance the tight oil recovery, and a proportional relationship was investigated with the concentration of nanofluids.
(2) After nanofluid displacement, the interfacial tension between oil and water in the core changes, reducing the pressure required for fluid flow in the core.
(3) Nanofluid demonstrates pressure drop reduction and incremental injection capabilities during waterflooding. Compared with the water displacement process, the nanofluid application, the oil recovery factor can be enhanced by 15.1%.
(4) After nanofluid displacement, the NMR T2 spectra reveal a 7.18% increase in oil recovery ratio in the small pores, a 4.9% increase in the middle pores, and a 0.29% increase in the large pores. This confirms that the nanofluid improves the flow state of micro-sized pores in the core and increases the final oil recovery factor.
Acknowledgement: The authors thank the help from Huan Li and Jie He, for their help on the experiments.
Funding Statement: This research was funded by Open Fund of State Key Laboratory of Oil and Gas Reservoir Geology and Exploitation (Southwest Petroleum University) Grant Number (PLN201802).
Author Contributions: The authors confirm their contribution to the paper as follows: study conception and design: Hui Tian; data collection: Dandan Zhao, Jun Ma; analysis and interpretation of results: Yannan Wu; draft manuscript preparation: Xingyu Yi, Xiang Zhou. All authors reviewed the results and approved the final version of the manuscript.
Availability of Data and Materials: All the data used in this paper are included in this paper, including the tables and figures.
Conflicts of Interest: The authors declare that they have no conflicts of interest to report regarding the present study.
References
1. Mohanty, K., Davis, H., Scriven, L. (1987). Physics of oil entrapment in water-wet rock. SPE Reservoir Engineering, 2(1), 113–128. https://doi.org/10.2118/9406-PA [Google Scholar] [CrossRef]
2. Berkowitz, B., Balberg, I. (1993). Percolation theory and its application to groundwater hydrology percolation theory and its application to groundwater hydrology. Water Resources Research, 29(4), 775–794. https://doi.org/10.1029/92WR02707 [Google Scholar] [CrossRef]
3. Wang, S., Feng, Q., Dong, Y., Han, X., Wang, S. (2015). A dynamic pore-scale network model for two-phase imbibition. Journal of Natural Gas Science and Engineering, 26, 118–129. https://doi.org/10.1016/j.jngse.2015.06.005 [Google Scholar] [CrossRef]
4. Binshan, J., Tailiang, F., Mingxue, M. (2006). Enhanced oil recovery by flooding with hydrophilic nanoparticles. China Particuology, 4(1), 41–46. https://doi.org/10.1016/S1672-2515(07)60232-2 [Google Scholar] [CrossRef]
5. Mona, K., Javad, S. (2022). Mechanism responsible altering in interfacial tension and emulsification of the crude oil-water system with nano Gemini surface active ionic liquids, salts and pH. Journal of Petroleum Science and Engineerin, 219, 111090. https://doi.org/10.1016/j.petrol.2022.111090 [Google Scholar] [CrossRef]
6. Haghighi, O., Zargar, G., Manshad, A., Ali, M., Takassi, M. et al. (2020). Effect of environment-friendly non-ionic surfactant on interfacial tension reduction and wettability alteration; Implications for enhanced oil recovery. Energies, 13(15), 3988. https://doi.org/10.3390/en13153988 [Google Scholar] [CrossRef]
7. Nourinia, A., Manshad, A., Shadizadeh, S., Ali, J., Iglauer, S. et al. (2022). Synergistic efficiency of Zinc Oxide/Montmorillonite nanocomposites and a new derived saponin in liquid/liquid/solid interface-included systems: Application in nanotechnology-assisted enhanced oil recovery. ACS Omega, 7(29), 24951–24972. https://doi.org/10.1021/acsomega.1c07182. [Google Scholar] [PubMed] [CrossRef]
8. Kharazi, M., Saien, J. (2022). Upgrading the properties of the crude oil-water system for EOR with simultaneous effects of a homologous series of nano Gemini surface-active ionic liquids, electrolytes, and pH. ACS Omega, 7(44), 40042–40053. https://doi.org/10.1021/acsomega.2c04741. [Google Scholar] [PubMed] [CrossRef]
9. Chen, L., Wang, M., Kang, Q., Tao, W. (2016). Pore scale study of multiphase multicomponent reactive transport during CO2 dissolution trapping. Advances in Water Resources, 116, 208–218. [Google Scholar]
10. Zhang, P., Tweheyo, M., Austad, T. (2007). Wettability alteration and improved oil recovery by spontaneous imbibition of seawater into chalk: Impact of the potential determining ions Ca2+, Mg2+, and SO42−. Colloids and Surfaces A: Physicochemical and Engineering Aspects, 301, 199–208. https://doi.org/10.1016/j.colsurfa.2006.12.058 [Google Scholar] [CrossRef]
11. Shi, Y., Tang, G. (2016). Non-Newtonian rheology property for two-phase flow on fingering phenomenon in porous media using the lattice Boltzmann method. Journal of Non-Newtonian Fluid Mechanics, 229, 86–95. https://doi.org/10.1016/j.jnnfm.2015.12.002 [Google Scholar] [CrossRef]
12. Huang, H., Sun, W., Ji, W., Zhang, R., Du, K. et al. (2018). Effects of pore-throat structure on gas permeability in the tight sandstone reservoirs of the Upper Triassic Yanchang formation in the Western Ordos Basin, China. Journal of Petroleum Science and Engineerin, 162, 602–616. https://doi.org/10.1016/j.petrol.2017.10.076 [Google Scholar] [CrossRef]
13. Chai, Y., Lukito, A., Jiang, Y., Ashby, P., Russell, T. (2017). Fine-tuning nanoparticle packing at water-oil interfaces using ionic strength. Nano Letters, 17(10), 6453–6457. https://doi.org/10.1021/acs.nanolett.7b03462. [Google Scholar] [PubMed] [CrossRef]
14. Li, Y., Dai, C., Zhou, H., Wang, X., Lv, W. et al. (2018). Investigation of spontaneous imbibition by using a surfactant-free active silica water-based nanofluid for enhanced oil recovery. Energy and Fuels, 32(1), 287–293. https://doi.org/10.1021/acs.energyfuels.7b03132 [Google Scholar] [CrossRef]
15. Sarmad, A., Muhammad, A., Shaobin, W., Ahmed, B., Maxim, L. et al. (2018). Wettability of nanofluid-modified oil-wet calcite at reservoir conditions. Fuel, 211, 405–414. https://doi.org/10.1016/j.fuel.2017.08.111 [Google Scholar] [CrossRef]
16. Al-Anssari, S., Wang, S., Barifcani, A., Lebedev, M., Iglauer, S. (2017). Effect of temperature and SiO2 nanoparticle size on wettability alteration of oil-wet calcite. Fuel, 206, 34–42. https://doi.org/10.1016/j.fuel.2017.05.077 [Google Scholar] [CrossRef]
17. Cao, B., Lu, X., Xie, K., Ding, H., Xiao, Z. et al. (2022). The pore-scale mechanisms of surfactant-assisted spontaneous and forced imbibition in water-wet tight oil reservoirs. Journal of Petroleum Science and Engineerin, 213, 110371. https://doi.org/10.1016/j.petrol.2022.110371 [Google Scholar] [CrossRef]
18. Yang, K., Wang, F., Zhao, J. (2022). Experimental study of surfactant-enhanced spontaneous imbibition in fractured tight sandstone reservoirs: The effect of fracture distribution. Petroleum Science, 20(1), 370–381. [Google Scholar]
19. National Standard of the Peoples Republic of China (2012). Test method for two phase relative permeability in rock. [Google Scholar]
20. Zhou, X., Zeng, F., Zhang, L., Wang, H. (2016). Foamy oil flow in heavy oil-solvent systems tested by pressure depletion in a sandpack. Fuel, 171, 210–223. https://doi.org/10.1016/j.fuel.2015.12.070 [Google Scholar] [CrossRef]
21. Sun, Y., Xin, Y., Lyu, F., Dai, C. (2021). Experimental study on the mechanism of adsorption-improved imbibition in oil-wet tight sandstone by a nonionic surfactant for enhanced oil recovery. Petroleum Science, 18(4), 1115–1126. https://doi.org/10.1016/j.petsci.2021.07.005 [Google Scholar] [CrossRef]
22. Mohammad, R., Zhang, S., Zhao, X., Lu, S. (2018). An experimental study of cyclic CO2-injection process in unconventional tight oil reservoirs. Oil & Gas Research, 4(1), 1–9. [Google Scholar]
23. Gao, M., Zhang, M., Du, H., Zhao, M., Dai, C. et al. (2023). A novel triple responsive smart fluid for tight oil fracturing-oil expulsion integration. Petroleum Science, 20(2), 982–992. https://doi.org/10.1016/j.petsci.2023.01.008 [Google Scholar] [CrossRef]
24. Chen, Y., Wei, J., Hadavimoghaddam, F., Zhou, X., Ostadhassan, M. et al. (2023). Experimental study of oil recovery mechanisms during imbibition in tight sandstone with different fluid displacing agents under ambient and reservoir pressure. Journal of Petroleum Science and Engineerin, 220, 111181. https://doi.org/10.1016/j.petrol.2022.111181 [Google Scholar] [CrossRef]
25. Wang, D., Ma, Y., Song, K., Wei, C., Zhang, J. et al. (2023). Phase-field modeling of spontaneous imbibition in tight porous media. SPE Reservoir Characterisation and Simulation Conference and Exhibition, Abu Dhabi, UAE. [Google Scholar]
26. Jia, R., Kang, W., Li, Z., Yang, H., Gao, Z. et al. (2022). Ultra-low interfacial tension (IFT) zwitterionic surfactant for imbibition enhanced oil recovery (IEOR) in tight reservoirs. Journal of Molecular Liquids, 368, 120734. https://doi.org/10.1016/j.molliq.2022.120734 [Google Scholar] [CrossRef]
27. Pu, L., Xu, P., Xu, M., Song, J., He, M. et al. (2022). Enhanced stability of low oil-to-water ratio water-in-oil emulsions (oil-based drilling fluidsSynergistic effect of nano-SiO2 and emulsifiers. Journal of Petroleum Science and Engineerin, 219, 111053. https://doi.org/10.1016/j.petrol.2022.111053 [Google Scholar] [CrossRef]
Cite This Article
 Copyright © 2024 The Author(s). Published by Tech Science Press.
This work is licensed under a Creative Commons Attribution 4.0 International License , which permits unrestricted use, distribution, and reproduction in any medium, provided the original work is properly cited.
 Downloads
 Citation Tools