
 Submit a Paper
 Propose a Special lssue
 Open Access
ARTICLE
Investigation of Cavitation in NaCl Solutions in a Sonochemical Reactor Using the Foil Test Method
1 Institute of Continuous Media Mechanics UB RAS, Perm, 614013, Russia
2 Faculty of Physics, Perm State University, Perm, 614068, Russia
* Corresponding Author: Michael Kuchinskiy. Email:
(This article belongs to the Special Issue: Advanced Problems in Fluid Mechanics)
Fluid Dynamics & Materials Processing 2024, 20(5), 1093-1102. https://doi.org/10.32604/fdmp.2024.050059
Received 26 January 2024; Accepted 21 March 2024; Issue published 07 June 2024
 View Full Text
 Download PDF
Abstract
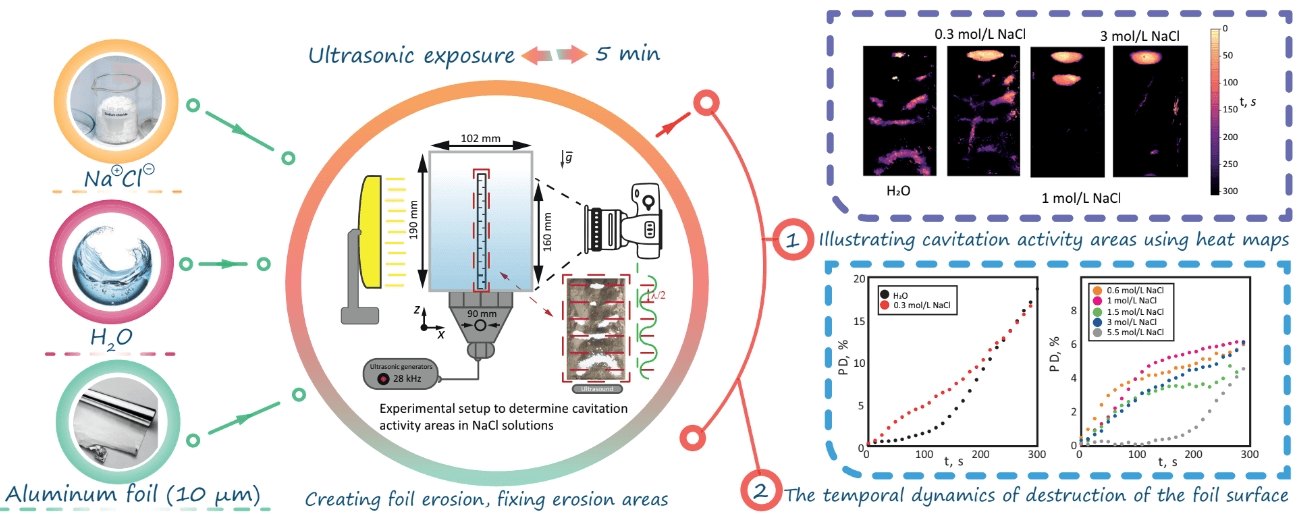
Ultrasonic baths and sonochemical reactors are widely used in industrial applications dealing with surface cleaning and chemical synthesis. The processes of erosion, cleaning and structuring of the surface can be typically controlled by changing relevant influential parameters. In particular, in this work, we experimentally investigate the effect of NaCl concentration (0–5.5 mol/L) on the erosion of an aluminum foil under ultrasonic exposure at a frequency of 28 kHz. Special attention is paid to the determination of cavitation zones and their visualization using heat maps. It is found that at low NaCl concentration (0.3 mol/L), the foil destruction rate is higher than in distilled water. At higher concentrations of salt, cavitation takes place mainly in the upper part of the container.Graphic Abstract
Keywords
The behavior of vapor-gas bubbles in liquids under the influence of ultrasound has been studied for many decades [1–3]. As a rule, a change in the concentration of solutes (electrolytes and surfactants) significantly changes the dynamics of air bubbles in these systems. This directly affects surface tension, density, conductivity and zeta potential [4–7].
In [8], the effect of concentrations of the collector reagents sodium dodecyl sulfate (SDS) and sodium chloride (NaCl) on the size and stability of air bubbles generated by a homogenizer in a liquid solution was studied. It was found that when a relatively small amount of NaCl (0.001–0.01 mol/L) is added to the SDS solution, the average diameter of the bubbles decreases. By studying the zeta potential on the surface of the air bubbles, it was shown that NaCl allows for the creation of a denser bubble shell. The addition of an electrolyte reduces hydrophobicity and induces a repulsive hydration structure, thereby stabilizing the interface. In [9], the authors explained this phenomenon by stating that salt reduces the rate of mass transfer by decreasing the diffusion coefficients of gases. However, the authors note that when salt with concentrations ranging from 0.17 to 1.8 mol/L was added, the size of bubbles increases. Furthermore, as the concentration approaches the saturation point, the size of the bubbles decreases, and the effect observed at lower concentrations is also observed: the shell of the bubble stabilizes, inhibiting coalescence. In [10], the authors experimentally studied the effect of increasing the concentration of sodium chloride (approximately 0.1–0.5 mol/L) in an SDS solution. They found that this led to an increase in the average diameter of the bubbles in the liquid volume. This study also confirmed the results obtained by the authors of [9]. In the work of [4], the growth of bubbles was also observed, which was associated with an increase in surface tension as the concentration of NaCI (0.04–0.17 mol/L) in the solution increased. Thus, there are several studies that confirm that there are certain concentrations of NaCI, at which the diameter of the air bubbles decreases, and vice versa–at some salt concentrations, an opposite effect can be achieved–an increase in their average diameter. This phenomenon has not been well studied, as often intermediate values of salt concentration that affect the growth or shrinkage of bubbles are not within the range studied.
Under the influence of mechanical action, which contributes to a large pressure drop (for example centrifugal pumps, water turbines, and sonochemical reactors), a cavitation process can be observed in solutions. It leads to the collapse of bubbles by converting the surface energy of the bubble and the kinetic energy of the liquid movement into thermal and chemical energy [11]. To optimize technological processes, researchers have to look for ways to prevent cavitation, since the appearance of cavitation bubbles near the wall of the material often turns out to be undesirable [12,13]. Using the wall cavitation model, factors that can reduce it are considered, such as the intensity of vibrations of a solid surface, temperature and pressure in a liquid [13].
Ultrasonic vibrations can also lead to the appearance of cavitation bubbles, in which case we can talk about the occurrence of acoustic cavitation. Due to fluctuations in acoustic pressure, the process of bubble collapse can occur, which leads to erosion of the solid surface near the collapsing bubble [14,15]. This phenomenon in [16] is explained by the fact that near the solid boundary, the collapse of the bubbles is asymmetric and generates cavitation jets of liquid that destroy the surface of the material [17].
Various methods are used to determine cavitation activity zones. Thus, in the work [18], a chemical method was used based on the sonoluminescence process, which allows the registering areas of active cavitation by fixing luminescent bubbles. A number of other studies [19–21] have used a mechanical approach based on surface erosion. Aluminum foil often acts as such a surface; in this case it is customary to talk about using foil test. The foil test method allows to detect the places and areas of surface damage, and the depth of damage.
It was noted that cavitation damages appear in places of surface irregularities, and cavitation bubbles form clusters in places of already formed pits, contributing to an increase in the rate of surface degradation [22–24]. In this work, an alternative explanation for cavitation erosion of the foil is also proposed. According to the authors, the damage to the surface caused by microjets is insignificant in comparison to the degradation caused by the spherical collapse of microbubbles, which can be either already on the surface or formed during the “splashing” effect. After the microjet hits the surface of the aluminum foil [22], it spreads like a thin film inside the boundary layer; consequently, microbubbles are formed due to friction between the resting liquid and the moving fragments of the microjet.
When exposed to ultrasound, the addition of salt to the solution slightly increases the rate of formation of cavitation bubbles and, due to the inhibition of coalescence, they cluster in cavitation activity zones [15,25]. In the work [26], devoted to the study of cavitation erosion and corrosion of metals in NaCl solution, it was found that the presence of a high concentration salt accelerates the process of degradation of the surface of aluminum foil. This phenomenon is explained by the presence of chlorine ions, which destroy the passivating film on the aluminum surface. The combination of microjets directed towards a solid surface during the collapse of air bubbles and the presence of chlorine ions contribute to a faster erosion of the metal foil.
Due to the widespread use of seawater in various technological processes (such as the flotation process), it is necessary to investigate the impact of NaCl salt concentrations on the physical and chemical properties of this liquid. The high energy consumption of desalinating seawater makes it a significant factor in determining the optimal conditions for these processes. Mechanical, including ultrasonic, effects on seawater can lead to a concentration-dependent impact that may positively or negatively affect the outcome.
The purpose of this work is to determine the effect of NaCl concentration on the activity of cavitation events in a liquid under the action of ultrasound. As the literature review shows, the effect of ultrasonic exposure and NaCl concentration on the degradation of the solid surface of aluminum foil caused by the collapse of cavitation bubbles has not been sufficiently studied.
2 The Effect of NaCl in a Liquid on the Degradation of the Aluminum Foil Surface
2.1 Description of the Experimental Setup and Measurement Methodology
To study the activity of cavitation events in aqueous salt solutions under ultrasonic exposure, an experimental setup was used (Fig. 1). It included a cuvette (similar to those used in [27,28]) with internal dimensions of 103 × 102 × 190 mm3 (depth × width × height) (Fig. 1(2)), made of acrylic glass with a thickness of 3 mm.
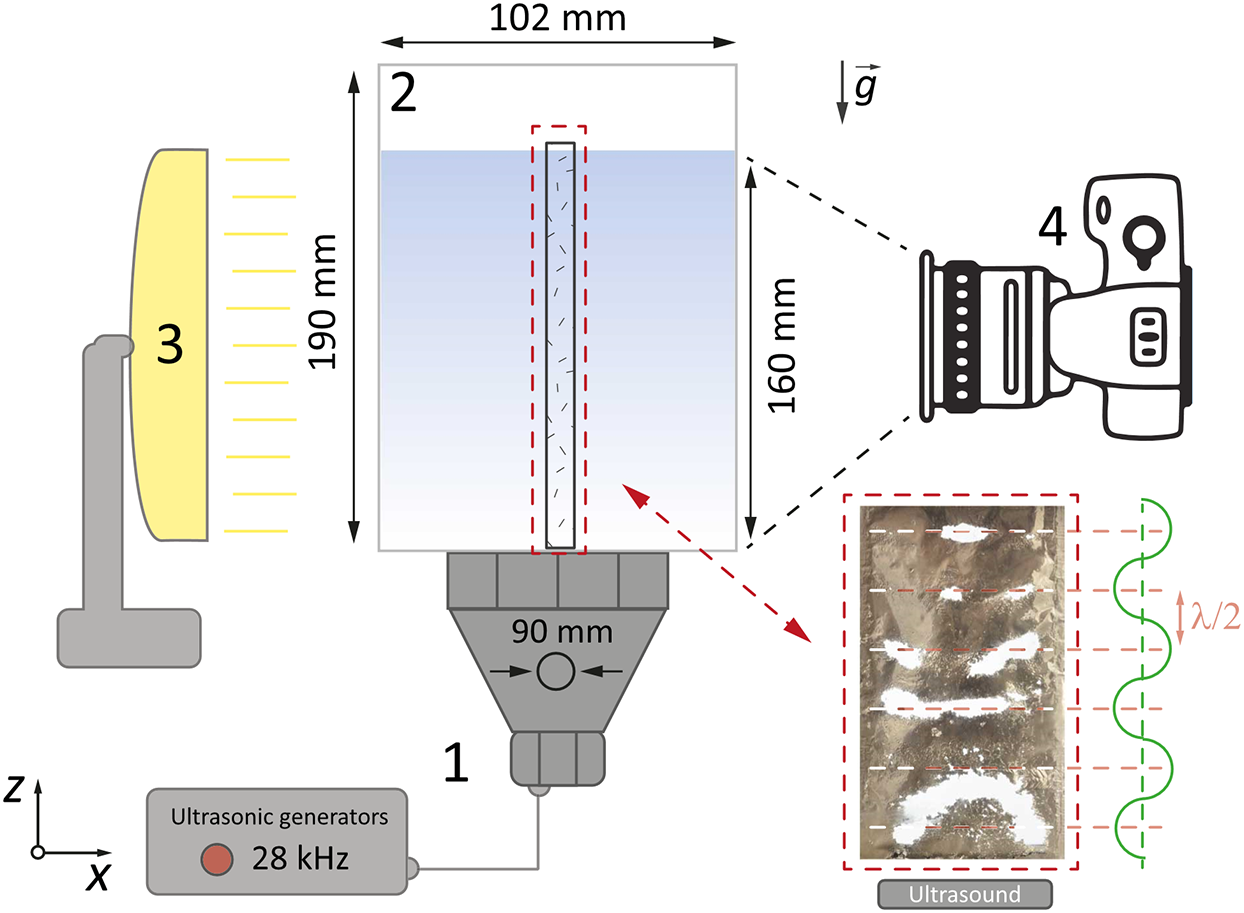
Figure 1: Experimental setup to determine cavitation activity areas in NaCl solutions: (1) an ultrasonic transducer; (2) an acrylic container; (3) a light source; (4) a camera
An ultrasonic oscillation source was installed on the lower face of the parallelepiped (Fig. 1(1)). It was based on a Langevin transducer with a frequency of f = 28 kHz and a power of P = 32 W. The transducer was mounted on a plate made of stainless steel with a thickness of 0.7 mm, in the shape of a disk with a diameter of 90 mm. The radiator was located at the bottom of the container in such a way that its center coincided with the center of the container.
The experiments used distilled water at room temperature Trt = 23°C, which was kept for at least a day in the immediate vicinity of the experimental site. The volume of the liquid under study was 1.75 L. The height of the liquid in this case was hliquid = 160 mm. The activity of cavitation events was studied using a modified [29] method based on the determination of the foil fracture rate and area (foil test) using heat maps.
To do this, a foil of a thickness of 10 μm was used, which was stretched over a frame made of PLA plastic 5 × 95 × 165 mm3 (depth × width × height). The area inside the frame, without taking into account the edges, was 90 × 160 mm2 (width × height). The surface of the aluminum foil was positioned perpendicular to the surface of the transducer, coaxially with its center. An IPS matrix was used as a source of contour light (Fig. 1(3)) with WLED illumination based on white LEDs with a pixel density of 33.47 px/mm2, the brightness of the matrix was 5 × 10⁻⁴ cd/mm2. The light source was located at a distance of 300 mm from the center of the container (Fig. 1(3)).
To register the areas of foil destruction, a Nikon d5400 digital camera with a Nikkor 50 mm f/1.8D AF lens was used, located at a distance of 350 mm from the center of the container (Fig. 1(4)). Interval shooting was performed with the following settings: ISO 100, shutter speed 1/10 s, f/5. Each experiment was conducted for 300 s. During the experiment, a set of 50 photos was obtained corresponding to the central section of the sonochemical reactor located at a distance of 50 mm from the side wall. An example of a photo obtained for distilled water can be seen in Fig. 2a.
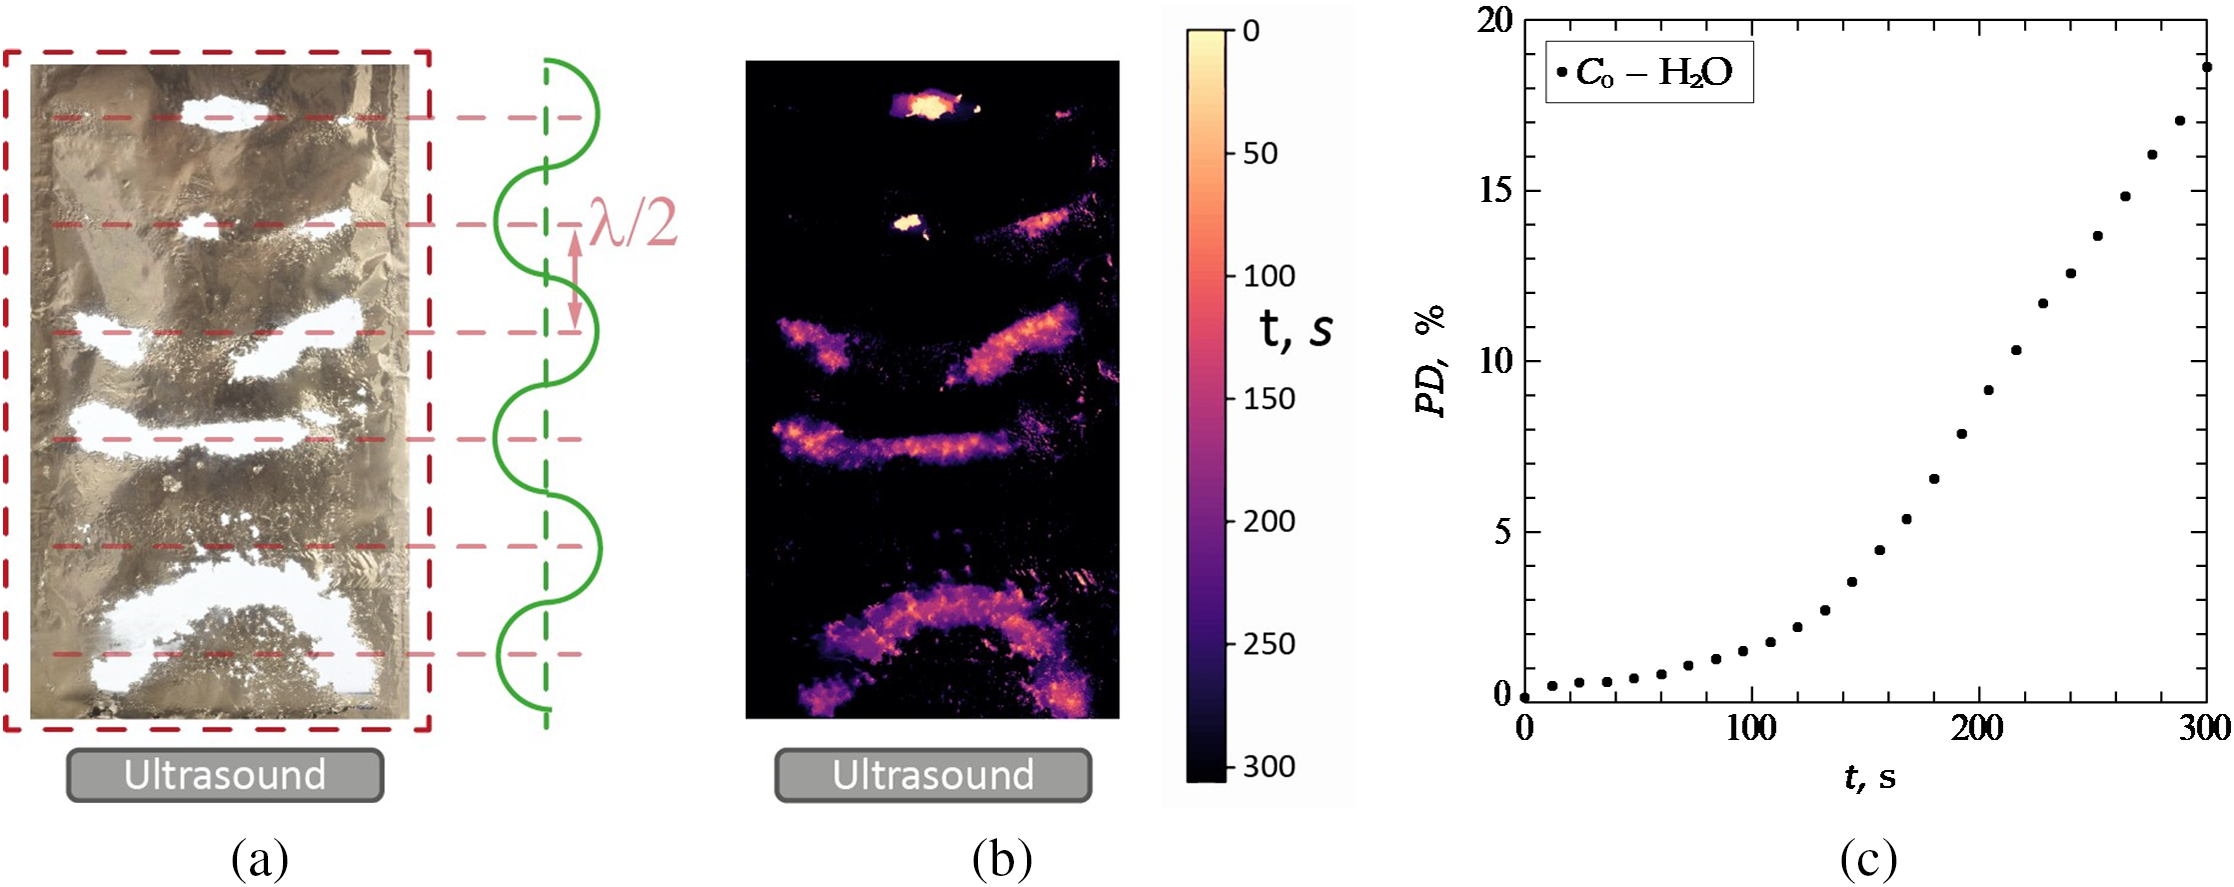
Figure 2: Experimental results for H2O: (a)-Experimental photo after t = 300 s of ultrasonic exposure, (b)-Heat map of the destroyed foil surface after t = 300 s of ultrasonic exposure, (c)-Dependence of the area of destruction of the foil surface in H2O on time
The photos obtained in the manner described above were processed using a Python program. The program downloads experimental photos, and then processes them, as a result of such manipulations, black-and-white images with clear boundaries of foil destruction are obtained. Then a two-dimensional array reflecting the intensity of light at each point is obtained from each photo. The size of the array corresponds to the resolution of the camera. After that, the matrix addition operation is applied using the NumPy library. A point with a higher numerical value means earlier destruction than a point with a lower value, and a zero value corresponds to the absence of foil destruction at this point. At the next stage of processing, a color is assigned to each point, the minimum value is assigned black, and the maximum is yellow. As a result of the processing, a heat map was obtained, the color scheme of which demonstrates the moment in time when the foil was destroyed.
Based on the first frame, the Initial line area was recorded in the absence of impact bonds. The mechanism of erosion of a solid surface involves the formation of a cavitation jet when a bubble implodes. In this process, the direction of the cavitation jet propagation depends on the properties of the surface it encounters [2]. When the ultrasonic source is activated, the aluminum foil is gradually damaged. After that, the total area of the eroded surface (Damaged line area) was determined for each of the images, and based on the processing, the relative area of destruction of the foil at a given time was calculated according to the formula proposed in [30]:
where PD is the damage area pattern.
2.2 Results of Experiments with Surface Degradation
2.2.1 Experiments with Distilled Water
Fig. 2a shows a photograph of a vertical slice obtained in experiments with distilled water after 300 s exposure to ultrasound. It is known that under the action of ultrasonic radiation, the foil surface degrades in the cavitation activity zones located in the antinodes of the standing ultrasonic wave [1,21]. At the same time, the number of cavitation activity zones, as well as the rate of destruction of the foil, depending on the liquid level hliquid. In the case of an odd multiplicity of a quarter of the wavelength (
On the heat map for distilled water (Figs. 2b, 3a), it can be seen that when the ultrasound is turned on, two areas of active destruction appear, located in the upper part of the slice near the water-air interface, the growth of these zones slows down after 100 s of the experiment. An area of destruction also begins to form near the ultrasonic source, which is a semicircle, where active destruction is further observed. This shape of the fracture region is caused by the formation of spherical waves in the volume of the liquid. In the middle of the sonochemical reactor, the formation of two cavitation activity zones parallel to the ultrasonic source is observed.
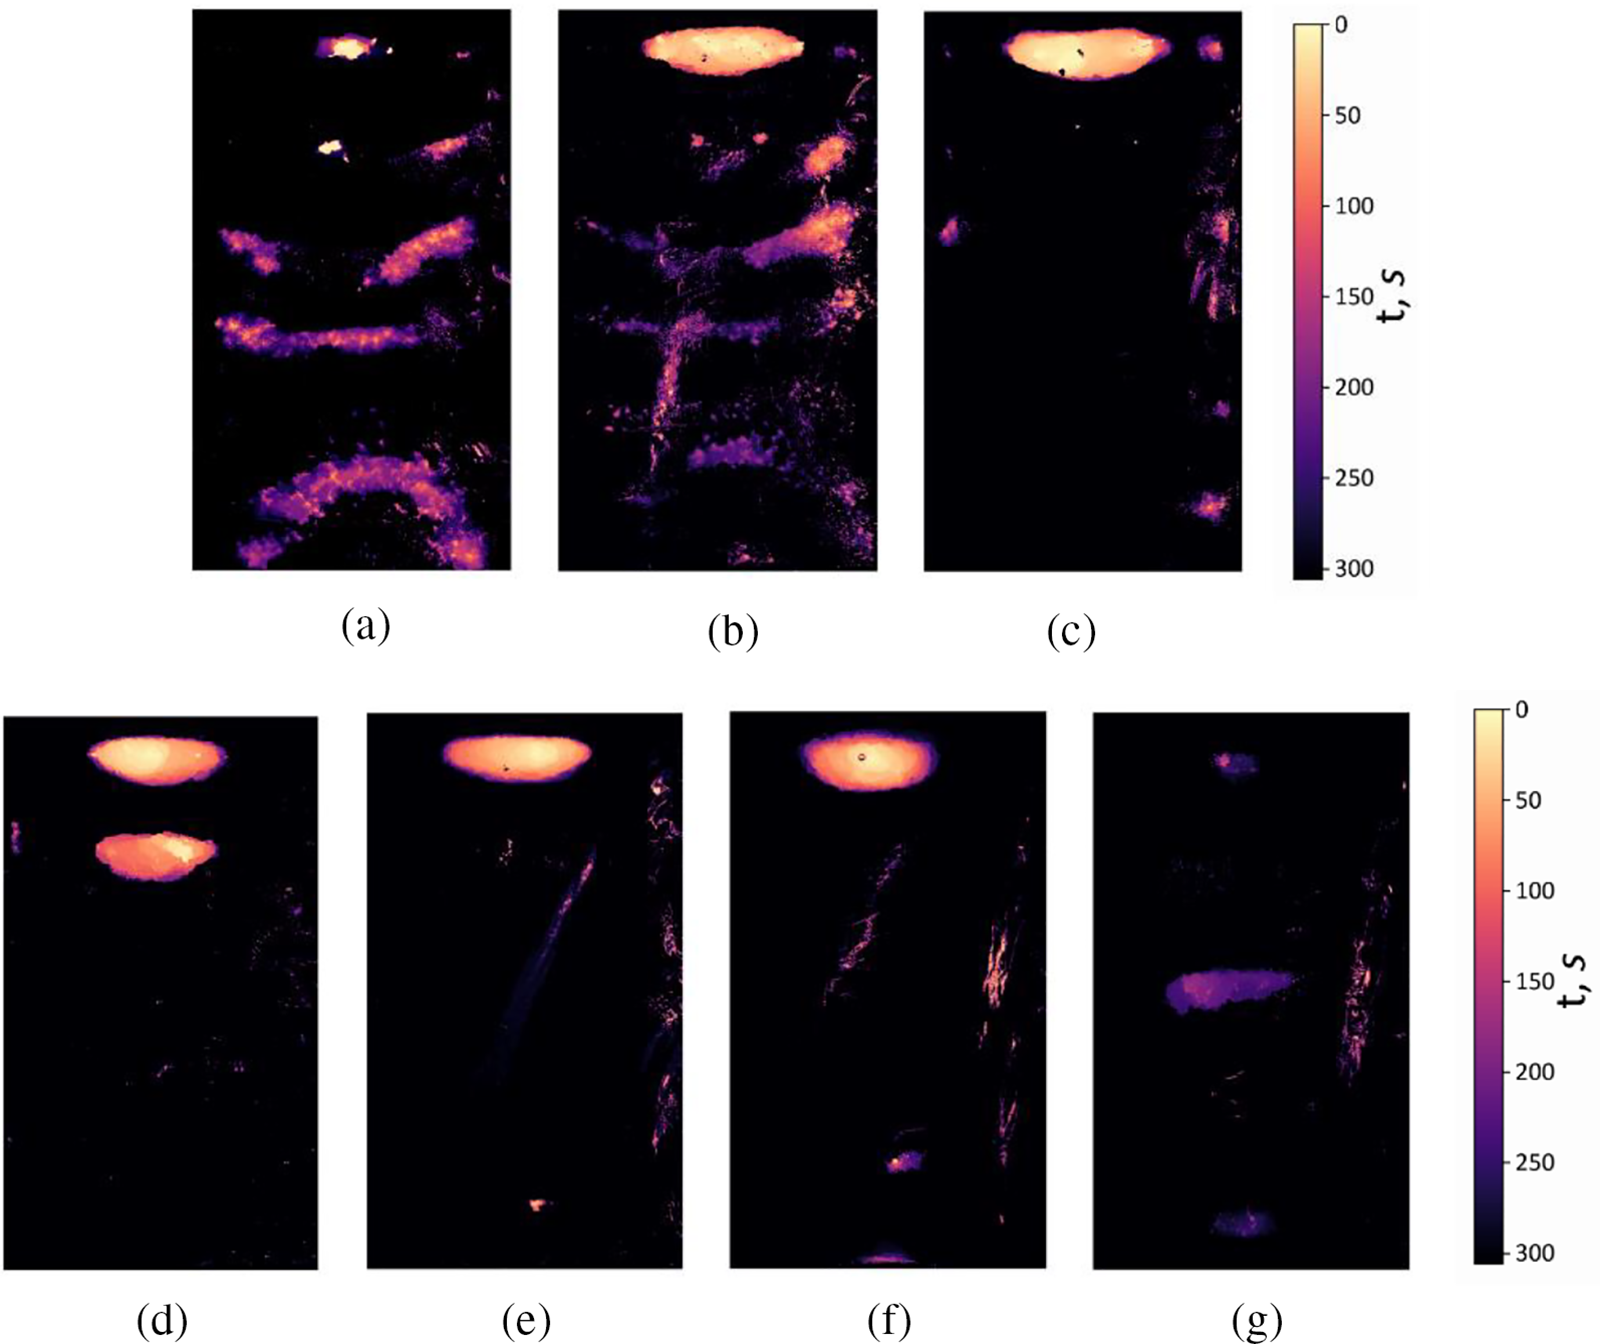
Figure 3: Heat maps illustrating cavitation activity zones in solutions for different salt concentrations: (a)-H2O; (b)-0.3 mol/L NaCl; (c)-0.6 mol/L NaCl; (d)-1.0 mol/L NaCl; (e)-1.5 mol NaCl; (f)-3.0 mol/L NaCl; (g)-5.5 mol/L NaCl
In Fig. 2c, the dependence of the relative area of the destroyed foil surface (pattern damage area) PD on time is presented. As can be seen, during the experiment with a duration of 300 s, the relative area of the destroyed foil in distilled water was 19%. Based on the graph, it can be concluded that the rate of destruction of the foil in the time interval of 0–120 s turns out to be less than the rate in the time interval of 120–300 s.
2.2.2 Experiments with Aqueous Solutions of NaCl Salt
Experiments, similar to those described above, were carried out with NaCl solutions of different concentrations. In Figs. 3b–3g, thermal maps of the destroyed foil surface are shown (Figs. 3 and 4) after t = 300 s of ultrasonic exposure, obtained for different salt concentrations. For comparison, the heat map obtained for distilled water in the absence of salt is presented in Fig. 3a.
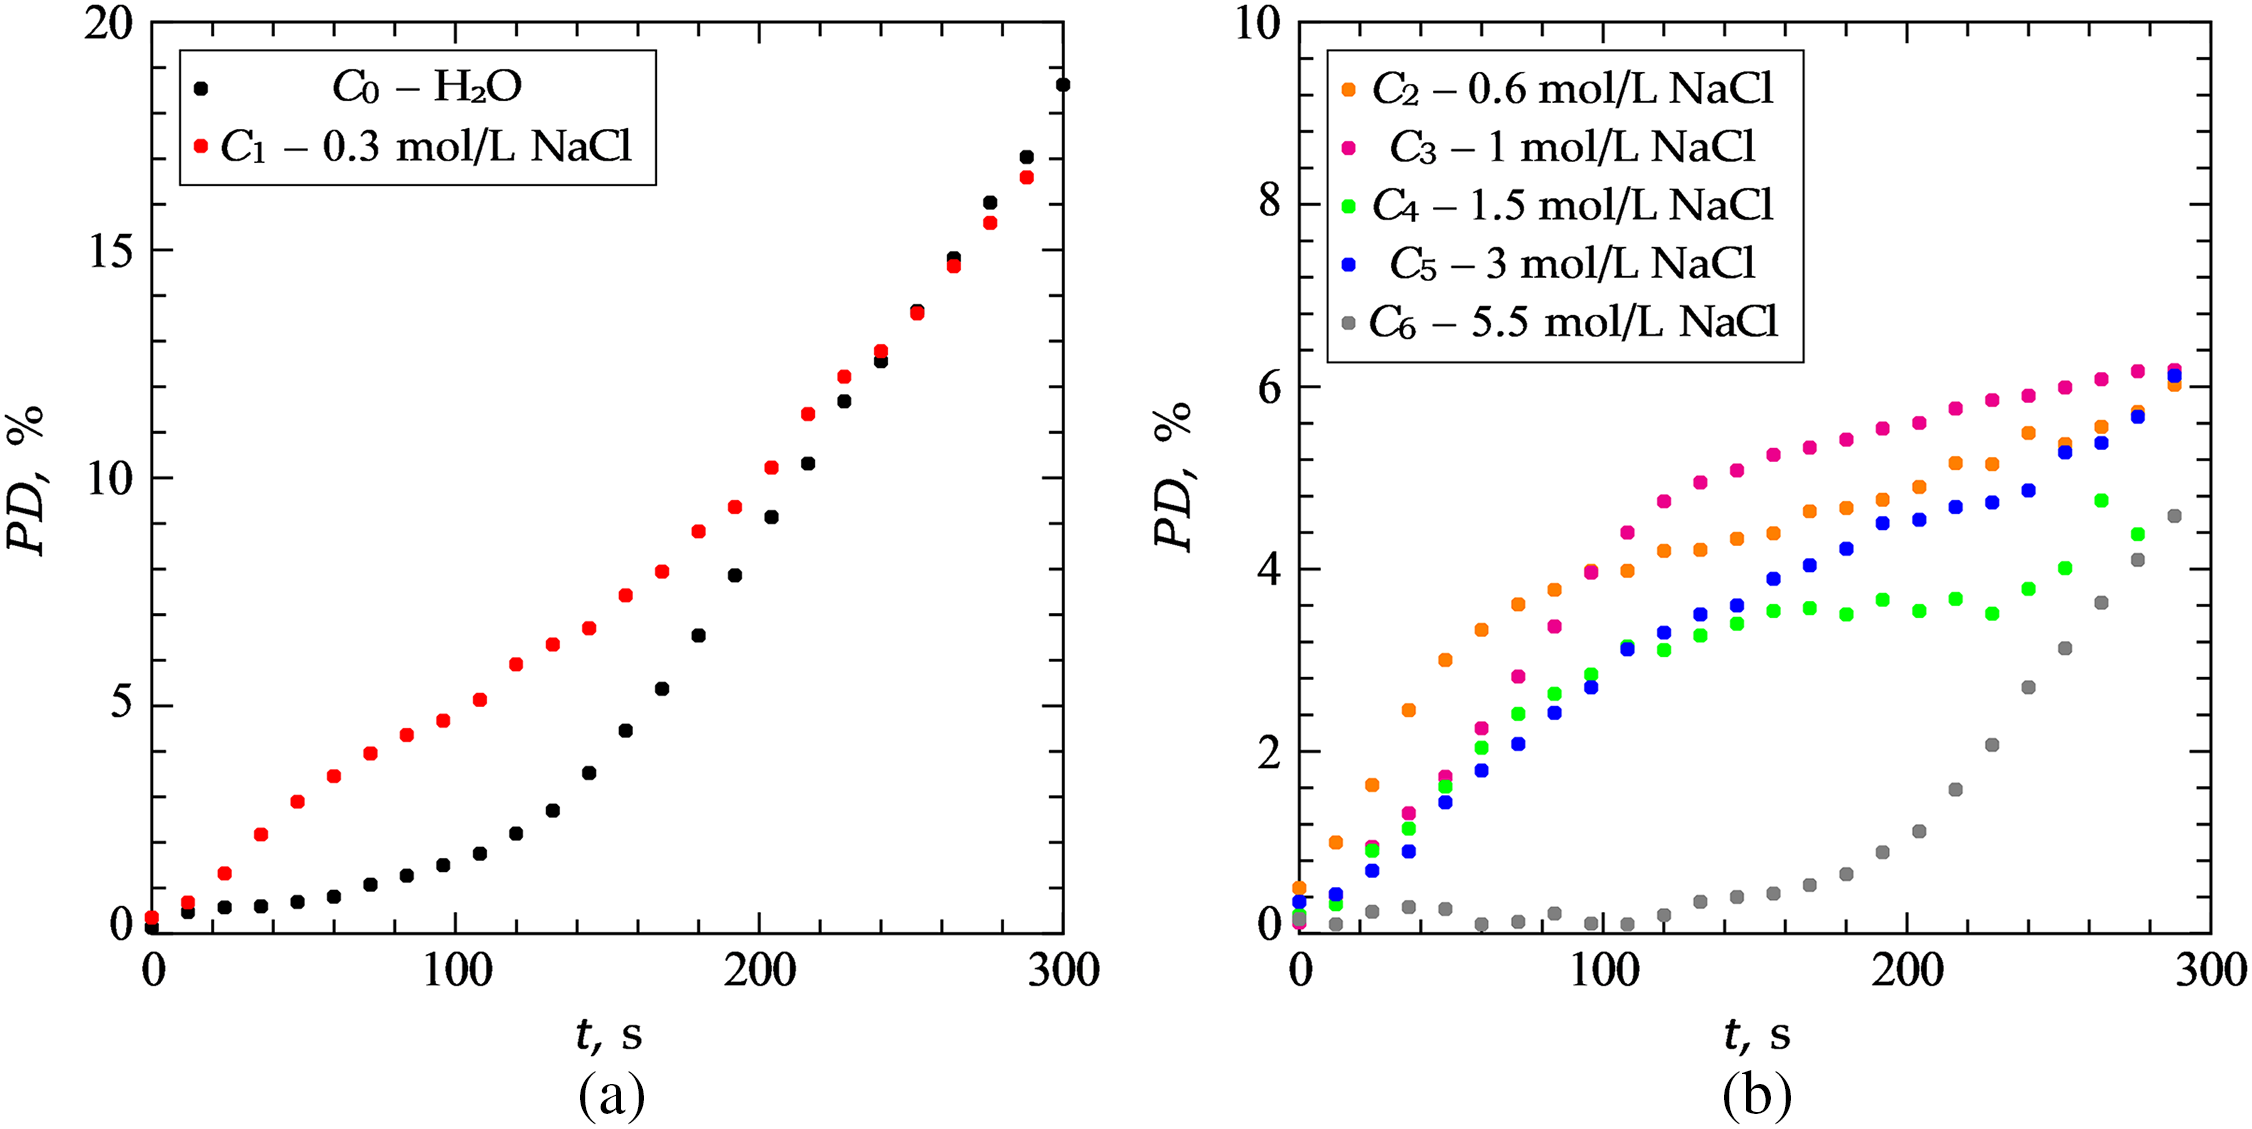
Figure 4: The temporal dynamics of destruction of the foil surface for: (a)-H2O; 0.3 mol/L NaCl; (b)-0.6 mol/L NaCl; 1.0 mol/L NaCl; 1.5 mol/L NaCl; 3.0 mol/L NaCl; 5.5 mol/L NaCl
As can be seen from the comparison of Figs. 3a and 3b, at a low salt concentration C1 = 0.3 mol/L, the location of the cavitation activity zones qualitatively coincides with their location in clean water, but the zones themselves become more extended in the horizontal direction. In all zones, with the exception of the upper one, the foil begins to break down later than in distilled water, which shows a purple color on heat maps. The upper zone, as in the case of distilled water, begins to collapse first, but in the presence of salt its area is much larger. The active destruction of this zone immediately after the start of the experiment occurs due to the interference of waves emitted by the ultrasonic source and reflected from the interface of the media. The more intense destruction of the foil surface near the interface when salt is added is due to the fact that the density of the solution and the speed of sound (1.498 × 106 mm/s at 0.3 mol/L) increase [34].
With an increase in the amount of salt in a liquid, its surface tension increases and the number of gases dissolved in it also changes. This causes an increase in areas where cavitation bubbles may occur [15]. However, in such solutions, the bubbles are unstable and therefore cannot reach a resonant size, leading to the destruction of the surface of the foil. It has been found in [35] that in some cases, bubbles become more stable near solid surfaces or interfaces. This can be seen in Figs. 3c–3f, where it is clear that when a certain concentration of salt is reached, there is no damage to the center of the sample, but erosion occurs more around the edges. Only one zone appears in the upper part of the container-this is due to the above-mentioned phenomenon as well as the increase in popping bubbles that eventually reach a resonant size. The interference of ultrasonic waves also plays a role, particularly near the interface between the two liquids. The combination of these factors results in the fact that the zone of cavitation is more pronounced in this area.
When approaching the saturation concentration of C6 = 5.5 mol/L, a pattern of destruction occurs (Fig. 3g), symmetrical with respect to the central part of the slice. The areas are colored purple, therefore, in this case, foil erosion begins to occur much later: destruction in the upper part of the reactor at a given concentration begins after 200 s, while at low salt concentrations, destruction was already recorded at 15 s. The reason for this may also be the presence of a large number of NaCl, which make it difficult for the formation of collapsing bubbles near the surface, may be observed.
The rate of destruction of the foil also depends on the salt concentration. At a low concentration of C1, erosion occurs faster at the initial stage of the experiment than in distilled water. However, after 300 s, the area of the destroyed surface turns out to be comparable to PD in distilled water; at C1, the curve bend changes, and the dependence takes on an almost linear character.
At a salt concentration of C2 = 0.6 mol/L, the most rapid destruction of the foil occurs during the first 60 s, however, at the end of the experiment, the area of the destroyed surface turns out to be the same as the area in the cases of C3 = 1 mol/L, C5 = 3.0 mol/L. At a concentration of C6 close to saturation, the curve of the PD (t) curve changes: erosion begins to occur at a later stage of the experiment, which is confirmed by heat maps.
As shown by experiments using ultrasound, with an increase in the concentration of NaCl in a liquid, a change in the shape, the area of the destroyed foil surface and the number of cavitation activity zones occurs, caused by changes in the density of the liquid, the speed of sound and, accordingly, the impedance. In addition, a zone of active destruction occurs in the upper part of the reactor, caused by interference of ultrasonic waves near the interface of media.
As a result of experimental studies conducted using the foil test method, heat maps and dependences of the fracture area on the time of exposure to ultrasound at various concentrations of NaCl (0.0–5.5 mol/L) are obtained. It is revealed that with an increase in salt concentration, the structure of the activity zones of cavitation events in the volume of liquid under ultrasonic exposure changes.
In distilled water, under the conditions considered, six active cavitation zones arise, in which the degradation of the aluminum foil surface occurs most intensively. These zones, depending on their location, have different shapes. The zone located near the ultrasound source has a semicircular shape, which is due to the formation of spherical ultrasound waves. In a solution with a low salt concentration (0.3 mol/L), the number and location of the zones coincide with those found in distilled water. However, a pronounced zone appears near the interface due to wave interference. This is also observed when the salt concentration is increased. Experiments lasting 300 s showed that the area of damage to the pattern decreased with the addition of sodium chloride salt. However, the rate of aluminum foil destruction at the initial stage of the experiment (0–100 s) increases monotonically with increasing salt concentration at concentrations of 0.3–3.0 mol/L. When the concentration reaches a value close to saturation (5.5 mol/L), erosion of the foil begins after 200 s of exposure. In this instance, three cavitation activity zones form, symmetrical about the center of the vertical section.
The research results can be used to optimize production processes using seawater. They can also be useful for intensifying the flotation process using ultrasound.
Acknowledgement: The authors would like to thank the respected reviewers for their valuable suggestions for improving the quality of the manuscript.
Funding Statement: The authors received no specific funding for this study.
Author Contributions: The authors confirm their contribution to the paper as follows: study conception and design: TL, KR; data collection: MK, AS, VG; analysis and interpretation of results: MK, TL, KR; draft manuscript preparation: MK, TL, KR. All authors reviewed the results and approved the final version of the manuscript.
Availability of Data and Materials: Data sets generated during the current study are available from the corresponding author on reasonable request.
Conflicts of Interest: The authors declare that they have no conflicts of interest to report regarding the present study.
References
1. Murray, P. R., Chen, Y., Truong, V. N., Bu, X., Xie, G. (2020). A review of effects and applications of ultrasound in mineral flotation. Ultrasonics Sonochemistry, 60, 104739. https://doi.org/10.1016/j.ultsonch.2019.104739 [Google Scholar] [PubMed] [CrossRef]
2. Gonzalez-Avila, S. R., Nguyen, D. M., Arunachalam, S., Domingues, E. M., Mishra, H. et al. (2020). Mitigating cavitation erosion using biomimetic gas-entrapping microtextured surfaces (GEMS). Science Advances, 6(13), eaax6192. https://doi.org/10.1126/sciadv.aax6192 [Google Scholar] [PubMed] [CrossRef]
3. Gao, K., Liu, H., Sun, L., Zhang, Z. (2022). Effect of gas input conditions and ultrasound on the dynamic behavior of flotation bubbles. ACS Omega, 7(26), 22326–22340. https://doi.org/10.1021/acsomega.2c01162 [Google Scholar] [PubMed] [CrossRef]
4. Liu, Q., Zhang, Y., Wu, Y., Lyu, J., Liu, Q. (2021). Bubble growth in NaCl solution: Influence of superheat temperature and solution concentration. Industrial & Engineering Chemistry Research, 60(11), 4440–4452. https://doi.org/10.1021/acs.iecr.0c05251 [Google Scholar] [CrossRef]
5. Horn, R. G., Del Castillo, L. A., Ohnishi, S. (2011). Coalescence map for bubbles in surfactant-free aqueous electrolyte solutions. Advances in Colloid and Interface Science, 168(1–2), 85–92 [Google Scholar] [PubMed]
6. Li, M. (2022). Fundamental understanding on the inception of hydrodynamic cavitation and its generated microbubbles in fine particle flotation (Ph.D. Thesis). University of Alberta, Canada. [Google Scholar]
7. Yang, C., Dabros, T., Li, D., Czarnecki, J., Masliyah, J. H. (2000). A visualizing method for study of micron bubble attachment onto a solid surface under varying physicochemical conditions. Industrial & Engineering Chemistry Research, 39(12), 4949–4955. https://doi.org/10.1021/ie000443b [Google Scholar] [CrossRef]
8. Xu, Q., Nakajima, M., Ichikawa, S., Nakamura, N., Roy, P. et al. (2009). Effects of surfactant and electrolyte concentrations on bubble formation and stabilization. Journal of Colloid and Interface Science, 332(1), 20814. https://doi.org/10.1016/j.jcis.2008.12.044 [Google Scholar] [PubMed] [CrossRef]
9. Tanaka, S., Kastens, S., Fujioka, S., Schlüter, M., Terasaka, K. (2020). Mass transfer from freely rising microbubbles in aqueous solutions of surfactant or salt. Chemical Engineering Journal, 387, 121246. https://doi.org/10.1016/j.cej.2019.03.122 [Google Scholar] [CrossRef]
10. Rybkin, K., Kuchinskiy, M., Lyubimova, T., Kozlov, M., Fattalov, O. et al. (2022). Method of generation, measurement of the size and number of microbubbles in NaCl and SDS solutions of different concentrations. Journal of Physics: Conference Series, 2317(1), 012007. https://doi.org/10.1088/1742-6596/2317/1/012007 [Google Scholar] [CrossRef]
11. Shchukin, D., Skorb, E., Belova, V., Möhwald, H. (2011). Ultrasonic cavitation at solid surfaces. Advanced Materials, 23(17), 1922–1934. https://doi.org/10.1002/adma.201004494 [Google Scholar] [PubMed] [CrossRef]
12. Liu, L., Yu, P. (2020). Design and experiment-based optimization of high-flow hydraulic one-way valves. Fluid Dynamics and Materials Processing, 16(2), 211–224. https://doi.org/10.32604/fdmp.2020.08168 [Google Scholar] [CrossRef]
13. Tong, D., Qin, S., Liu, Q., Li, Y., Lin, J. (2022). An analysis of the factors influencing cavitation in the cylinder liner of a diesel engine. Fluid Dynamics & Materials Processing, 18(6), 1667–1682. https://doi.org/10.32604/fdmp.2022.019768 [Google Scholar] [CrossRef]
14. Reese, H., Schädel, R., Reuter, F., Ohl, C. D. (2022). Microscopic pumping of viscous liquids with single cavitation bubbles. Journal of Fluid Mechanics, 944, A17. https://doi.org/10.1017/jfm.2022.480 [Google Scholar] [CrossRef]
15. Li, M., Manica, R., Xiang, B., Liu, Q. (2021). Effect of NaCl and CO2 on the inception control of hydrodynamic cavitation by gas solubility change. Chemical Engineering Science, 246(5), 116997. https://doi.org/10.1016/j.ces.2021.116997 [Google Scholar] [CrossRef]
16. Song, Y. L., Li, J. T. (2009). Degradation of CI direct black 168 from aqueous solution by fly ash/H2O2 combining ultrasound. Ultrasonics Sonochemistry, 16(4), 440–444. https://doi.org/10.1016/j.ultsonch.2008.12.011 [Google Scholar] [PubMed] [CrossRef]
17. Turangan, C., Ball, G., Jamaluddin, A., Leighton, T. (2017). Numerical studies of cavitation erosion on an elastic-plastic material caused by shock-induced bubble collapse. Proceedings of the Royal Society A: Mathematical, Physical and Engineering Sciences, 473(2205), 20170315. https://doi.org/10.1098/rspa.2017.0315 [Google Scholar] [CrossRef]
18. Gonzalez, V., Wood, R., Lee, J., Taylor, S., Bussemaker, M. (2019). Ultrasound-enhanced hair dye application for natural dyeing formulations. Ultrasonics Sonochemistry, 52, 294–304. https://doi.org/10.1016/j.ultsonch.2018.11.028 [Google Scholar] [PubMed] [CrossRef]
19. Pamidi, T. R. K., Johansson, Ö., Löfqvist, T., Shankar, V. (2020). Comparison of two different ultrasound reactors for the treatment of cellulose fibers. Ultrasonics Sonochemistry, 62, 104841. https://doi.org/10.1016/j.ultsonch.2019.104841 [Google Scholar] [PubMed] [CrossRef]
20. Mitragotri, S., Ray, D., Farrell, J., Tang, H., Yu, B. et al. (2000). Synergistic effect of low-frequency ultrasound and sodium lauryl sulfate on transdermal transport. Journal of Pharmaceutical Sciences, 89(7), 892–900. https://doi.org/10.1002/1520-6017(200007)89:7<892::AID-JPS6>3.0.CO;2-V [Google Scholar] [PubMed] [CrossRef]
21. Zeqiri, B., Hodnett, M., Carroll, A. J. (2006). Studies of a novel sensor for assessing the spatial distribution of cavitation activity within ultrasonic cleaning vessels. Ultrasonics, 44(1), 73–82. https://doi.org/10.1016/j.ultras.2005.08.004 [Google Scholar] [PubMed] [CrossRef]
22. Dular, M., Osterman, A. (2008). Pit clustering in cavitation erosion. Wear, 265(5–6), 811–820. https://doi.org/10.1016/j.wear.2008.01.005 [Google Scholar] [CrossRef]
23. Dular, M., Delgosha, O. C., Petkovšek, M. (2013). Observations of cavitation erosion pit formation. Ultrasonics Sonochemistry, 20(4), 1113–1120. https://doi.org/10.1016/j.ultsonch.2013.01.011 [Google Scholar] [PubMed] [CrossRef]
24. Petkovgek, M., Dular, M. (2013). Simultaneous observation of cavitation structures and cavitation erosion. Wear, 300(1–2), 55–64. https://doi.org/10.1016/j.wear.2013.01.106 [Google Scholar] [CrossRef]
25. Rybkin, K., Bratukhin, Y., Lyubimova, T., Fatallov, O., Filippov, L. (2017). Experimental study of formation and dynamics of cavitation bubbles and acoustic flows in NaCl, KCl water solutions. Journal of Physics: Conference Series, 879, 012026. https://doi.org/10.1088/1742-6596/879/1/012026 [Google Scholar] [CrossRef]
26. Zhao, J., Ning, L., Zhu, J., Li, Y. (2021). Investigation on ultrasonic cavitation erosion of aluminum-titanium alloys in sodium chloride solution. Crystals, 11(11), 1299. https://doi.org/10.3390/cryst11111299 [Google Scholar] [CrossRef]
27. Lyubimova, T., Rybkin, K., Fattalov, O., Kuchinskiy, M., Filippov, L. (2021). Experimental study of temporal dynamics of cavitation bubbles selectively attached to the solid surfaces of different hydrophobicity under the action of ultrasound. Ultrasonics, 117(5), 106516. https://doi.org/10.1016/j.ultras.2021.106516 [Google Scholar] [PubMed] [CrossRef]
28. Kuchinskiy, M., Lyubimova, T., Rybkin, K., Fattalov, O., Klimenko, L. (2021). Experimental and numerical study of acoustic pressure distribution in a sonochemical reactor. Journal of Physics: Conference Series, 1809, 012025. [Google Scholar]
29. Wu, P., Wang, X., Lin, W., Bai, L. (2022). Acoustic characterization of cavitation intensity: A review. Ultrasonics Sonochemistry, 82(3), 105878. https://doi.org/10.1016/j.ultsonch.2021.105878 [Google Scholar] [PubMed] [CrossRef]
30. Sahoo, B. N., Han, S. Y., Kim, H. T., Ando, K., Kim, T. G. et al. (2022). Chemically controlled megasonic cleaning of patterned structures using solutions with dissolved gas and surfactant. Ultrasonics Sonochemistry, 82(4), 105859. https://doi.org/10.1016/j.ultsonch.2021.105859 [Google Scholar] [PubMed] [CrossRef]
31. Laborde, J. L., Hita, A., Caltagirone, J. P., Gerard, A. (2000). Fluid dynamics phenomena induced by power ultrasounds. Ultrasonics, 38(1–8), 297–300 [Google Scholar] [PubMed]
32. Servant, G., Laborde, J. L., Hita, A., Caltagirone, J. P., Gérard, A. (2001). Spatio-temporal dynamics of cavitation bubble clouds in a low frequency reactor: Comparison between theoretical and experimental results. Ultrasonics Sonochemistry, 8(3), 163–174. https://doi.org/10.1016/S1350-4177(01)00074-8 [Google Scholar] [PubMed] [CrossRef]
33. Thanh Nguyen, T., Asakura, Y., Koda, S., Yasuda, K. (2017). Dependence of cavitation, chemical effect, and mechanical effect thresholds on ultrasonic frequency. Ultrasonics Sonochemistry, 39(6), 301–306. https://doi.org/10.1016/j.ultsonch.2017.04.037 [Google Scholar] [PubMed] [CrossRef]
34. Chen, C., Chen, L., Millero, F. J. (1978). Speed of sound in NaCl, MgCl2, Na2SO4, and MgSO4 aqueous solutions as functions of concentration, temperature, and pressure. The Journal of the Acoustical Society of America, 63(6), 1795–1800. https://doi.org/10.1121/1.381917 [Google Scholar] [CrossRef]
35. Rooze, J., Rebrov, E. V., Schouten, J. C., Keurentjes, J. T. F. (2013). Dissolved gas and ultrasonic cavitation—A review. Ultrasonics Sonochemistry, 20(1), 1–11. https://doi.org/10.1016/j.ultsonch.2012.04.013 [Google Scholar] [PubMed] [CrossRef]
Cite This Article
 Copyright © 2024 The Author(s). Published by Tech Science Press.
This work is licensed under a Creative Commons Attribution 4.0 International License , which permits unrestricted use, distribution, and reproduction in any medium, provided the original work is properly cited.
 Downloads
 Citation Tools