
 Submit a Paper
 Propose a Special lssue
 Open Access
ARTICLE
Influence of Ultra Fine Glass Powder on the Properties and Microstructure of Mortars
School of Civil Engineering, Architecture and Environment, Hubei University of Technology, Wuhan, 430068, China
* Corresponding Author: Wei Chen. Email:
(This article belongs to the Special Issue: Advances in Solid Waste Processing and Recycling Technologies for Civil Engineering Materials)
Fluid Dynamics & Materials Processing 2024, 20(5), 915-938. https://doi.org/10.32604/fdmp.2024.046335
Received 27 September 2023; Accepted 12 January 2024; Issue published 07 June 2024
 View Full Text
 Download PDF
Abstract
This study focuses on the effect of ultrafine waste glass powder on cement strength, gas permeability and pore structure. Varying contents were considered, with particle sizes ranging from 2 to 20 μm. Moreover, alkali activation was considered to ameliorate the reactivity and cementitious properties, which were assessed by using scanning electron microscopy (SEM), energy-dispersive X-ray spectroscopy (EDS), and specific surface area pore size distribution analysis. According to the results, without the addition of alkali activators, the performance of glass powder mortar decreases as the amount of glass powder increases, affecting various aspects such as strength and resistance to gas permeability. Only 5% glass powder mortar demonstrated a compressive strength at 60 days higher than that of the control group. However, adding alkali activator (CaO) during hydration ameliorated the hydration environment, increased the alkalinity of the composite system, activated the reactivity of glass powder, and enhanced the interaction of glass powder and pozzolanic reaction. In general, compared to ordinary cement mortar, alkali-activated glass powder mortar produces more hydration products, showcases elevated density, and exhibits improved gas resistance. Furthermore, alkali-activated glass powder mortar demonstrates an improvement in performance across various aspects as the content increases. At a substitution rate of 15%, the glass powder mortar reaches its optimal levels of strength and resistance to gas permeability, with a compressive strength increase ranging from 28.4% to 34%, and a gas permeation rate reduction between 51.8% and 66.7%.Keywords
The cement industry emits substantial greenhouse gases (GHGs), which account for approximately 5% of global GHG emissions [1] and, notably, 26% of CO2 emissions in the industrial sector [2]. Therefore, using alternative binders to replace cement and mitigate CO2 emissions for climate and environmental reasons is crucial [3–5]. Waste glass is a particularly promising option for recycling and utilizing solid waste materials. Waste glass is a nonbiodegradable material with characteristics such as a high melting point. If improperly disposed of, there is a substantial risk of soil and groundwater contamination [6]. In addition to addressing cement-related environmental concerns, utilizing waste glass in construction provides a practical solution for managing glass waste [7,8]. Previous studies have indicated [9–11] that crushed glass powder contains abundant amorphous silica, as well as chemical constituents such as Al2O3 and Na2O, and has a high specific surface area and good latent pozzolanic properties. By utilizing these features, waste glass powder can replace cement and be a promising eco-friendly binder. This method holds significant potential for addressing comprehensive environmental challenges.
The incorporation of waste glass into concrete mortar has been explored since the 1960s. Initially, researchers replaced coarse aggregates in concrete with crushed glass. However, studies [12–16] have shown that glass can trigger an alkali–silica reaction (ASR) in mortar, causing a gel to form and concrete to expand. Subsequent research [17–19] demonstrated that this phenomenon could be mitigated by reducing the particle size of glass. Incorporating micron-sized glass powder as a cement substitute became vital for preventing the ASR. Lu et al. [20] indicated that finer glass powder improved the interfacial transition zone (ITZ) of mortar and refined the porosity. In addition, the percentage of cement that is replaced by glass powder and the curing time also significantly affect the mortar properties. Wang et al. [21] emphasized that the content of glass powder plays a dominant role in the compressive strength of mortar. Olofinnade et al. [22] investigated the strength activity indices and compressive strength of concrete with waste glass powder replacing cement at varying concentrations. The results demonstrated a substantial increase in compressive strength at a 21% glass powder content. Sharifi et al. [23] conducted similar investigations and reported that the peak strength of concrete was reached when the replacement amount of waste glass particles reached 5% during a curing time of 3–91 days. However, when the waste glass content exceeds 20%, the strength begins to decrease. Gimenez-Carbo et al. [24] confirmed these findings, demonstrating that the strength of glass powder mortar significantly surpassed that of the control group at 7, 28, and 60 days.
Glass powder has the same active ingredients, such as SiO2 and Al2O3, as fly ash [25–27], but glass powder has the potential to enhance glass reactivity in gelling systems [28]. For example, Elaqra et al. [29] demonstrated that soaking glass powder before mixing with cement and aggregates enhances early concrete strength. Chen et al. [10] reported that silica fume can enhance the reactivity of glass powder, thus improving the performance of concrete. Moreover, another avenue for enhancing glass powder reactivity lies in alkali activation [30,31]. Glass powder, which is rich in silica dioxide (SiO2), becomes more soluble with increasing pH, leading to sodium silicate gel formation. Research indicates that alkali activation boosts silica dioxide solubility in fly ash, promoting pozzolanic reactions [32]. In contrast to physical mechanical grinding methods, chemical activation can cleave the Si-O and Al-O bonds on a glass surface, enhancing glass powder reactivity. To solve the problem of the low reactivity of glass powder, it is effective to introduce a defined quantity of alkali. Fraay et al. [33] dissolved aluminum and silicon from fly ash using lime solution. Cyr et al. [34] utilized varying concentrations of NaOH and KOH as alkali activators, bolstering the strength of glass powder mortar. Samarakoon et al. [35] combined an alkali-activated binder with fly ash, slag, and glass powder. An optimal mechanical performance was achieved with a 30% substitution rate. Redden et al. [36] discovered that when glass powder is alkali-activated with NaOH, the presence of calcium in sodium calcium silicate glass fosters the formation of a C-S-H gel.
Although numerous works have investigated alkali-activated glass powder mortar, most related studies have focused on its physical, chemical and mechanical properties. However, few studies have focused on the effect of microstructural changes on gas permeability. The connection between the mechanical properties, gas permeability and microstructure development of mortar with glass powder has not yet been revealed. Therefore, in this study, glass powder with a particle size between 2 and 20 μm after ball milling was used to treat glass powder via an alkali activation method, and glass powder was used to replace 5%, 10% or 15% of the cement. The specific variables under investigation include compressive strength, flexural strength, permeability, and pore structure. Using ultrafine glass powder in concrete mortar enhances the properties of the concrete and reveals potential environmental benefits. Activating waste glass also contributes to environmental protection and sustainable development by solving waste glass treatment challenges.
2.1 Raw Materials and Mortar Preparation
The cement used was Huaxin brand Ordinary Portland Cement (OPC) of grade PO42.5, complying with the Chinese standard GB175-2020 and having a specific surface area of 347 m2/g. The fine aggregate used was local natural river sand with a fineness modulus of 2.63. Fig. 1 shows the particle size distribution curve of the natural sand following the standard “construction sand” GB/T 14684-2022. The glass powder originated from crushed waste glass and was ball milled to an average particle size of 5 to 20 µm. The chemical composition of the waste glass powder was determined using X-ray diffraction (XRD), as Fig. 2 illustrates that the primary constituent of the glass powder was SiO2. The chemical reagent quicklime was analytically pure and in powder form, and the content of calcium oxide (CaO) was ≥95%.
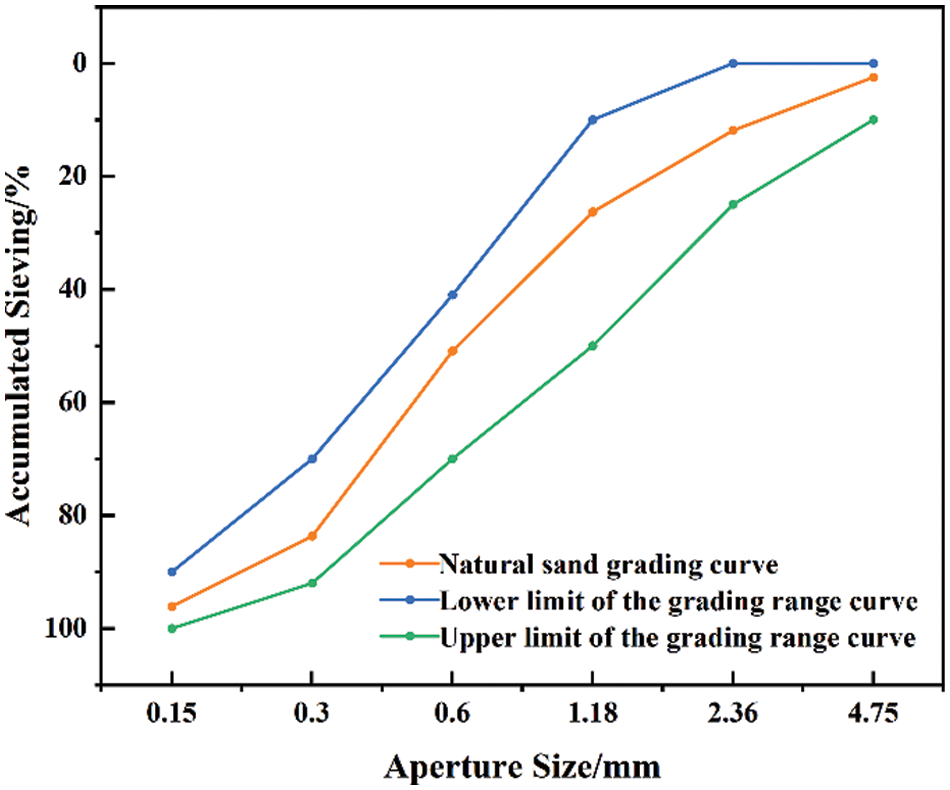
Figure 1: Natural river sand grading curve
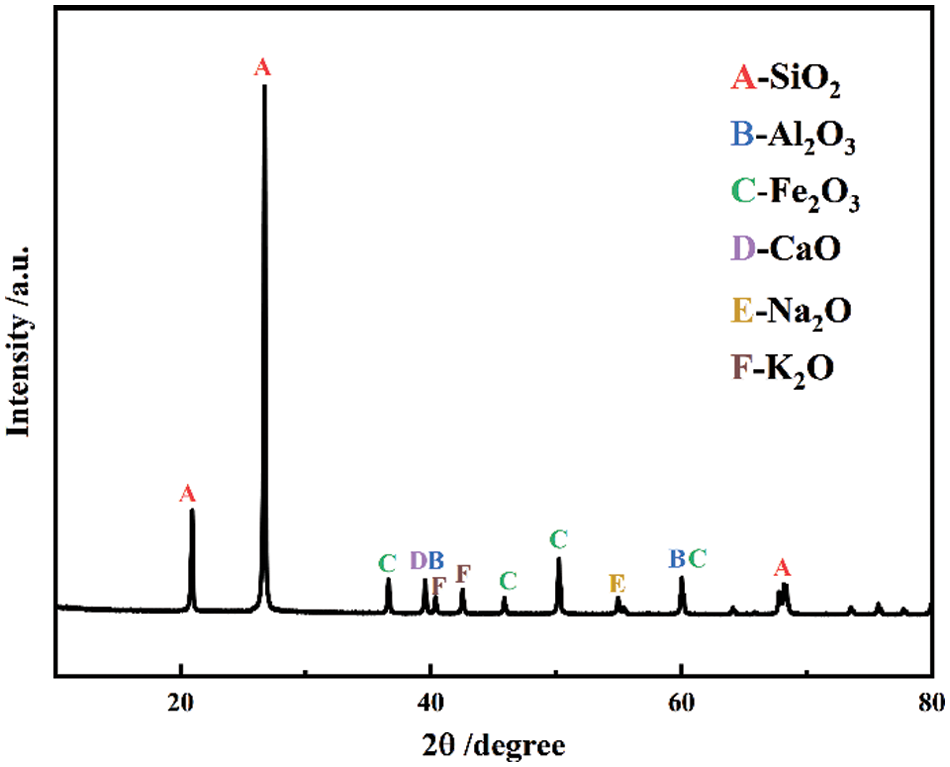
Figure 2: XRD pattern of waste glass powder after grinding
The glass powder content varied from 0%, 5%, 10%, and 15% by cement mass, as noted in G0, G5, G10, and G15, respectively. Before the glass powder and water are mixed into the mortar, 4% alkali activator was added according to the mass of the glass powder, and the results were recorded as G5A4, G10A4, and G15A4 [37]. The mixing proportions for all the experimental groups are detailed in Table 1. The mixtures were prepared with a water-to-binder ratio of 0.5 and cast into mortar samples of different dimensions: 100 mm × 100 mm × 100 mm cubes, 40 mm × 40 mm × 100 mm prisms and 50 mm × 100 mm cylindrical samples. After preparation, the samples were demolded and cured in 20 ± 2°C water. To investigate the influence of curing age on the mechanical properties and permeability of mortar, curing ages of 7, 14, 28, and 60 days were selected. The 50 mm × 100 mm cylinders were finely ground at both ends using a double-sided grinder and dried at 60°C until the mass change was <0.1%.

According to the standards GB/T 50081-2019 “Standard Test Methods for Mechanical Properties of Concrete” and GB/T 17671-2021 “Test Methods for the Strength of Cement Mortar,” compressive and flexural strength tests were conducted on the mortar specimens. The tests were performed using a cement compressive and flexural testing machine (model number DYE-300S) manufactured by China Changzhou Zhulong Engineering Instrument Co., Ltd. (Changzhou, China), as illustrated in Fig. 3. In the compressive strength test, a cubic specimen is placed at the center of the press plate and is uniformly loaded at a rate of 0.3 MPa/s until the specimen fails. In the flexural strength test, a prismatic specimen is positioned on a cylindrical support in the testing machine, with the long axis of the specimen perpendicular to the cylindrical support. This arrangement facilitates the even distribution of the load along the specimen width direction. The load is uniformly applied vertically to the side of the prismatic specimen at a rate of 50 N/s until it fractures.
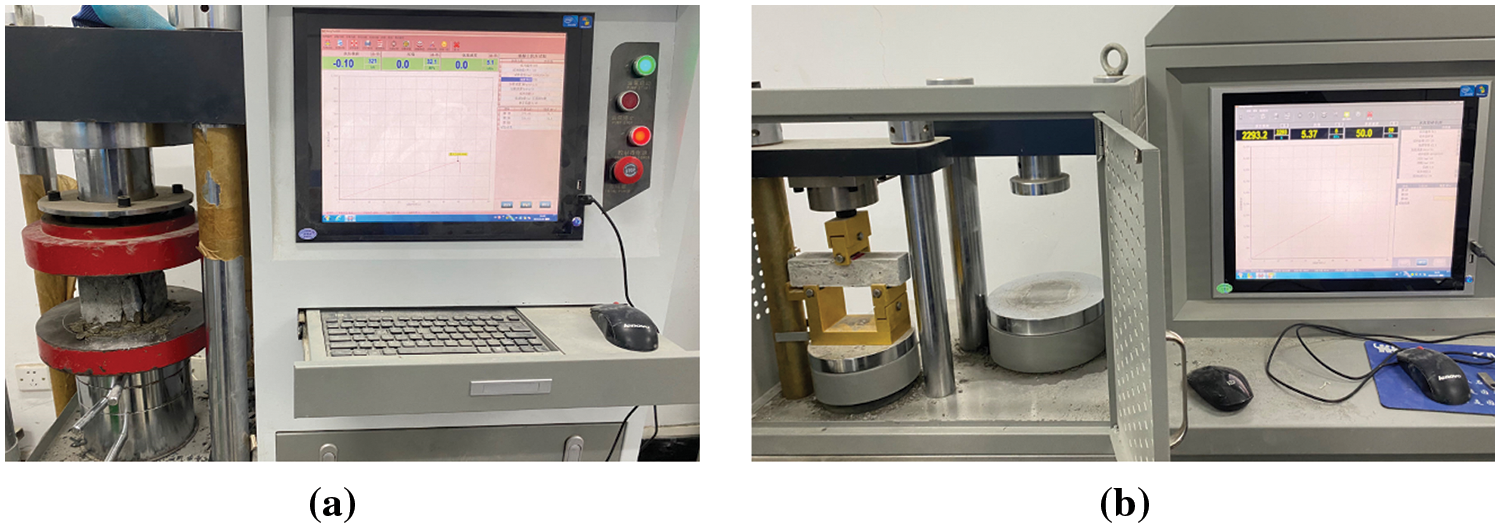
Figure 3: Mechanical test device: (a) compressive strength test; (b) flexural strength test
Gas permeability tests employed a precise, hermetically sealed gas permeation system imported from France. This instrument, which is a proprietary development of the laboratory, is specifically designed for gas permeability testing [38,39]. This system consists of a confining cell, gas holder and control unit, computer-based data acquisition, and a confining pressure servo pump. It can reach a maximum confining pressure of 60 MPa and measure permeability down to 10−22 m2. The experiment used argon, a colorless, odorless monatomic inert gas that permeates easily in low-permeability media. Three gas pressures (5, 10, and 15 bar) and various confining pressures (3, 5, and 10 MPa) were tested to determine the intrinsic permeability. Fig. 4 shows the device for measuring the gas permeability of mortar materials. Fig. 5 shows a simplified schematic of the gas permeation system employed in the experiment.
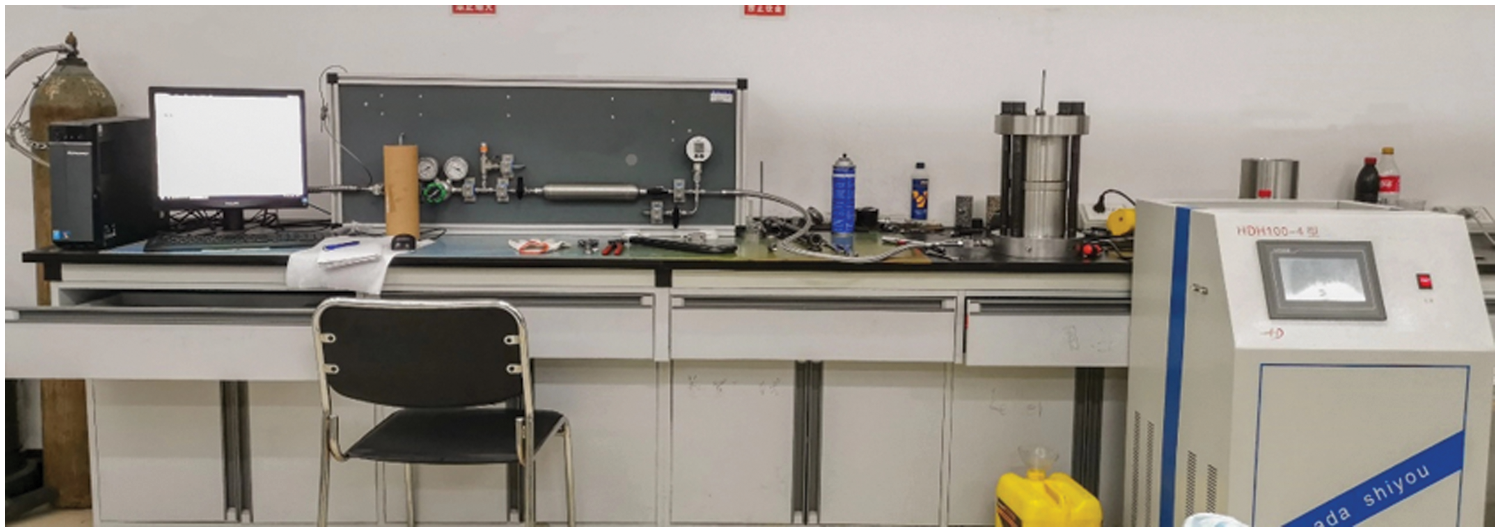
Figure 4: Gas permeation equipment

Figure 5: Schematic diagram of the gas penetration test device
Gas permeability tests employed the one-dimensional steady-state flow method based on Darcy’s law principle and represented by the simplified equation:
where Vx is the average flow velocity of gas along the axis, Kapp is the apparent gas permeability rate, μ is the viscosity coefficient of argon gas (Pa∙s), and P(x) is the function describing the variation in internal gas pressure with sample height.
The experimental procedure involved supplying a stable inlet pressure using a gas storage tank at the inlet port, with the outlet port maintained at atmospheric pressure. Within a certain timeframe, the average flow rate through the sample is determined as follows:
where Qmean is the average flow rate at the inlet (m3/s); Vr is the volume of the gas storage tank; ∆p is the initial pressure difference between the inlet port and the final pressure; Pmean is the average pressure at the inlet (MPa); and ∆t is the time interval for a constant flow rate.
By combining Eqs. (1) and (2), the formula for calculating the apparent gas permeability coefficient is derived as follows:
where h is the height of the sample (mm), A is the cross-sectional area of the sample (m2), and P0 is the atmospheric pressure.
If the average free path of gas molecules approaches the pore size, a phenomenon known as the “boundary slip effect” may occur. This effect is due to slip flow of compressible gas at the capillary wall. The velocity at the pore walls is no longer zero. When the pore diameter is on the same order of magnitude as the mean gas free path, slip flow occurs. Therefore, to measure the intrinsic permeability, Klinkenberg et al. proposed a correction factor denoted as “
where Kapp is the apparent gas permeability (m2), Kint is the intrinsic gas permeability (m2), and
XRD was conducted using an Empyrean X-ray diffractometer from Malvern Panalyticala, as shown in Fig. 6. The instrument’s high-pressure emitter operated at V = 45 kV and A = 40 mA, with a current-voltage stability better than 0.005%. The 2θ scanning range was set between 5° and 60°, and the scanning speed was 5°/min. Before the test, the dry mortar samples were ground to pass through a 200 mesh sieve. The XRD method was used to obtain diffraction peaks corresponding to the hydration products of the mortar samples.

Figure 6: X-ray diffraction experimental device
Scanning electron microscopy (SEM) is a microscopic technique employed for observing the surface morphology and microstructure of materials. Energy dispersive X-ray spectroscopy (EDS) analyzes the elemental composition by detecting X-rays at the sample surface. A Hitachi SU8010 high-resolution field emission scanning electron microscope was used to characterize the mortar samples. Before SEM analysis, the samples were dried in a 60°C oven for 8 h. Thin 5 mm × 5 mm × 2 mm sections were taken from the interior of the mortar samples, subjected to vacuum freezing and gold sputtering, and subsequently analyzed with an instrument. In addition, the microscopic structural differences and elemental variations in three groups of glass powder mortar, G0, G5, and G15A4, were investigated through SEM-EDS analysis. Fig. 7 shows a picture of the SEM-EDS test.
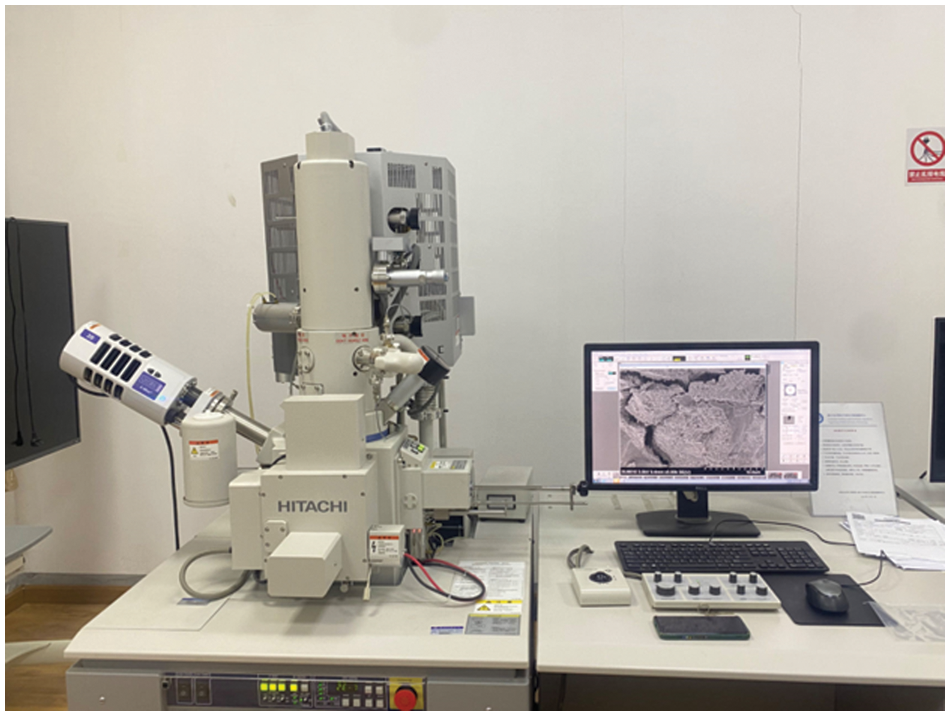
Figure 7: Picture of the SEM–EDS test
2.2.5 Specific Surface and Pore Distribution Test
The specific surface area and pore size distribution are used to characterize the porous structure and pore size distribution of materials. This experiment utilized a fully automatic specific surface area and pore size analyzer (model number 3H-2000PS1) manufactured by Beijing Best Instrument Science and Technology Co., Ltd., Beijing, China. It is capable of determining the pore size and distribution of glass powder mortar materials, as shown in Fig. 8. Before the experiment began, the glass powder mortar was dried in a 65°C oven for 24 h or more. The samples were then cooled to room temperature and placed on a degassing platform. Pretreatment included heating at the degassing station for 3 h at 120°C to remove absorbed moisture, impurities, and substances. After degassing, the samples were placed on the testing platform. Liquid nitrogen with a purity >99.99% was used, and the temperature was −196°C. The pore volume and pore size distribution were determined by the Barrett–Joyner–Halenda (BJH) method.
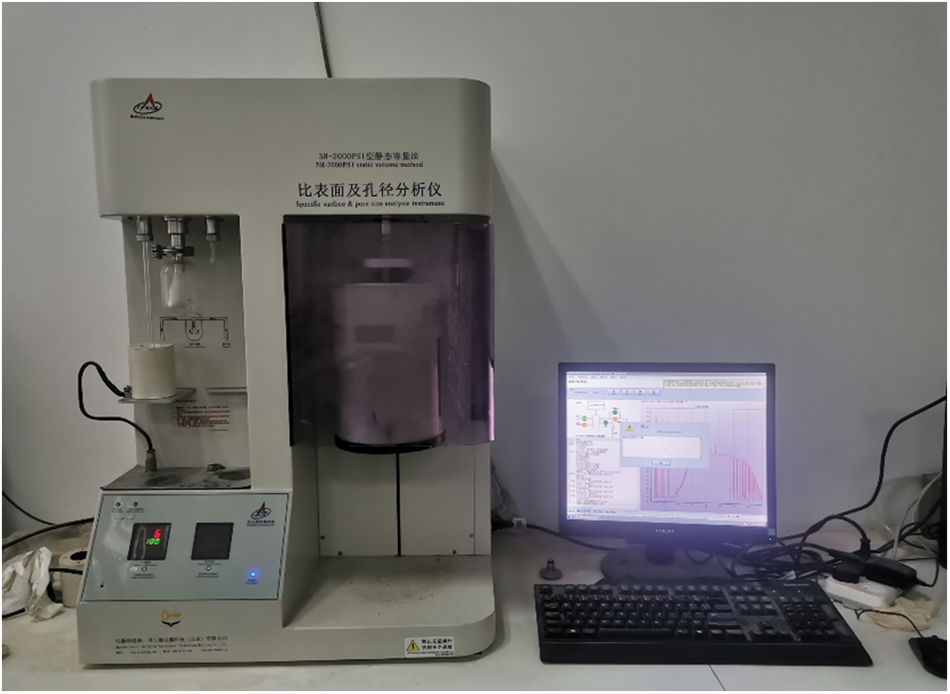
Figure 8: Specific surface and pore size analysis instrument
3.1.1 Effect of the Curing Age
Fig. 9 illustrates the strength variation between different curing ages. Cement mortar exhibits an overall increasing trend in compressive and flexural strength as the curing age increases. Without alkali activation, the glass powder mortar exhibited a lower average strength than the control mortar at 7, 14, and 28 days. Notably, the mortar with 5% glass powder has a greater strength than the control group at 60 days. Incorporating waste glass powder into the mortar improved its strength at a later stage. This is mainly because of the nature of waste glass powder and its higher specific surface area compared to cement, which densifies the microstructure of the mortar by filling, improving the transition zone (ITZ) between the aggregate and cement. However, when the waste glass powder content exceeded 10%, the strength decreased. During the hydration process, excessive silica leaching may occur due to the presence of more waste glass than is required in combination with free lime. This excess silica replaces the binder material, reducing the concrete strength [23]. Glass powder mortar with an alkaline activator consistently exhibited higher strength across all curing ages than did the control group, signifying greater reactivity. Notably, the strength increase is prominent in the early stages (7–14 days), possibly due to alkaline activators initiating waste glass activation. Active SiO2 reacts with Ca(OH)2 from cement hydration, forming hydrated calcium silicate and other precipitates on glass particle surfaces and enhancing cohesiveness and strength. Although the strength development at 28 days and 60 days was not as pronounced as that at early ages, as the duration of curing increased, Ca2+ ions continued to diffuse into the interior through the surface of the glass particles and precipitate on their surfaces, exerting a pozzolanic effect. The flexural strength curve closely aligns with the compressive strength curve. Generally, the G15A4 group exhibited the highest strength, followed by the G5 group without alkali activation. There are still slight discrepancies in achieving optimal flexural and compressive strength for glass powder mortars at certain curing times and replacement levels. A difference in flexural and compressive strength could be the result of different mechanisms. As a result of interparticle bonding within the mortar, flexural failure is primarily caused by tension [41]. On the other hand, compressive failure is caused by pressure, which is determined by the strength of individual particles and interparticle bonding within the mortar. Therefore, this disparity might have divergent impacts on the flexural and compressive properties of the mortar.
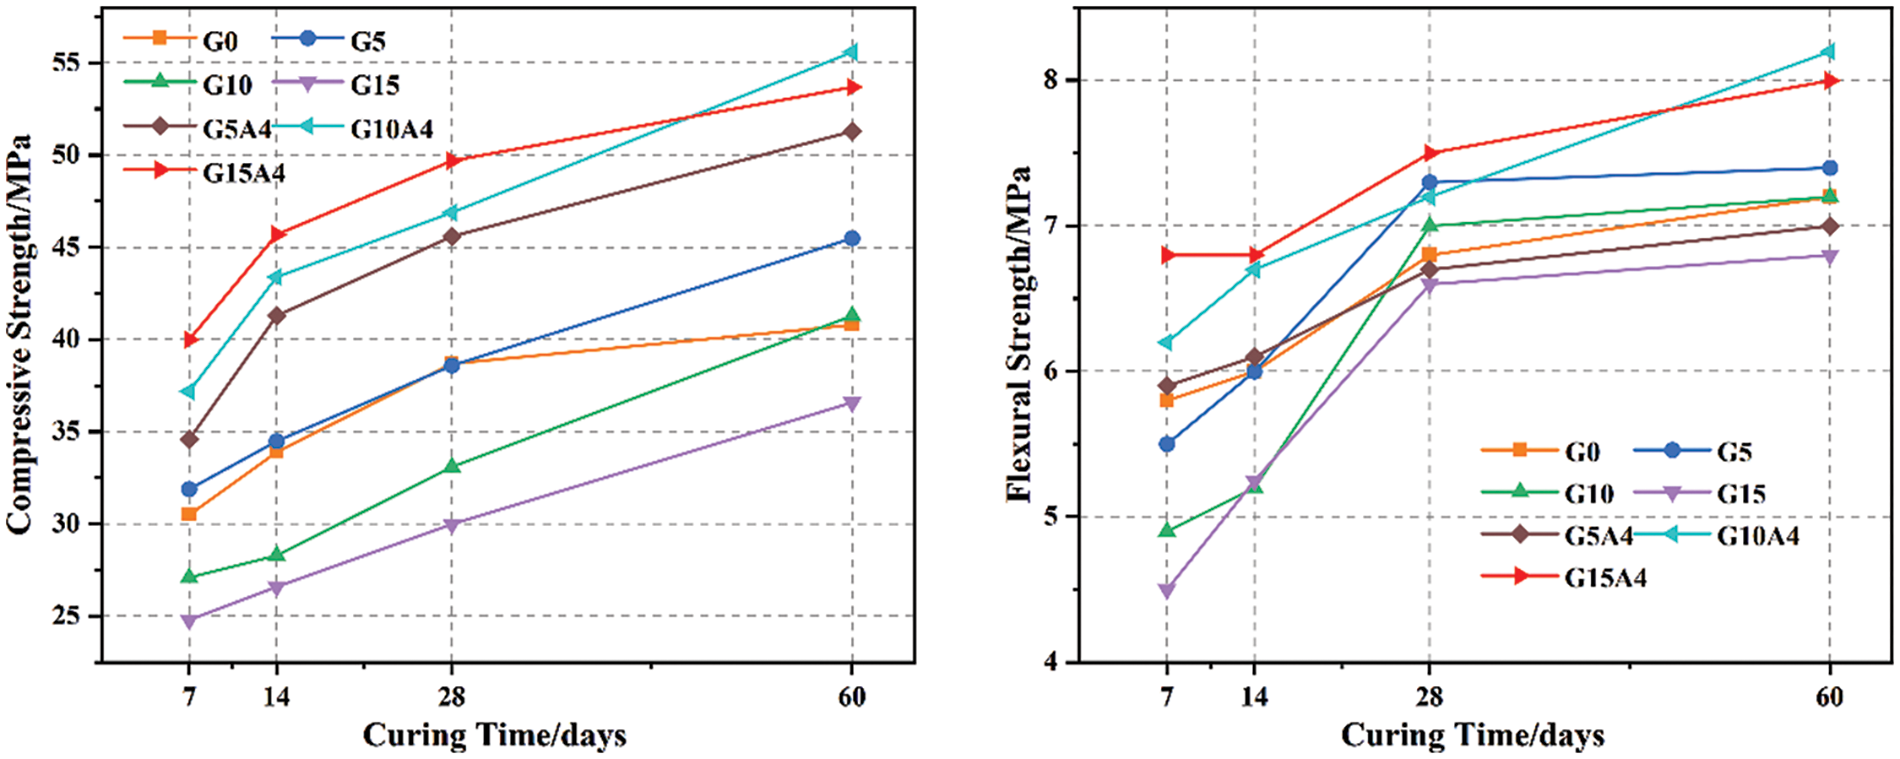
Figure 9: Development law of glass mortar strength with curing age
Fig. 10 shows the effect of the activator on the mortar strength at various ages with varying glass powder contents (0%–15%). Glass powder is primarily composed of SiO2, an acidic oxide with weak alkaline properties. With alkali activators, the acid–base equilibrium of the mortar system can be adjusted, and the alkalinity can be elevated, which enhances the hydration activity of glass powder. In an alkaline environment, SiO2 in glass powder reacts with hydroxide ions (OH−) in water to form calcium silicate hydrate (C-S-H). The hydration reaction has a high activation energy, generating additional hydration products.
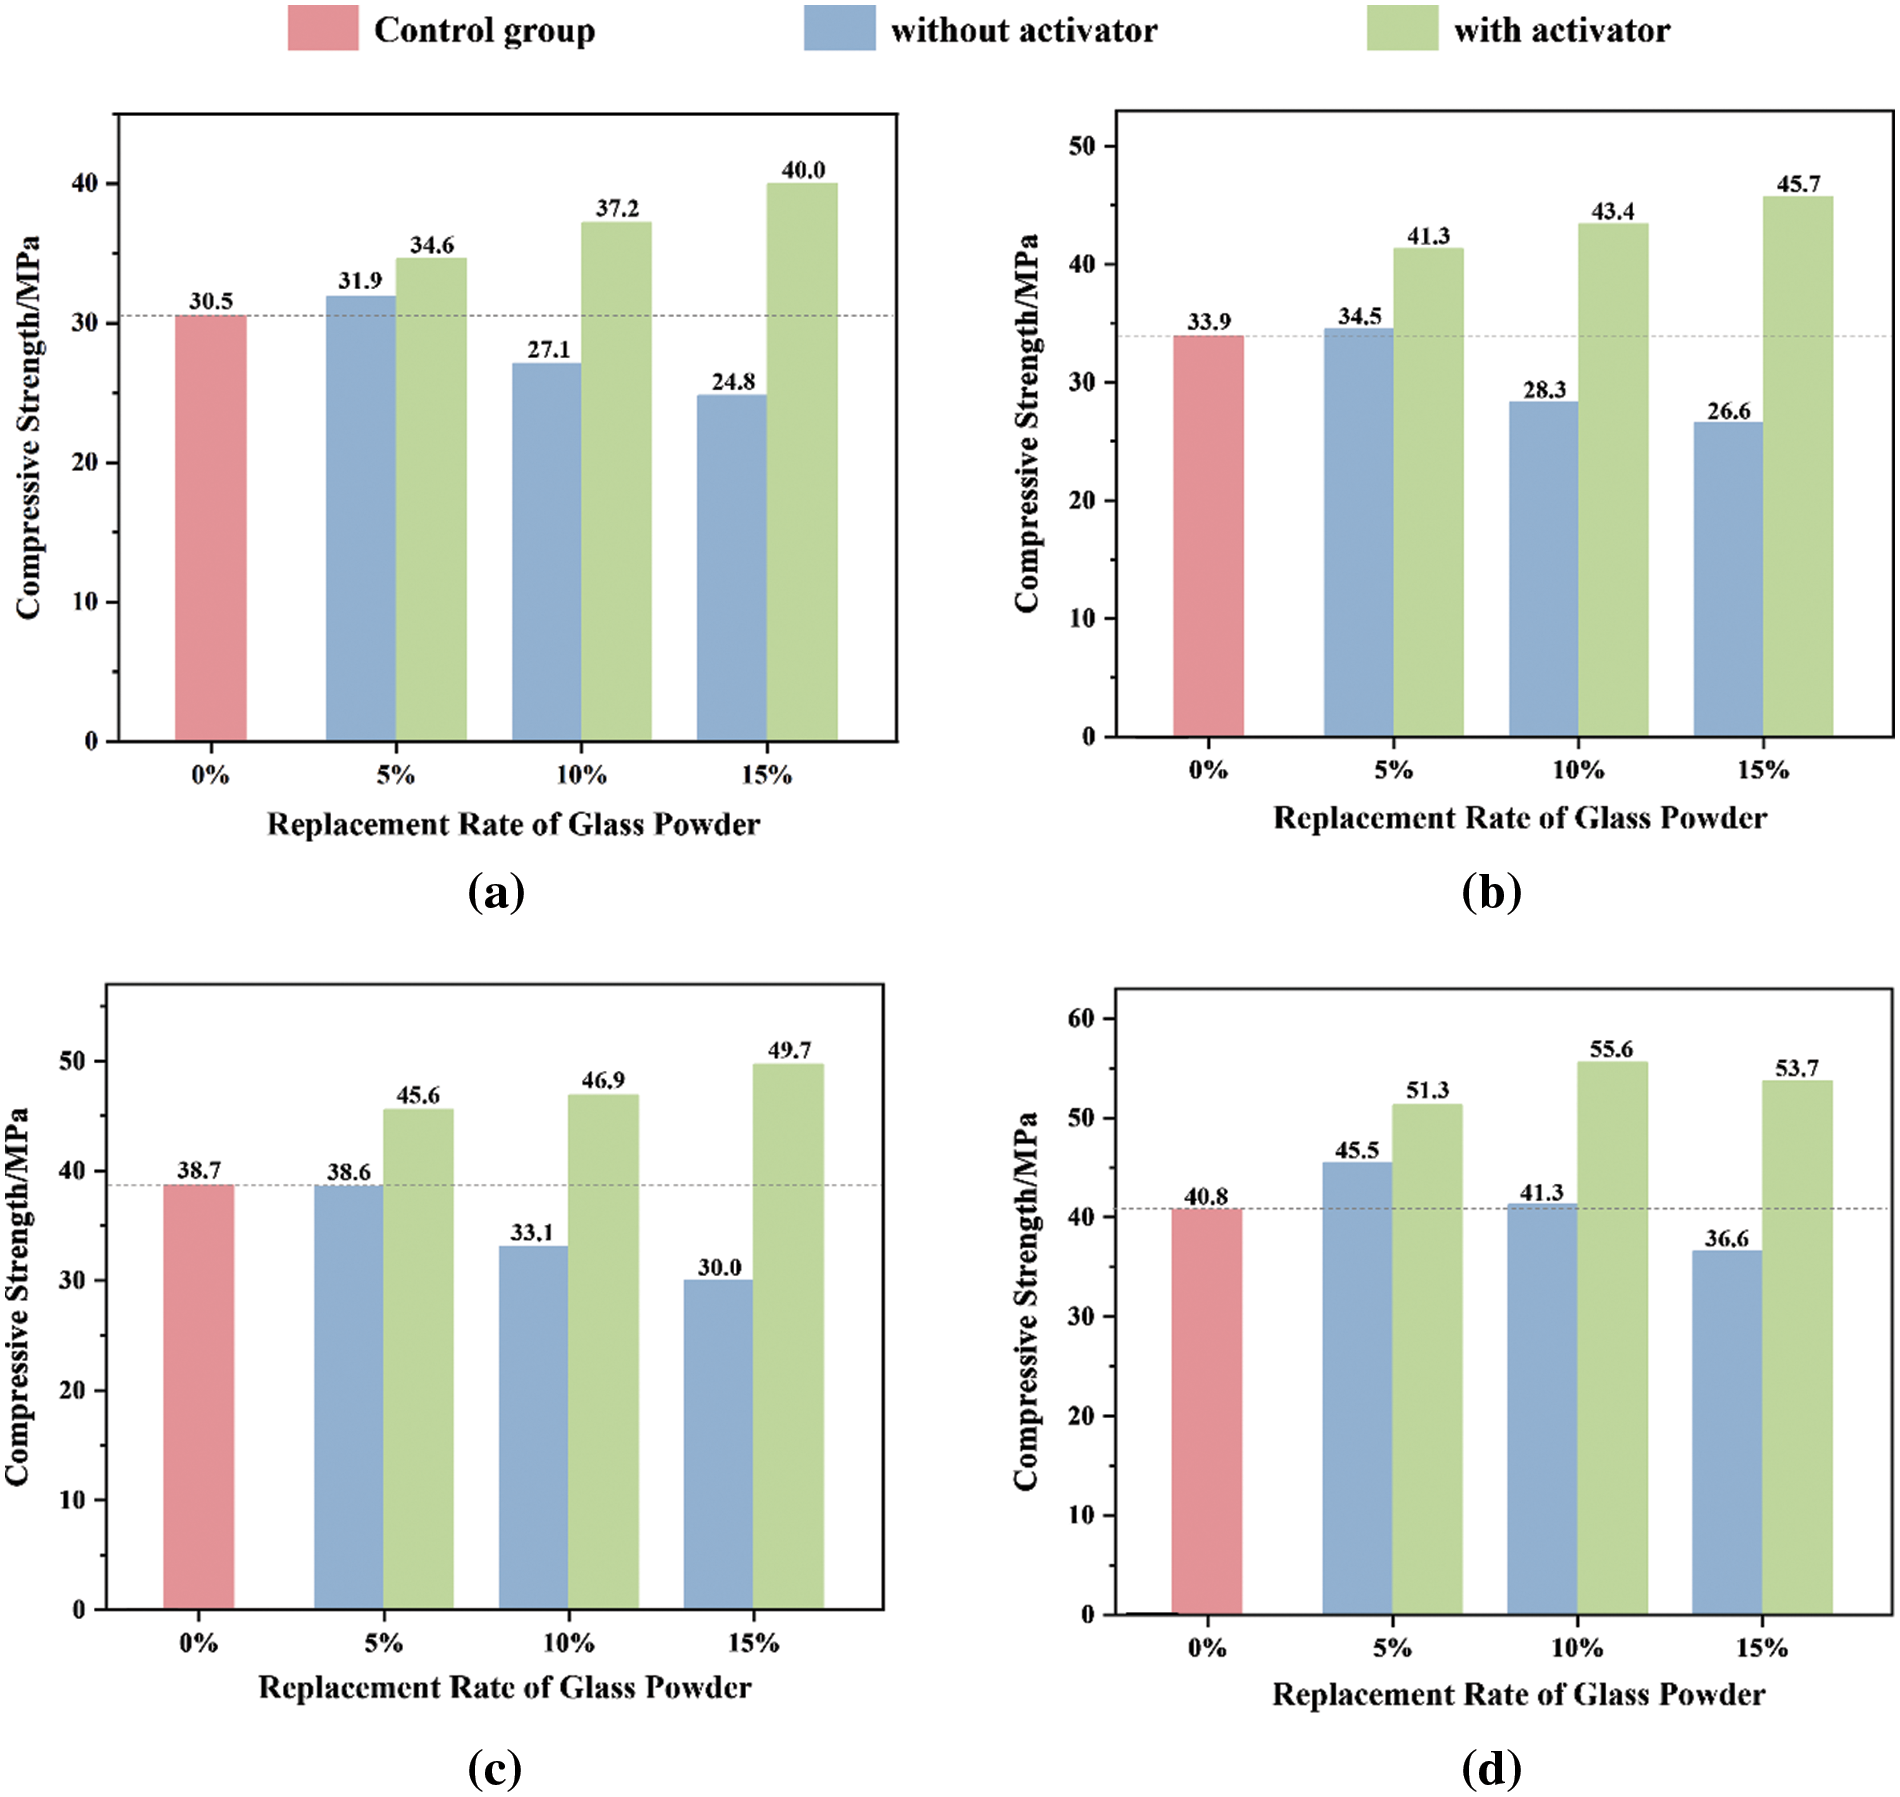
Figure 10: Effect of activator on compressive strength of glass mortar: (a) 7 days; (b) 14 days; (c) 28 days; (d) 60 days
The compressive strength decreases with increasing glass powder content. Despite the similar performance of G5 to that of the control group (G0), after 60 days of curing, the compressive strength reached 45.5 MPa. This is due to the small particle size of the glass powder, which can effectively fill voids within a certain amount, enhancing the compactness of the mortar and consequently increasing its strength in later stages. However, when an excess of glass powder is added, the alkalis in the glass powder and cement can easily undergo alkali–silica reaction (ASR) expansion with the SiO2 in the glass powder. Compared to that of the control group (G0), the compressive strength of the G10 and G15 groups decreased by 9.2%–16.5% and 10.3%–22.5%, respectively, during the curing process. Even if the water-to-binder ratio remains constant, an increase in the glass powder content results in a decrease in the cement content, which subsequently elevates the water-to-cement ratio. Since porosity is related to the water-to-cement ratio, a higher porosity may have an adverse effect on compressive strength [42]. This could also explain the decrease in compressive strength observed in the G10 and G15 groups.
Increasing the glass powder content reduces the strength of glass powder mortars; however, alkali activators may ameliorate this phenomenon. The strength of the activated glass powder mortar increased with increasing glass powder content at all curing ages. Compared to those in the control group (G0), the G5A4, G10A4, and G15A4 groups exhibited strength enhancements of 13.4%–25.7%, 21.1%–36.2%, and 28.4%–34%, respectively. This phenomenon may stemmed from the incorporation of calcium oxide, which elevated the alkalinity of the overall composite system. Glass powder has a stable [SiO4]4− network structure that prevents its reactivity from being easily released. However, when activated in an alkaline environment, it initiates the formation of active Si-O, giving rise to the (C-S-H) gel. This process can be divided into two steps: initially, calcium oxide reacts with water, generates lime and undergoes curing, with the resulting Ca(OH)2 deemed an intermediate product (this reaction is delineated in Eq. (5)). Subsequently, the glass powder underwent a secondary hydration reaction with Ca(OH)2, as illustrated in Eq. (6). Consequently, the addition of alkaline activators can accelerate the hydration reaction of cement, producing additional hydration products, which helps to improve strength [11]. Mortars containing 15% activated glass powder (G15A4) demonstrated optimal strength after 28 days of hydration. However, as shown in Fig. 10d, with a curing time of up to 60 days, the activator effect diminishes, and the mortar with a 10% content (G10A4) exhibits the greatest strength. This could be attributed to the increased amount of Ca(OH)2 generated from the reaction between CaO and water as hydration progresses. At this point, the Ca(OH)2 generated could have reached saturation and crystallized, leading to expansion in the composite mortar system. In summary, alkali-activated glass particles play a role in enhancing the cohesiveness and strength of cementitious materials. The application of these active glass particles could enhance the mechanical properties and durability of the materials.
Table 2 and Fig. 11 show the gas apparent permeability (K) of all test samples under a constant confining pressure (Pc) of 3, 5, and 10 MPa subjected to three different inlet pressures (Pi) of 5, 10, and 15 bar. The gas apparent permeability was determined using Eq. (3).


Figure 11: Relationships between the inlet pressure and apparent permeability of glass mortar: (a) G0, (b) G5, (c) G10, (d) G15, (e) G5A4, (f) G10A4, and (g) G15A4
Based on the gas apparent permeability presented in Table 2 and Fig. 11 and in conjunction with the Klinkenberg theory, the intrinsic permeabilities of the samples are corrected using Eq. (4). This is shown in Table 3.

3.2.1 Variation in the Intrinsic Permeability of Glass Mortars
A variation relationship curve for the intrinsic permeability of glass powder mortar is shown in Fig. 12. Glass powder mortars, whether activated or nonactivated, exhibit contrasting trends in gas permeability coefficients with increasing glass powder content. The permeability of the control group (G0) at an initial confining pressure of 3 MPa is 2.191 × 10⁻¹⁷ m2. Mortars containing 5%, 10%, and 15% glass powder have permeabilities of 2.135 × 10⁻¹⁷ m2, 2.377 × 10⁻¹⁷ m2, and 3.238 × 10⁻¹⁷ m2, respectively. The permeability of Group G5 was similar to that of the control Group G0, indicating that glass powder can replace cement and serve as a filler under certain circumstances. Nevertheless, an excessive glass powder content restrains pozzolanic reactivity and has negative effects. According to Fig. 12, the permeability of Group G10 increases slightly, whereas with an increase in the glass powder content to 15%, the permeability significantly increases. It is important to note that waste glass powder has limited activity, and an excessive amount may not have the ability to participate effectively in the cement hydration process. The hydration reaction becomes insufficient when cement is replaced by excess glass powder, resulting in a more porous structure. Consequently, as the glass powder content increases, the gas permeabilities of Groups G10 and G15 increase significantly.
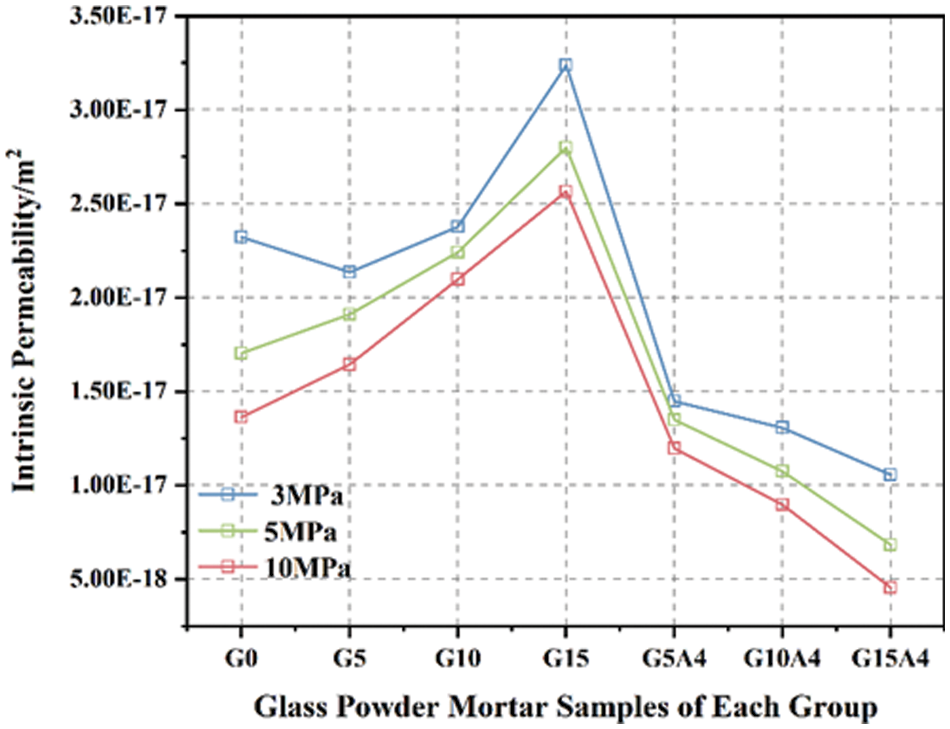
Figure 12: Changes in the intrinsic permeability of glass mortar
Activated glass powder exhibits characteristics different from those of nonactivated samples. As the glass powder content increases, the gas resistance significantly improves, especially in Groups G10A4 and G15A4, where the gas permeability changes by an order of magnitude under varying confining pressures. Compared with the control group, G15A4 exhibited the greatest resistance, with a reduction in gas permeability of 51.8% to 66.7%. Activated glass powder demonstrates enhanced reactivity as a result of alkali activation, which results in a more thorough reaction with the Ca(OH)2 generated during cement hydration. Through pozzolanic reactions and the glass powder filling effect, the mortar porosity is reduced, the pore size distribution is optimized, and the cement mortar is densified. Evidently, activated glass powder effectively alters mortar gas permeability, regulating and enhancing mortar concrete durability. In Fig. 13, the relationship between the intrinsic gas permeability and compressive strength is shown under an initial confining pressure of 3 MPa. The figure illustrates the linear relationship between the intrinsic gas permeability and compressive strength. This study revealed that these two parameters exhibit a linear decreasing trend, with a high coefficient of determination (R2 = 0.9336), which is indicative of a strong correlation between them. This study suggested that the compressive strength of glass powder mortar decreases with increasing intrinsic gas permeability. An elevated gas permeability implies an increased number of interconnected pores within the mortar, leading to a more porous internal structure. The porous structure of mortar reduces its compressive strength and weakens its mechanical performance. As a result, we can evaluate the degradation pattern of the mechanical properties of mortar by investigating its gas permeability. This means that gas permeability can be used to predict glass powder mortar compressive strength, which facilitates its evaluation and optimization.

Figure 13: Linear fitting of the intrinsic permeability and compressive strength under the initial confining pressure
3.2.2 Effect of Confining Pressure on Intrinsic Permeability
As shown in Fig. 14, the confining pressure significantly influences the gas permeability of glass powder mortar. All the samples exhibit the highest gas permeability at low confining pressures, which gradually decreases as the confining pressure increases. As the confining pressure increases from 3 to 5 MPa, the gas permeabilities of the samples decrease by 22.2%, 10.5%, 5.6%, 13.6%, 6.7%, 17.8%, and 35.3%. When the confining pressure is increased from 5 to 10 MPa, the gas permeabilities decrease by 20%, 14%, 6.4%, 8.3%, 11.3%, 16.6%, and 33.5%. The impact of confining pressure on the gas permeability of glass powder mortar primarily stems from alterations in the internal pore structure of the mortar. Glass powder mortars experience compression under confining pressure, resulting in reduced volume and internal structural contraction. In this way, pores, fissures, and permeable pathways are closed, resulting in a decrease in gas permeability. In addition, the gas permeability decreases fastest when the confining pressure increases from 3 to 5 MPa. Upon an initial confining pressure of 3 MPa, the sample’s internal pores are most relaxed, presenting numerous interconnected pores and pathways for gas to permeate. Therefore, the most significant permeability change occurs during this phase. As the confining pressure increases, larger pore channels and structural features within the sample are already closed. Because of the limited changes in the internal pore structure, the changes in gas permeability at higher confining pressures are more gradual. It is evident that the gas permeability and durability of glass powder mortar are not only determined by its inherent pore structure but also affected by the mechanical environment, such as the confining pressure.

Figure 14: Relation between the inherent permeability of glass mortar and confining pressure
The crystalline phase composition of the hydration products in the mortar samples containing glass powder was studied via XRD. As shown in Fig. 15, the XRD spectrum represents glass powder mortar samples. The different groups of glass powder mortar samples exhibited similar diffraction peaks, indicating similar compositions of hydration products, including ettringite, silica (SiO2), calcium hydroxide (Ca(OH)2), and calcium sulfate hydroxide (C-S-H).

Figure 15: XRD patterns of the glass mortar samples
The diffraction peak 3 represents the formation of ettringite, indicating that the material ratios used generated ettringite substances. As mentioned earlier, glass powder contains a large amount of amorphous silica, and in an alkaline environment, glass powder can exhibit higher reactivity. Silica reacts with the Ca(OH)2 generated by alkali-activated glass powder mortar to undergo pozzolanic reactions for secondary hydration. Therefore, the consumption of Ca(OH)2 is an important indicator of the degree of volcanic ash reaction in the material matrix [43]. Additionally, an increase in the content of alkali-activated glass powder will reduce the amount of cement available for hydration reactions, leading to a reduction in Ca(OH)2 [44]. These two factors together led to smaller CH diffraction peaks for G5A4, G10A4 and G15A4 than for the other groups, and with increasing glass powder content, the CH diffraction peak intensity of the alkali-excited glass mortar gradually decreased (G5A4 > G10A4 > G15A4). Diffraction peak 1 represents SiO2, and each group of glass mortar in the figure shows a strong SiO2 peak, which may be caused by the high content of SiO2 in the sand in the mortar, so the C-S-H peak packet of diffraction peak 2 appears relatively low. Compared with that of the control group (G0), the diffraction peak 1 (SiO2) of the other groups was more intense because the main component of the glass powder was SiO2, resulting in a high SiO2 peak in the sample with added glass powder. When silica is released into the solution, it undergoes a pozzolanic reaction with Ca(OH)2, generating a large amount of dense C-S-H gel. This C-S-H gel structure can effectively fill pores and improve the strength of the mortar. The figure shows that the peak corresponding to diffraction peak 2 (C-S-H) is the highest in G5A4, G10A4 and G15A4. This is consistent with the results of the mechanical experiments; after alkali activation, the three groups of glass powder exhibited greater strength.
Fig. 16 shows the microstructure of the glass powder mortar after 28 days of curing for the different sample sizes. The internal morphology of the mortar exhibited a variety of hydration products, including lamellar and plate-like calcium hydroxide (Ca(OH)2), needle-like ettringite, and flocculent calcium silicate hydrate (C-S-H). Additionally, microcracks can be observed, and these microstructural features significantly affect the mortar properties. Fig. 17 shows EDS comparison images for the control group (G0), the G5 group demonstrating optimal performance in mechanical and gas permeability tests, and the G15 group exhibiting optimal performance after activation. This figure shows the results of energy dispersive X-ray spectroscopy (EDS) used to analyze and compare the major elements within the mortar samples.

Figure 16: Scanning electron microscopy images of glass mortar samples: (a) G0, (b) G5, (c) G10, (d) G15, (e) G5A4, (f) G10A4, and (g) G15A4
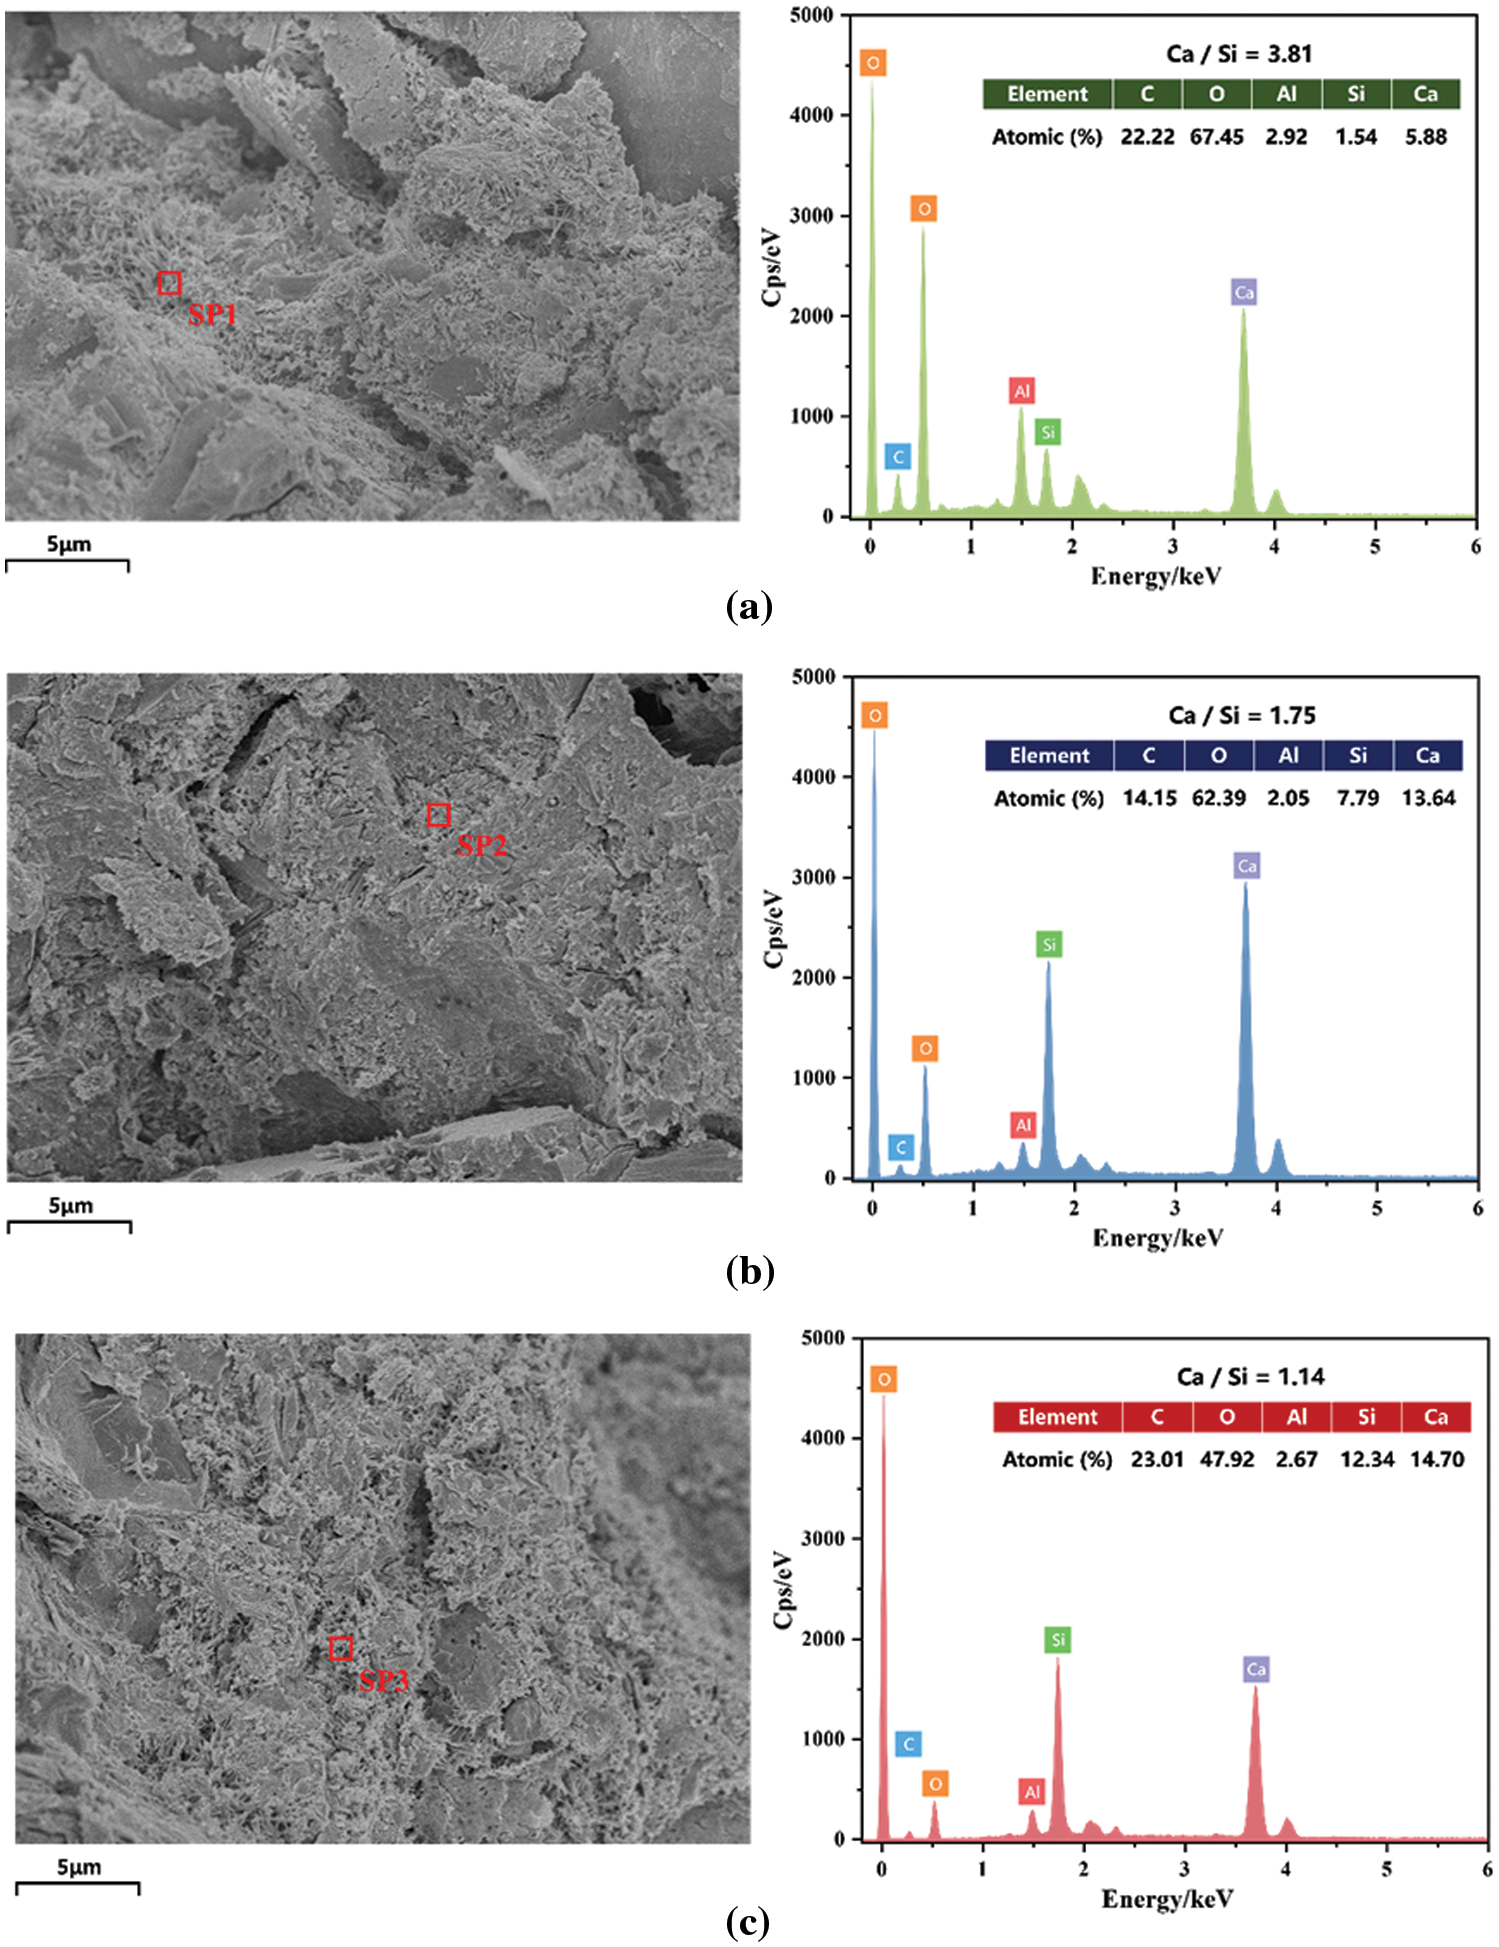
Figure 17: Scanning electron microscopy-energy dispersive X-ray spectra of (a) G0, (b) G5, and (c) G15A4
Fig. 16a shows that the microstructure in the control group is relatively compact, with only a small amount of needle-like ettringite crystals and Ca(OH)2 products. There are several pores and cracks within the mortar, and the C-S-H gel appears flocculent. Compared to the mortar with 5% glass powder content (Fig. 16b), the mortar with 5% glass powder content has more hydration products and a greater generation area of ettringite and calcium silicate hydrate. As the glass powder content increases from 10% to 15% (Figs. 16c and 16d), the amount of capillary water decreases due to the adsorption of water by the glass powder, causing the cement to require additional water for hydration. Cement hydration and pozzolanic reactions are somewhat restricted. A mortar containing a high content of glass powder still produces hydration products, but the internal structure becomes more porous, resulting in an increase in the number and size of pores. The results of the mechanical tests and gas permeability tests mentioned above are consistent with this conclusion; microcracks and pores result in decreased strength, and increased microcracks adversely affect gas permeability. Figs. 16e–16gshow the results of activation treatment on glass powder mortar, which has a denser structure with fewer internal pores and microcracks. The content of Ca(OH)2 in the glass powder treated with alkaline excitation significantly decreased, which can also be observed in the XRD pattern (Fig. 15). This suggests that alkali activators not only enhance the hydration of cement but also promote pozzolanic reactions in glass powder, resulting in secondary hydration reactions that enhance the strength of the system. When too much glass powder is added to the mortar, a porous microstructure is formed, inhibiting the pozzolanic effect of the powder. As a result of the alkaline activation treatment of glass powder, this phenomenon can be ameliorated, thus allowing the aggregate filling and pozzolanic effects of the glass powder to be fully utilized.
Fig. 17 shows the results of the EDS analysis, with red markers indicating the test points. In Fig. 17a, the cement mortar of the control group contains primary elements such as C, O, Al, Si, and Ca. By substituting glass powder for cement, the predominant elemental composition of the cement mortar does not change (Figs. 17b and 17c). Notably, there was a change in the calcium-to-silicon ratio (Ca/Si) of the hydration products throughout the system. This ratio indirectly reflects the extent of cement hydration, and the reaction between waste glass powder and the pozzolanic Ca/Si ratio can be used to determine the degree of reaction between cement and waste glass powder in mortar. Understanding the activity of glass powder in mortar and its interaction with cement is highly important. According to Eq. (7), the hydration reaction of cement primarily produces calcium silicate hydrate (C-S-H) and calcium hydroxide (Ca(OH)2). However, glass contains a significant amount of amorphous silica. Amorphous silica is the most prominent pozzolanic component. A secondary hydration reaction is induced by the reaction of glass with calcium hydroxide released during cement hydration, leading to the formation of secondary calcium silicate hydrates, as demonstrated in Eq. (6). In Figs. 17b and 17c, pozzolanic reactions occur when glass powder is used as a supplementary cementitious material to replace a portion of the cement in the mortar. It consumes Ca2+ and OH- in the mortar system and reacts with reactive amorphous silica, which decreases the Ca/Si ratio during cementing. In particular, the Ca/Si ratio in the G15A4 group was even lower (Fig. 17c). Two potential reasons might contribute to this phenomenon. First, the addition of glass powder reduces the actual cement content, resulting in a reduced contact area between the cement particles and water, thereby lowering the content of Ca(OH)2. Second, the pozzolanic reaction involving SiO2 in glass powder consumes Ca(OH)2 and generates additional C-S-H, which is observed to exhibit a flocculent structure on a microscopic level. This structure also increases the material density and reduces the number of internal pores. In summary, glass powder plays a critical role in the reduction of Ca(OH)2 content. It also promotes the formation of C-S-H and ettringite, thereby increasing the microstructural properties of the material. As a result of these changes, the mortar density and permeability are improved, thereby enhancing the mortar’s mechanical performance and durability.
A high porosity adversely affects the mechanical properties of cement-based materials. Generally, materials with high porosity contain a significant number of void spaces, contributing to a loose structure and thereby restricting the materials’ performance under load-bearing conditions. Moreover, the distribution of pore sizes plays a crucial role in determining both the strength and permeability of mortar [45]. The uneven distribution of pore sizes can lead to the concentration of internal stresses within the material and discontinuities in diffusion paths. This phenomenon could result in nonuniform strength or localized damage to the material. The distribution of pore sizes determines the pathways for fluid or gas flow and diffusion within a medium. Unreasonable pore size distributions may increase the susceptibility to permeation or increase the rate of permeation, ultimately compromising the material’s durability. By using the BJH method, pore size data were determined for glass powder mortars. As indicated in Table 4, D10 and D90 are the pore diameters corresponding to 10% and 90% of the cumulative pore volume, respectively. When the glass powder content of the waste glass powder mortar increased, the pore diameter increased. Although mortars with 5% and 10% substitution have smaller pore diameters than those of the control group, the D90 pore diameter of the G15 group is 3.2676 nm larger than that of the control group. On the other hand, the pore diameters of glass powder mortars subjected to activation tend to decrease with increasing glass powder content and are smaller than those of control mortars. When the content reaches 15%, the D90 pore diameter is 6.278 nm smaller than that of the control group. Similar variations are observed in the data for the average pore diameter, which indicates that glass powder reduces the average pore diameter of mortar. These findings show that active excitation treatment can improve the internal compactness of mortar, which further verifies that active excitation treatment can improve the microstructure of mortar, improve its compactness, and consequently enhance its mechanical properties.

Fig. 18 shows the pore size distribution curve obtained using the BJH method, and it is evident that the pore sizes range between 1 and 135 nm for all the samples. Among the control group mortars, the pore sizes are primarily within the range of 4–5 nm. Conversely, the pore size curves of the various glass powder mortars exhibit similar characteristics, with pore sizes ranging primarily between three and four nanometers. The presence of glass powder indicated that the released calcium hydroxide was consumed to produce additional C-S-H (pozzolanic effect). The formation of secondary hydration products can fill larger pores and microcracks with microporous products. Glass powder has a smaller particle size than cement; even if it is not fully engaged in the pozzolanic reaction, it can still serve as an aggregate filler. The internal pores of all the glass powder mortars gradually transition to the range of medium to small pores, resulting in a decrease in the number of pores of 4–5 nanometers and a slight increase in the number of pores of 3–4 nanometers. The incorporation of glass powder appears to improve the pore structure of the mortar and increase its density by improving its pore distribution. Thus, the pore structure can be optimized in a way that enhances the durability and mechanical performance of the mortar, thus enhancing its overall properties.

Figure 18: Pore diameter distribution curve of each group of mortar samples obtained via the BJH method
Fig. 19 illustrates the relationship between the porosity and BJH porosity of mortars from different groups, where the porosity is determined by the water saturation method. It can be observed that glass powder mortars exhibit a slight increase in porosity with the increase in substitution rate; however, glass powder mortars subjected to activation treatment exhibit a decrease in porosity. Generally, this phenomenon can be attributed mainly to the presence of an appropriate amount of glass powder and activated glass powder, which undergo a pozzolanic reaction with the cement hydration product Ca(OH)2, resulting in a secondary hydration reaction. The secondary hydration product C-S-H can fill larger internal pores, resulting in a compacted pore structure and a reduced porosity. As the glass powder content increased between 10% and 15%, the reactivity of the excess glass powder decreased due to the lack of activation treatment. As a result of inadequate hydration reactions, the internal structure of the mortar becomes porous and cracked, resulting in a slight increase in porosity. Similarly, there is consistent variation in the change in pore volume. Glass powder induces a secondary hydration reaction that produces hydration products to fill the fine pores in the mortar, thereby reducing the pore volume. Secondary hydration products reduce the diameter of pores by increasing the tortuosity of the pore structure through the refinement of the size of the internal pores. In the G10 and G15 groups, glass powder exhibited a lower degree of hydration than cement, which led to poor bonding between particles and an increase in porosity. In conjunction with the results of the gas permeability test, the permeability of the 15% substitution ratio glass powder mortar material (without activation treatment) increases significantly as the porosity increases and the pore diameter increases. With increased porosity, there is more space for medium transmission and a reduction in slippage effects during gas transmission.
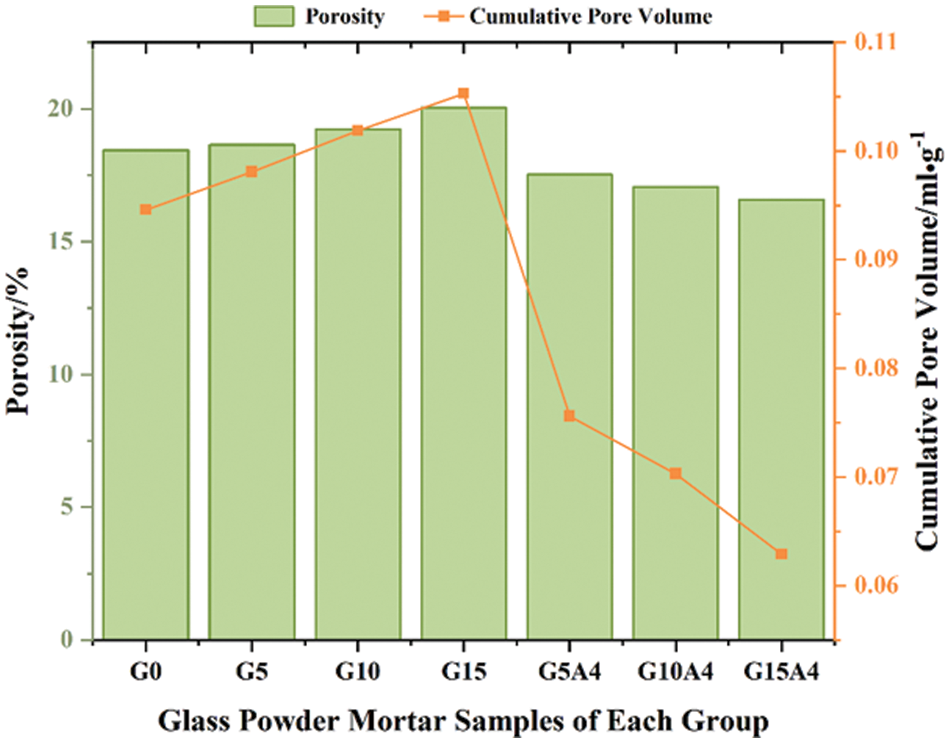
Figure 19: Porosity and pore volume of glass mortar
As a result of the analysis of porosity and pore volume, coupled with gas permeability tests, glass powder contributes significantly to the mortar pore structure and permeability. The addition of an appropriate amount of activated glass powder to cement mortar can significantly enhance its mechanical performance and permeability. The alkali activation of glass powder stimulates the hydration reaction, enabling it to undergo a pozzolanic reaction with cement and produce secondary hydration products. This process fills the larger pores and microcracks, enhancing the compactness and strength of the mortar. These findings provide valuable insights into the design and optimization of mortar materials.
Alkali activated glass powder with CaO was used as a replacement for cement. The strength, permeability and pore structure of mortars cured underwater for different curing ages were studied. The main conclusions are as follows:
1. The compressive and flexural strengths of glass powder mortar increase with increasing curing age, with early-stage strength development occurring faster than later-stage strength development. Moreover, alkali-activated glass powder mortar exhibits higher reactivity and strength.
2. Alkali-activated glass powder mortar is more resistant to gas flow when the glass powder content is the same. The higher the glass powder content without active excitation was, the worse the gas permeability. Additionally, the confining pressure has a significant impact on gas permeability.
3. SEM/EDS analysis, specific surface area and pore size tests revealed that glass powder incorporation induced pozzolanic reactions and aggregate filling effects within the mortar. Glass powder mortars develop stronger microstructures and smaller pore sizes as the Ca/Si ratio decreases. Among the various glass powder mortar compositions, G15A4 exhibited the most impressive performance in terms of all aspects, as it had the smallest pores and the highest strength.
The above findings offer key insights into cementitious mortar design and optimization. An excessive glass powder content may increase the number of pores and microcracks, adversely affecting mortar performance. However, this study examined only one type of alkali activator. Future research could examine the effects of diverse alkali activators on glass powder performance and consider various supplementary materials to enhance mortar performance.
Acknowledgement: We are grateful to the National Natural Science Foundation of China (No. 51709097) for their support.
Funding Statement: This work is supported by the National Natural Science Foundation of China (No. 51709097).
Author Contributions: The authors confirm their contributions to the paper as follows: study conception and design: Wei Chen; data collection: Dingdan Liu; analysis and interpretation of results: Yue Liang; and draft manuscript preparation: Wei Chen and Dingdan Liu. All the authors reviewed the results and approved the final version of the manuscript.
Availability of Data and Materials: The data of this study are available on request from the corresponding author.
Conflicts of Interest: The authors declare that they have no conflicts of interest to report regarding the present study.
References
1. Benhelal, E., Shamsaei, E., Rashid, M. I. (2021). Challenges against CO2 abatement strategies in cement industry: A review. Journal of Environmental Sciences, 104, 84–101. https://doi.org/10.1016/j.jes.2020.11.020 [Google Scholar] [PubMed] [CrossRef]
2. Guo, Y., Luo, L., Liu, T., Hao, L., Li, Y. et al. (2023). A review of low-carbon technologies and projects for the global cement industry. Journal of Environmental Sciences, 136, 682–697. [Google Scholar]
3. Poudyal, L., Adhikari, K. (2021). Environmental sustainability in cement industry: An integrated approach for green and economical cement production. Resources, Environment and Sustainability, 4, 100024. https://doi.org/10.1016/j.resenv.2021.100024 [Google Scholar] [CrossRef]
4. Schneider, M. (2019). The cement industry on the way to a low-carbon future. Cement and Concrete Research, 124, 105792. https://doi.org/10.1016/j.cemconres.2019.105792 [Google Scholar] [CrossRef]
5. Pierrehumbert, R. (2019). There is no plan B for dealing with the climate crisis. Bulletin of the Atomic Scientists, 75(5), 215–221. https://doi.org/10.1080/00963402.2019.1654255 [Google Scholar] [CrossRef]
6. Wang, Y., Li, J., He, X., Zheng, Z., Su, Y. et al. (2020). Effects of wet-grinded superfine waste glass on the fresh properties and reaction characteristic of cement pastes. Construction and Building Materials, 247, 118593. https://doi.org/10.1016/j.conbuildmat.2020.118593 [Google Scholar] [CrossRef]
7. Lebullenger, R., Mear, F. O. (2019). Glass recycling. In: Springer handbook of glass, pp. 1355–1377. [Google Scholar]
8. Gin, S., Abdelouas, A., Criscenti, L. J., Ebert, W. L., Ferrand, K. et al. (2013). An international initiative on long-term behavior of high-level nuclear waste glass. Materials Today, 16(6), 243–248. https://doi.org/10.1016/j.mattod.2013.06.008 [Google Scholar] [CrossRef]
9. Mohajerani, A., Vajna, J., Cheung, T. H. H., Kurmus, H., Arulrajah, A. et al. (2017). Practical recycling applications of crushed waste glass in construction materials: A review. Construction and Building Materials, 156, 443–467. https://doi.org/10.1016/j.conbuildmat.2017.09.005 [Google Scholar] [CrossRef]
10. Chen, Z., Wang, Y., Liao, S., Huang, Y. (2020). Grinding kinetics of waste glass powder and its composite effect as pozzolanic admixture in cement concrete. Construction and Building Materials, 239, 117876. https://doi.org/10.1016/j.conbuildmat.2019.117876 [Google Scholar] [CrossRef]
11. Jiang, Y., Ling, T. C., Mo, K. H., Shi, C. (2019). A critical review of waste glass powder-Multiple roles of utilization in cement-based materials and construction products. Journal of Environmental Management, 242, 440–449. https://doi.org/10.1016/j.jenvman.2019.04.098 [Google Scholar] [PubMed] [CrossRef]
12. Wang, J., Dai, Q., Guo, S., Si, R. (2019). Study on rubberized concrete reinforced with different fibers. ACI Materials Journal, 116(2), 21. [Google Scholar]
13. Visser, J. (2018). Fundamentals of alkali-silica gel formation and swelling: Condensation under influence of dissolved salts. Cement and Concrete Research, 105, 18–30. https://doi.org/10.1016/j.cemconres.2017.11.006 [Google Scholar] [CrossRef]
14. Paul, S. C., Šavija, B., Babafemi, A. J. (2018). A comprehensive review on mechanical and durability properties of cement-based materials containing waste recycled glass. Journal of Cleaner Production, 198, 891–906. https://doi.org/10.1016/j.jclepro.2018.07.095 [Google Scholar] [CrossRef]
15. Bignozzi, M., Saccani, A., Barbieri, L., Lancellotti, I. (2015). Glass waste as supplementary cementing materials: The effects of glass chemical composition. Cement and Concrete Composites, 55, 45–52. https://doi.org/10.1016/j.cemconcomp.2014.07.020 [Google Scholar] [CrossRef]
16. Liu, S., Wang, S., Tang, W., Hu, N., Wei, J. (2015). Inhibitory effect of waste glass powder on ASR expansion induced by waste glass aggregate. Materials, 8(10), 6849–6862. https://doi.org/10.3390/ma8105344 [Google Scholar] [PubMed] [CrossRef]
17. Gholipour, G., Zhang, C., Mousavi, A. A. (2020). Numerical analysis of axially loaded RC columns subjected to the combination of impact and blast loads. Engineering Structures, 219, 110924. https://doi.org/10.1016/j.engstruct.2020.110924 [Google Scholar] [CrossRef]
18. Xiong, X., Wu, M., Shen, W., Li, J., Zhao, D. et al. (2022). Performance and microstructure of ultra-high-performance concrete (UHPC) with silica fume replaced by inert mineral powders. Construction and Building Materials, 327, 126996. https://doi.org/10.1016/j.conbuildmat.2022.126996 [Google Scholar] [CrossRef]
19. Amaral, M., Macioski, G., Medeiros, M. H. F. D (2021). Pozzolanic activity of silica fume: Analysis in cement pastes with different substitution levels. Matéria (Rio de Janeiro), 26(3). [Google Scholar]
20. Lu, J. X, Duan, Z. H, Poon, C. S. (2017). Combined use of waste glass powder and cullet in architectural mortar. Cement and Concrete Composites, 82, 34–44. https://doi.org/10.1016/j.cemconcomp.2017.05.011 [Google Scholar] [CrossRef]
21. Wang, Y., Cao, Y., Zhang, P., Ma, Y. (2020). Effective utilization of waste glass as cementitious powder and construction sand in mortar. Materials, 13(3), 707. https://doi.org/10.3390/ma13030707 [Google Scholar] [PubMed] [CrossRef]
22. Olofinnade, O. M., Ndambuki, J. M., Ede, A. N., Booth, C. (2017). Application of waste glass powder as a partial cement substitute towards more sustainable concrete production. International Journal of Engineering Research in Africa, 31, 77–93. https://doi.org/10.4028/www.scientific.net/JERA.31 [Google Scholar] [CrossRef]
23. Sharifi, Y., Afshoon, I., Firoozjaei, Z., Momeni, A. (2016). Utilization of waste glass micro-particles in producing self-consolidating concrete mixtures. international Journal of Concrete Structures and Materials, 10, 337–353. https://doi.org/10.1007/s40069-016-0141-z [Google Scholar] [CrossRef]
24. Gimenez-Carbo, E., Soriano, L., Roig-Flores, M., Serna, P. (2021). Characterization of glass powder from glass recycling process waste and preliminary testing. Materials, 14(11), 2971. https://doi.org/10.3390/ma14112971 [Google Scholar] [PubMed] [CrossRef]
25. Fernández-Jiménez, A., Palomo, A., Criado, M. (2005). Microstructure development of alkali-activated fly ash cement: A descriptive model. Cement and Concrete Research, 35(6), 1204–1209. https://doi.org/10.1016/j.cemconres.2004.08.021 [Google Scholar] [CrossRef]
26. Kovalchuk, G., Fernández-Jiménez, A., Palomo, A. (2007). Alkali-activated fly ash: Effect of thermal curing conditions on mechanical and microstructural development–Part II. Fuel, 86(3), 315–322. https://doi.org/10.1016/j.fuel.2006.07.010 [Google Scholar] [CrossRef]
27. Schwarz, N., Cam, H., Neithalath, N. (2008). Influence of a fine glass powder on the durability characteristics of concrete and its comparison to fly ash. Cement and Concrete Composites, 30(6), 486–496. https://doi.org/10.1016/j.cemconcomp.2008.02.001 [Google Scholar] [CrossRef]
28. Lu, J. X, Duan, Z. H, Poon, C. S. (2017). Fresh properties of cement pastes or mortars incorporating waste glass powder and cullet. Construction and Building Materials, 131, 793–799. https://doi.org/10.1016/j.conbuildmat.2016.11.011 [Google Scholar] [CrossRef]
29. Elaqra, H. A., Abou Haloub, M. A., Rustom, R. N. (2019). Effect of new mixing method of glass powder as cement replacement on mechanical behavior of concrete. Construction and Building Materials, 203, 75–82. https://doi.org/10.1016/j.conbuildmat.2019.01.077 [Google Scholar] [CrossRef]
30. Khmiri, A., Samet, B., Chaabouni, M. (2012). Assessment of the waste glass powder pozzolanic activity by different methods. International Journal of Research and Reviews in Applied Sciences, 10(2), 322–328. [Google Scholar]
31. Aimin, X., Sarkar, S. L. (1991). Microstructural study of gypsum activated fly ash hydration in cement paste. Cement and Concrete Research, 21(6), 1137–1147. https://doi.org/10.1016/0008-8846(91)90074-R [Google Scholar] [CrossRef]
32. Ma, W., Brown, P. W. (1997). Hydrothermal reactions of fly ash with Ca(OH)2 and CaSO4·2H2O. Cement and Concrete Research, 27(8), 1237–1248. https://doi.org/10.1016/S0008-8846(97)00116-6 [Google Scholar] [CrossRef]
33. Fraay, A., Bijen, J., de Haan, Y. (1989). The reaction of fly ash in concrete a critical examination. Cement and Concrete Research, 19(2), 235–246. https://doi.org/10.1016/0008-8846(89)90088-4 [Google Scholar] [CrossRef]
34. Cyr, M., Idir, R., Poinot, T. (2012). Properties of inorganic polymer (geopolymer) mortars made of glass cullet. Journal of Materials Science, 47(6), 2782–2797. https://doi.org/10.1007/s10853-011-6107-2 [Google Scholar] [CrossRef]
35. Samarakoon, M., Ranjith, P., de Silva, V. (2020). Effect of soda-lime glass powder on alkali-activated binders: Rheology, strength and microstructure characterization. Construction and Building Materials, 241, 118013. https://doi.org/10.1016/j.conbuildmat.2020.118013 [Google Scholar] [CrossRef]
36. Redden, R., Neithalath, N. (2014). Microstructure, strength, and moisture stability of alkali activated glass powder-based binders. Cement and Concrete Composites, 45, 46–56. https://doi.org/10.1016/j.cemconcomp.2013.09.011 [Google Scholar] [CrossRef]
37. Zheng, P., Li, W., Ma, Q., Xi, L. (2023). Mechanical properties of phosphogypsum-soil stabilized by lime activated ground granulated blast-furnace slag. Construction and Building Materials, 402, 132994. https://doi.org/10.1016/j.conbuildmat.2023.132994 [Google Scholar] [CrossRef]
38. Chen, W., Han, Y., Agostini, F., Skoczylas, F., Corbeel, D. (2021). Permeability of a macro-cracked concrete effect of confining pressure and modelling. Materials, 14(4), 862. https://doi.org/10.3390/ma14040862 [Google Scholar] [PubMed] [CrossRef]
39. Chen, W., Liu, Y., Sheng, M., Zhang, H., Liang, Y. et al. (2022). Heating rate effect on gas permeability and pore structure of mortar under high temperature. Materials, 15(19), 6505. https://doi.org/10.3390/ma15196505 [Google Scholar] [PubMed] [CrossRef]
40. Klinkenberg, L. J. (1941). The permeability of porous media to liquids and gases. In: Drilling and production-practice, pp. 200–213. American Petroleum Institute. [Google Scholar]
41. Shi, H., Chen, W., Zhang, H., Song, L. (2023). A novel obtaining method and mesoscopic mechanism of pseudo-shear strength parameter evolution of sandstone. Environmental Earth Sciences, 82(2), 60. https://doi.org/10.1007/s12665-023-10748-y [Google Scholar] [CrossRef]
42. Chen, X., Wu, S., Zhou, J. (2014). Experimental study and analytical model for pore structure of hydrated cement paste. Applied Clay Science, 101, 159–167. https://doi.org/10.1016/j.clay.2014.07.031 [Google Scholar] [CrossRef]
43. Bostanci, L. (2020). Effect of waste glass powder addition on properties of alkali-activated silica fume mortars. Journal of Building Engineering, 29, 101154. https://doi.org/10.1016/j.jobe.2019.101154 [Google Scholar] [CrossRef]
44. Pan, Z., Tao, Z., Murphy, T., Wuhrer, R. (2017). High temperature performance of mortars containing fine glass powders. Journal of Cleaner Production, 162, 16–26. https://doi.org/10.1016/j.jclepro.2017.06.003 [Google Scholar] [CrossRef]
45. Brandt, A. M. (2005). Cement-based composites: materials, mechanical properties and performance. New York, USA: CRC Press. [Google Scholar]
Cite This Article
 Copyright © 2024 The Author(s). Published by Tech Science Press.
This work is licensed under a Creative Commons Attribution 4.0 International License , which permits unrestricted use, distribution, and reproduction in any medium, provided the original work is properly cited.
 Downloads
 Citation Tools