
 Submit a Paper
 Propose a Special lssue
 Open Access
ARTICLE
Aerodynamic Analysis and Optimization of Pantograph Streamline Fairing for High-Speed Trains
1 State Key Laboratory of Rail Transit Vehicle System, Southwest Jiaotong University, Chengdu, 610031, China
2 Technical Center, Southwest Jiaotong University Chengdu Design Institute Co., Ltd., Chengdu, 610031, China
* Corresponding Author: Tian Li. Email:
Fluid Dynamics & Materials Processing 2024, 20(5), 1075-1091. https://doi.org/10.32604/fdmp.2023.044050
Received 19 July 2023; Accepted 25 September 2023; Issue published 07 June 2024
 View Full Text
 Download PDF
Abstract
A pantograph serves as a vital device for the collection of electricity in trains. However, its aerodynamic resistance can limit the train’s running speed. As installing fairings around the pantograph is known to effectively reduce the resistance, in this study, different fairing lengths are considered and the related aerodynamic performances of pantograph are assessed. In particular, this is accomplished through numerical simulations based on the k-ω Shear Stress Transport (SST) two-equation turbulence model. The results indicate that the fairing diminishes the direct impact of high-speed airflow on the pantograph, thereby reducing its aerodynamic resistance. However, it also induces interferences in the flow field around the train, leading to variations in the aerodynamic resistance and lift of train components. It is shown that a maximum reduction of 56.52% in pantograph aerodynamic resistance and a peak decrease of 3.38% in total train aerodynamic resistance can be achieved.Keywords
As high-speed trains continue to increase speed, the associated aerodynamic issues cannot be ignored. One major obstacle that affects the speed increase of high-speed trains is drag reduction, with the pantograph’s aerodynamic resistance being a crucial factor [1]. Research shows that once the train speed reaches 350 km/h, the aerodynamic resistance of the train accounts for over 80% of the total resistance [2]. The pantograph system is installed on the roof area of high-speed trains and serves as a crucial device for collecting current from the overhead catenary system. Being exposed outside the train body, the pantograph experiences aerodynamic resistance that contributes to approximately 12% of the total aerodynamic resistance of the high-speed train [3]. When the train operates at a high speed, the flow in the roof area becomes highly complex and turbulent, causing the pantograph and insulators to face direct impact from the incoming airflow. This generates a positive pressure region on the windward side and creates significant pressure differential resistance. The shedding vortices from the pantograph not only affect the aerodynamic characteristics of the pantograph system and the train but also influence the flow separation and boundary layer development at the connection points of the train, subsequently affecting the tail car. Therefore, reducing the aerodynamic resistance of the pantograph, improving the flow field structure in the pantograph region, and enhancing the aerodynamic performance of the pantograph system during high-speed operation are of great significance in reducing the overall aerodynamic resistance of high-speed trains and improving train stability during operation.
Many researchers have explored various methods to improve the aerodynamic performance of the pantograph [4–8]. These include optimizing its external shape [9,10], changing the installation position of the pantograph [11], installing a sinking pantograph [12], and implementing fairings to improve its aerodynamic performance [13]. Dai et al. [14] analyzed the aerodynamic performance of a double-carbon strip pantograph and found that the presence of the front carbon strip affects the lift of the rear strip while reducing its resistance. Sun et al. [15] investigated the influence of different train lengths on the aerodynamic resistance of high-speed trains. The results indicated that as the pantograph position moves towards the tail car, the aerodynamic resistance on the pantograph decreases. Ikeda et al. [16] optimized the pantograph by modifying the shape of the pantograph base, strip design, and hinge shape between the strip and upper arm, and covering the surface with porous materials. The optimized pantograph was evaluated through wind tunnel testing, and the results showed that the optimized pantograph had a noise reduction of approximately 4 dBA compared to the original pantograph.
The installation platform’s sinking for the pantograph also affects its aerodynamic performance. Liu et al. [17] studied the influence of the pantograph cabin covering structure on the aerodynamic performance of high-speed trains. The results showed that the covering structure reduced the impact of the incoming flow on the sunk platform surface, resulting in a 5.6% reduction in aerodynamic resistance on the train, and a decrease in the fluctuation of the pantograph’s aerodynamic lift. Qin et al. [18] compared the aerodynamic and acoustic behaviors of the pantograph under different subsidence platform heights, the study found that when the platform sunk by 300 mm, the aerodynamic resistance decreased by 2.0% and 1.8% when the pantograph in the knuckle-downstream direction/knuckle-upstream direction, and the far-field noise decreased 2.02 dBA. Xiao et al. [19] compared the variations in the resistance of the pantograph and the train at different sinking heights. Increasing the sinking height resulted in an increase in the aerodynamic resistance and lift of the middle car, while the aerodynamic resistance of the tail car and pantograph decreased.
Regarding the research on the design forms of pantograph fairings, there are mainly two forms: the bathtub-style fairing and the baffle-style fairing. Numerous studies have analyzed the aerodynamic performance of these two fairing forms and their impact on the aerodynamic performance of the pantograph and train using numerical simulations and wind tunnel tests. Lee et al. [20] conducted wind tunnel tests on three different head shapes of bathtub-style pantograph fairings (one streamlined and two wedge-shaped) and found that the streamlined fairing had lower aerodynamic resistance than the wedge-shaped fairings. Li et al. [21] examined the influence of bathtub-style and baffle-style fairings on the pantograph under crosswinds. The study revealed an increase in the intensity of vortices around the pantograph after installing the fairings. The bathtub-style fairing generated larger flow field disturbances and vortex intensities compared to the baffle-style fairing.
The above-mentioned studies have considerable implications in reducing the aerodynamic resistance and noise of the pantograph. However, concerning the overall train aerodynamic resistance, improper fairing design and the shape of the sunk platform can lead to an increase in the overall aerodynamic resistance instead of reducing it. Hence, when the pantograph is mounted on a non-sunk platform, to achieve improved drag reduction, a completely enclosed external fairing is employed to enclose the pantograph installation platform. Simultaneously, holes are incorporated on the surface of the fairing to allow unrestricted movement of the pantograph while being fully enclosed. Moreover, the impact of various fairing lengths on the aerodynamic performance of the fairing has been comprehensively investigated, offering valuable insights for the design aimed at minimizing the aerodynamic resistance of the pantograph region.
The flow of air around the train follows the basic physical principles of conservation of mass, momentum, and energy. In mathematics, fluid motion is described by the continuity equation, Navier-Stokes equation, and energy equation. The overall structure of the governing equation is as follows:
In Eq. (1): ρ stands for air density; t denotes time; Φ is a universal variable; V signifies velocity; Г represents the generalized diffusion coefficient; S corresponds to the generalized source term. On the left side of the equation lie the transient and convection terms, while on the right side reside the diffusion and source terms.
STAR-CCM+ commercial software was used to simulate the airflow around a high-speed train. Based on previous studies, the Reynolds-average Navier-Stokes (RANS) technique has been extensively applied to the numerical simulation of the external flow field of high-speed trains. Therefore, the Reynolds average method is used for the aerodynamic analysis of trains, and the shear stress transport (SST) k-ω two-equation model is selected, which has high accuracy in the near-wall and far-field calculation [22]. The pressure velocity interaction is solved by the semi-implicit method of the pressure link equation, and the governing equation is discretized by the second-order upwind scheme [23].
This study employs a three-car high-speed train, comprising a leading car (6.67 H), a middle car (6.33 H), and a tail car (6.67 H), based on the characteristic height H of the train. Fig. 1 shows that the pantograph is installed on the rear section of the roof platform of the middle car, and the distance from the front end of the middle car is 5.17 H, positioned at an elevated level. The fairing maintains a constant width (W) and height (Hf), with a width of 2188 mm, a height of 830 mm, and a thickness of 10 mm. However, the distance L from the front vertex to the rear vertex of the fairing is varied, with L values of 8400, 8000, 7600, 7200, and 6800 mm. The objective is to determine the maximum fairing length while adhering to the passenger train limit specified in the “GB146.1-2020 Standard for Standard Gauge Railway Clearances,” maintaining the pantograph installation position, and satisfying the distance requirements between the middle car and the windscreen. To facilitate grid generation, the original high-speed train and pantograph models are simplified by eliminating small surface components. The pantograph is divided into eight main components, including the strip, the support of the strip, the upper arm rod, the lower arm rod, the pull rod, the balance rod, and the base frame.
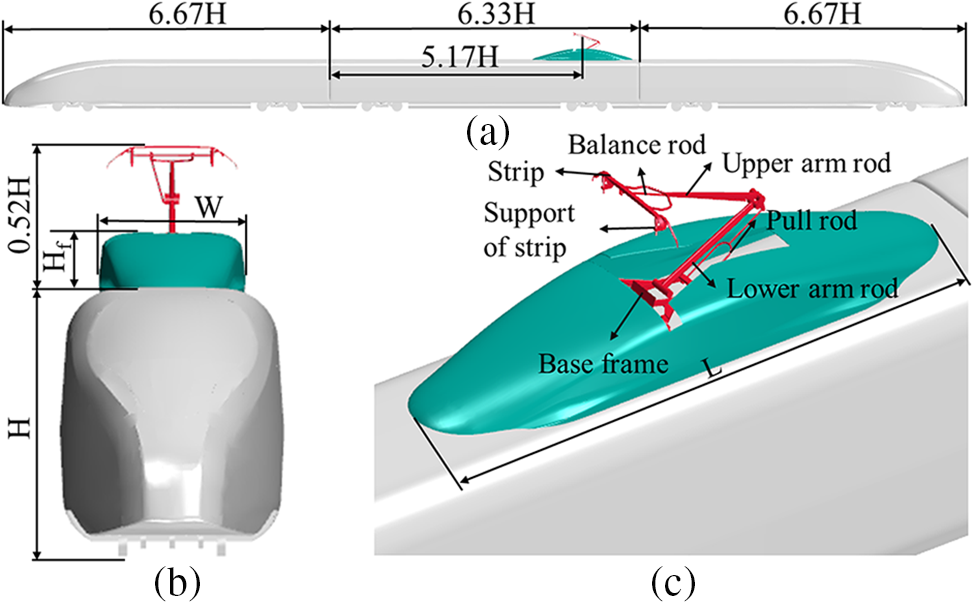
Figure 1: Geometric model and parameters
2.3 Computational Domain and Boundary Conditions
Fig. 2 shows the computational domain representing the external flow field surrounding the train. The computational domain boundaries consist of an inlet, an outlet, a ground, and a symmetry boundary. The backflow turbulence intensity and hydraulic diameter, which are 0.019 and 4.05 m, respectively, were selected as the way of establishing the inlet and outlet boundaries. The computational domain extends 90 H in the x-direction, 20 H in the y-direction, and 16 H in the z-direction. The high-speed train is positioned at the center, while the inlet and outlet are situated 25 and 45 H away from the train’s leading and tail noses, respectively, to allow for adequate wake flow development. The x-direction corresponds to the direction of the train and pantograph motion, whereas the −x-direction represents the pantograph opening direction. The z-direction is vertical, with the +z-direction pointing upward. The y-direction represents the lateral direction. The inlet boundary of the computational domain in front of the leading car is set as a free stream with a Mach number of 0.3265. The outlet boundary of the computational domain behind the tail car is set the same as the inlet. The sides and top boundaries of the computational domain are set as symmetry. To mitigate the impact of the ground effect, the ground is defined as a moving wall with the same magnitude and direction of velocity as the inlet.
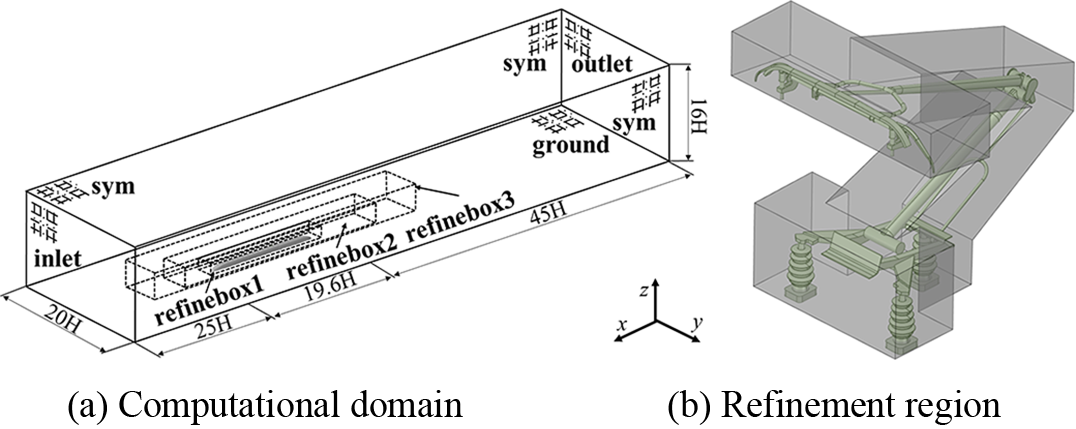
Figure 2: Calculation of domain and parameters
The definitions of the Reynolds number and Mach number are provided below:
In the provided equations, Re denotes the Reynolds number, where ρ stands for the air density (ρ = 1.225 kg/m3), u represents the operational speed of the train, and H indicates the characteristic height of the train. For this investigation, H equals 4.05 m. Additionally, μ symbolizes the dynamic viscosity (μ = 1.8 × 10⁻⁵ Pa·s), u is set as 111.11 m/s, and Ma represents the Mach number. Moreover, c denotes the speed of sound, with c equating to 340 m/s. With a characteristic height and flow velocity, the corresponding Reynolds number computes to be 3.06 × 10⁶. Considering the train’s operational speed of 400 km/h, corresponding to a Mach number of 0.3265, the aerodynamic field encompassing the train is modeled as a three-dimensional compressible viscous flow.
The high-speed train was meshed utilizing the commercial software STAR-CCM+. Specifically, the computational domain is discretized with the unstructured trimmer grids which were dominated by hexahedral cells. Four refinement zones were utilized to ensure prediction accuracy. Fig. 3 illustrates the meshing of the computational domain and the boundary layer meshes, encompassing the train body, fairing, pantograph, and various cross-sectional views. To facilitate favorable flow development around the train, the mesh surrounding the train was refined using multiple layers. The mesh surrounding the train underwent three layers of refinement, with each subsequent layer doubling the mesh size, ensuring a smooth transition of the volume mesh. A dedicated fine mesh region was created specifically for the pantograph area, featuring a surface mesh size of 16 mm. The volume mesh within the computational domain was constructed using an unstructured mesh, primarily comprising hexahedral elements with a minor presence of tetrahedral elements.
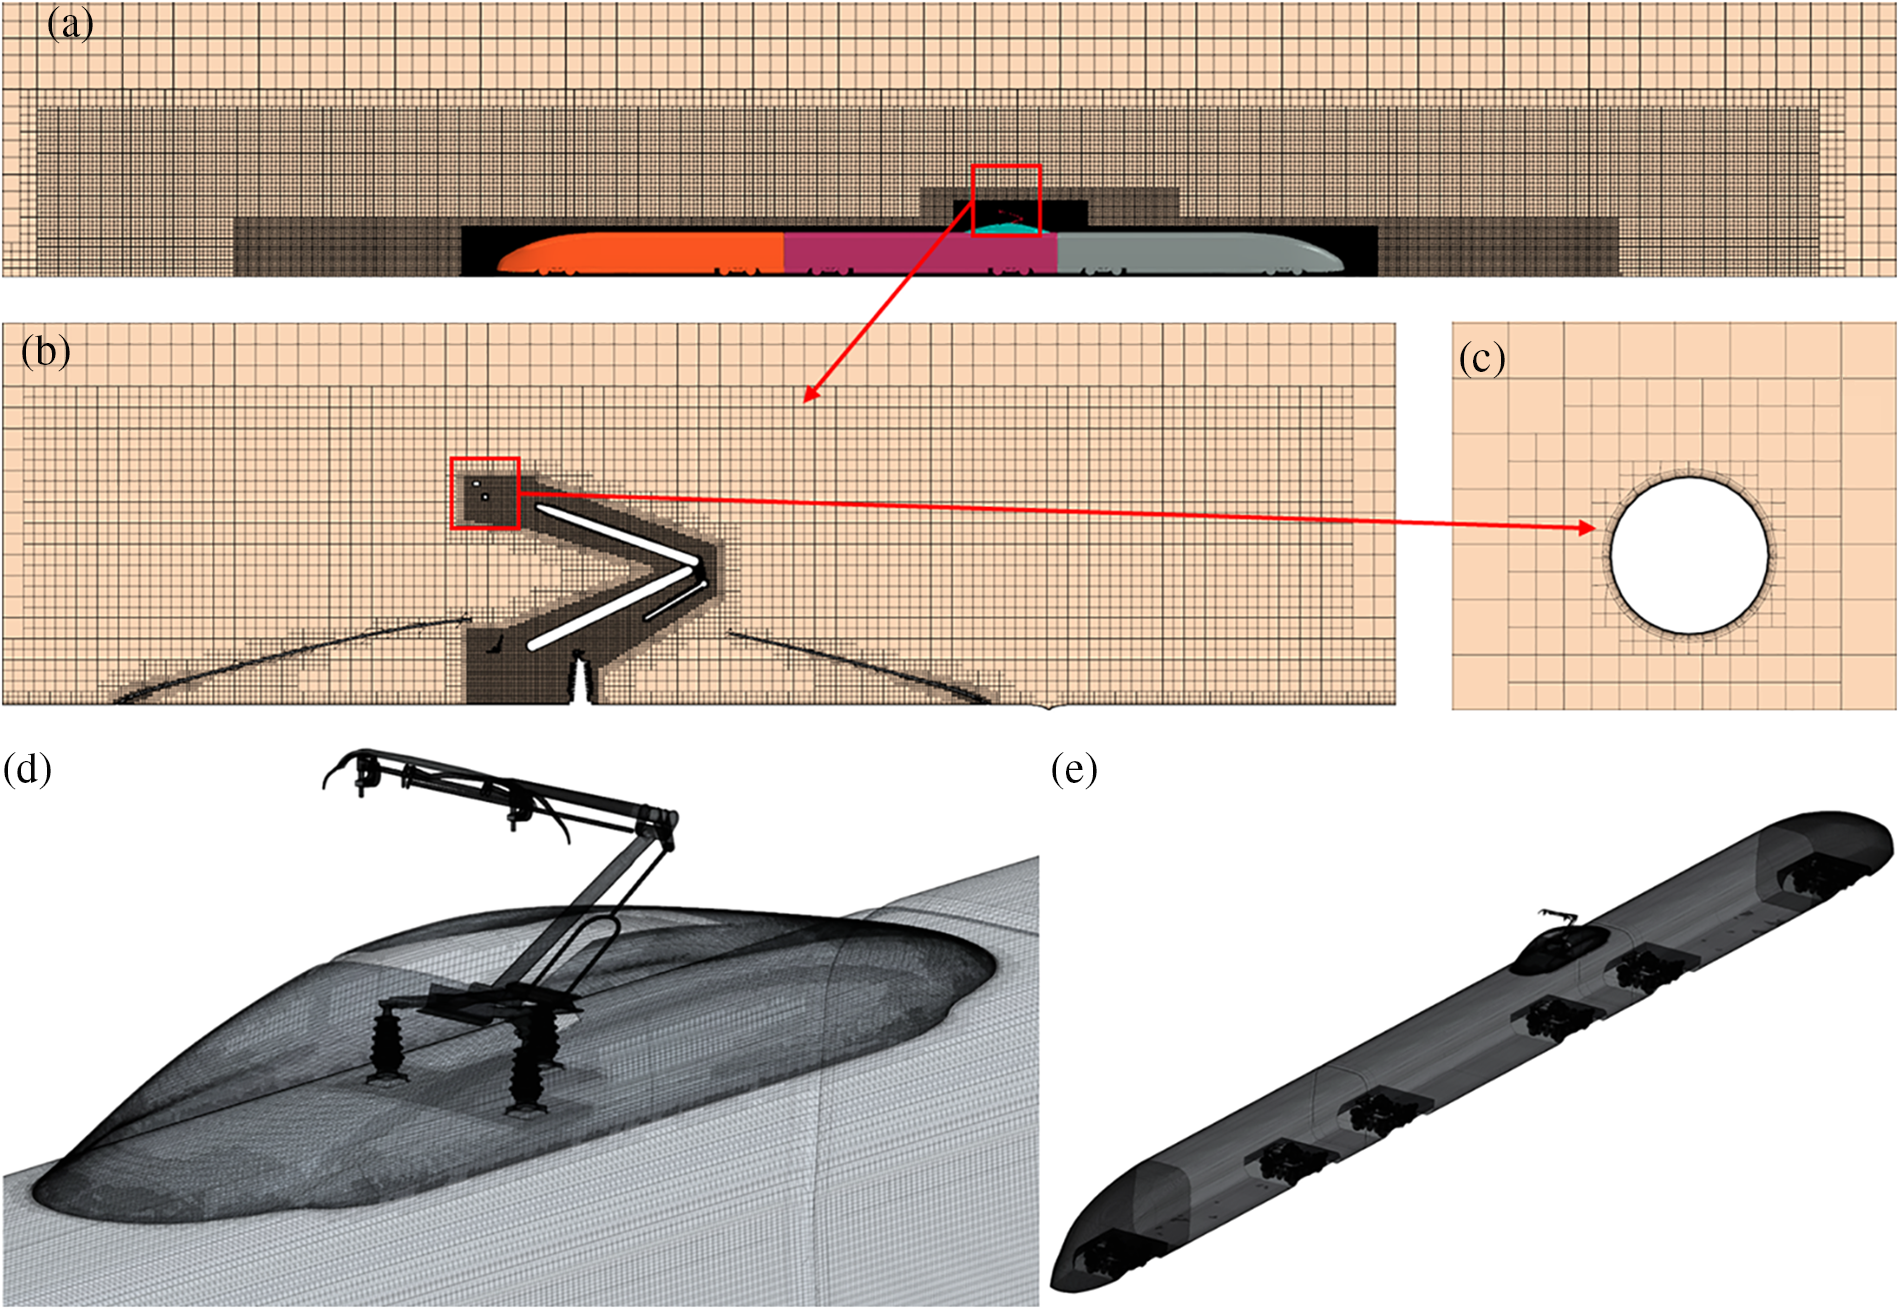
Figure 3: Mesh distribution (a) Train (b) Pantograph (c) Boundary layer mesh distribution (d) Surface of the pantograph area (e) Surface of the train
The reliability and accuracy of numerical computation results are influenced by the quantity and quality of the mesh. Firstly, the independence of the mesh is validated. To facilitate analysis, dimensionless coefficients are used to compare the results obtained from three different mesh configurations. The surface pressure coefficient (CP), aerodynamic drag coefficient (CD), and aerodynamic lift coefficient (CL) are defined as follows:
whereas P and P∞ represent the surface pressure and the standard atmospheric pressure, respectively. ρ denotes the air density (ρ = 1.225 kg/m3). U represents the train’s operating velocity (U = 111.11 m/s). FD corresponds to the aerodynamic drag force. FL corresponds to the aerodynamic lift force. S denotes the projected area of the train in the direction of motion, which is taken as 11.94 m2.
Three sets of grids were generated based on the three basic sizes: 2000, 1600, and 1200 mm. According to the grid density, the three sets of grids are named Coarse, Medium, and Fine, with grid quantities of 21.45 million, 32.09 million, and 51.92 million, respectively. A boundary layer with 12 layers, a thickness of 0.01 mm, and a growth ratio of 1.2 was applied around the train and the pantograph to capture velocity gradients and ensure that the average y+ value is around 1 for the entire train. Table 1 presents the results of the grid independence test for the aerodynamic coefficient of the train. CD-h and CD-t represent the drag coefficients of the front car and rear car, respectively, while CL-h and CL-t represent the lift coefficients of the front car and rear car, respectively. From Table 1, it can be observed that the calculation error of the Coarse grid model is relatively large, while the results from the Medium and Fine grids are closer. Taking the Medium grid as the reference, the drag coefficient of the front car is 2.7% smaller in the Coarse grid and equal to that of the Fine grid. The drag coefficient of the rear car is 0.8% smaller in the Coarse grid and 1.0% larger in the Fine grid. The lift coefficient of the front car is 5.0% larger in the Coarse grid and slightly different in the Fine grid. The lift coefficient of the rear car is 7.1% smaller in the Coarse grid and 3.5% larger in the Fine grid. It can be seen that as the number of grids increases, the errors in the aerodynamic coefficients of the front and tail car gradually decrease, and the results tend to converge.
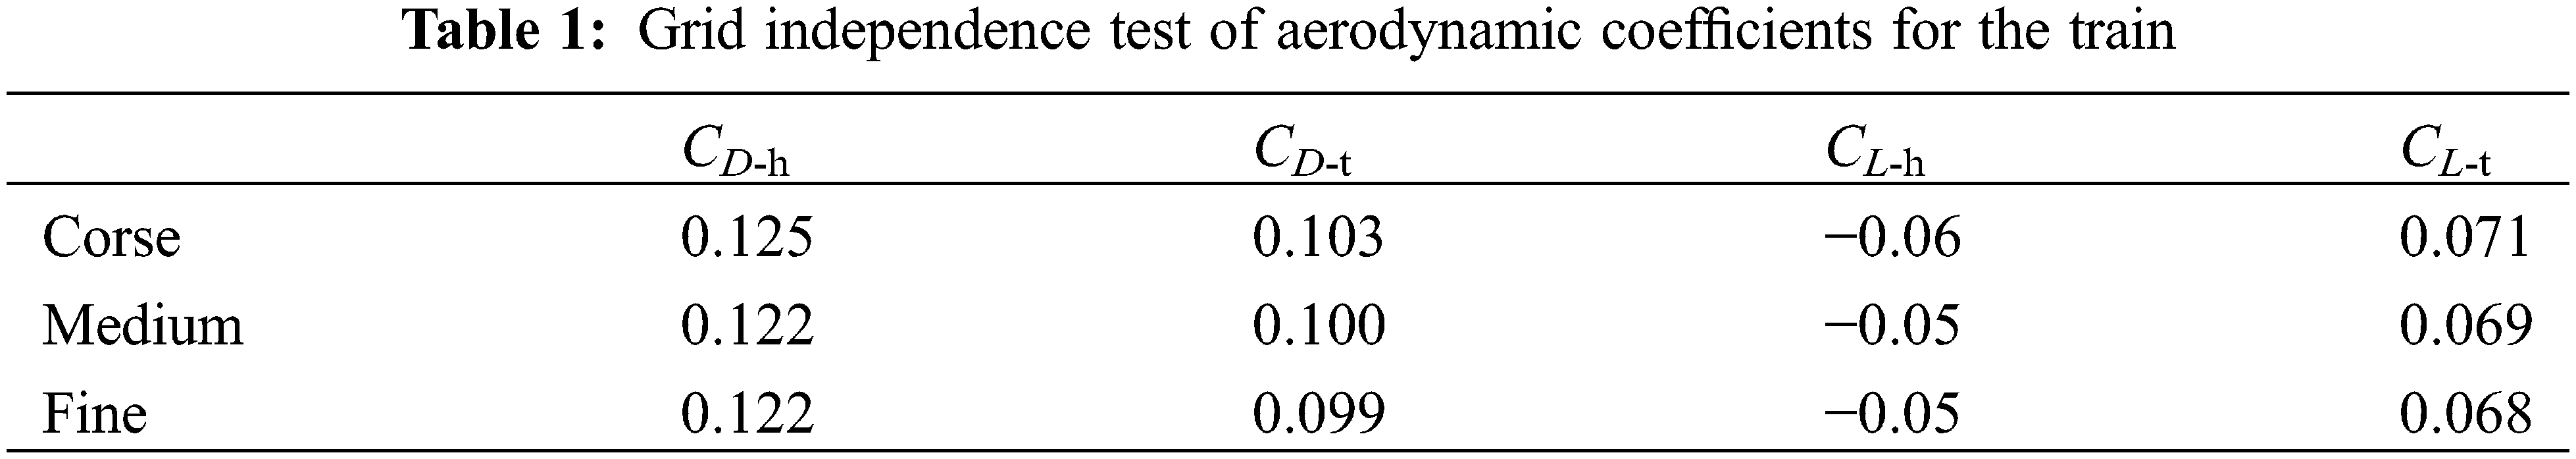
Fig. 4 depicts the pressure coefficient distribution curves on the cross-section of the front car. The Medium and Fine grids exhibit a high level of agreement in their respective results. However, in a zoomed-in local view, the results from the Coarse grid differ significantly from those of the Medium and Fine grids, particularly at the rear end of the front car. This discrepancy suggests that the Coarse grid fails to accurately capture the flow field structure, leading to imprecise aerodynamic force calculations for the train. The number of grids has a positive correlation with computational accuracy. However, additional grid refinement has a relatively minor impact on the train’s aerodynamic characteristics. The grid independence criteria have been satisfied, and the numerical simulation method accurately calculates the aerodynamic drag and lift of the high-speed train. To ensure accuracy, it is recommended to avoid utilizing excessively large numbers of grids, which could lead to prolonged computation time and reduced efficiency. Based on the analysis, it can be concluded that the Medium grid, consisting of 32.09 million cells, is suitable for further calculations, as it yields results with minor discrepancies compared to the Fine and Medium grids.
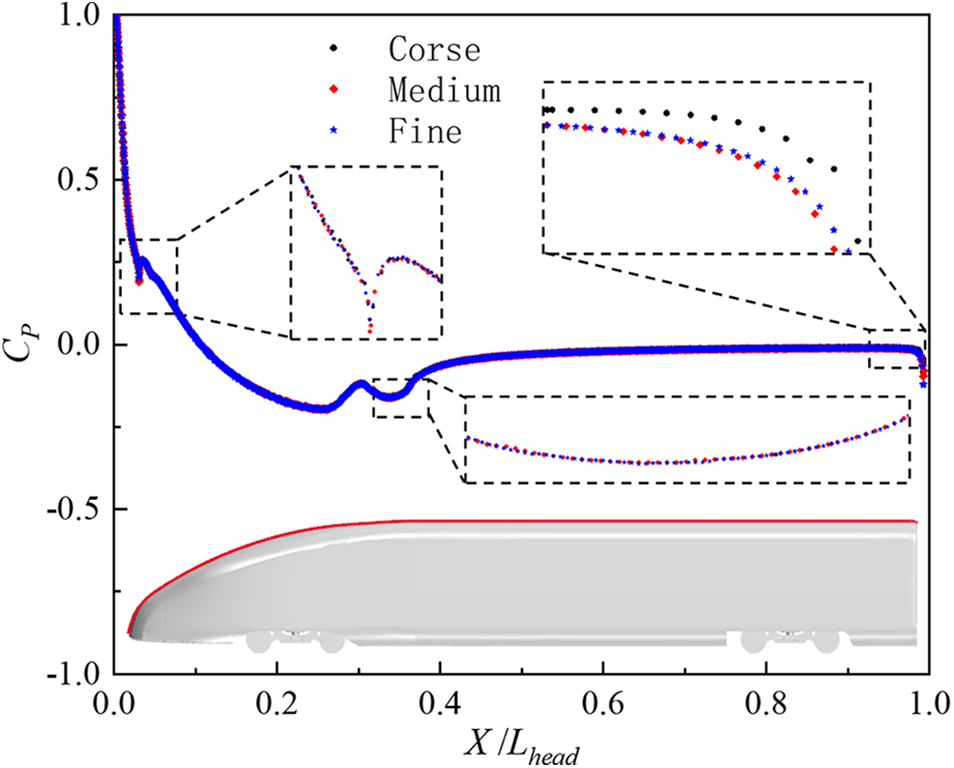
Figure 4: Distribution of section pressure coefficient on the y = 0 section of the train
To ensure the accuracy of the numerical simulation method employed in this study and the reliability of its results, a numerical verification was conducted. A test was conducted using a 1:8 scale model of a high-speed train in the China Aerodynamics Research and Development Center’s large-scale low-speed wind tunnel [24,25]. The wind tunnel test used a configuration of one full-scale front car and a half-scale car body on a single-track ballastless track, the test implemented a smooth uniform flow at a speed of 45 m/s, as shown in Fig. 5. Numerical simulations were performed using the same train size and model configuration and computational boundary conditions to verify the accuracy of the numerical method. At the same time, the grid division method is also consistent with the grid independence test. Fig. 6a visually illustrates the concurrence of the numerical simulation and wind tunnel test results by presenting the distribution curves of the surface pressure coefficient along the centerline of symmetry of the front car. For analysis purposes, the non-dimensional position X/Lhead is defined, where Lhead represents the length of the front car. Fig. 6a unequivocally illustrates the excellent agreement between the experimental data and the pressure coefficient along the centerline of symmetry in the streamlined region of the front car. Furthermore, Fig. 6b presents a comparison of the front car’s drag coefficient between the numerical simulation and wind tunnel test results. The maximum error of three different mesh sizes is only 4.3% when compared to the wind tunnel test, demonstrating a remarkable level of agreement between the two. Consequently, the numerical calculation method employed in this study is deemed reliable and capable of accurately capturing the aerodynamic loads and surface pressure of the high-speed train.
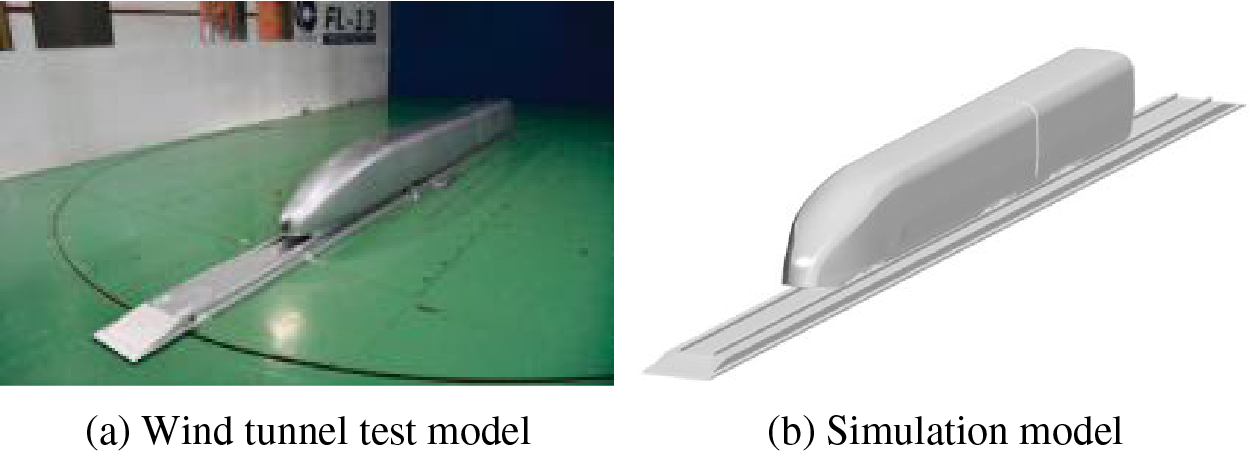
Figure 5: Comparison of wind tunnel test model and simulation model
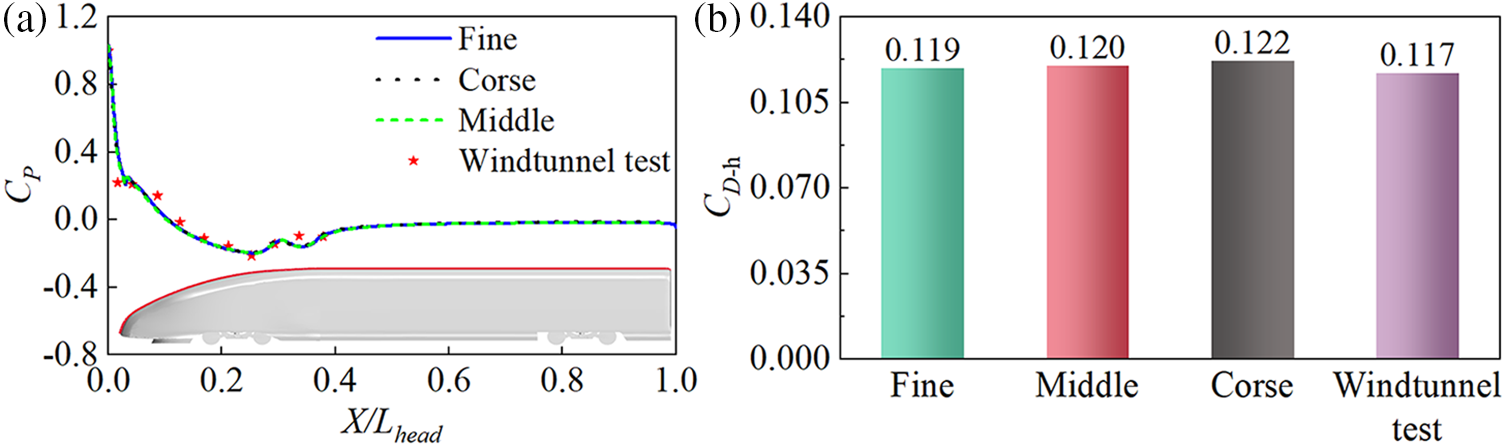
Figure 6: Comparison between numerical simulation and wind tunnel test: (a) The symmetry line Cp of the streamlined area of the leading car (b) The drag coefficient of the leading car
This section analyzes the influence of the length of the streamlined fairing of the pantograph on the aerodynamic performance of the pantograph and trains from the perspectives of aerodynamic and flow field characteristics.
Fig. 7 shows the relationship between the aerodynamic drag of the fairing and the installation of fairings of different lengths at a speed level of 400 km/h. From Fig. 7, it can be observed that the overall aerodynamic drag on the train decreases after the installation of fairings. When examining individual components, it is noted that the impact of the fairings on the leading car is relatively small, while it has a significant influence on the aerodynamics of the middle and tail car. This is due to the alteration of the flow field structure in the area of the pantograph caused by the installation of the fairings, and the wake generated by the fairings continues to affect the tail cars, thereby influencing the aerodynamics of the tail and middle car. Comparing the drag reduction effects of fairings with different lengths, the total aerodynamic drag of the train can be reduced by up to 1005.44 N, resulting in a maximum drag reduction rate of 3.37%. The graph shows that the aerodynamic drag experienced by the fairings gradually decreases with increasing fairing length, exhibiting a mostly linear reduction trend. When the fairing length increases from 6800 to 8400 mm, the aerodynamic drag of the fairing is reduced by 11.1%. The aerodynamic drag of the middle car decreases after the installation of fairings, with the maximum change occurring at a fairing length of 8000 mm, amounting to 272.05 N. Conversely, the aerodynamic drag of the tail car increases after the installation of the fairings, a maximum increase of 185.45 N. Fig. 8 shows the pressure distribution on the y = 0 section, comparing the pressure distribution before and after installing the fairing, we can see the wake effect generated when the airflow passes through the fairing affects the pressure at the connection between the middle and tail car, and then affects the aerodynamic resistance of these components. After the fairing length increases to 7600 mm, further variations in the fairing length have a relatively minor impact on the total drag of the train. With the fairings enveloping the pantograph region, the aerodynamic drag on the pantograph body itself decreases by approximately 56.50%.
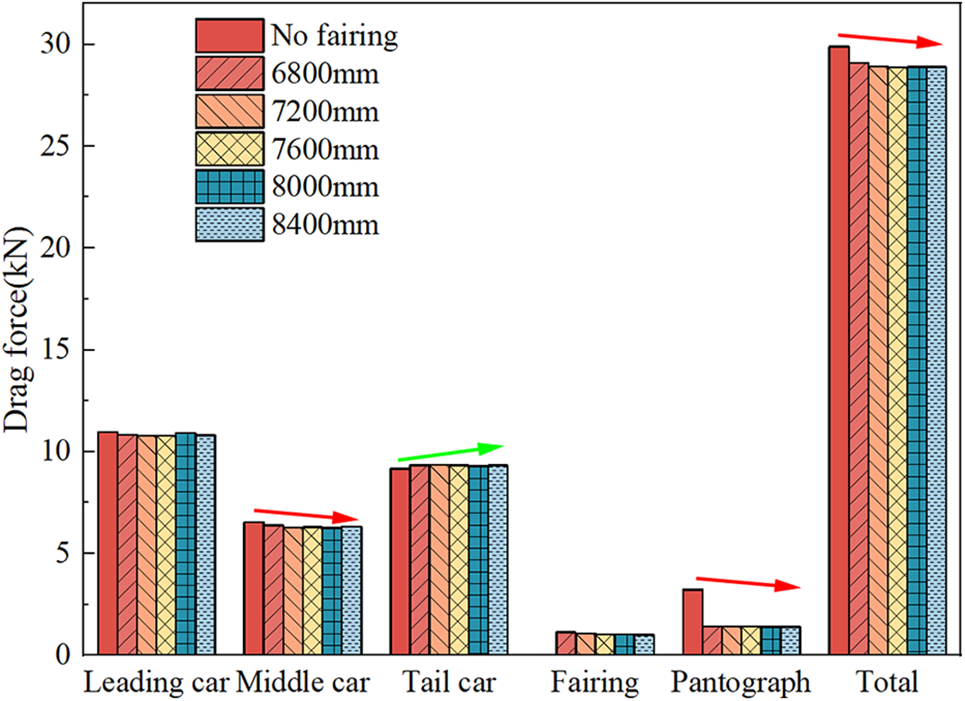
Figure 7: Comparison of aerodynamic resistance of various components under different length fairings
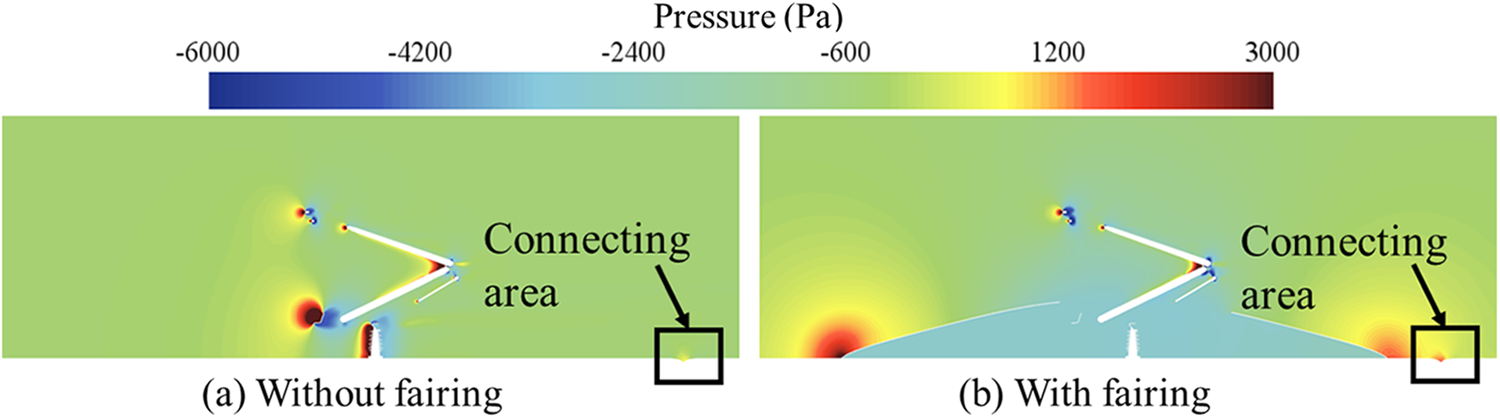
Figure 8: Contrast of pressure in section with or without fairing at y = 0 m
Fig. 9 presents a comparison of the aerodynamic lift on the train, pantograph, and fairing when the fairing with different lengths is installed. After the installation of fairings, the lift force of the leading car showed little change, while the lift force of the middle car, the tail car, and the pantograph changed significantly. The installation of fairings transforms the negative lift force on the middle car into the positive lift force, which decreases with shorter fairing lengths. The calculated results for the total aerodynamic lift of the middle car show that its variation range is within an acceptable range. The aerodynamic lift of the tail car decreases after the installation of fairings. The length of the fairing has a significant impact on the aerodynamic lift of the middle and tail cars but has a relatively minor effect on other cars. As the fairings are installed at the rear end of the middle car, the airflow first affects the middle car, and the wake generated by the flow over the fairings continues to affect the tail car. When the fairing length increases from 6800 to 8400 mm, the aerodynamic lift on the middle car increases by 47.59%, while the aerodynamic lift on the tail car decreases by 15.39%. The lift on the pantograph changes from downward to upward and decreases by 19.65%.
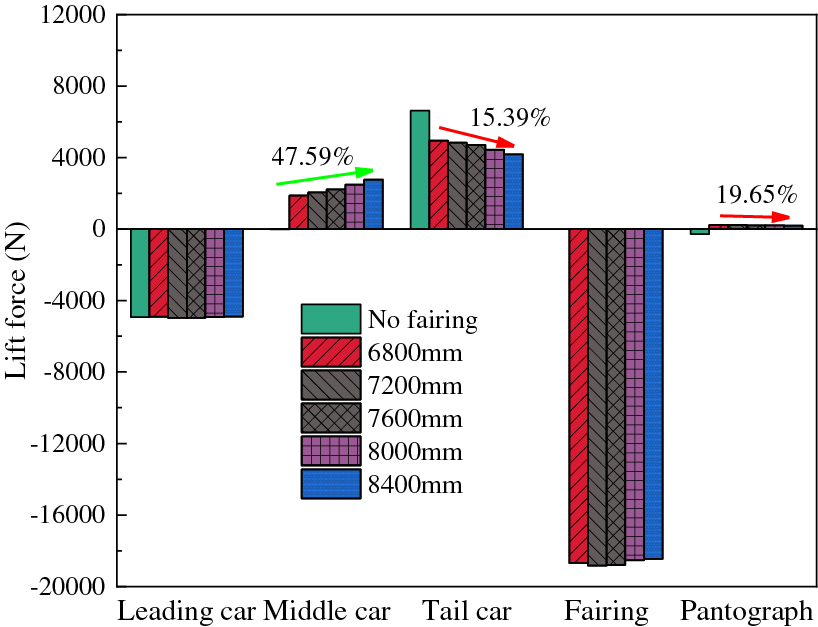
Figure 9: Comparison of aerodynamic lift of different components under varied length fairings
Fig. 10 illustrates how different fairing lengths affect the aerodynamic drag and lift of the various components of the pantograph. The graph shows that changes in fairing length have a minimal impact on the aerodynamic forces that act on the pantograph components. However, after installing fairings, there is a slight increase in the aerodynamic drag and lift of the strip, upper arm rod, and lower arm rod.
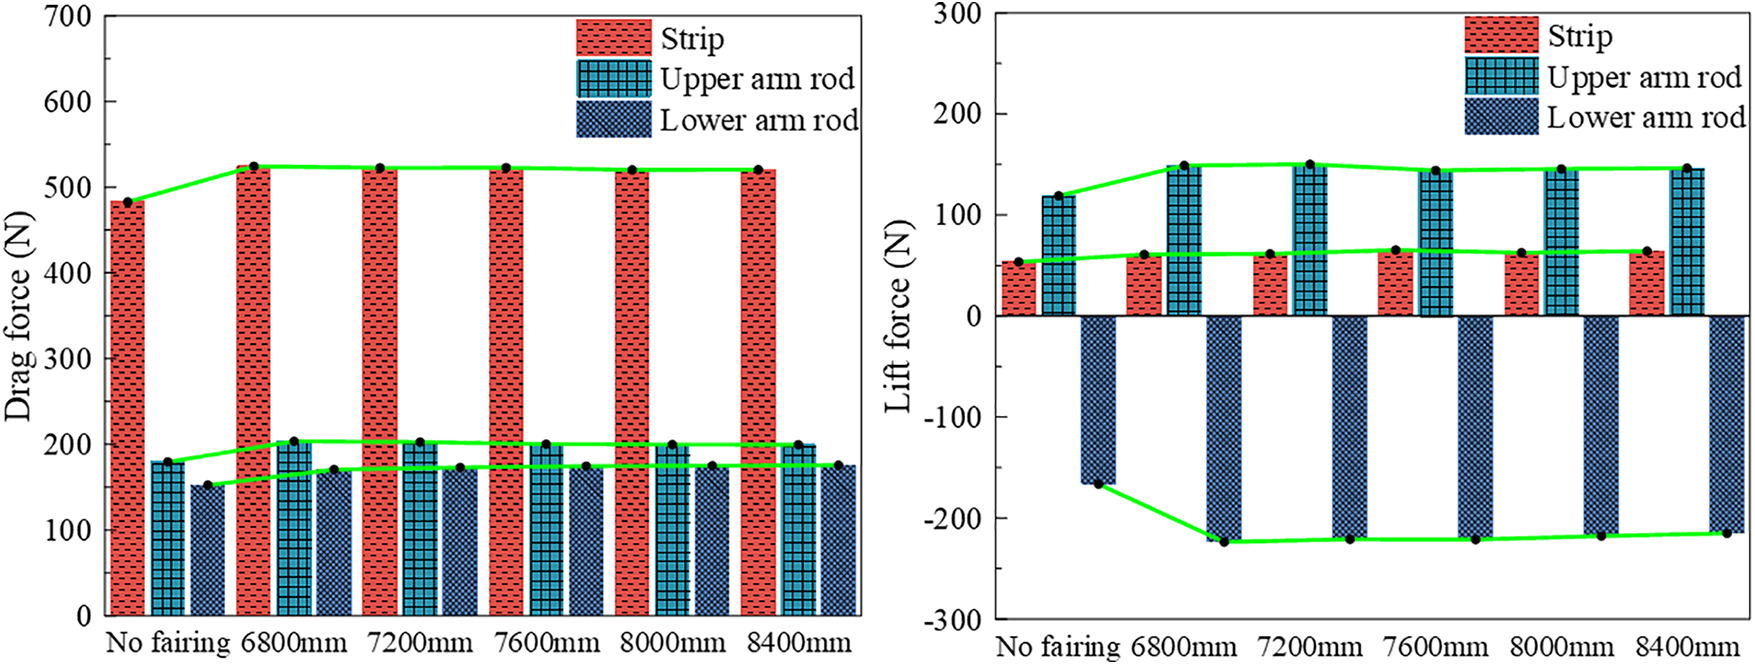
Figure 10: Aerodynamic forces of each part of pantograph
3.2 Flow Field Characteristics
Fig. 11 compares the airflow patterns at the y = 0 m section with and without fairings. From Fig. 11, it can be observed that the fairings, by enclosing the pantograph’s frame and insulators, alter the flow field structure around the insulators and frame. The lower structure of the pantograph, which is subjected to the impact of high-speed airflow, experiences a reduction in aerodynamic drag. When there is no fairing, a small vortex only forms behind the frame and insulators in the wake. However, with fairings installed, a large low-speed zone is created within the cavity formed by the fairings. Moreover, a significant number of vortices are generated within the fairings. Compared to the case without fairings, the separation of the boundary layer in the wake is less pronounced after installing fairings. However, a noticeable airflow acceleration effect occurs in the upper region of the fairings which causes a high-speed zone. This is due to the presence of the streamlined slope on the leading edge of the fairings, where the airflow moves along the surface of the fairings and experiences acceleration after passing through the fairings. The high-speed airflow directly acts on the upper part of the upper arm, the upper arm, and the connection point between the upper and lower arms, leading to an increase in the aerodynamic drag of the upper and lower arms. Additionally, the high-speed airflow affects the pressure difference between the upper and lower surfaces of the collector shoe, resulting in an increase in lift on the collector shoe. The fairings significantly reduce the aerodynamic drag on the frame, as they envelop it. The formation of a low-speed zone within the fairings causes the lift on the pantograph to be in the opposite direction.
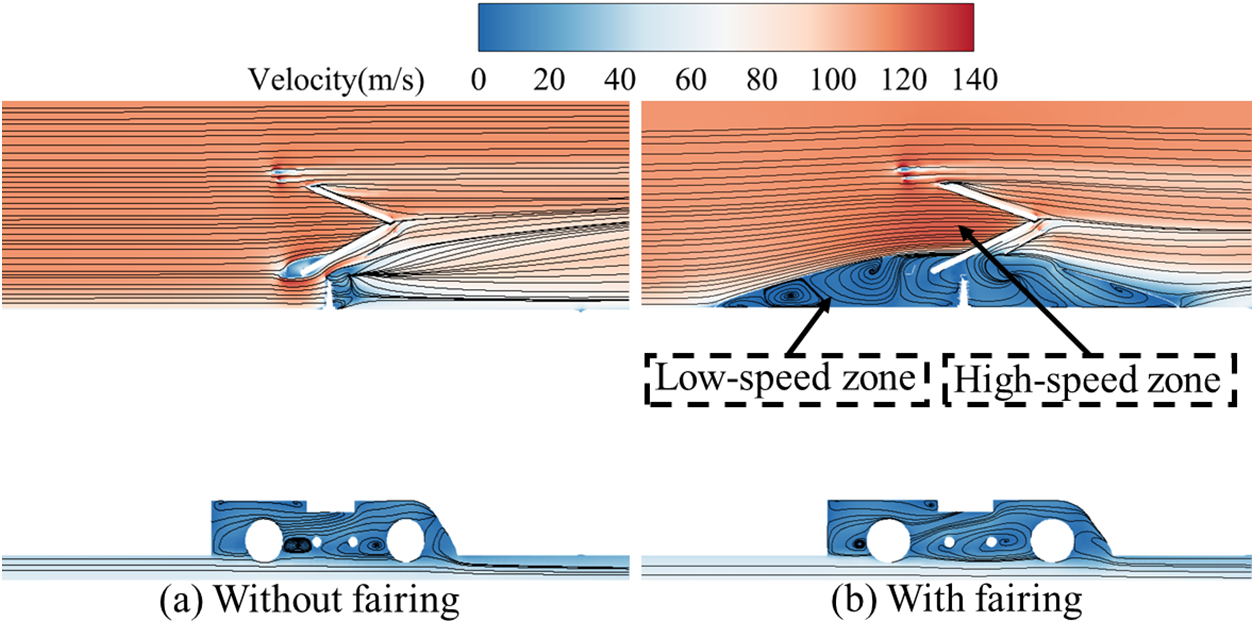
Figure 11: Contrast of streamlines in section with or without fairing at y = 0 m (Velocity coloring)
The varying lengths of fairings result in differences in pressure distribution on the windward and leeward sides of the fairings. The pressure distribution patterns on the main body of the fairings are generally consistent, but the distribution area and the extent of their impact on the flow field vary. To quantitatively analyze the impact of fairings of different lengths on the aerodynamics of the train, the pressure coefficient (Cp) curves of the outer contour of the train’s upper surface at the mid-section with the normal direction passing through the origin (y-direction) and the contour plot of the overall Cp distribution of the train are extracted and shown in Fig. 12. The dimensionless position X/Ltrain is defined for ease of analysis. Fig. 12a presents the contour plots of the pressure coefficient distribution on the top surface of the train corresponding to fairings of different lengths. From the graph, it can be observed that after installing fairings of different lengths, the pressure distribution on the leading car, the connection between the leading car and the middle car, and the streamlined region of the tail car overlap to a large extent. The leading end of the fairing experiences positive pressure over a large area due to the impact of high-speed airflow. The presence of fairings obstructs the direct flow of high-speed airflow along the train’s body towards the tail car, and some of the airflow impinges on the fairing surface. After passing over the top of the fairings, the airflow continues to flow downward along the fairing surface, impacting the end of the middle car’s body. On the leeward side of the fairings, the high-speed airflow flows downward along the fairing surface after passing through the leeward side of the fairings, impacting the tail end of the middle car, the leading end of the tail car, and the connection between the middle and tail cars, generating positive pressure. This leads to an increase in the pressure difference and, consequently, an increase in the aerodynamic drag on the tail car. As the length of the fairings decreases, the area of the positive pressure region influenced by the wake of the fairings on the front of the tail car also decreases. This can explain the phenomenon of increased lift on the tail car as the length of the fairings decreases. In Region 1 of Fig. 12b, the pressure curve experiences a sudden change due to the variation in the body contour at the connection between the leading car and the middle car. In the magnified views of Regions 2 and 3 in Fig. 12b, it can be observed that as the length of the fairings increases, the amplitude of the pressure coefficient on the windward side of the fairings gradually increases and shifts forward, while the amplitude on the leeward side gradually decreases and shifts backward, while the overall distribution pattern remains consistent. In Region 3, the minimum value of the pressure coefficient at the connection between the middle and tail car increases with increasing fairing length, while the maximum value remains unchanged.
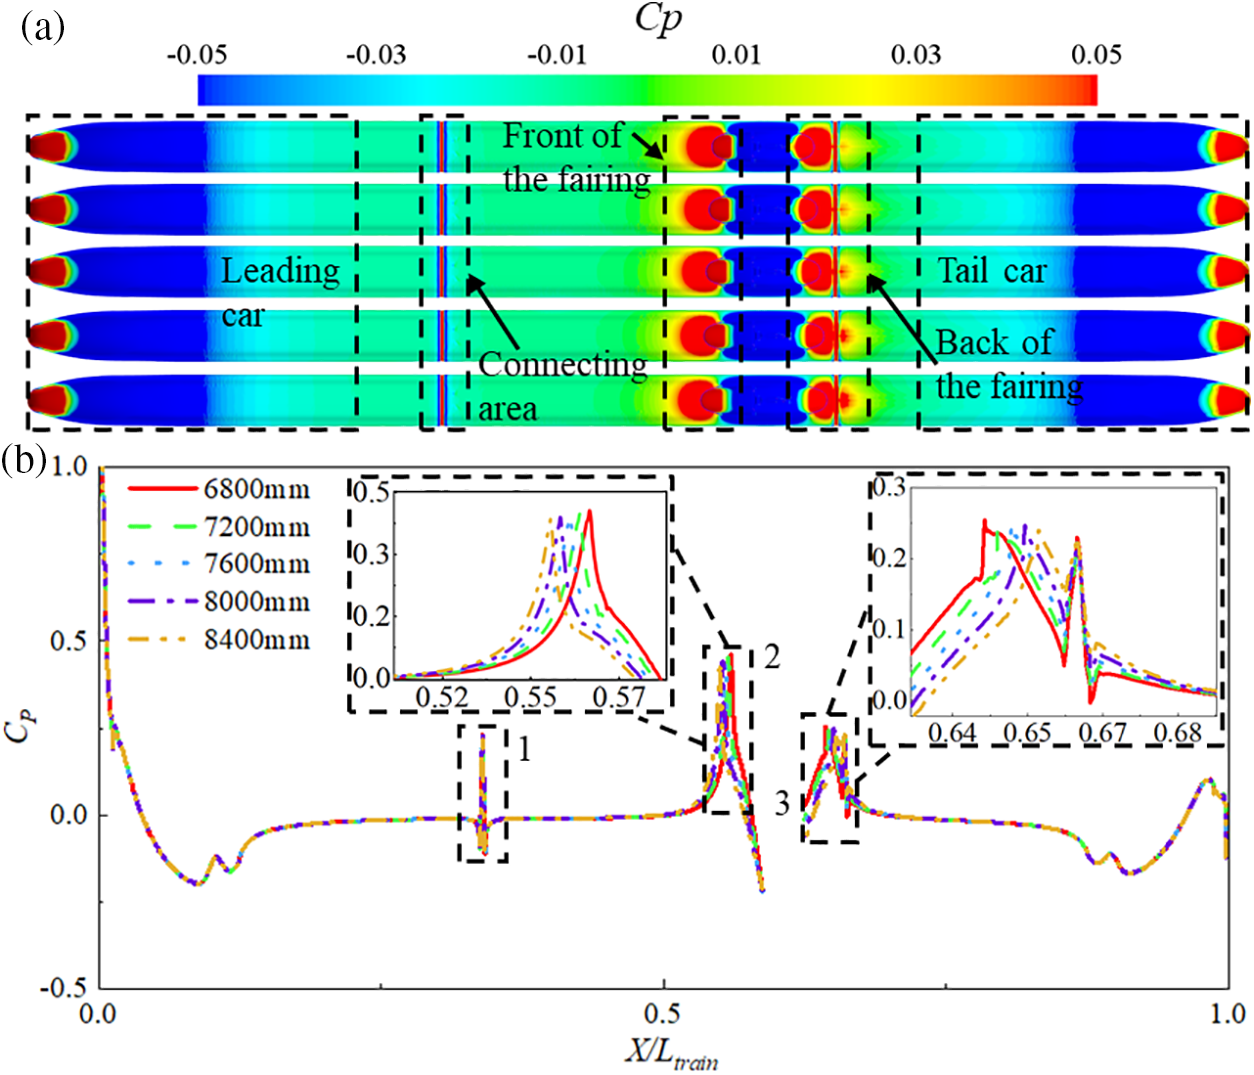
Figure 12: Distribution of pressure coefficient CP of the outer contour line of the middle section of the train
The growth of the boundary layer thickness along the train body affects the aerodynamic characteristics of the train. Fig. 13 shows the distribution of boundary layer thickness on different sections of the train after installing fairings of different lengths. The 99% velocity contour of the incoming flow speed is selected to represent the boundary layer thickness around the train. From Fig. 13, it can be observed that models with fairings of different lengths exhibit similar boundary layer distribution patterns. Fig. 13a provides a schematic of the different cross-sectional locations. The boundary layer at the y = 0 m section of the train body is shown in Fig. 13b, where it can be seen that the boundary layer thickness increases continuously from the leading car to the middle car. A thicker boundary layer is formed after reaching the leading end of the fairings. Comparing the boundary layer thickness on the windward side formed by fairings of different lengths, it can be observed that the fairings with a length of 6800 mm generate the thickest boundary layer. Since a thicker boundary layer results in greater aerodynamic drag, this phenomenon can explain the increase in aerodynamic drag of the fairings with decreasing length. The boundary layer thickness at x = 4 m of the train body is shown in Fig. 13c. After installing fairings of different lengths, the boundary layer thickness in the lower part of the roof of the train body remains almost the same, with only slight differences observed on the windward side of the fairings. As the fairing length increases from 6800 to 7600 mm, the boundary layer thickness increases with the fairing length. This indicates that the airflow above the fairings is more easily accelerated by shorter fairings with smaller boundary layer areas, resulting in higher resistance. This pattern aligns with the changes in resistance caused by variations in fairing length. When the fairing length continues to increase to 8400 mm, the change in boundary layer thickness becomes relatively small. Figs. 13d and 13eshow the top view and a zoomed-in section of the boundary layer thickness at the z = 4 m section. It can be observed that the airflow flows backward along the surface of the train body, and the boundary layer thickness undergoes significant contraction in the middle part of the fairings, with the degree of contraction decreasing with increasing fairing length. As the airflow continues to flow over the fairings, thickness variations occur in the streamlined region of the tail car.
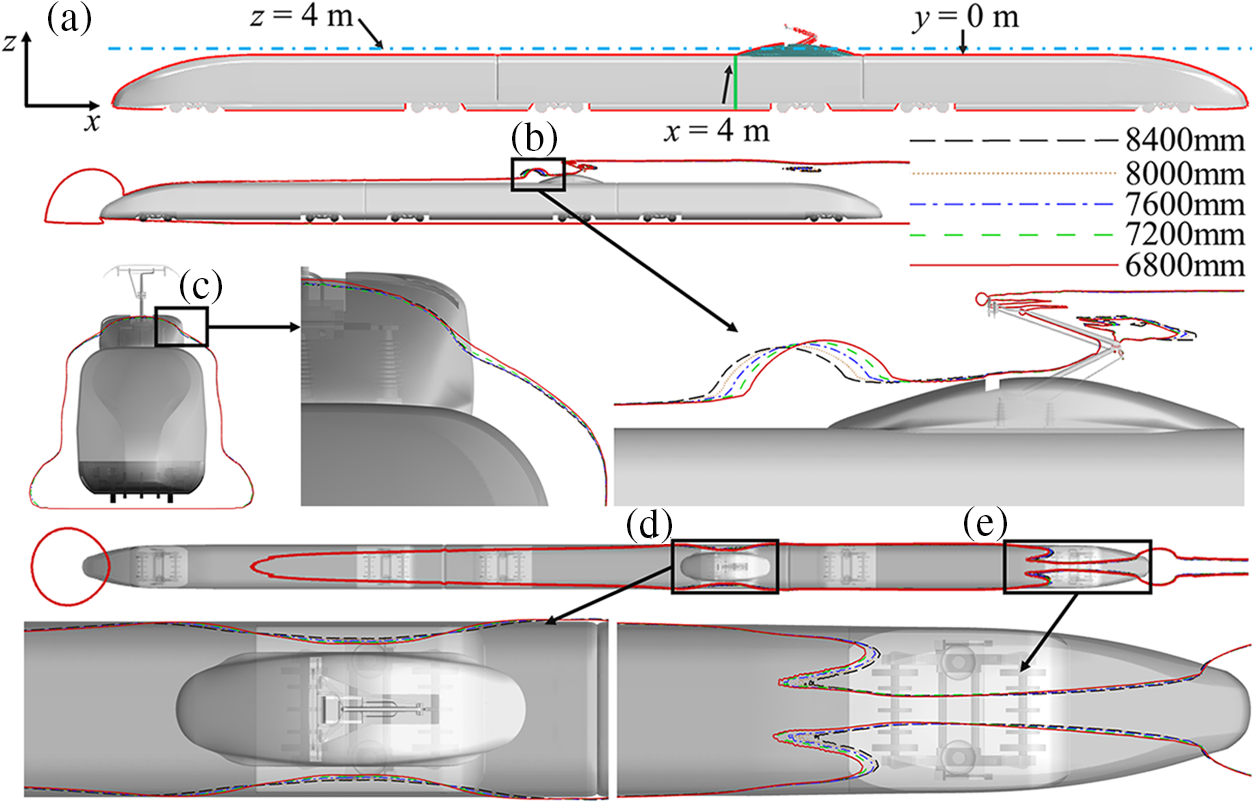
Figure 13: Boundary layer thickness around the train (a) Schematic diagram of the position of the section (b) section at y = 0 m (c) Longitudinal section at x = 4 m (d) Middle car section at z = 4 m of the fairing (e) z = 4 m
To investigate the reasons for the changes in aerodynamic drag on various components of the pantograph, the pressure distribution on the upper and lower arm rods of the pantograph with different lengths of fairings is extracted, as shown in Fig. 14. Comparing before and after the installation of fairings, it is evident that the pressure on the windward side of the main rods, lower arm rod, and the crossbar at the joint between the lower arm rod and the frame decreases significantly, while the pressure distribution at the joint between the upper and lower arm rods and the upper end of the upper arm rod undergoes minor changes. Comparing the effects of fairings of different lengths on the pressure distribution of the flow field on the upper and lower arm rods of the pantograph, it can be observed that after increasing the fairing length from 6800 to 8400 mm, the pressure distribution on the main body of the upper and lower arm rods remains consistent, with the main difference being the increasing positive pressure area on the surface of the lower arm rod. However, the pressure distribution on the surface of the upper arm rod undergoes minor changes.
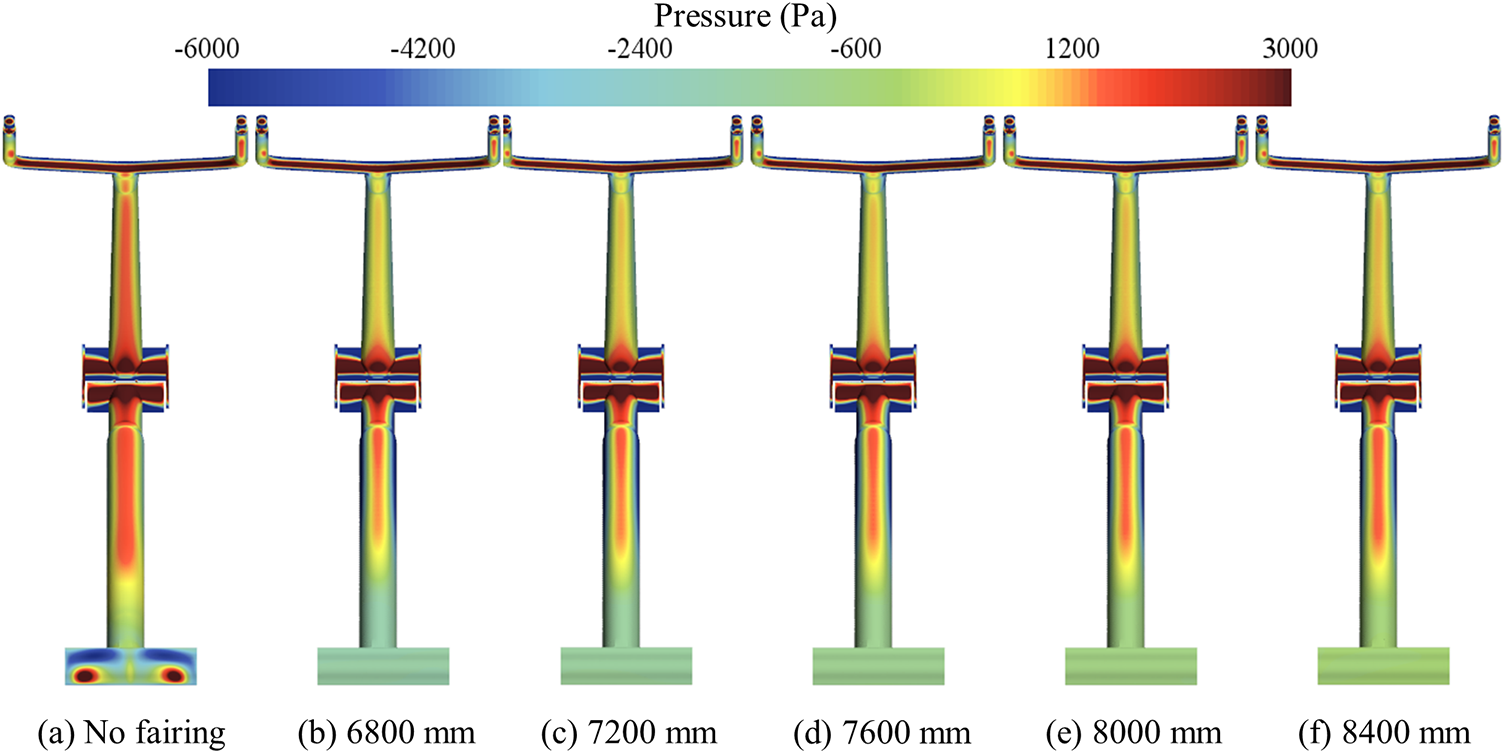
Figure 14: Surface pressure distribution of the upper and lower arm rods
The variation in the area of the positive pressure region mentioned above is one of the reasons for the changes in aerodynamic drag. Additionally, the different distribution of negative pressure on the windward side of the upper and lower surfaces of the main rod also contributes to the changes in aerodynamic drag. The aerodynamic drag and lift on the upper and lower arm rods are primarily caused by the pressure difference between the windward and leeward sides. To quantify the pressure changes more precisely, the pressure data on the upper and lower surfaces of the upper and lower arm rods are extracted, as shown in Figs. 15 and 16. After installing fairings, there is little change in the pressure distribution on the surface of the upper arm rod. However, significant changes occur at the joint between the lower arm rod and the frame, where the peak pressure decreases and the pressure fluctuation disappears, as shown in Fig. 16b. After installing fairings, by comparing the pressure differences between the upper and lower surfaces of the upper and lower arm rods in the figures, it can be observed that the pressure difference between the upper and lower surfaces of the main rods increases, leading to an increase in the aerodynamic drag and lift on the upper and lower arm rods. Comparing the pressure curves of the upper and lower arm rods of the pantograph with different fairing lengths, as shown in the zoomed-in view of the pressure in Fig. 15a, it can be seen that the negative pressure on the upper surface of the main rod is greatest when a fairing of 6800 mm in length is installed, and the magnitude of the negative pressure decreases with increasing fairing length. In Fig. 16b, the lower surface at the upper end of the lower arm rod changes from positive pressure to negative pressure after installing fairings, and the pressure values on the main rod decrease. In the zoomed-in view of the pressure, the trend of pressure magnitude with fairing length is consistent with that of the upper surface.
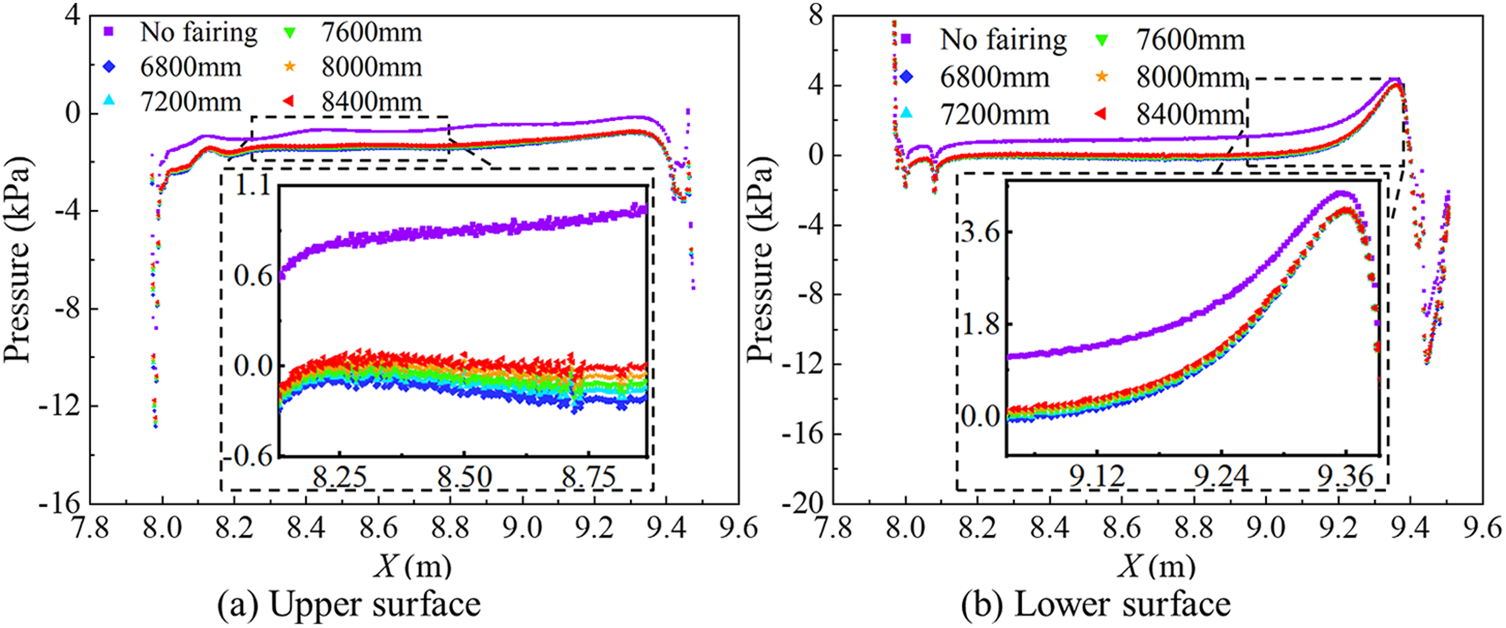
Figure 15: Pressure curve of the middle section of the upper arm rod
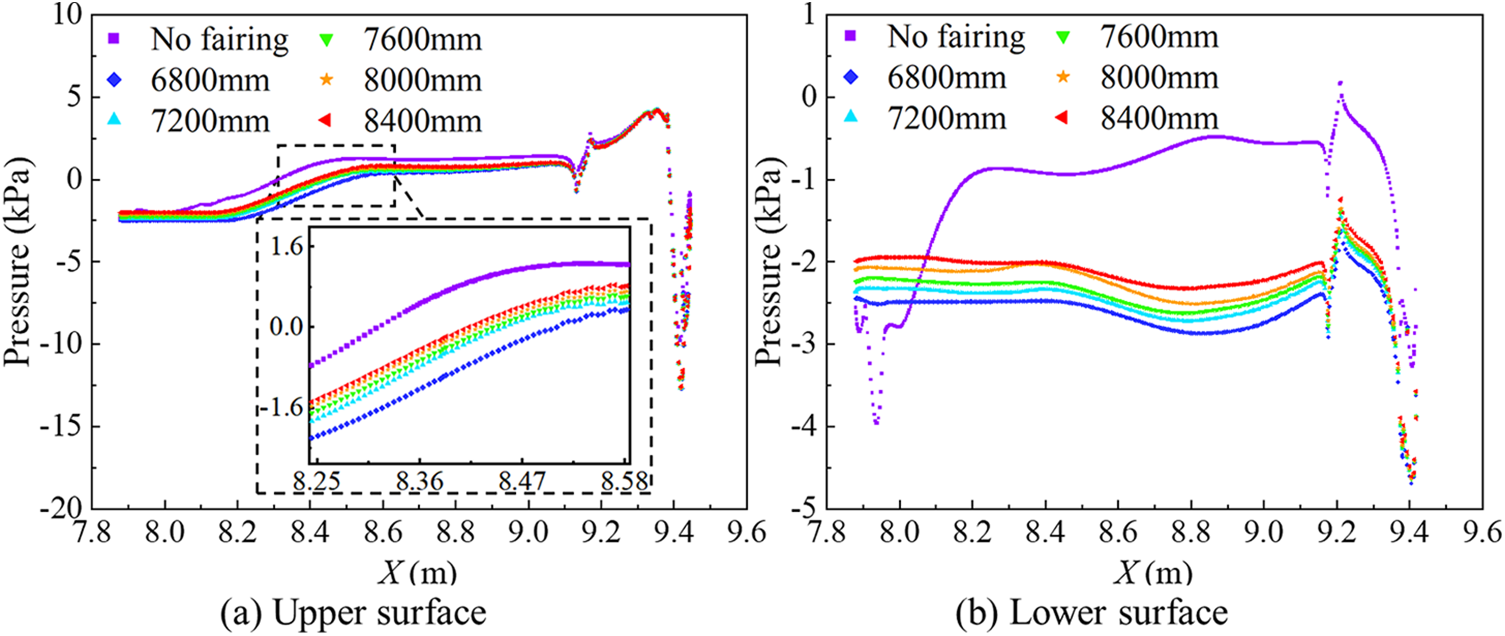
Figure 16: Pressure curve of the middle section of the lower arm rod
By conducting numerical simulations on a three-car high-speed train model operating at a speed of 400 km/h, we investigated the impact of installing fairings of varying lengths on the aerodynamic characteristics of the train, pantograph, and the surrounding flow field. The study yielded the following main conclusions:
(1) At a speed level of 400 km/h, the aerodynamic drag of the pantograph accounts for 10.9% of the total aerodynamic drag of the high-speed train. The main contributors to the aerodynamic drag are the pantograph frame and insulators, constituting 58.8% of the total drag. The remaining components, listed in descending order, contributing to drag are the strip, support of the strip, lower arm rod, upper arm rod, balance rod, and pull rod.
(2) The installation of fairings on the pantograph enhances the flow field structure beneath it, diminishing the direct impact of airflow on the pantograph. The fairings alter the airflow direction affecting the lower portion of the pantograph, inducing lift in the opposite direction on the lower structure. The fairings’ encompassing effect significantly reduces the pressure difference between the front and rear of the pantograph’s lower part, thereby lowering the pantograph’s drag. The installation of fairings decreases the overall aerodynamic drag of the train, achieving a drag reduction rate of 3.36%. Additionally, it increases lift on the middle car and decreases lift on the tail car.
(3) As the fairing length increases, the aerodynamic drag of the fairings gradually decreases. Once the fairing length reaches 7200 mm, further lengthening has minimal impact on the total aerodynamic drag of the train. Considering factors such as economy, materials, and aerodynamic drag, a fairing length of 8000 mm is a preferable design option.
Acknowledgement: None.
Funding Statement: This work supported by the National Natural Science Foundation of China (12172308, 52072319) and the Independent Project of State Key Laboratory of Rail Transit Vehicle System (2023TPL-T06).
Author Contributions: The authors confirm contribution to the paper as follows: study conception and design: Yan Li, Tian Li; data collection: Xiang Kan; analysis and interpretation of results: Xiang Kan, Tian Li, Jiye Zhang; draft manuscript preparation: Xiang Kan. All authors reviewed the results and approved the final version of the manuscript.
Availability of Data and Materials: The data presented in this study are available from the corresponding author, upon reasonable request. The data are not publicly available due to privacy.
Conflicts of Interest: The authors declare that they have no conflicts of interest to report regarding the present study.
References
1. Raghunathan, R. S., Kim, H. D., Setoguchi, T. (2002). Aerodynamics of high-speed railway train. Progress in Aerospace Sciences, 38(6–7), 469–514. https://doi.org/10.1016/S0376-0421(02)00029-5 [Google Scholar] [CrossRef]
2. Kwon, H. B., Park, Y. W., Lee, D. H., Kim, M. S. (2001). Wind tunnel experiments on Korean high-speed trains using various ground simulation techniques. Journal of Wind Engineering and Industrial Aerodynamics, 89(13), 1179–1195. https://doi.org/10.1016/S0167-6105(01)00107-6 [Google Scholar] [CrossRef]
3. Dai, Z., Li, T., Zhou, N., Zhang, J., Zhang, W. (2022). Numerical simulation and optimization of aerodynamic uplift force of a high-speed pantograph. Railway Engineering Science, 30(1), 117–128. https://doi.org/10.1007/s40534-021-00258-7 [Google Scholar] [CrossRef]
4. Sueki, T., Ikeda, M., Takaishi, T., Kurita, T., Yamada, H. (2010). Reduction of aerodynamic noise from high-speed pantograph using porous materials. Journal of Environment and Engineering, 5(3), 469–484. https://doi.org/10.1299/jee.5.469 [Google Scholar] [CrossRef]
5. Iglesias, E. L., Thompson, D. J., Smith, M. G. (2017). Component-based model to predict aerodynamic noise from high-speed train pantographs. Journal of Sound and Vibration, 394, 280–305. https://doi.org/10.1016/j.jsv.2017.01.028 [Google Scholar] [CrossRef]
6. Liu, H., Zhou, S., Chen, R., Li, Z., Zhang, S. et al. (2022). Numerical study on the aeroacoustic performance of different diversion strategies in the pantograph area of high-speed trains at 400 km/h. Applied Sciences, 12(21), 10702. https://doi.org/10.3390/app122110702 [Google Scholar] [CrossRef]
7. Pombo, J., Ambrósio, J., Pereira, M., Rauter, F., Collina, A. et al. (2009). Influence of the aerodynamic forces on the pantograph-catenary system for high-speed trains. Vehicle System Dynamics, 47(11), 1327–1347. https://doi.org/10.1080/00423110802613402 [Google Scholar] [CrossRef]
8. Ikeda, M., Suzuki, M., Yoshida, K. (2006). Study on optimization of panhead shape possessing low noise and stable aerodynamic characteristics. Quarterly Report of RTRI, 47(2), 72–77. https://doi.org/10.2219/rtriqr.47.72 [Google Scholar] [CrossRef]
9. Suzuki, M., Ikeda, M., Yoshida, K. (2008). Study on numerical optimization of cross-sectional panhead shape for high-speed train. Journal of Mechanical Systems for Transportation and Logistics, 1(1), 100–110. https://doi.org/10.1299/jmtl.1.100 [Google Scholar] [CrossRef]
10. Lee, Y., Rho, J., Kim, K. H., Lee, D. H., Kwon, H. B. (2015). Experimental studies on the aerodynamic characteristics of a pantograph suitable for a high-speed train. Proceedings of the Institution of Mechanical Engineers, Part F: Journal of Rail and Rapid Transit, 229(2), 136–149. https://doi.org/10.1177/0954409713507561 [Google Scholar] [CrossRef]
11. Zhang, L., Zhang, J., Li, T., Zhang, W. (2017). Influence of pantograph fixing position on aerodynamic characteristics of high-speed trains. Journal of Modern Transportation, 25, 34–39. https://doi.org/10.1007/s40534-017-0125-y [Google Scholar] [CrossRef]
12. Kim, H., Hu, Z., Thompson, D. (2020). Numerical investigation of the effect of cavity flow on high speed train pantograph aerodynamic noise. Journal of Wind Engineering and Industrial Aerodynamics, 201, 104159. https://doi.org/10.1016/j.jweia.2020.104159 [Google Scholar] [CrossRef]
13. Kurita, T. (2011). Development of external-noise reduction technologies for Shinkansen high-speed trains. Journal of Environment and Engineering, 6(4), 805–819. https://doi.org/10.1299/jee.6.805 [Google Scholar] [CrossRef]
14. Dai, Z. Y., Li, T., Zhang, W. H., Zhang, J. (2020). Numerical study on aerodynamic performance of high-speed pantograph with double strips. Fluid Dynamics & Materials Processing, 16(1), 31–40. https://doi.org/10.32604/fdmp.2020.07661 [Google Scholar] [CrossRef]
15. Sun, Z. K., Wang, T. T., Wu, F. (2020). Numerical investigation of influence of pantograph parameters and train length on aerodynamic drag of high-speed train. Journal of Central South University, 27(4), 1334–1350. https://doi.org/10.1007/s11771-020-4370-6 [Google Scholar] [CrossRef]
16. Ikeda, M., Mitsumoji, T., Sueki, T., Takaishi, T. (2012). Aerodynamic noise reduction of a pantograph by shape-smoothing of panhead and its support and by the surface covering with porous material. Noise and Vibration Mitigation for Rail Transportation Systems, 118, 419–426. https://doi.org/10.1007/978-4-431-53927-8_50 [Google Scholar] [CrossRef]
17. Liu, H., Zhang, S., Liang, X., Zou, Y. (2022). The effect of covering structure in pantograph sinking platform on the aerodynamics of high-speed train. Engineering Applications of Computational Fluid Mechanics, 16(1), 2157–2175. https://doi.org/10.1080/19942060.2022.2133517 [Google Scholar] [CrossRef]
18. Qin, D., Dai, Z., Zhou, N. (2022). Effect of pantograph subsidence on its aerodynamic and acoustic behavior. China Mechanical Engineering, 33(20), 2509–2519 (In Chinese). https://doi.org/10.3969/j.issn.1004-132x.2022.20.015 [Google Scholar] [CrossRef]
19. Xiao, C., Yang, M., Tan, C., Lu, Z. (2020). Effects of platform sinking height on the unsteady aerodynamic performance of high-speed train pantograph. Journal of Wind Engineering and Industrial Aerodynamics, 204, 104284. https://doi.org/10.1016/j.jweia.2020.104284 [Google Scholar] [CrossRef]
20. Lee, Y., Kim, K. H., Rho, J. H., Kwon, H. B. (2016). Investigation on aerodynamic drag of Korean high speed train (HEMU-430X) due to roof apparatus for electrical device. Journal of Mechanical Science and Technology, 30, 1611–1616. https://doi.org/10.1007/s12206-016-0316-1 [Google Scholar] [CrossRef]
21. Li, X., Zhou, D., Jia, L., Yang, M. (2023). Numerical study of the influence of dome shape on the unsteady aerodynamic performance of a high-speed train’s pantograph subjected to crosswind. Journal of Traffic and Transportation Engineering (English Edition), 10(1), 13–30. [Google Scholar]
22. Carnevale, M., Facchinetti, A., Maggiori, L., Rocchi, D. (2016). Computational fluid dynamics as a means of assessing the influence of aerodynamic forces on the mean contact force acting on a pantograph. Proceedings of the Institution of Mechanical Engineers, Part F: Journal of Rail and Rapid Transit, 230(7), 1698–1713. https://doi.org/10.1177/0954409715606748 [Google Scholar] [CrossRef]
23. Klein, R. (1995). Semi-implicit extension of a Godunov-type scheme based on low Mach number asymptotics I: One-dimensional flow. Journal of Computational Physics, 121(2), 213–237. https://doi.org/10.1016/S0021-9991(95)90034-9 [Google Scholar] [CrossRef]
24. Huo, X., Liu, T., Chen, Z., Li, W., Gao, H. et al. (2021). Comparative analysis of the aerodynamic characteristics on double-unit trains formed by different types of high-speed train. Journal of Wind Engineering and Industrial Aerodynamics, 217, 104757. https://doi.org/10.1016/j.jweia.2021.104757 [Google Scholar] [CrossRef]
25. Li, W., Liu, T., Zhou, L., Chen, Z., Xia, Y. et al. (2023). Impact of ballast length on train aerodynamics for a wind tunnel layout via CFD analysis. Alexandria Engineering Journal, 65, 275–293. https://doi.org/10.1016/j.aej.2022.10.040 [Google Scholar] [CrossRef]
Cite This Article
 Copyright © 2024 The Author(s). Published by Tech Science Press.
This work is licensed under a Creative Commons Attribution 4.0 International License , which permits unrestricted use, distribution, and reproduction in any medium, provided the original work is properly cited.
 Downloads
 Citation Tools