
 Submit a Paper
 Propose a Special lssue
 Open Access
ARTICLE
Smoothed-Particle Hydrodynamics Simulation of Ship Motion and Tank Sloshing under the Effect of Regular Waves
School of Civil Engineering and Transportation, South China University of Technology, Guangzhou, 510641, China
* Corresponding Author: Jialong Jiao. Email:
Fluid Dynamics & Materials Processing 2024, 20(5), 1045-1061. https://doi.org/10.32604/fdmp.2023.043744
Received 11 July 2023; Accepted 26 October 2023; Issue published 07 June 2024
 View Full Text
 Download PDF
Abstract
Predicting the response of liquefied natural gas (LNG) contained in vessels subjected to external waves is extremely important to ensure the safety of the transportation process. In this study, the coupled behavior due to ship motion and liquid tank sloshing has been simulated by the Smoothed-Particle Hydrodynamics (SPH) method. Firstly, the sloshing flow in a rectangular tank was simulated and the related loads were analyzed to verify and validate the accuracy of the present SPH solver. Then, a three-dimensional simplified LNG carrier model, including two prismatic liquid tanks and a wave tank, was introduced. Different conditions were examined corresponding to different wave lengths, wave heights, wave heading angles, and tank loading rates. Finally, the effects of liquid tank loading rate on LNG ship motions and sloshing loading were analyzed, thereby showing that the SPH method can effectively provide useful indications for the design of liquid cargo ships.Keywords
In recent decades, the demand for clean energy has increased worldwide. As a clean energy source, liquefied natural gas (LNG) provides obvious advantages over other kinds of traditional energy sources. The motion of a liquid cargo ship in waves can induce sloshing of the fluid in the tank, and the force or moment generated by the tank sloshing will in turn act on the ship hull, thus having a mutually coupled effect on the motion of the ship. Therefore, it is very important to accurately predict the motion response of LNG vessels in waves so as to ensure the safety of the transportation process.
Due to the complexity of the coupled effects of floating ship motions and tank sloshing, the tank model test is an indispensable tool in solving this problem. Francescutto et al. [1] conducted a model test on the motion response of liquid cargo ships in regular beam waves and analyzed the influence of loading rate on the roll motion response of the vessel. Rognebakke et al. [2] used the model test to study the linear motion phenomenon of steady-state ships during severe tank sloshing, and it was verified that the hypothesis of linear ship motions is reasonable. Xu et al. [3] conducted model test to estimate the sloshing loads in the tank of liquid cargo chamber and studied the impact pressure characteristics.
In recent years, some researchers have used potential flow theory and computational fluid dynamics (CFD) methods to study the hydrodynamic performance of liquid cargo ships. Xin et al. [4] investigated large amplitude motion and severe sloshing of a prismatic tank with or without a baffle by a Cartesian grid-based three-dimensional (3D) multiphase flow model. The variation of the excitation frequency with the pressure amplitude and the effects of the baffle height on the impulsive pressure and the wave elevation were studied. Pablo et al. [5] used dynamic grid technology and free liquid surface capture technique to carry out numerical calculations of the heave and pitch motions of two ships in regular head waves. The study showed that due to the complexity of multi-floating motions, there were still many difficulties in solving the hydrodynamic interference of the two ships in waves. Jiang et al. [6,7] used the viscous two-phase flow simulation method in OpenFOAM of the volume of fluid (VOF) interface capture technique to analyze the influence of the coupling effect on ship motion response under different filling conditions, which showed that the coupling effect was significant under low filling conditions. Sun et al. [8] calculated ship motions coupled with tank sloshing in frequency domain.
Smooth Particle Hydrodynamics (SPH) is a Lagrangian particle method, which has obvious advantages in dealing with large deformation flow problems and is especially useful for the simulation of liquid tank sloshing. It is increasingly used to simulate free surface flow and associated fluid-structure interaction problems. Xu et al. [9] applied the SPH method to the numerical simulation of the liquid sloshing in a partially filled tank and compared the results with those by ALE formulation to validate the efficiency and usefulness of SPH method. Green et al. [10] presented a SPH formulation that captures the sloshing frequencies of tanks and accurately simulates long-duration violent sloshing in partially filled tanks of arbitrary shape. Trimulyono et al. [11] compared the single-phase SPH, two-phase SPH, and experimental results of tank sloshing and discussed the role of air-phase in terms of sloshing.
The SPH method has significant advantages in the investigation of tank sloshing problems. Currently, the SPH method is mainly used to simulate independent problems such as tank sloshing or ship motions in waves [12–14], while the coupled problem of ship motion with tank sloshing which involves both internal and external flow fields is still rare [15]. In this paper, the open-source code package DualSPHysics was used to study the coupled effect of LNG ship motion and tank sloshing under different regular wave conditions. The effect of loading rate on ship motions and sloshing loads was systematically analyzed. This study provides a method and valuable engineering application value for the design and assessment of the hydrodynamic performance of liquid cargo ships such as LNG ships.
In this paper, an SPH numerical simulation based on C++ and CUDA (Compute Unified Device Architecture) was used to simulate the single-phase liquid flow sloshing by using the SPH method of the graphics processing unit (GPU) acceleration technique [16]. DualSPHysics is an open-source CFD solver based on a weak compressible hypothesis, which does not need to impose boundary conditions on the free surface and can perform parallel calculation of many particles using GPU. This overcomes the disadvantage of high computational cost of the traditional SPH method and improves the computational efficiency.
The SPH method discretizes the continuum into a series of particles, and the physical information of specific points is interpolated by the integral equation of the interpolation function:
where W is the smooth kernel function, r is the position vector of the particle, and h is the smoothing length. In this paper, the kernel function of Wendland was adopted [17]:
The equation of state of the fluid pressure and density is:
where γ = 7, the fluid density ρ0 = 1000 kg/m3.
In this paper, the Laminar + SPS [18] viscosity model was used to simulate the motion of a floating body in a numerical wave tank to handle the viscous dissipation of momentum with the water kinematic viscosity of 10−6 m2/s. The simulation of internal flow in the tank still used the Artificial model. The Symplectic scheme was adopted for the time step algorithm, which is of second-order accuracy in time and more suitable for wave generation. Modified dynamic boundary condition setting (mDBC) was applied on the numerical tank wall and body surface, which avoids disadvantages such as excessive dissipation of the dynamic boundary condition setting (DBC) [19].
3 Verification and Validation of Tank Sloshing Problem
To check and verify the accuracy of the SPH method, the numerical simulation result was used to compare with the corresponding tank sloshing experiment result reported by Jiang et al. [6] and Liu et al. [20]. The rectangular tank model with a tank length l = 0.5 m, width w = 0.57 m and height h = 0.5 m was established, as shown in Fig. 1. The free surface of fluid was 0.15 m high from the tank bottom. The fluid density of water was set at ρ = 1,000 kg/m3. The free surface elevation monitor G1 was fixed at 0.02 m from the left wall of the tank. The pressure monitoring point P0 was mounted on the left wall at a height of 0.15 m from the bottom. The tank was forced to move with simple harmonic motion along its length direction horizontally.

Figure 1: Tank model and measurement positions
where A = 0.005 m, ω = 6.0578 rad/s.
3.1.1 Convergence Analysis of Inter-Particle Distance
Table 1 presents the computation parameter information for different convergence study cases. Three schemes of inter-particle distance D/dp = 15, D/dp = 30, and D/dp = 50 were selected for simulations, where D is the water depth in the tank and dp is the particle distance. The time step 0.02 s was used for all the cases. Comparison of particle models of the tank for the three particle distance schemes is shown in Fig. 2. The impact pressure at P0 and the surface evolution at G1 by different schemes is compared in Fig. 3. The smaller particle distance (D/dp = 50) better captured the pressure peak and resulted in more stable free surface elevation. Generally, the difference in results obtained by the different particle distances was small. Therefore, considering the calculation accuracy and efficiency comprehensively, the scheme of D/dp = 15 (the particle distance of 0.01 m) was used in the subsequent simulations.


Figure 2: Tank models for three different particle distances

Figure 3: Comparison of the simulation results for different interparticle distances
3.1.2 Convergence Analysis of Time Steps
Three time steps, i.e., dt = 0.002 s, dt = 0.005 s, and dt = 0.02 s, were selected for simulations. The particle distance D/dp = 15 was used for all the three simulations. Comparison of the typical results for the three different time steps is shown in Fig. 4. The calculated results for different time steps generally showed good agreement among each other. Therefore, considering the computational efficiency and accuracy, dt = 0.02 s was selected as the optimized time step for the subsequent numerical simulations.
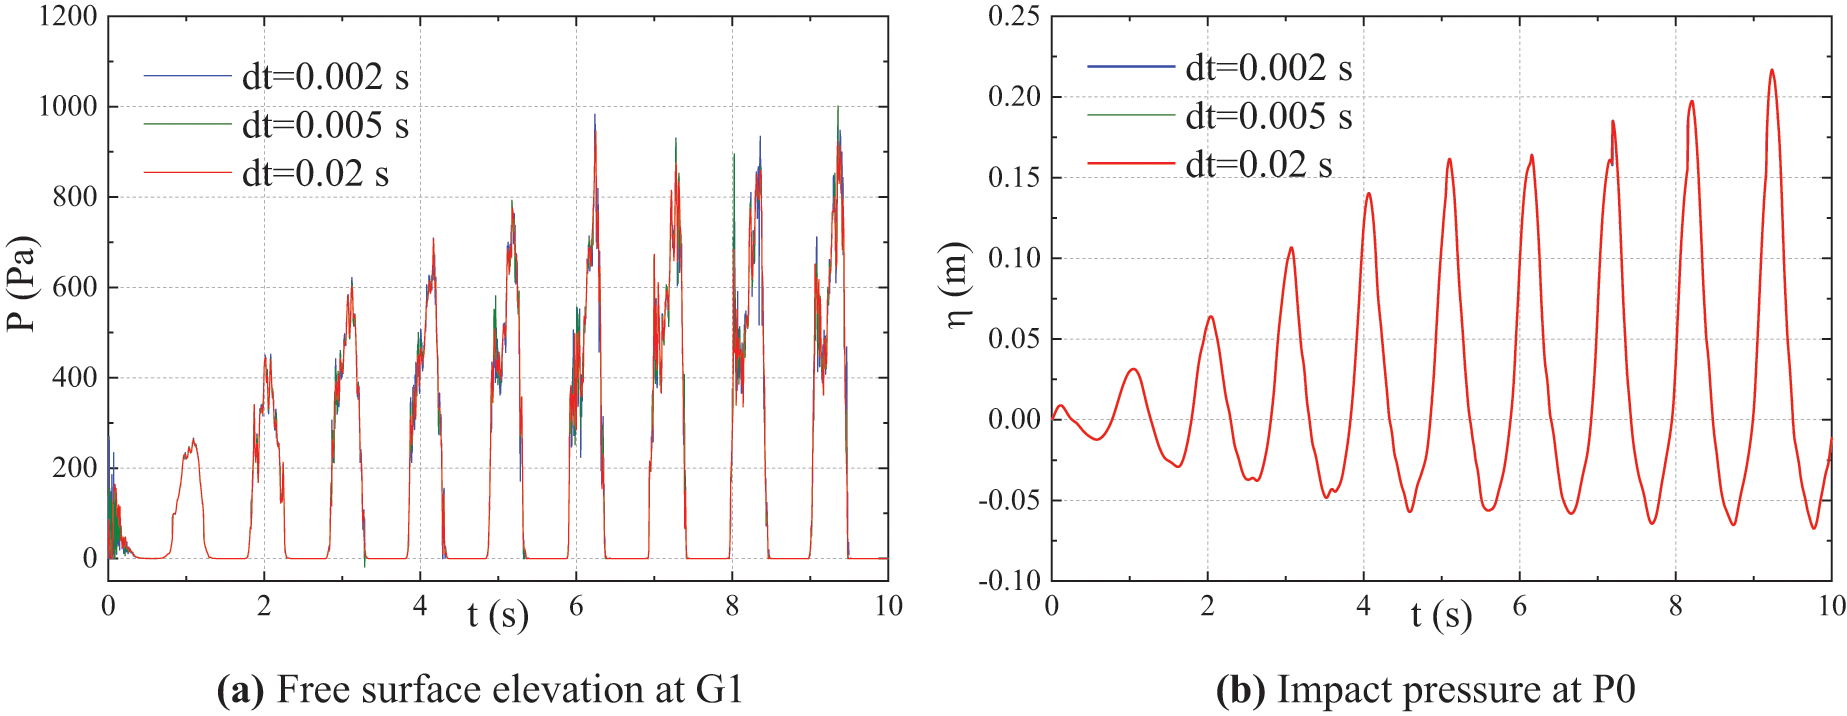
Figure 4: Comparison of the simulation results for different time steps
3.2 Liquid Sloshing Simulation Validation
The scheme of particle distance D/dp = 15 and the time step dt = 0.02 s was used in this section. The simulation duration for each case was 20 s. The simulated results of free surface elevation at G1 were compared with the result reported by Jiang et al. [6], which is shown in Fig. 5. The simulation results by the present SPH algorithm agreed well with the reported results, which confirmed the accuracy of the present method. The simulated flow distribution of tank sloshing at typical time instants obtained by the present SPH method is shown in Fig. 6. It demonstrated that the present method can well simulate some strong nonlinear phenomena such as free surface break and particle splashing.
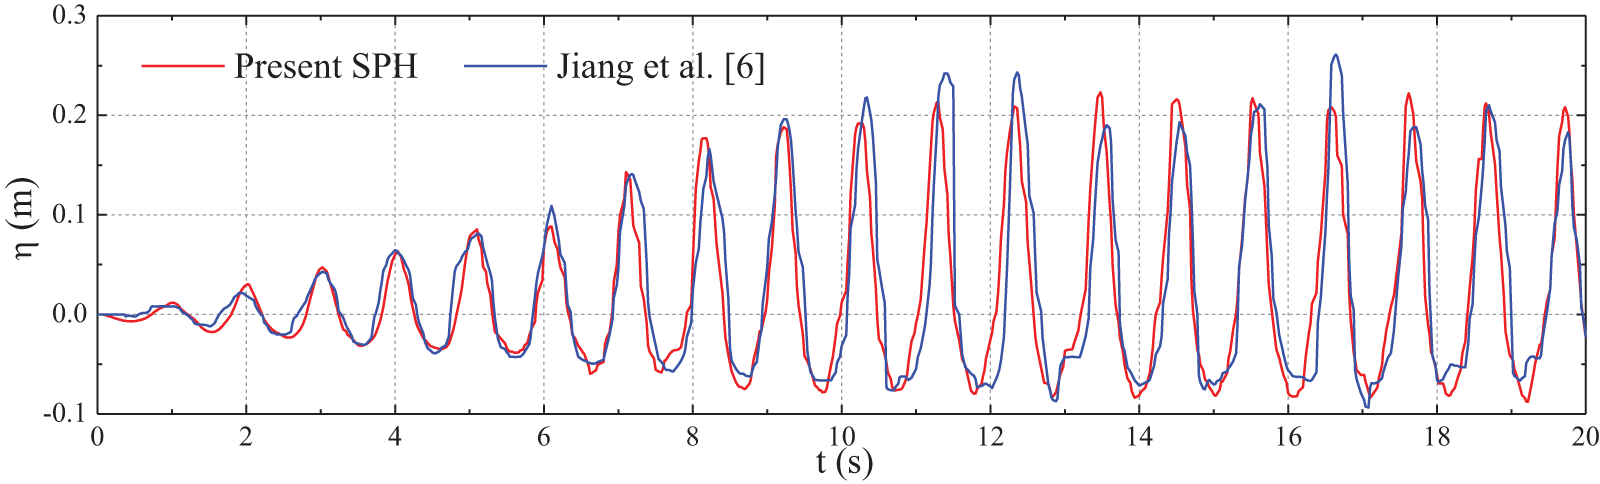
Figure 5: Comparisons of free surface elevation at G1 between the present SPH method and Jiang et al. [6]
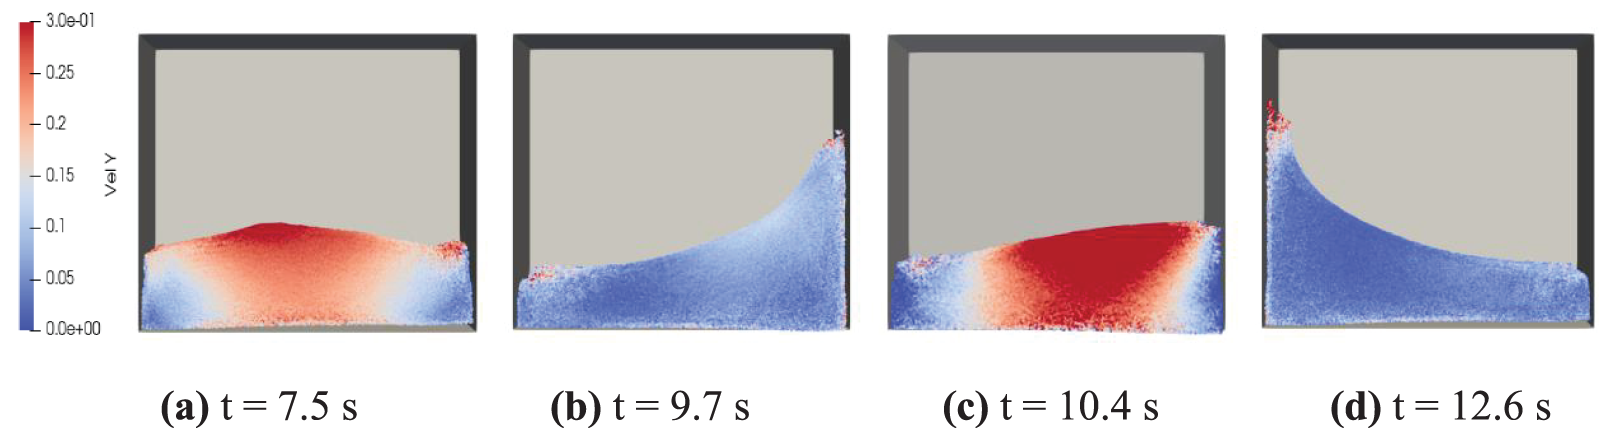
Figure 6: Snapshots of free surface at typical time instants
4 Numerical Setup of LNG Ship in Waves
4.1 Model of Simplified LNG Ship
A simplified LNG vessel with two prismatic liquid tanks was used for the numerical simulation of seakeeping problem. The 3D geometric models of the LNG ship and prismatic tank are shown in Fig. 7. The numerical simulation was carried out using a 1/100 scaled-down model. Main dimensions of the LNG vessel and liquid tank models are listed in Tables 2 and 3, respectively. More detailed geometric parameters regarding the model can be found as reported by Jiang et al. [6]. In this paper, the mass and the moment of inertia of the lightweight vessel were kept unchanged for different liquid loading conditions. The draft and displacement changed with different tank filling rate, which was more reasonable and in accordance with real situations. During the computational simulation, only the heave, roll, and pitch motions were released, while the surge, sway, and yaw motions were restrained.
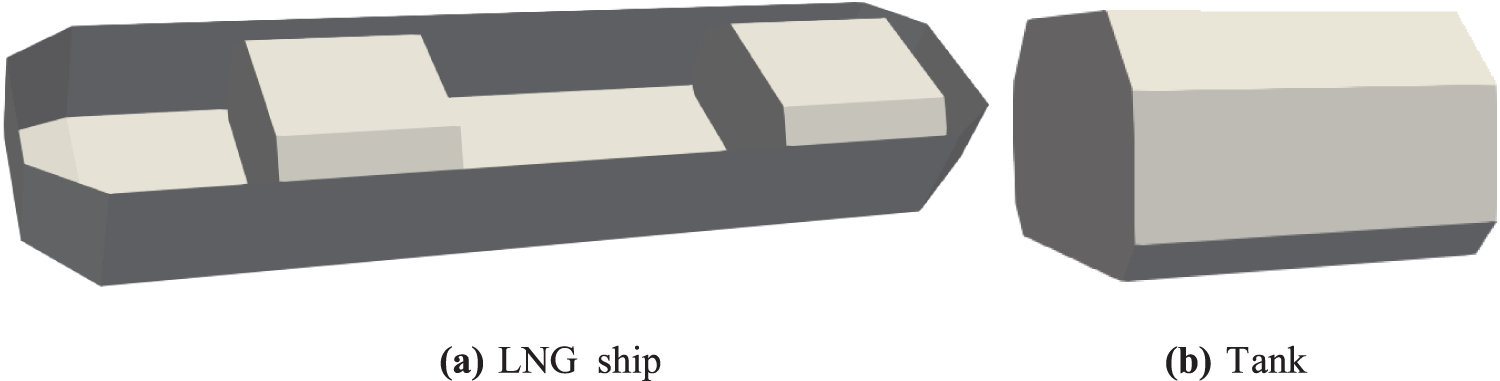
Figure 7: 3D view of the target LNG ship model


4.2 Numerical Wave Tank Simulation
As shown in Fig. 8, a numerical tank with length L = 8 m, width B = 6 m and height H = 2 m was established in the SPH solver. The coordinate origin of the fluid domain was set at the intersection of the middle longitudinal section of the LNG ship, the transverse section amidships, and the calm water surface. The dimensions of the fluid domain were −1.58L < x < 1.23L, −1.05L < y < 1.05L, and −0.66L < z < 0.45L. The side and bottom boundaries of the numerical tank were defined as the wall boundary condition. At the left end of the numerical tank, a plate with a width of 6 m, height of 3 m and thickness of 0.3 m was established for piston wave generation. To reduce the wave reflection from the other end of the tank wall, a 0.5 m wide damping zone was adopted on the end wall of the tank. The SPH solver was used to discretize the fluid domain, fluid particles were generated and filled in the numerical tank. The LNG ship and the liquid tanks were discretized into particle models, which are shown in Fig. 9. The fluid in liquid tanks was discretized into fluid particles with a particle distance of 0.01 m. The total number of particles in this numerical simulation was 14,395,794.
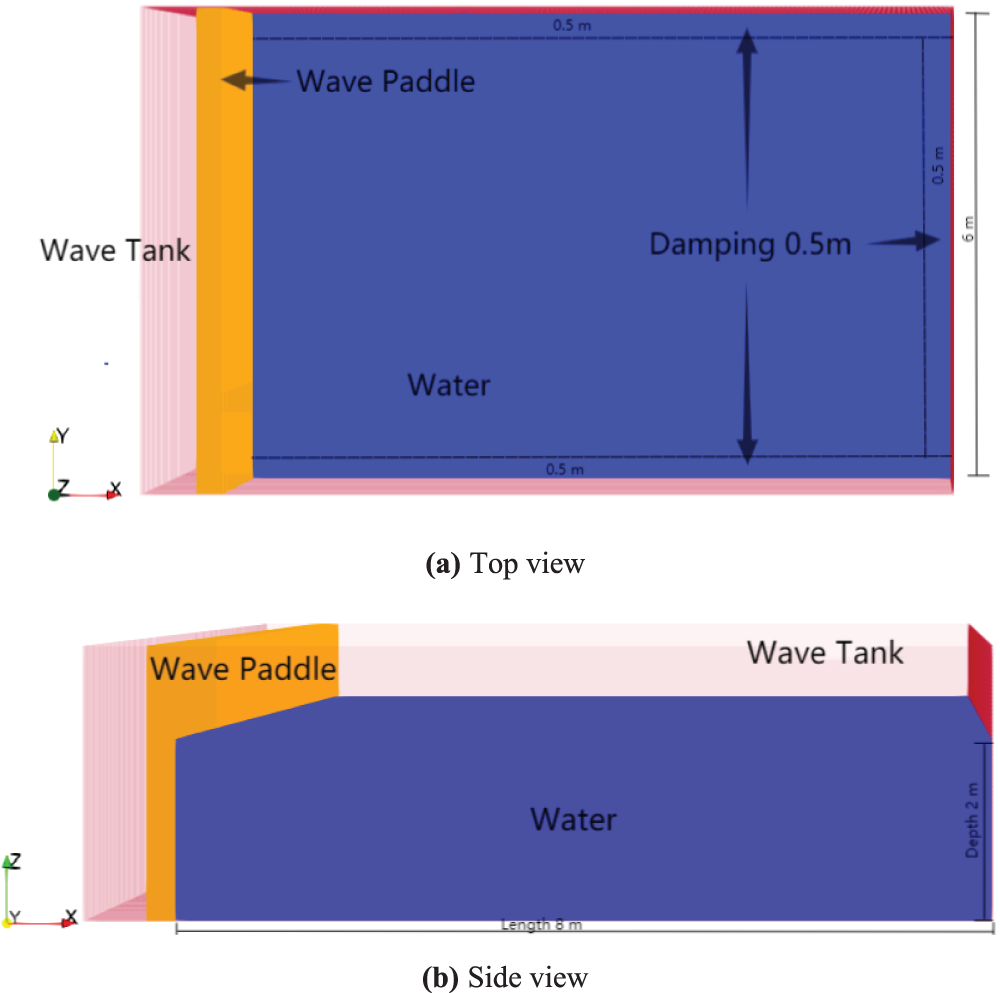
Figure 8: The particle model of the numerical tank
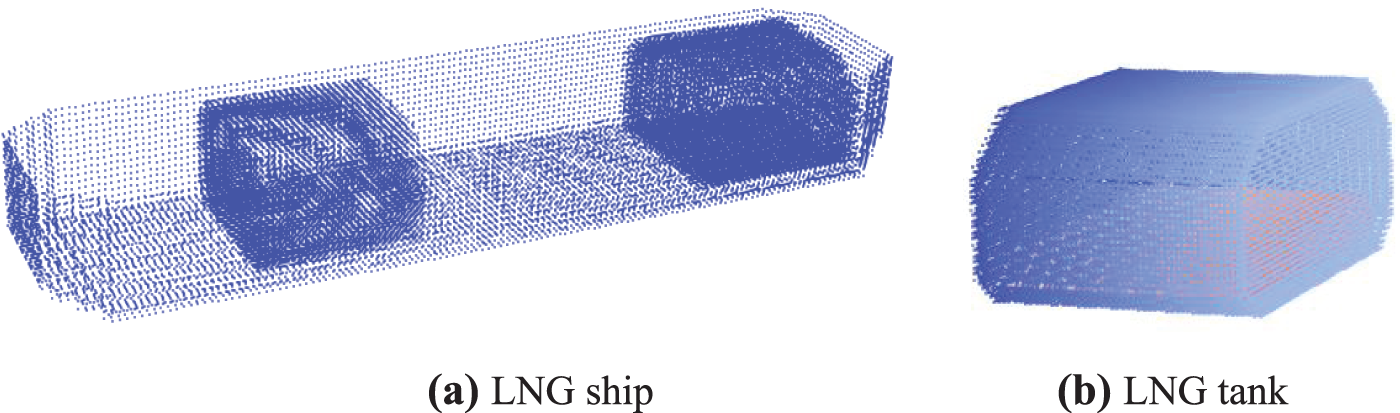
Figure 9: Particle models of the LNG ship and liquid tank
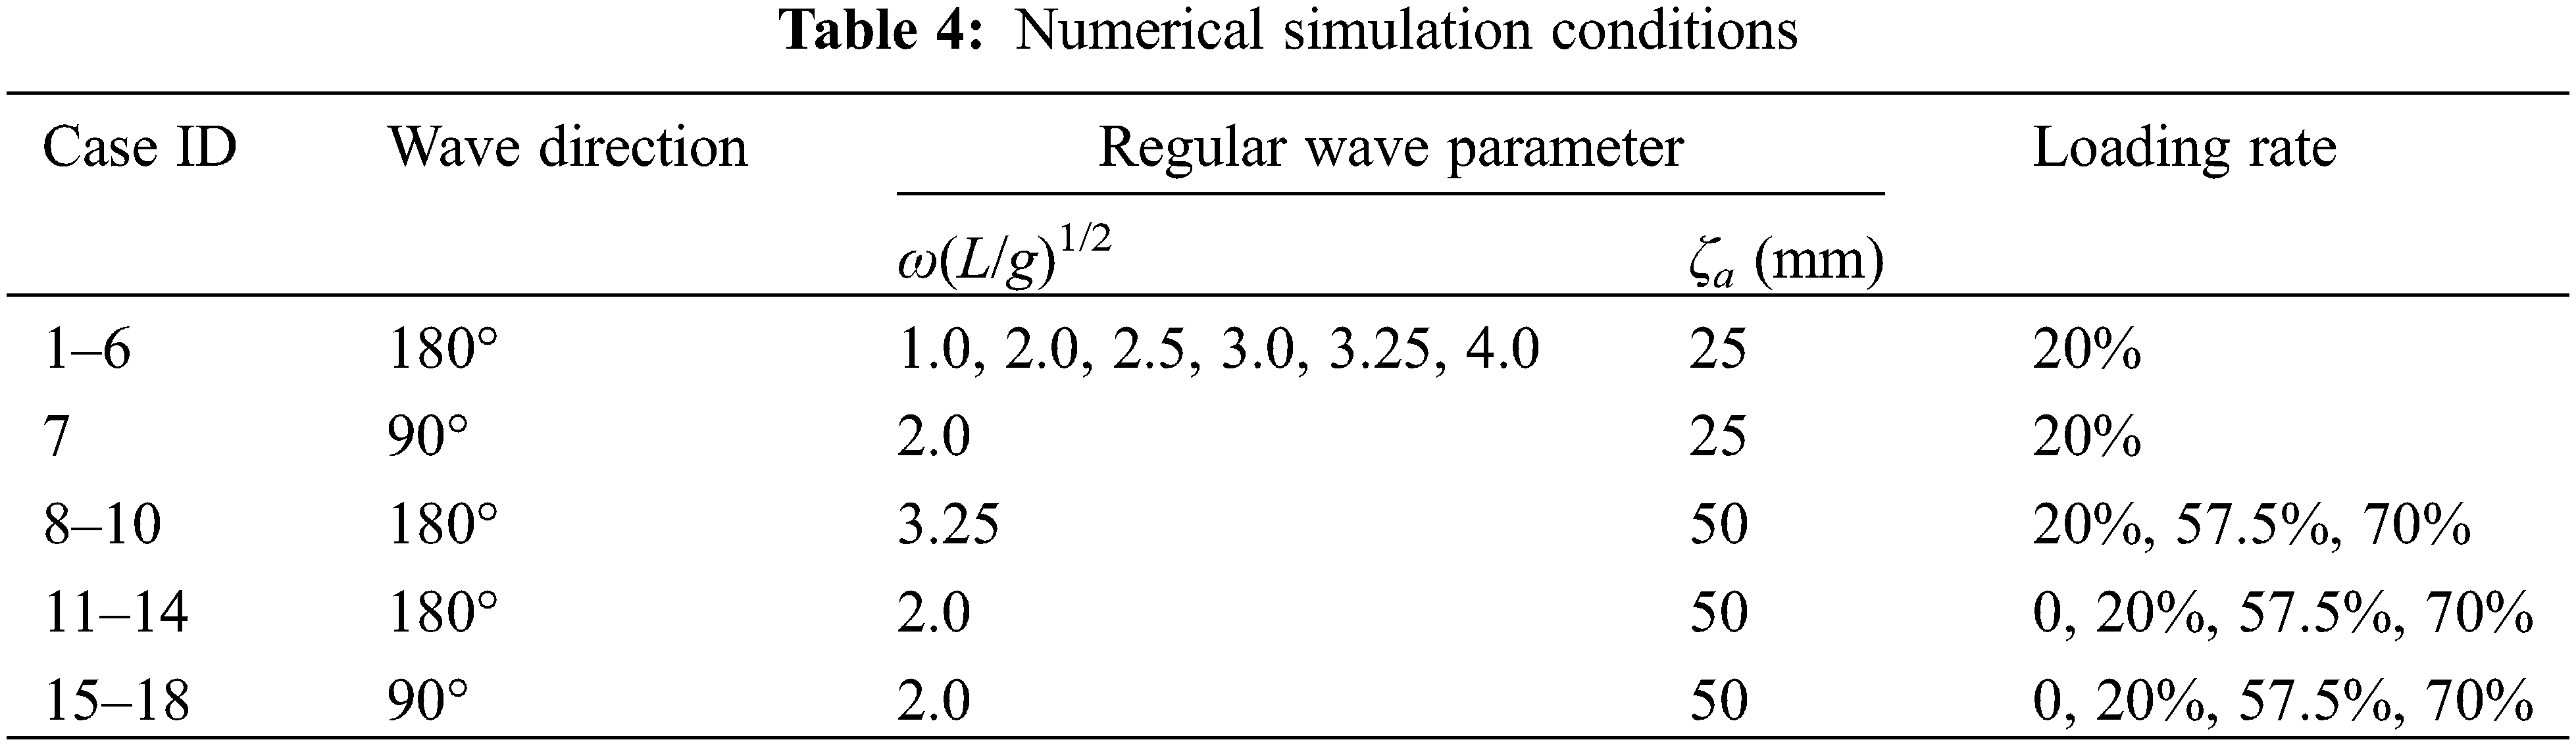
The LNG ship was operated with zero-forward speed in different regular wave conditions in head and beam seas. The selected calculation conditions in this paper are listed in Table 4. A total of 18 calculation conditions were computed in this paper. In Table 4, wave direction 180° and 90° stands for head wave and beam wave, respectively. Regular wave parameter with six wave frequencies ω(L/g)1/2 = 1.0, 2.0, 2.5, 3.0, 3.25 and 4.0 was used to obtain the RAO. The wave frequency ω(L/g)1/2 = 2 was used in many cases as this frequency was nearer the ship motion’s natural frequency. Two typical wave amplitudes of ζa = 25 and 50 mm were selected. Four typical loading rates of 0%, 20%, 57.5%, and 70% were utilized.
5 Analysis of Ship Motions and Liquid Sloshing Coupled Responses
5.1 Numerical Wave Simulation Results
Prior to the simulation of ship seakeeping responses, regular waves were generated in the tank without the presence of the ship to examine the incident waves. A typical wave of Case 2, i.e., ω(L/g)1/2 = 2 and ζa = 25 mm, was selected for the SPH wave simulation. The simulated free surface distribution and velocity distribution of the flow field in the fluid domain at a certain time instant are shown in Fig. 10. Comparison of the time history of the wave surface elevation monitored at 4.5 m from the wave maker between the monitored and the theoretical values is shown in Fig. 11. It confirmed that the adopted SPH method can simulate the regular waves well and provide stable and reliable incident waves for the subsequent study of the ship seakeeping problem.
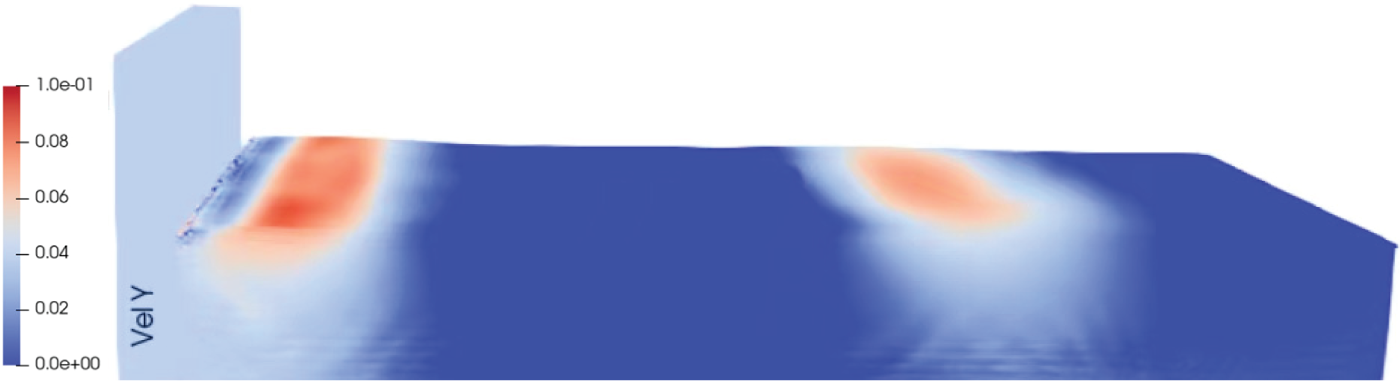
Figure 10: Velocity distribution of the fluid domain
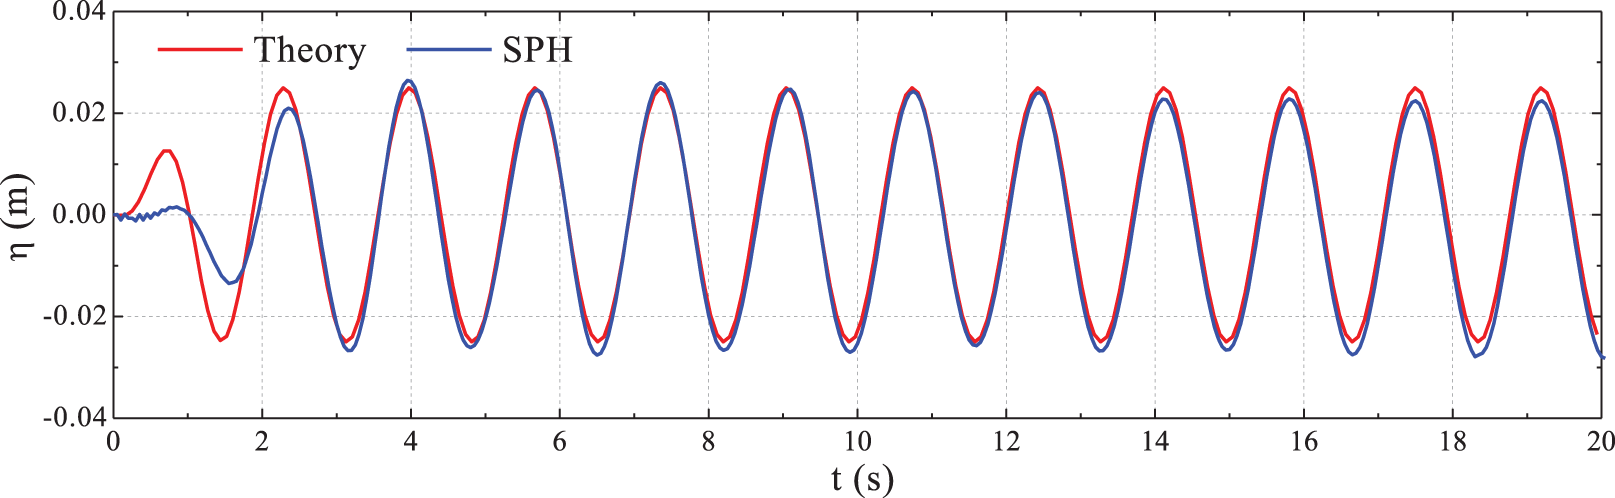
Figure 11: Comparisons of wave elevation between the SPH simulation and theoretical value
5.2 Typical Ship Motion Response
The coupled responses of the LNG ship motions and liquid tank sloshing were simulated. Typical results of Case 2 were selected for analysis. The incident wave had parameter of wave frequency ω(L/g)1/2 = 2 and wave amplitude ζa = 25 mm. Loading rate for both fore and aft liquid tanks was 20%, which is shown in Fig. 12. The ship was located in front of the wave maker to subject head waves without forward speed, which is shown in Fig. 13. The distribution of flow field around the ship and inside the tank in the middle longitudinal section at a typical time instant is shown in Figs. 14 and 15, respectively. In this simulation, the particle distance for the simulation of the motion of the LNG ship in waves was set at 0.01 m. The total number of particles for the numerical wave tank and the LNG ship was 43,414,621. The physical time in model scale was 20 s, which cost 80.3 h for the calculation using a workstation with AMD3990 64-core CPU and RTX3090 24 GB GPU.

Figure 12: Discrete particle model of the LNG ship and tank with 20% filling rate
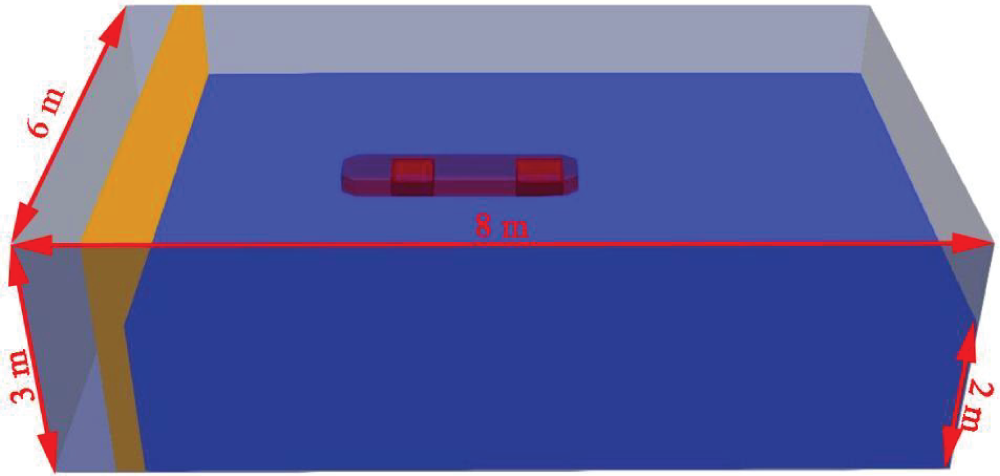
Figure 13: Discrete particle model of the numerical tank
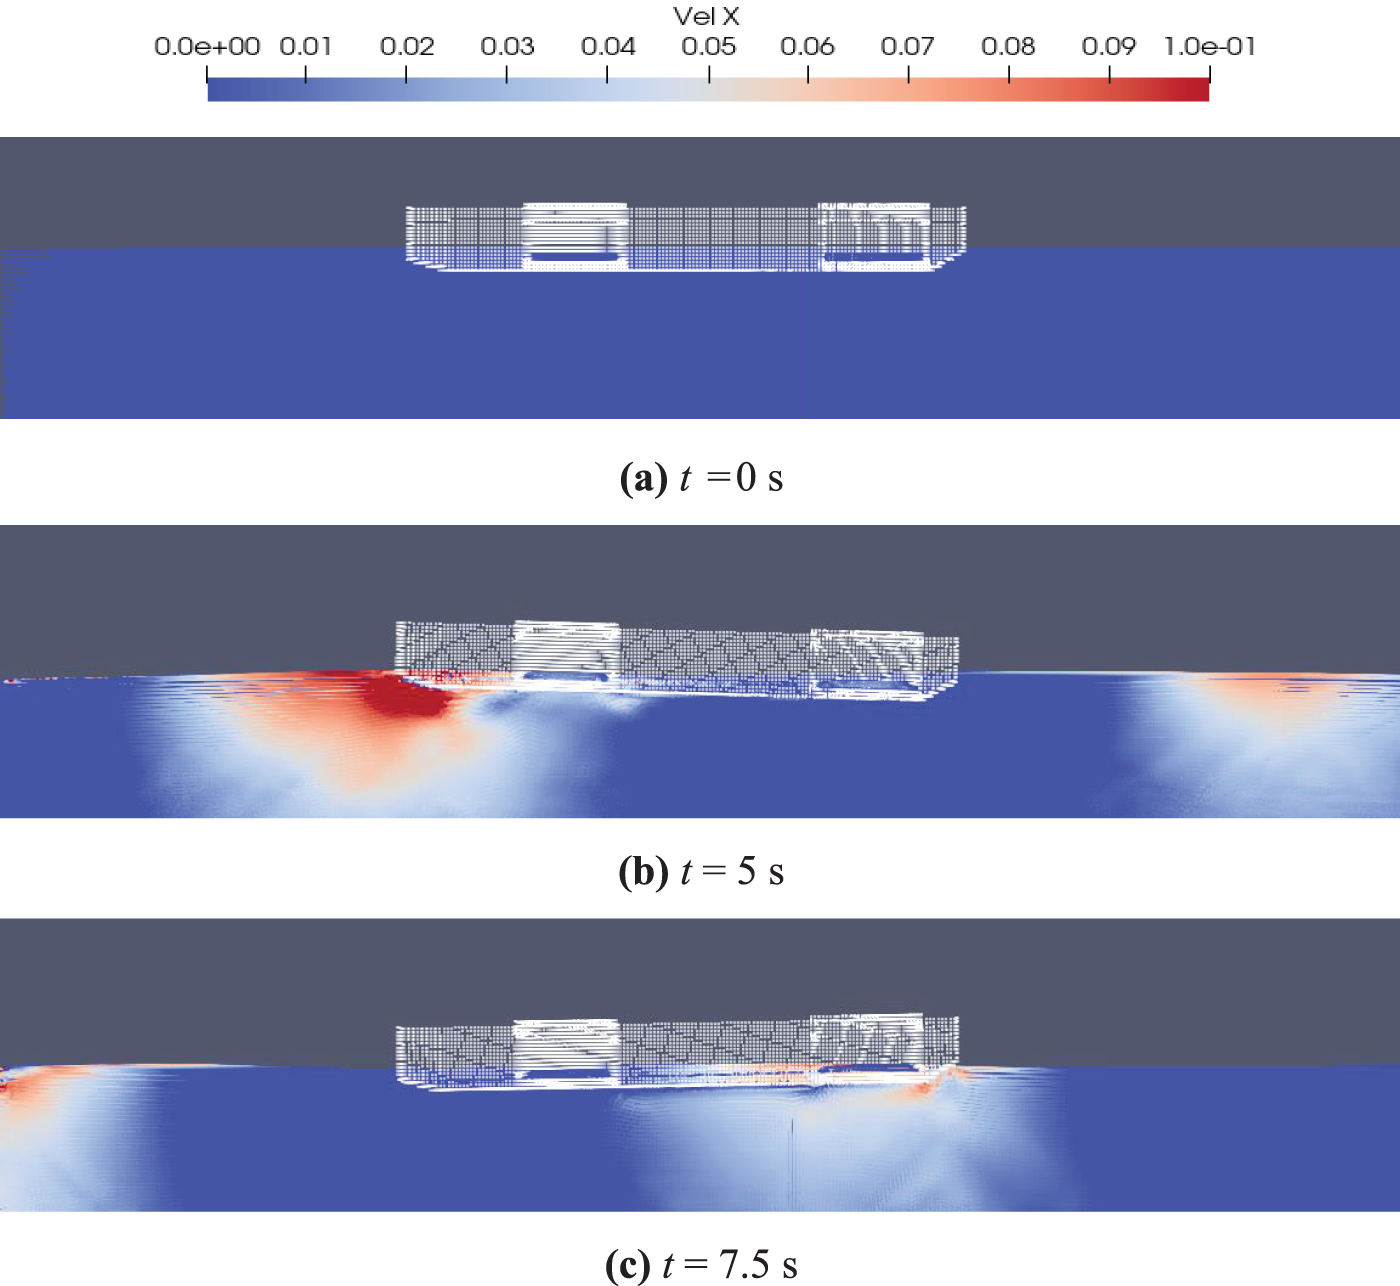
Figure 14: Ship motion in waves at typical time instants
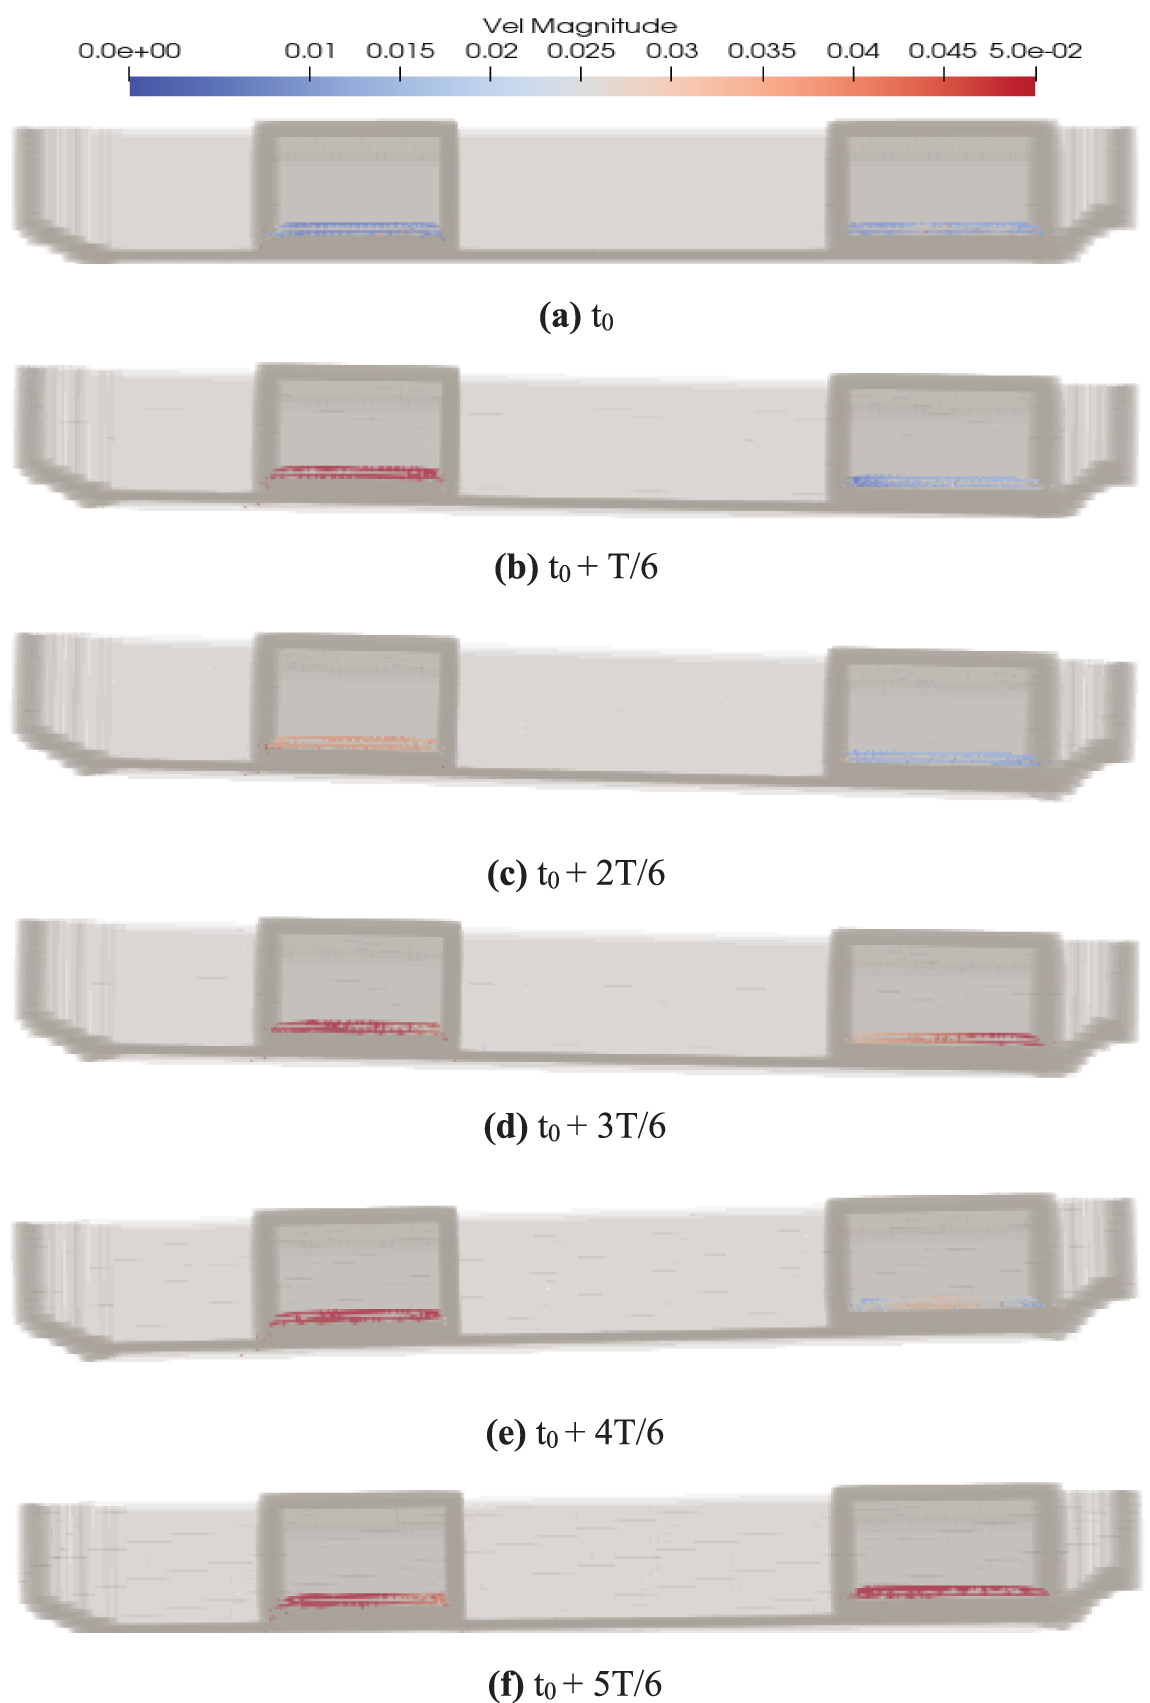
Figure 15: Liquid sloshing pattern in the tanks at typical time instants
Fig. 16 shows typical time history of the ship heave and pitch motions in head sea of Case 2. Fig. 17 shows the heave and pitch RAOs from the results of Case 1–6 (incident wave frequency ω(L/g)1/2 = 1.0, 2.0, 2.5, 3.0, 3.25, and 4.0) by the present SPH numerical simulation in comparison with the results of Jiang et al. [6]. The simulation results by the two methods were in good agreement.
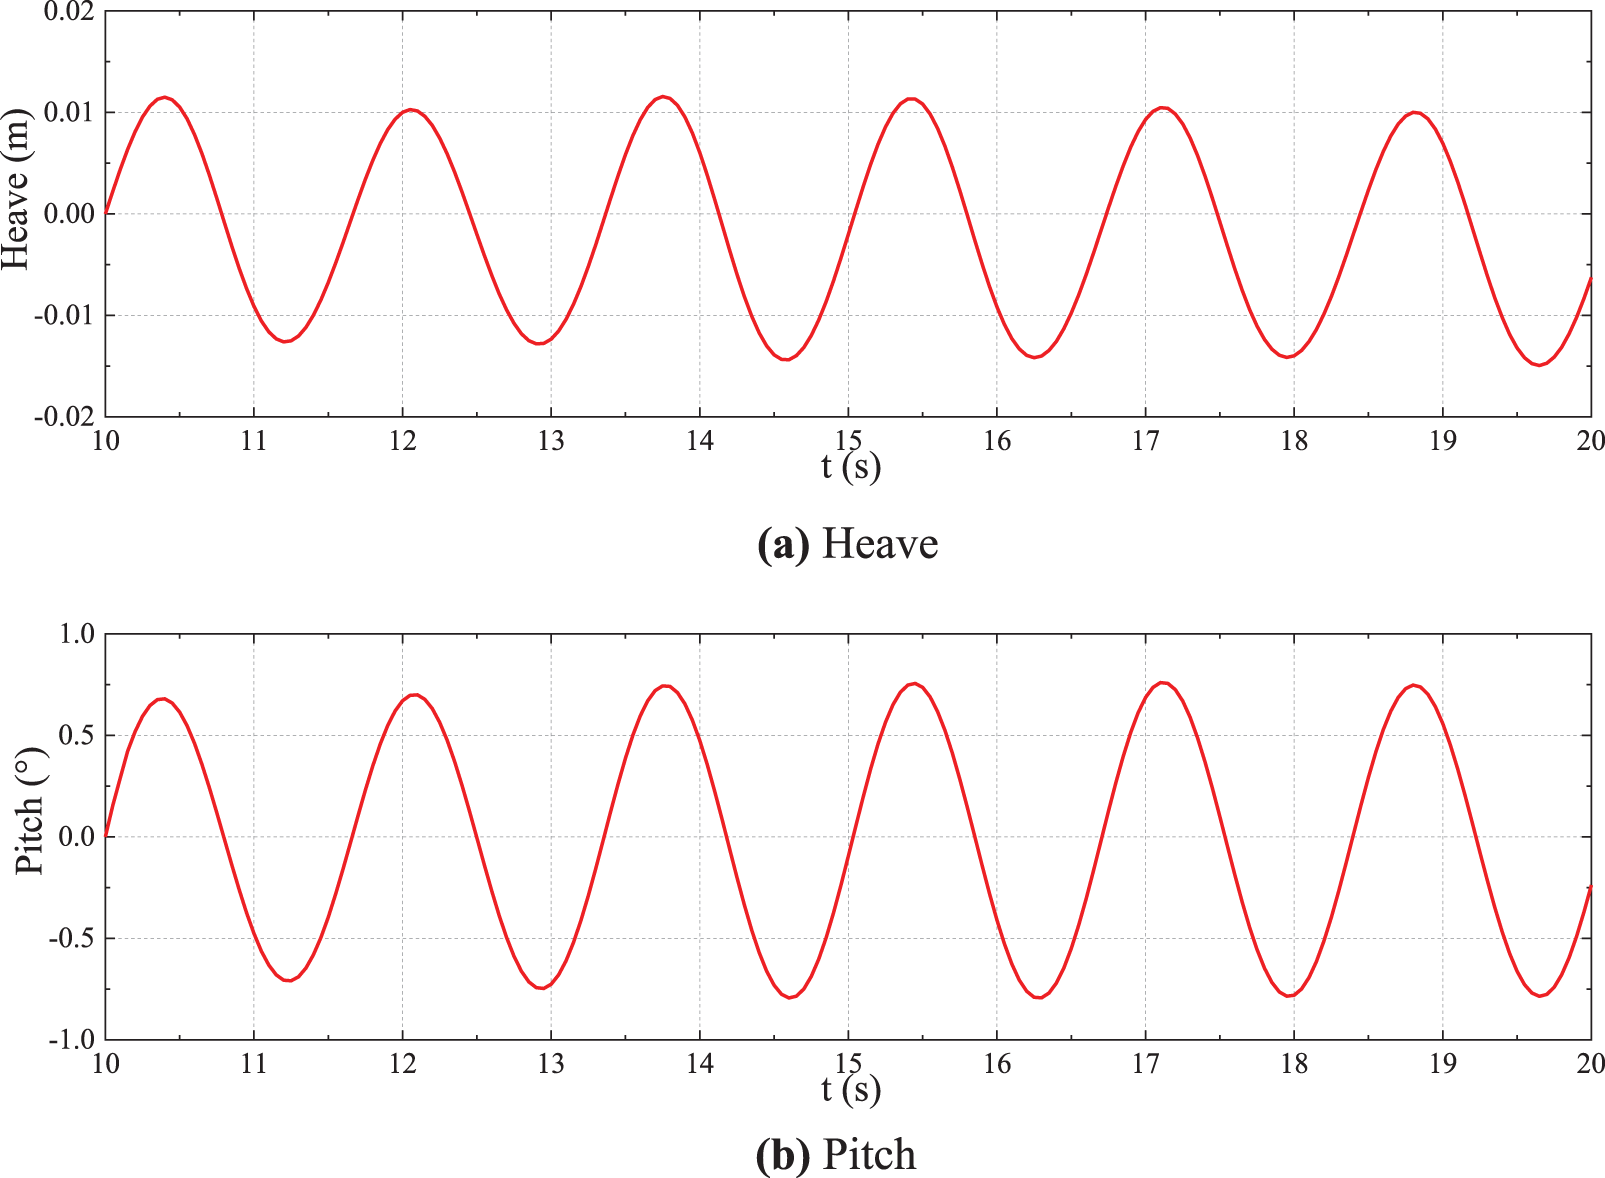
Figure 16: Time history of ship longitudinal motions in head sea (Case 2)
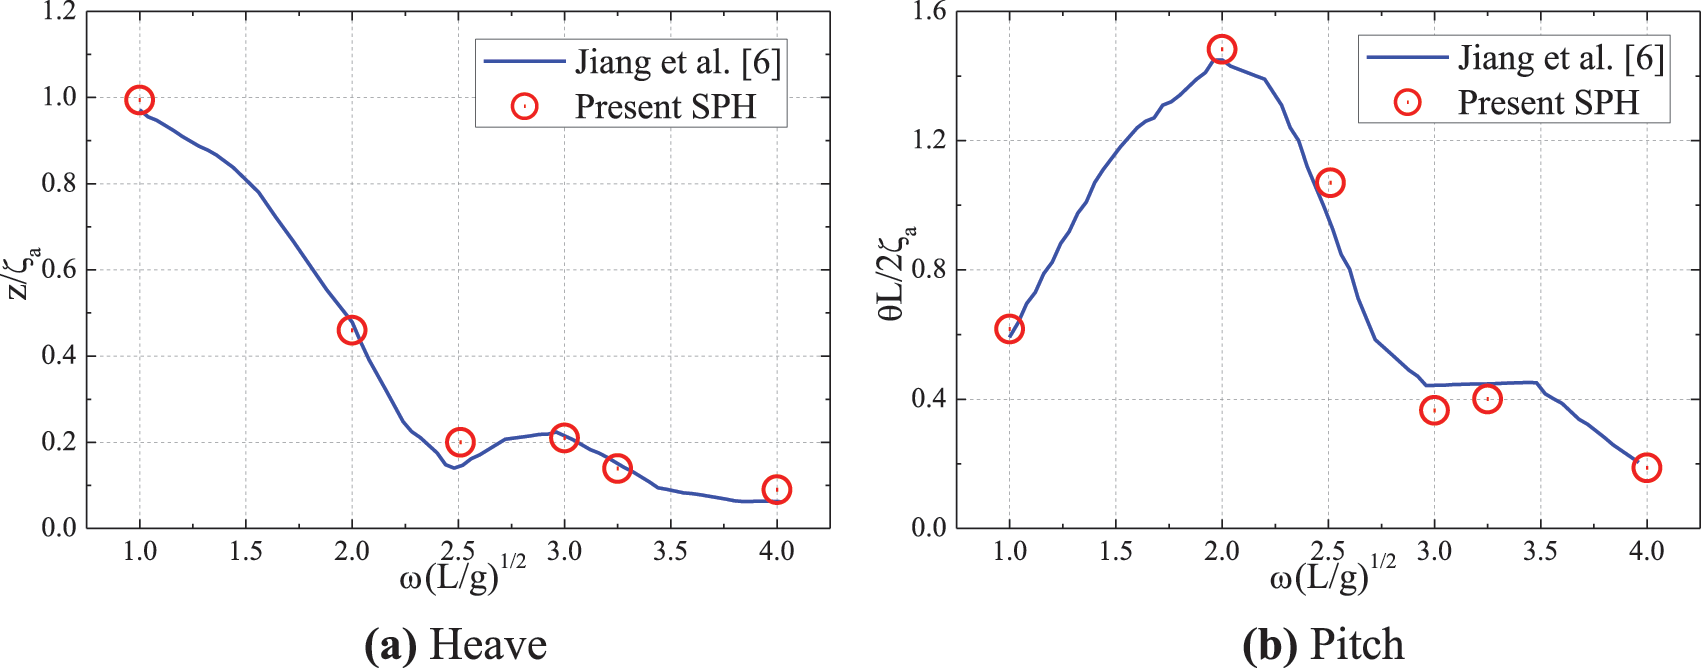
Figure 17: Comparison of the ship motion RAOs in head waves
5.3 Tank Sloshing Load Analysis
It is important to obtain the tank sloshing loads for structural strength assessment. Ship responses in beam waves (Case 7) was used to show the typical results of sloshing loads. The position of pressure monitor points are shown in Fig. 18. Fig. 19 shows a comparison of the time history of tank sloshing pressure at point Q1 of the fore tank’s middle-profile between the present SPH simulation and the result of Jiang et al. [6]. The pressure curve tendency and peak magnitude by the two methods showed good agreement.
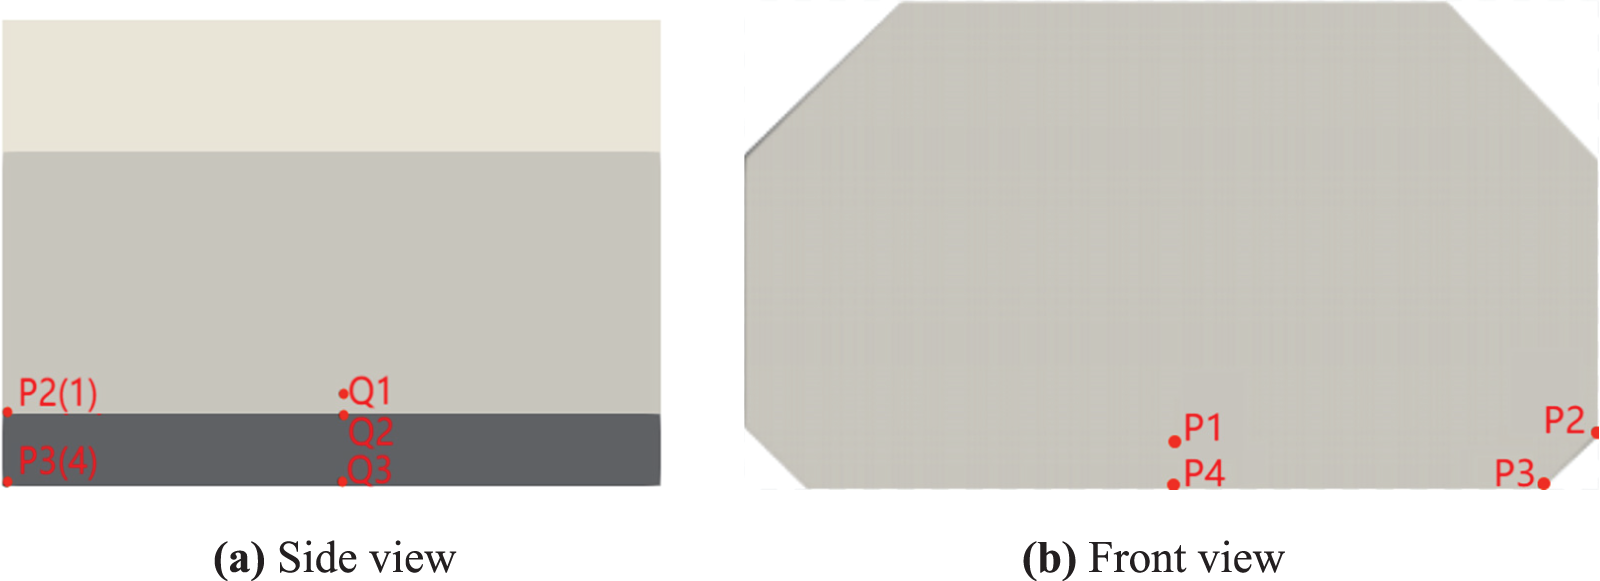
Figure 18: Position of pressure monitor points on the fore tank’s surface
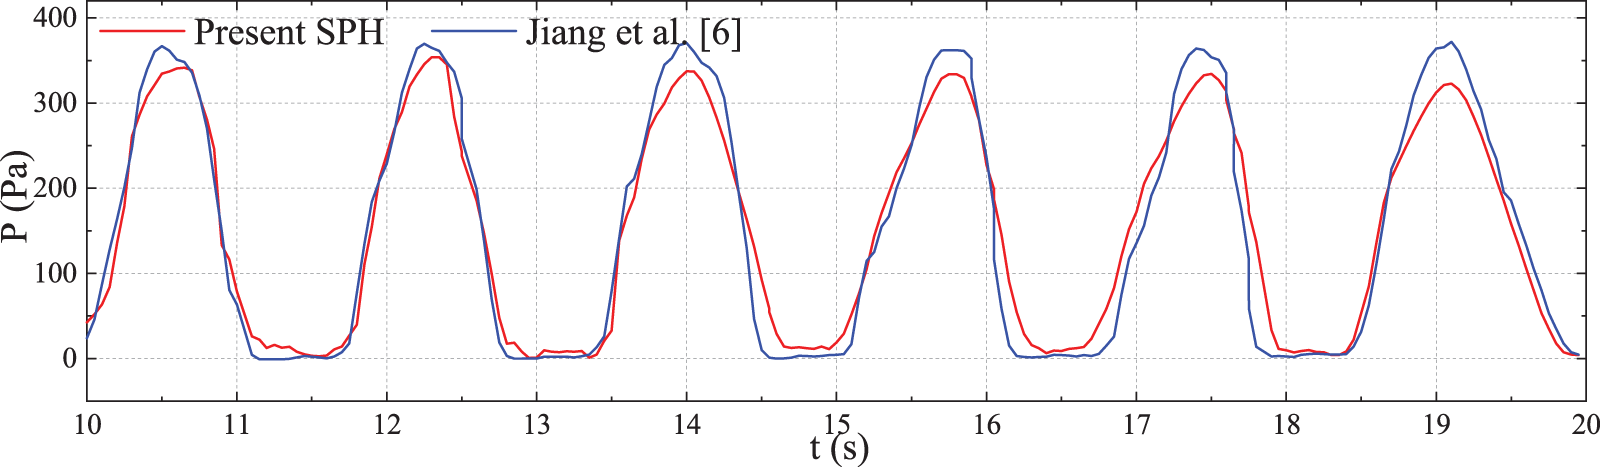
Figure 19: Comparison of the impact pressure at Q1 in beam waves (Case 7)
To analyze the pressure distribution on the front wall surface of the fore tank for ship in head waves, the results at four measurement points P1, P2, P3 and P4 were selected for illustration. The time history of the sloshing load pressure at these measurement points are compared in Fig. 20. Cases 8−10 for ship with liquid tank loading rate 20%, 57.5%, and 70% operates in head wave with wave frequency ω(L/g)1/2 = 3.25 and amplitude ζa = 50 mm were selected for illustration. The peak pressure at point P2 was higher than that at point P1, and the peak pressure at point P3 was higher than that at point P4. This indicated that the local impact load at the corner of prismatic tanks was higher. Therefore, attention needs to be paid to the local structural strength at the location of the corner.
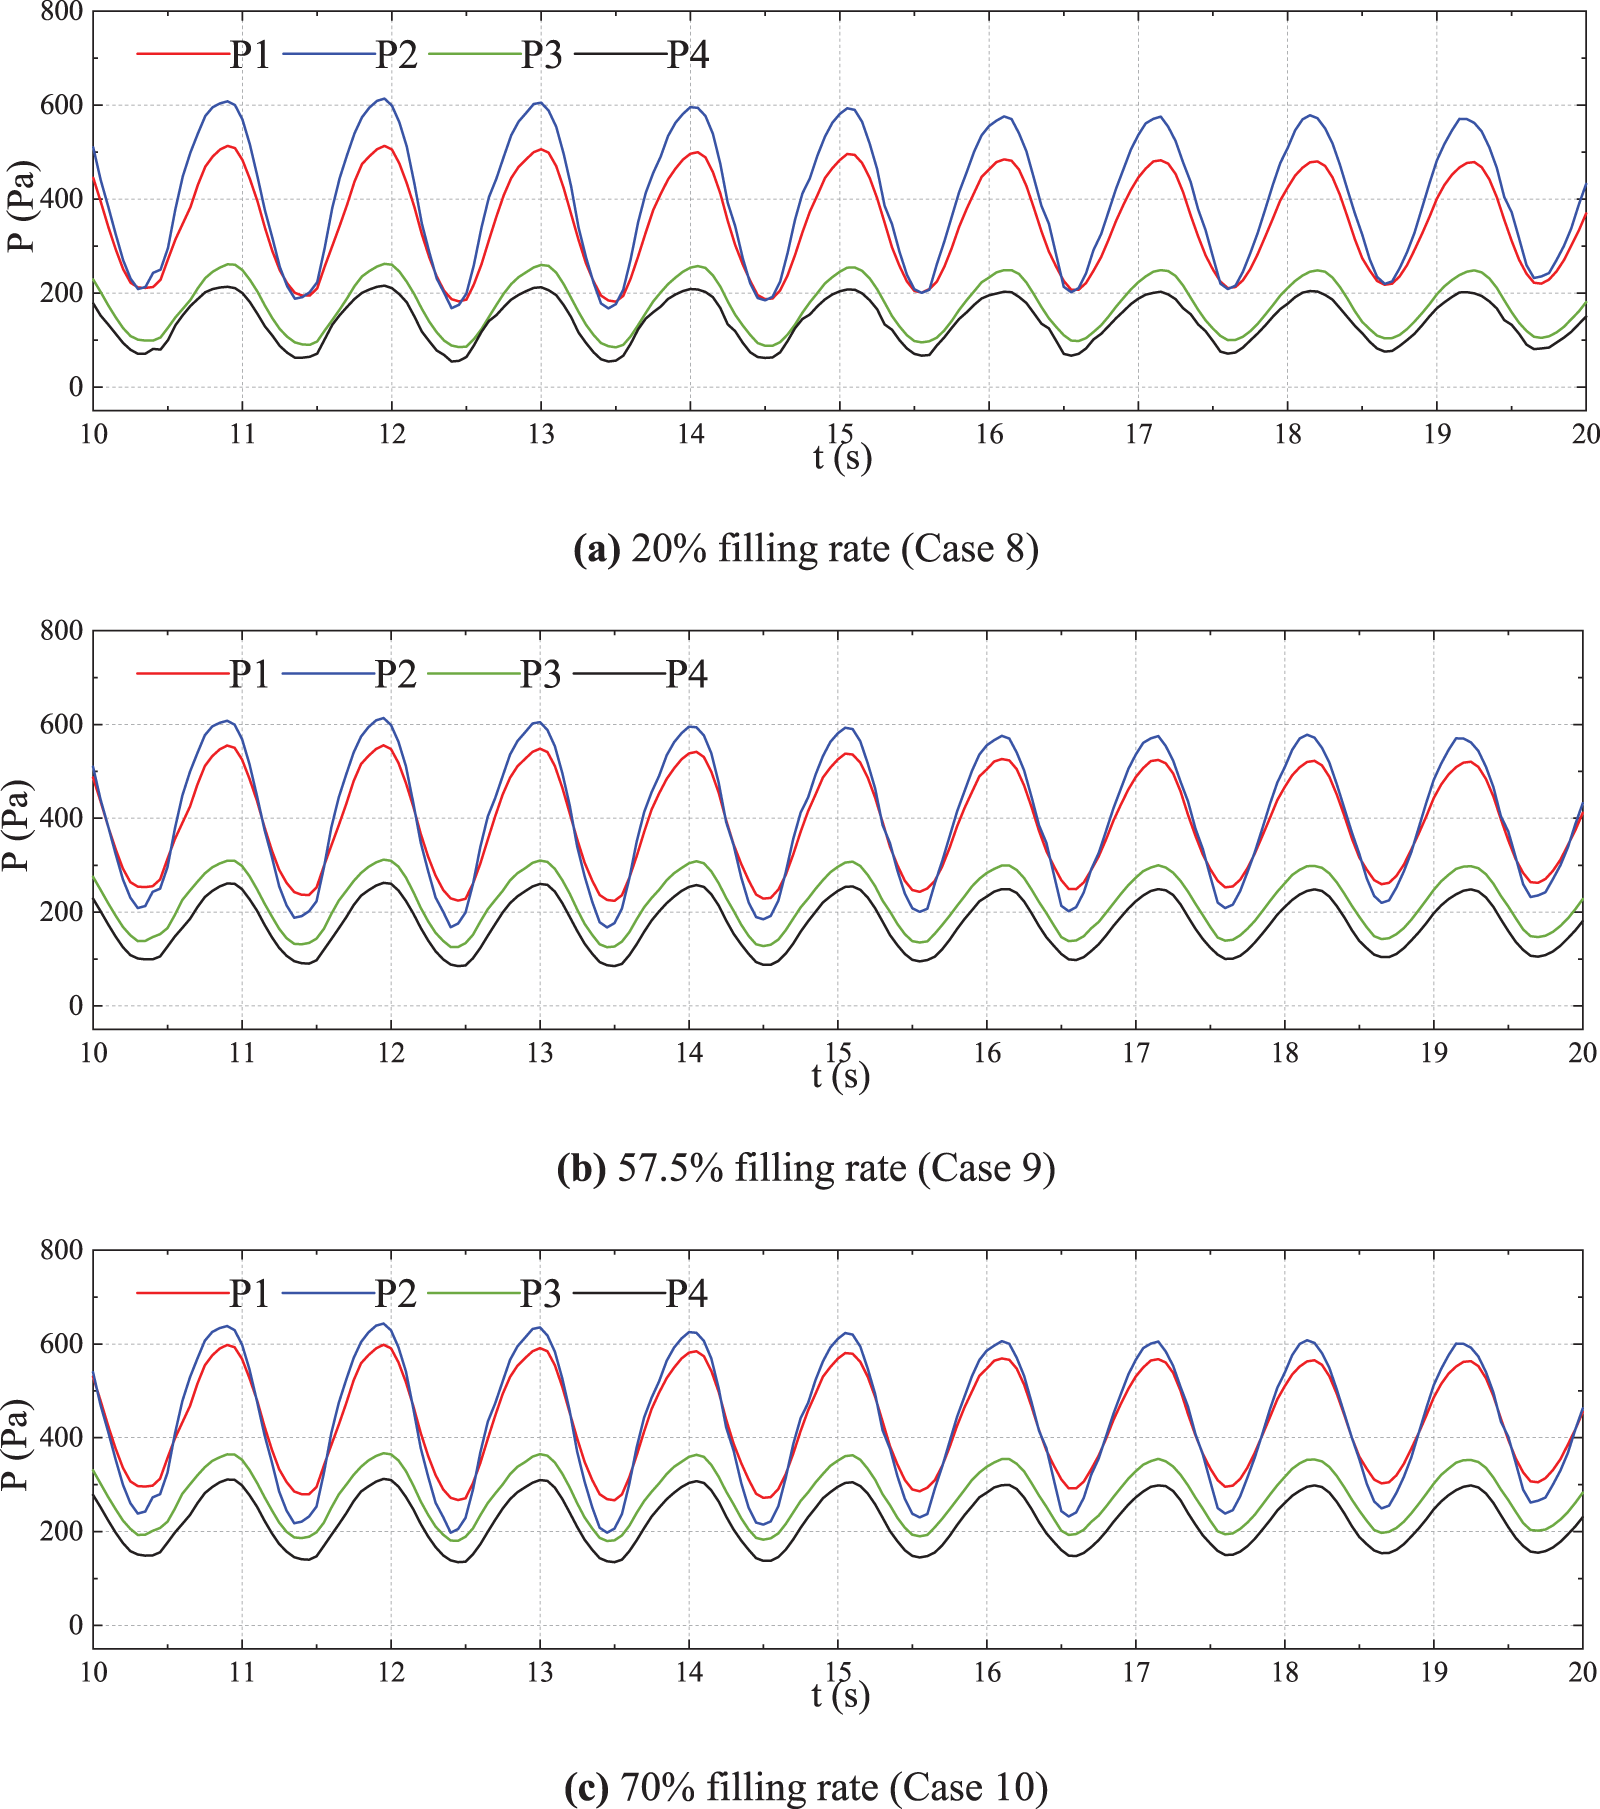
Figure 20: Time history of tank sloshing pressure at different positions with different filling rates of ship in head waves
6 Influence of Tank Loading Rate on Ship Responses
6.1 Comparison of Ship Motion at Different Loading Rates
The ship motions and tank sloshing coupled problem in head waves was simulated with four different loading rates of 0%, 20%, 57.5%, and 70% (Cases 11−14). A same incident wave with wave frequency ω(L/g) ½ = 2 and wave amplitude ζa = 50 mm was used to obtain ship response in head waves. Fig. 21 shows a comparison of the time history of ship heave and pitch motions with different loading rates. In Table 5, the double amplitude (peak-to-peak value) of the ship heave and pitch motion responses with different loading rates are listed and compared. The results showed that the draft/sinkage of the ship increased gradually with the increase of loading rate/weight. The amplitude value of the heave motion changed very little for the three loading rates of 0%, 20%, and 57.5%. The sloshing-induced coupling effect is relatively small for heave and pitch motion of the ship in head sea at low-filling conditions. However, when the loading rate was 70%, the heave amplitude decreased significantly by 38% due to the increase of loading weight. On the other hand, with the increase of loading rate, the ship was subject to trim by stern motion gradually. The amplitude value of pitch motion changed very little for the three loading rates of 0%, 20%, and 57.5%. However, the pitch amplitude increased significantly by 34% when the loading rate was 70%.
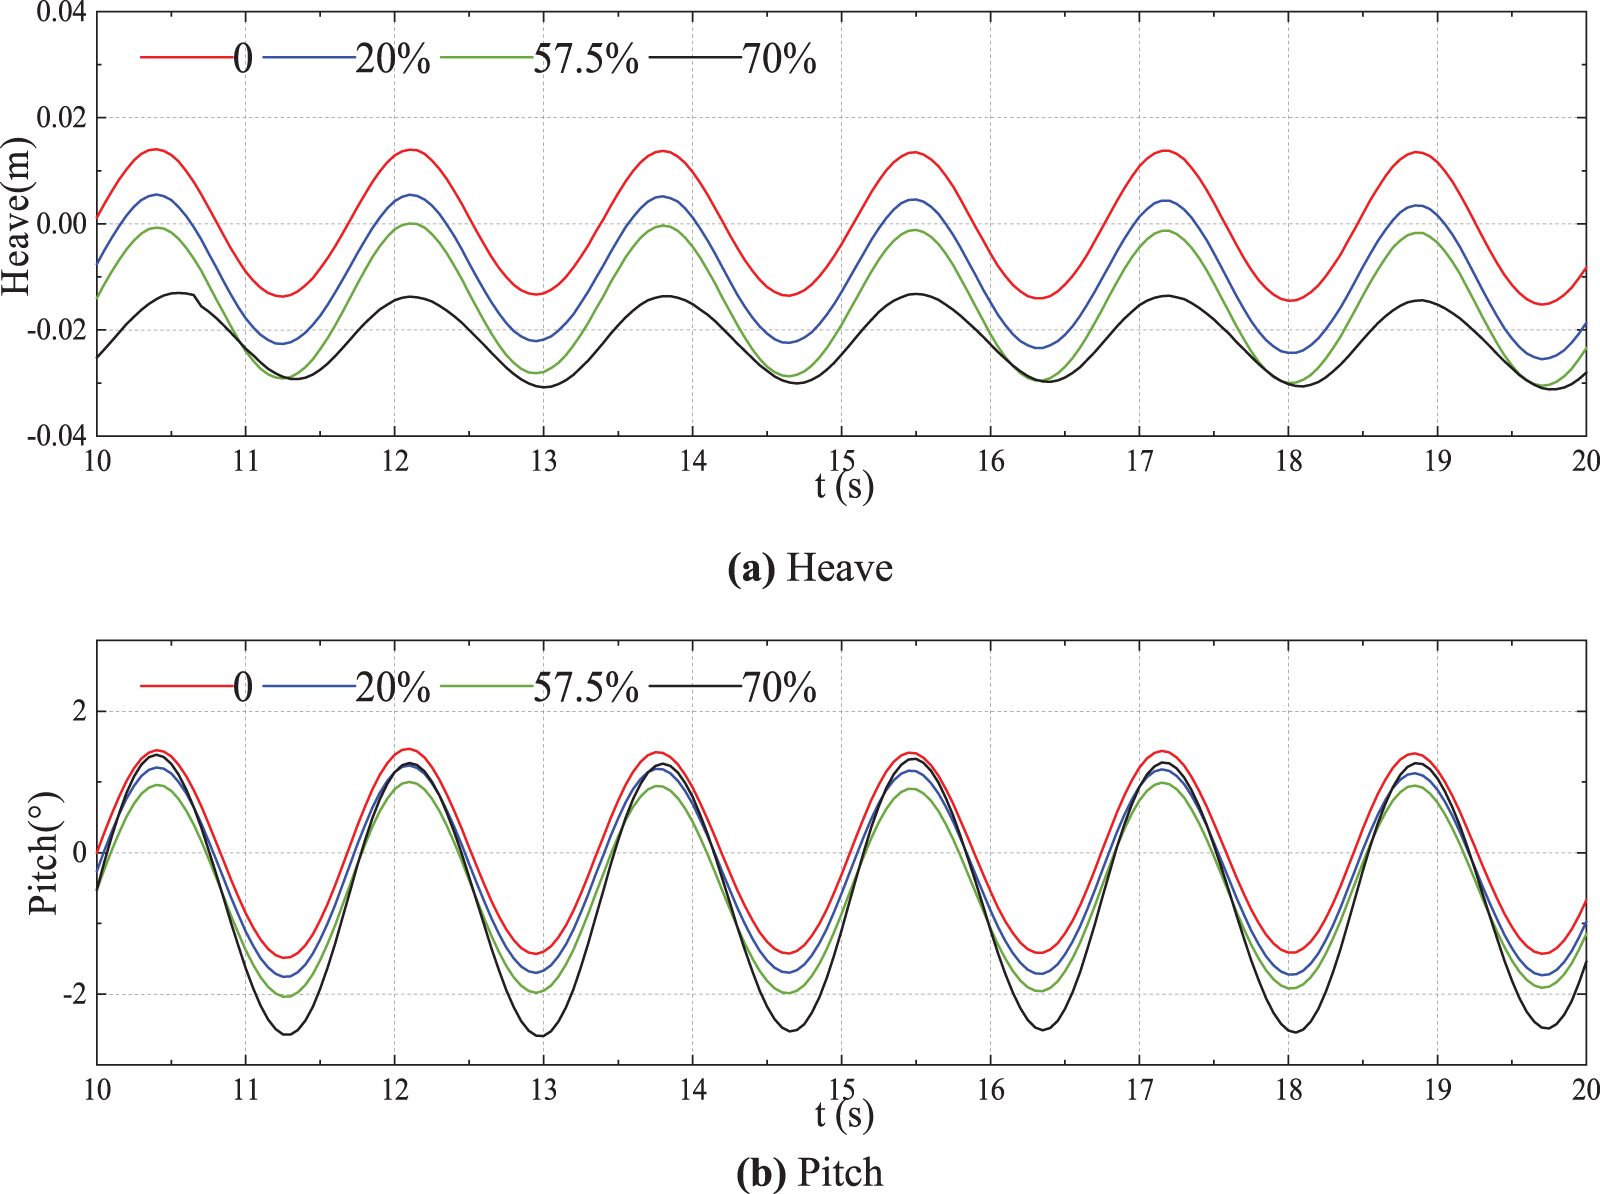
Figure 21: Comparison of ship longitudinal motion with different loading rates in head waves (Cases 11–14)
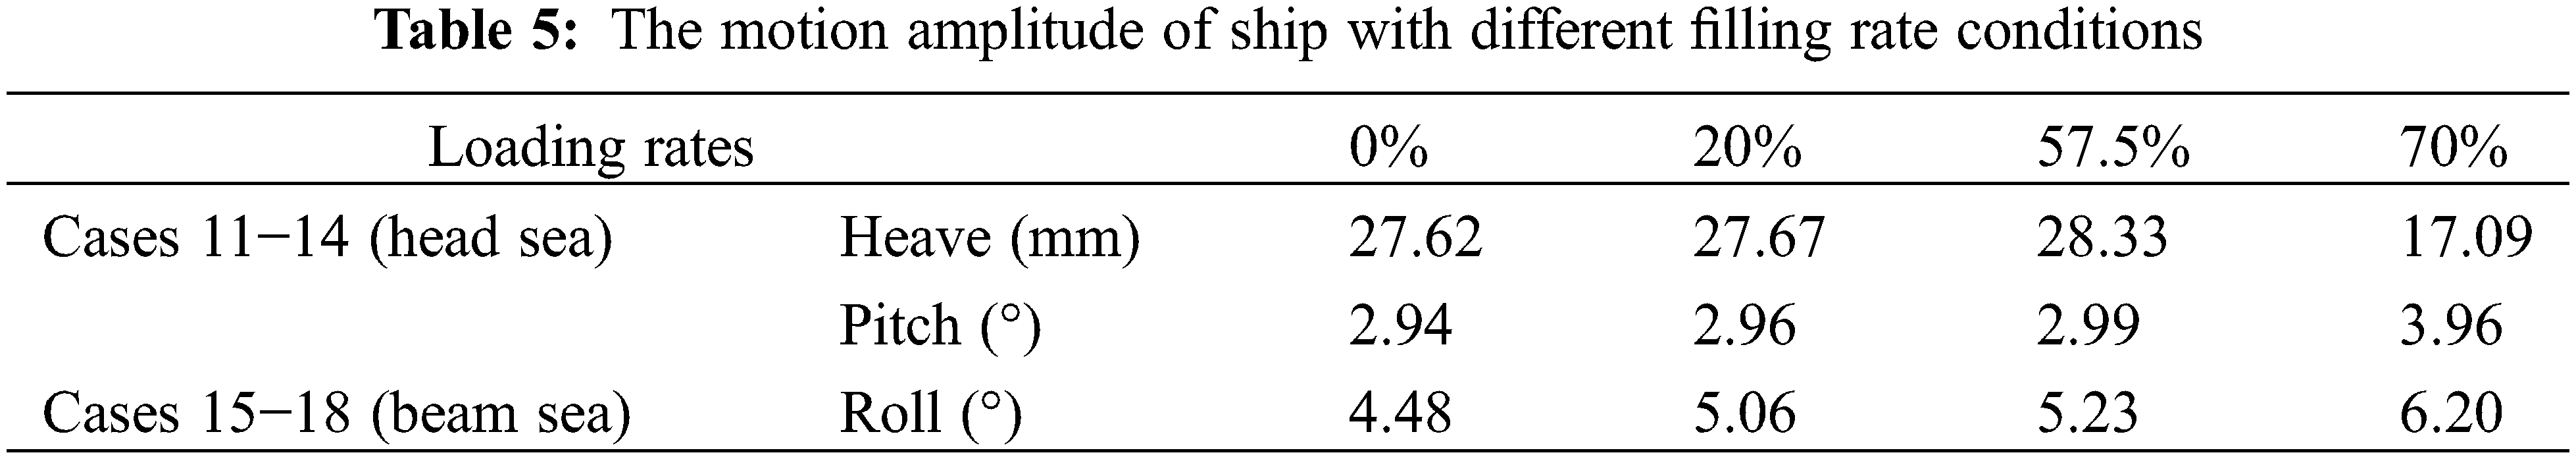
The ship responses in beam waves with four different loading rates 0%, 20%, 57.5%, and 70% (Cases 15−18) were investigated and compared. A same incident wave with wave frequency ω(L/g)1/2 = 2 and wave amplitude ζa = 50 mm was used to obtain ship response in beam waves. Fig. 22 shows a comparison of the time history of the ship roll motion with different loading rates. Comparison of the double amplitude value of the ship roll motion for each case is listed in Table 5. The results showed that the roll amplitudes increased gradually with the increase of the loading rate, and the rate of increase was increased with the increase of loading rate.
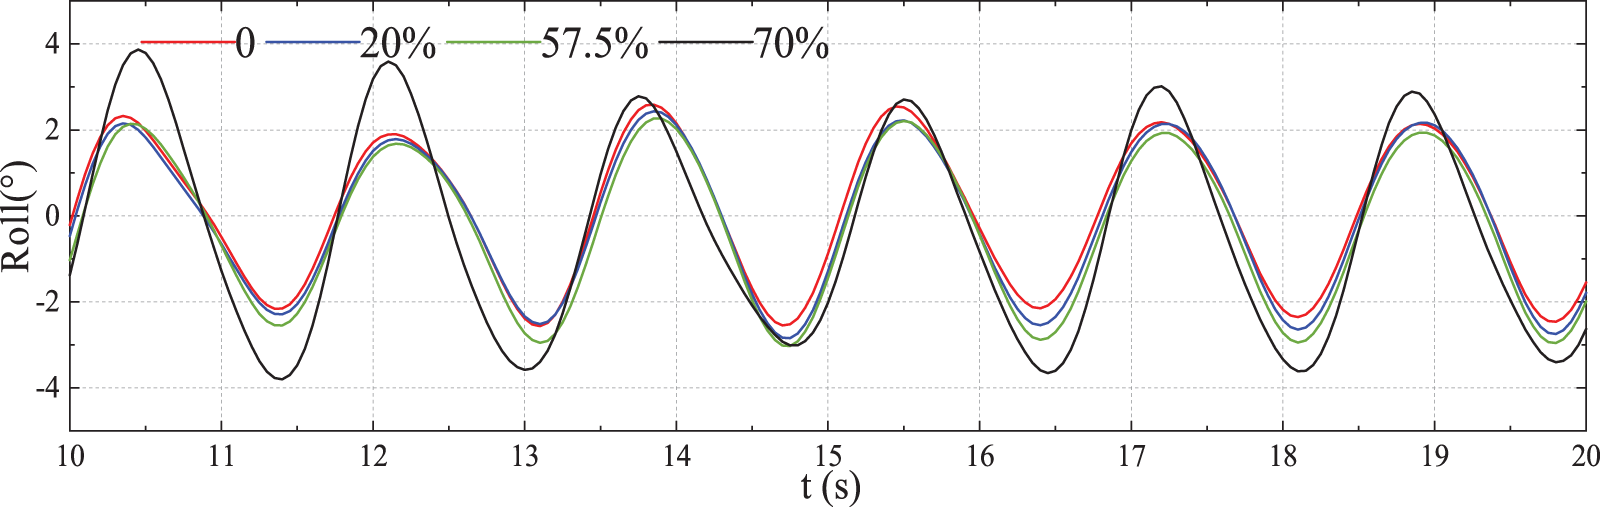
Figure 22: Comparison of ship roll motion time history for different loading rates in beam waves (Cases 15–18)
6.2 Comparison of Tank Sloshing Loads at Different Loading Rates
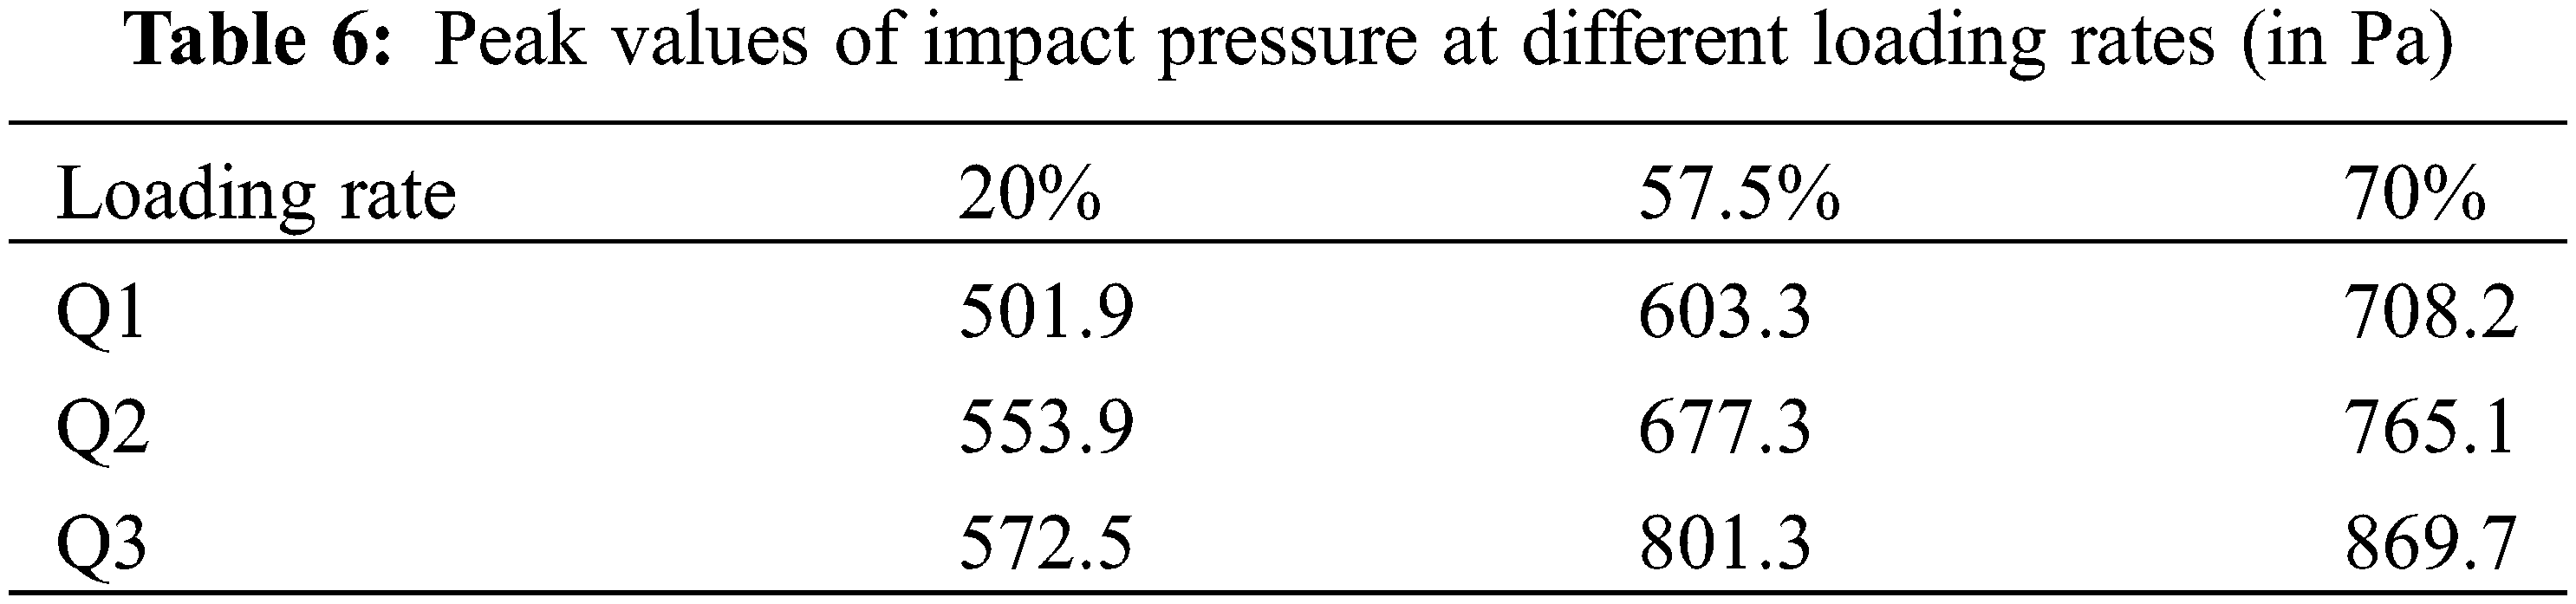
The impact pressure on the side wall Q1-Q3 with three different loading rates of 20%, 57.5%, and 70% (Cases 16−18) for ship in beam wave condition was compared and analyzed. The incident wave frequency ω(L/g)1/2 = 2 and ζa = 50 mm was used. The positions of the three selected reference points Q1–Q3 are shown in Fig. 18a, where point Q1 was located at 14.3 mm above point Q2. Fig. 23 shows the time history of local impact pressure at points Q1, Q2, and Q3 for the three loading rates. Table 6 summarizes the maximum values of impact pressure for these cases. The results showed that the local pressure peak increased with the increase of loading rate, and the phenomenon was especially evident at point Q3.
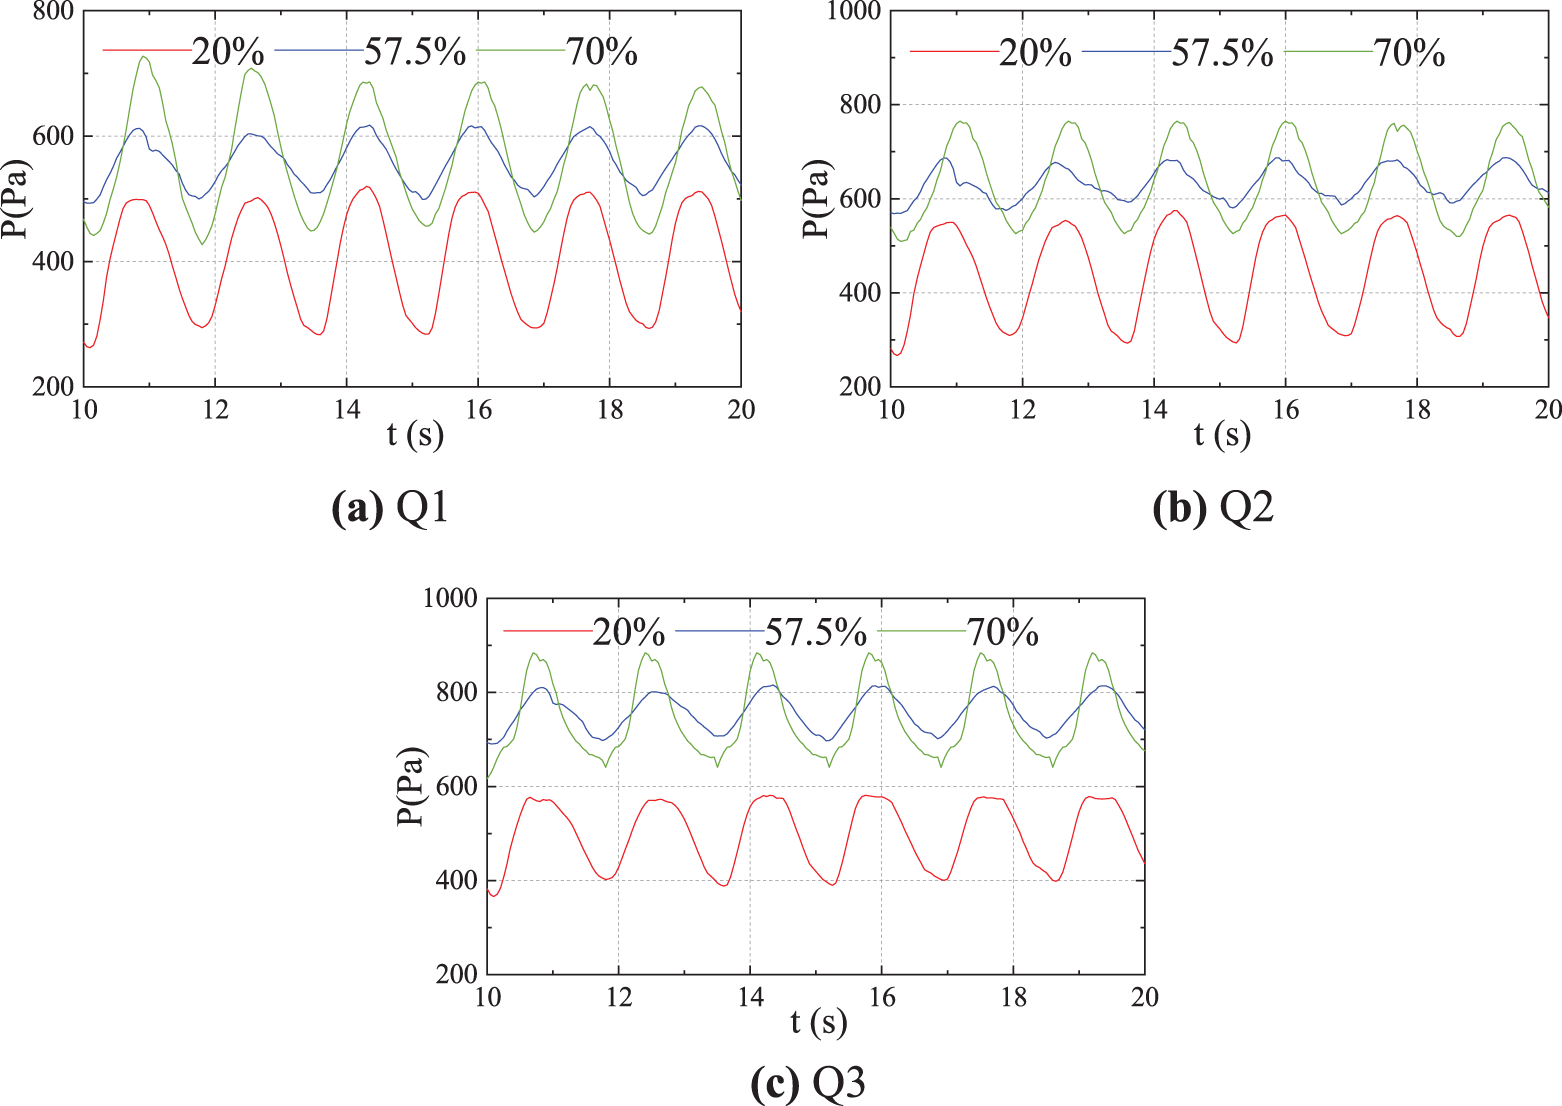
Figure 23: Impact pressure for different loading rates of ship in beam waves (Cases 16−18)
In this paper, the simulation study of the independent tank sloshing problem and the coupled responses of LNG ship motion with tank sloshing in regular waves was carried out using the SPH-based DualSPHysics open source code package. The following conclusions are drawn from this study:
1. The established SPH simulation method for the coupled response of ship motion and tank sloshing has many advantages compared with the current numerical methods such as potential flow theory and CFD RANS methods. It simulates strong nonlinear phenomena such as fluid splashing in the tank and free surface break, which has a broad application and development prospect in the hydrodynamic prediction of liquid cargo ships.
2. The local impact pressure at the corner position on the front wall of the prismatic tank is greater in head waves, so attention needs to be paid the local structural strength at the relevant positions. For beam wave cases, the local pressure peak increases with the increase of loading rate.
3. The draft of the ship gradually increases with the increase of the loading weight. The amplitude of the heave and pitch motion of the ship in head waves changed very little for the three loading rates of 0%, 20%, and 57.5%, but the heave decreased significantly by 38% and the pitch increased significantly by 34% when the loading rate was 70%.
Acknowledgement: None.
Funding Statement: This research is supported by the National Natural Science Foundation of China (No. 52271316) and the Guangdong Basic and Applied Basic Research Foundation (No. 2023A1515030262).
Author Contributions: The authors confirm contribution to the paper as follows: study conception and design–Jialong Jiao; data collection–Mingming Zhao; analysis and interpretation of results–Mingming Zhao; draft manuscript preparation–Mingming Zhao, Jialong Jiao. All authors reviewed the results and approved the final version of the manuscript.
Availability of Data and Materials: The data in the study can be accessed upon request to the corresponding author.
Conflicts of Interest: Thse authors declare that they have no conflicts of interest to report regarding the present study.
References
1. Francescutto, A., Contento, G. (1994). An experimental study of the coupling between roll motion and sloshing in a compartment. Proceedings of the 4th International Offshore and Polar Engineering Conference, vol. III, pp. 283–291. Osaka, Japan. [Google Scholar]
2. Rognebakke, O. F., Faltinsen, O. M. (2003). Coupling of sloshing and ship motions. Journal of Ship Research, 47(3), 208–221. https://doi.org/10.5957/jsr.2003.47.3.208 [Google Scholar] [CrossRef]
3. Xu, G. H., Qi, E. R., Xu, C., Gu, X. K. (2011). Experimental investigation of sloshing loads and structural dynamic response in tanks of LNG carriers. Journal of Ship Mechanics, 15(12), 1374–1383. [Google Scholar]
4. Xin, J. J., Chen, Z. L., Shi, F., Shi, F. L., Jin, Q. (2020). Numerical simulation of nonlinear sloshing in a prismatic tank by a Cartesian drid based three-dimensional multiphase flow model. Ocean Engineering, 213, 107629. https://doi.org/10.1016/j.oceaneng.2020.107629 [Google Scholar] [CrossRef]
5. Carrica, P. M., Wilson, R. V., Noack, R. W., Stern, F. (2007). Ship motions using single-phase level set with dynamic overset grids. Computers and Fluids, 36(9), 1415–1433. https://doi.org/10.1016/j.compfluid.2007.01.007 [Google Scholar] [CrossRef]
6. Jiang, S. C., Teng, B., Bai, W., Gou, Y. (2015). Numerical simulation of coupling effect between ship motion and liquid sloshing under wave action. Ocean Engineering, 108, 140–154. https://doi.org/10.1016/j.oceaneng.2015.07.044 [Google Scholar] [CrossRef]
7. Jiang, S. C., Xu, B., Wang, Z. H. (2022). Numerical simulation analysis of liquid sloshing in tank under random excitation. Chinese Journal of Ship Research, 17(2), 81–90 (In Chinese). [Google Scholar]
8. Sun, L., Luo, X. C., Liu, C. F., Jiang, S. C. (2019). Simulation of ship motions coupled with tank sloshing in frequency domain. Chinese Journal of Ship Research, 14(1), 9–18 (In Chinese). [Google Scholar]
9. Xu, J. X., Wang, J., Mao, S. L. (2015). SPH and ALE formulations for sloshing tank analysis. International Journal of Multi-Physics, 9(3), 209–223. [Google Scholar]
10. Green, M. D., Zhou, Y. P., Dominguez, J. M., Gesteira, M. G., Peiro, J. (2021). Smooth particle hydrodynamics simulations of long-duration violent three-dimensional sloshing in tanks. Ocean Engineering, 229, 108925. https://doi.org/10.1016/j.oceaneng.2021.108925 [Google Scholar] [CrossRef]
11. Trimulyono, A., Hashimoto, H., Matsudda, A. (2019). Experimental validation of single-and two-phase smoothed particle hydrodynamics on sloshing in a prismatic tank. Journal of Marine Science and Engineering, 7, 247. https://doi.org/10.3390/jmse7080247 [Google Scholar] [CrossRef]
12. Nam, B. W., Kim, Y., Kim, D. W., Kim, Y. S. (2009). Experimental and numerical studies on ship motion responses coupled with sloshing in waves. Journal of Ship Research, 53(2), 68–82. https://doi.org/10.5957/jsr.2009.53.2.68 [Google Scholar] [CrossRef]
13. Kim, Y., Nam, B. W., Kim, D. W., Kim, Y. S. (2007). Study on coupling effects of ship motion and sloshing. Ocean Engineering, 34, 2176–2187. https://doi.org/10.1016/j.oceaneng.2007.03.008 [Google Scholar] [CrossRef]
14. Lee, S. J., Kim, M. H., Kim, J. W., Shin, Y., Kim, Y. (2007). The effect of LNG-tank sloshing loads on the motions of LNG carriers. Ocean Engineering, 34, 10–20. https://doi.org/10.1016/j.oceaneng.2006.02.007 [Google Scholar] [CrossRef]
15. Bai, Z. G., Zhao, J., Zhang, W., Wang, W. L. (2013). 3D SPH numerical investigation for the sloshing impact in LNG tank. Proceedings of the ASME 32nd International Conference on Ocean, Offshore and Arctic Engineering, vol. 7. Nantes, France. [Google Scholar]
16. Dominguez, J. M., Crespo, A. J. C., Gomez-Gesteira, M. (2013). Optimization strategies for CPU and GPU implementations of a smoothed particle hydrodynamics method. Computer Physics Communications, 184(3), 617–627. https://doi.org/10.1016/j.cpc.2012.10.015 [Google Scholar] [CrossRef]
17. Wendland, H. (1995). Piecewise polynomial, positive definite and compactly supported radial functions of minimal degree. Advances in Computational Mathematics, 4(4), 389–396. [Google Scholar]
18. Monaghan, J. J., Kos, A., Issa, N. (2003). Fluid motion generated by impact. Journal of Waterway, Port, Coastal, and Ocean Engineering, 129(6), 250–259. https://doi.org/10.1061/(ASCE)0733-950X(2003)129:6(250) [Google Scholar] [CrossRef]
19. Inglis, R. B. (1981). The Influence of speed dependent boundary condition in three-dimensional ship motion problems. International Shipbuilding Progress, 28(318), 22–29. https://doi.org/10.3233/ISP-1981-2831801 [Google Scholar] [CrossRef]
20. Liu, D. M., Lin, P. Z. (2009). Three-dimensional liquid sloshing in a tank with baffles. Ocean Engineering, 36, 202–212. https://doi.org/10.1016/j.oceaneng.2008.10.004 [Google Scholar] [CrossRef]
Cite This Article
 Copyright © 2024 The Author(s). Published by Tech Science Press.
This work is licensed under a Creative Commons Attribution 4.0 International License , which permits unrestricted use, distribution, and reproduction in any medium, provided the original work is properly cited.
 Downloads
 Citation Tools