
 Submit a Paper
 Propose a Special lssue
 Open Access
ARTICLE
A Numerical Study on the Effect of the Backflow Hole Position on the Performances of a Self-Priming Pump
1 School of Energy and Power Engineering, Lanzhou University of Technology, Lanzhou, 730050, China
2 Sanlian Pump Industry Co., Ltd., Ma’anshan, 243000, China
* Corresponding Author: Dongwei Wang. Email:
Fluid Dynamics & Materials Processing 2024, 20(5), 1103-1122. https://doi.org/10.32604/fdmp.2023.042654
Received 07 June 2023; Accepted 13 October 2023; Issue published 07 June 2024
 View Full Text
 Download PDF
Abstract
A self-priming pump is a centrifugal pump that has the ability to prime itself. Typically, its performance depends on the configuration of its reflux hole. In this study, the ANSYS FLUENT software is used to investigate the effects of three different radial positions of the reflux hole on gas-liquid two-phase distribution, pressure pulsation, and imp during self-priming. The research results indicate that: (1) The effective channel size for the reflux liquid to enter the volute varies depending on the location of the reflux hole. The effect of the impeller rotation on the reflux liquid becomes more obvious as the setting distance of the reflux aperture decreases. (2) The position of the reflux hole significantly affects the gas phase mass fraction inside the impeller, resulting in a significant reduction in the time it takes for the mass fraction to exceed 80%. (3) The position of the reflux hole significantly affects the average pressure on each monitoring surface. (4) Placing the reflux hole at a excessively distant radial distance can result in an excessive vertical component. (5) The self-priming performance of the pump can be improved to some extent by placing the return hole at a small radial distance.Keywords
Self-priming centrifugal pumps exhibit the characteristics of convenient usage, simple operation, and reliable performance, making them wildly applied in various fields such as energy, agriculture, mining, and chemical engineering [1,2]. According to the principle of self-priming, self-priming pumps can be classified into two types: externally mixed and internally mixed. Due to their simple structure, externally mixed self-priming pumps have been more widely used. After initiating the operation of the self-priming pump, it functions in vacuum pump mode to evacuate air from the suction pipe before transitioning into its regular water pumping state. It is evident that the self-priming performance is a pivotal indicator for assessing the efficacy of such pumps. Therefore, conducting research on the self-priming process of these pumps holds immense significance in enhancing their overall performance.
The self-priming process of a self-priming pump entails an intricately intricate and dynamically non-stationary gas-liquid two-phase flow process. Numerous academics have conducted in-depth research on the gas-liquid two-phase flow during the self-priming process [3,4]. The key determinant of self-priming performance lies in the timely reflux of the liquid and its enhanced participation in the gas-liquid phase mixing effect. During the self-priming operation of external mixing pumps, the reflux liquid primarily returns through the reflux hole and contributes to the exhaust process [5]. The reflux hole is a crucial structural element that plays a pivotal role in determining the self-priming performance of a self-priming pump [6]. Mou et al. [7] numerically simulated the self-priming pump process under four different return areas and found that the flow in the pump cavity became complex due to the existence of vortices. Zhou et al. [8] studied the effect of reflux hole area on the pressure pulsation characteristics and performance of self-priming pumps during normal operation. They pointed out that the vorticity near the outlet of the reflux hole is significant, and the asymmetric flow structure in the cross-section moves periodically with time. Qian et al. [9] conducted a study on the influence of reflux holes at different circumferential positions on the self-priming process through experimental methods and found that reflux holes have a very significant impact on the duration of self-priming in the middle stage. Lu et al. [10] found that the area of the reflux hole affects the self-priming time of a multi-stage self-priming centrifugal pump the most, followed by the outlet width of the impeller blade, the radial clearance, and the number of stages. Cheng et al. [11] found that the circumferential position and area of the reflux hole have a certain degree of impact on the efficiency and head of the vertical self-priming pump, but no research has been conducted on their impact on self-priming performance.
The above-mentioned research suggests that the reflux holes plays a critical role in influencing both the self-priming performance and energy efficiency of a self-priming pump. Hence, conducting further investigations into the impact of the reflux holes on the self-priming process of such pumps is essential. However, there have been no reports on the research regarding the radial position of reflux holes. This article conducts research on the influence of the radial position of the reflux holes on the self-priming performance through numerical calculations, aiming to provide references for optimizing the self-priming performance of self-priming pumps.
2 Computational Model and Numerical Method
2.1 Basic Parameters of Model Pump
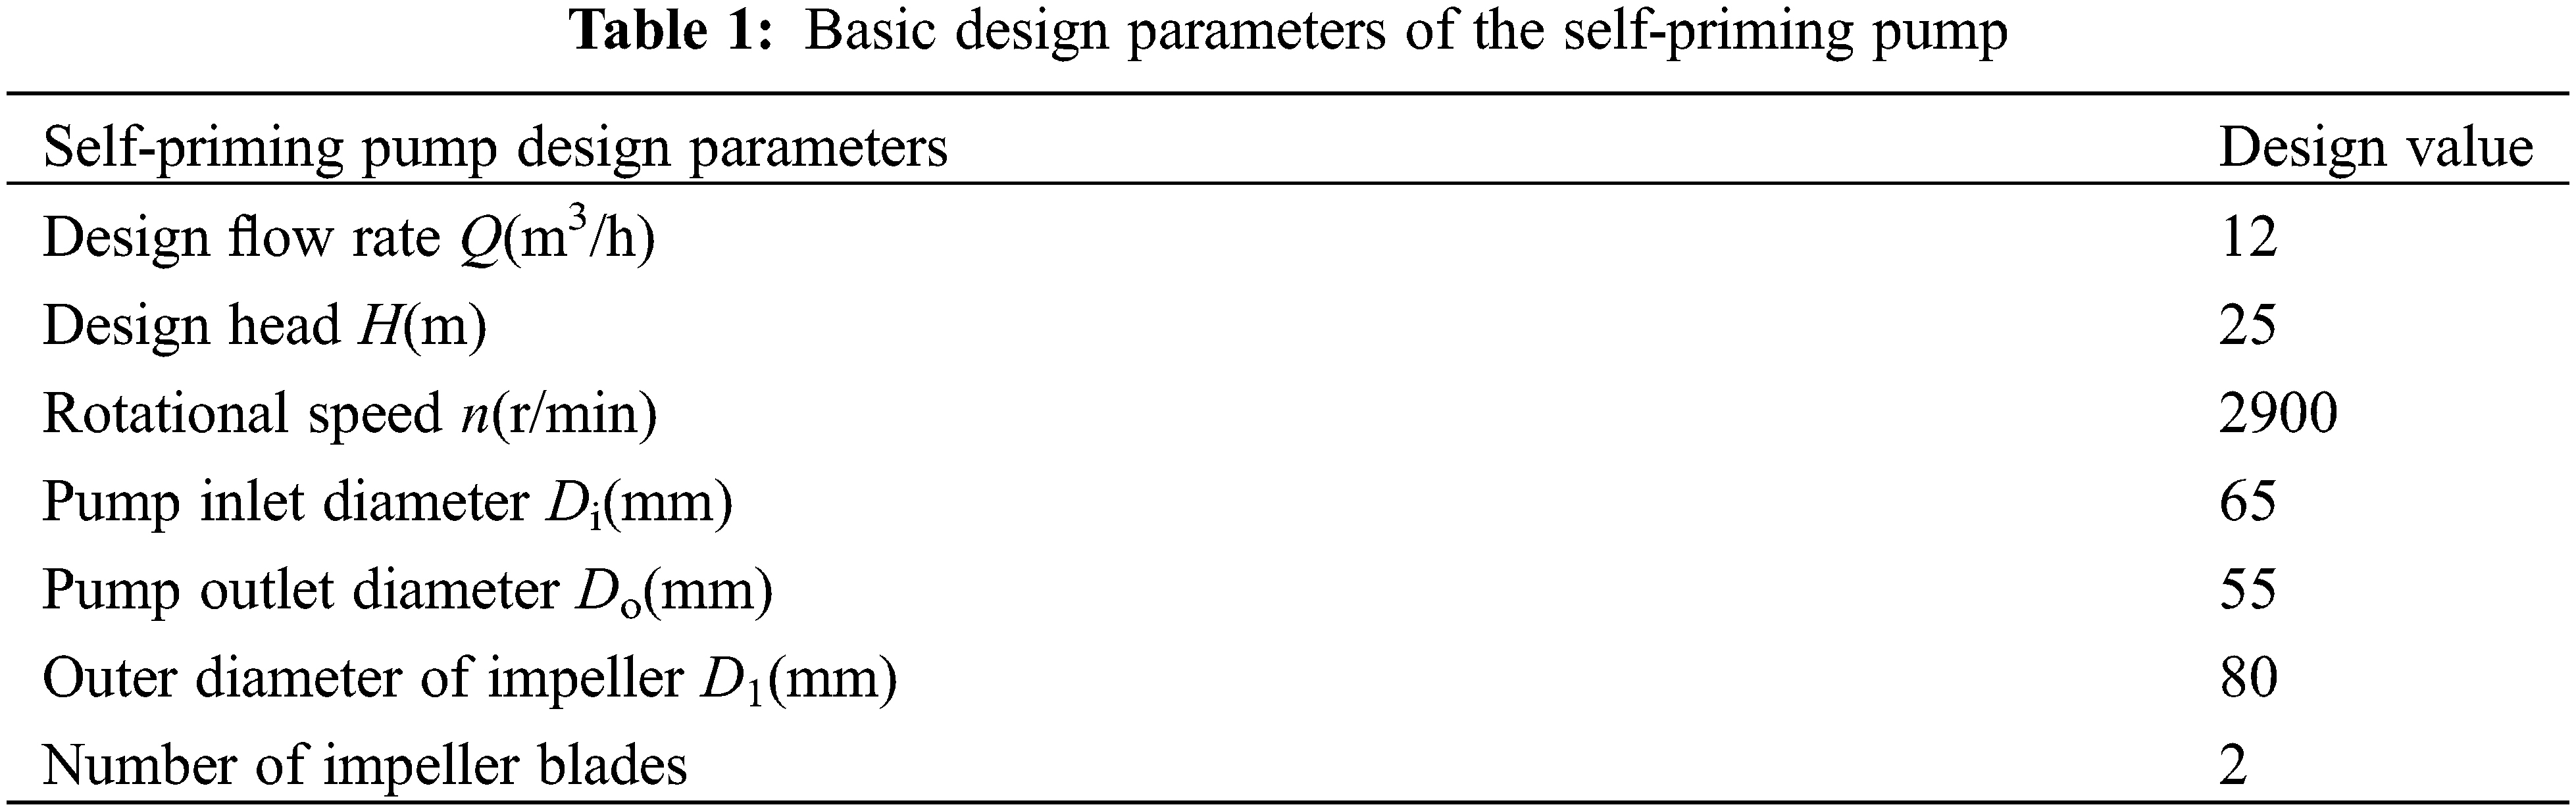
The subject of study in this paper is a ZX12-25 externally mixed self-priming centrifugal pump. This type of self-priming pump primarily consists of a suction pipe, impeller, volute, separation chamber, storage chamber, and other associated structures. Fig. 1 illustrates the physical 3D model of this pump type, while Table 1 presents the basic parameters.
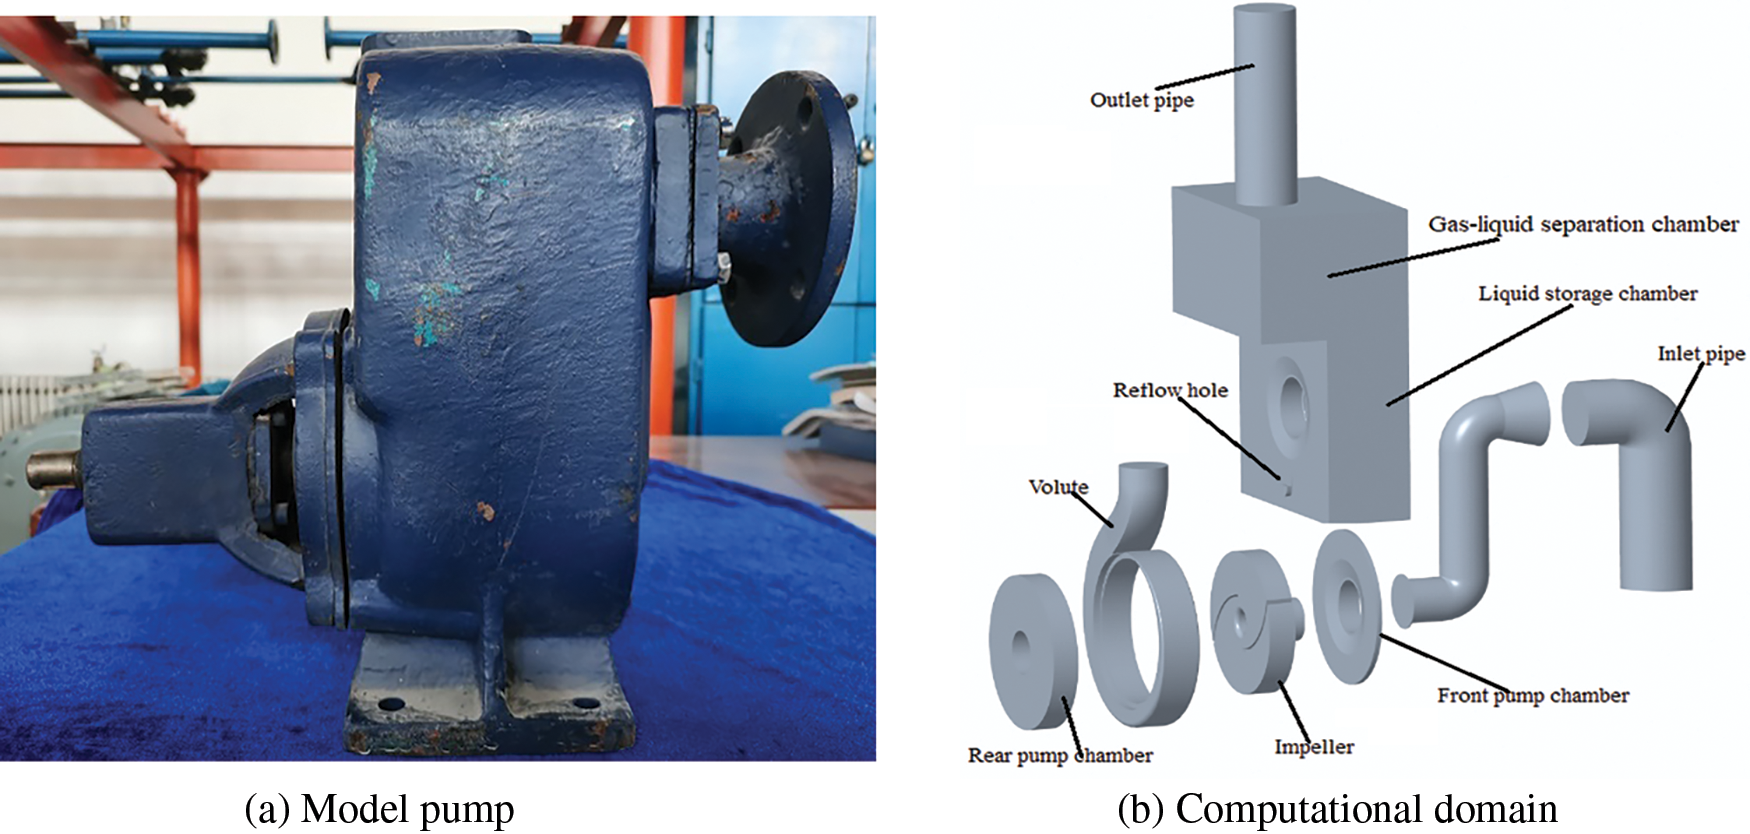
Figure 1: ZX12-25 external mixed self-priming centrifugal pump
The self-priming process involves the flow of gas and liquid in two phases, necessitating the utilization of a multiphase flow model. Commonly employed models include the hybrid, Euler, and VOF models. The VOF model is capable of simulating two or more immiscible fluids by solving a single momentum equation and tracking the volume fraction of each fluid within the designated region. Typical applications encompass predicting jet rupture, analyzing the movement of large bubbles within a liquid medium, studying post-dam failure liquid flow dynamics, as well as steady-state or transient monitoring of any gas-liquid interface [12–14].
The VOF model assumes that the pressure and velocity of each phase of fluid in a control volume are equal. The mixed fluid within the control volume is treated as a homogeneous flow, and the governing equation is solved for this mixture. The multiphase fluid calculation is accomplished by analyzing variations in the volume fraction of each phase within the mixed fluid. The volume equation for the qth phase in a mixed fluid is as follows [15,16]:
In Eq. (1):
The physical quantities of the other equations in the VOF model are mixed fluid parameters. Within the same control volume, phase velocity and pressure remain constant, while density, viscosity, and other parameters represent a weighted average of various volume fractions. From the physical property equation and continuity equation of an incompressible fluid, the transport equation for each phase volume can be obtained as follows:
In Eq. (2):
The momentum equation of a mixed fluid is:
In Eq. (3):
The turbulence model equation for a mixed fluid is structurally consistent with the single-phase flow equation, but the physical parameters (such as
The commonly used numerical simulation methods for turbulence are Direct Numerical Simulation (DNS), Reynolds-Averaged Navier-Stokes (RANS), and Large Eddy Simulation (LES). Currently, the predominant method in practice is Reynolds-averaged simulation. Common RANS models include the S-A model, k-ε Model, and RNG k-ω Model. Among them, the RNG k-ε model stands out due to its use of renormalization group analysis technology to modify turbulent viscosity for improved modeling [17].
The RNG k-ε model is initially proposed by Yakhot et al. in 1986 and subsequently applied to enhance the accuracy of the k-ε model. The transport equation of this model is as follows [18]:
In Eqs. (4)–(6):
Usually, the time step in numerical simulations needs to satisfy the Courant number. The rationality of the time step is generally evaluated based on the value of the Courant number. If the time step is set too large, it will result in a high Courant number; however, if it is set too small, there will be a significant increase in computational requirements. To ensure stable and efficient calculations, it is recommended to maintain a Courant number within the range of 20–40 in transient-sensitive regions [19]. This requirement can be expressed as follows:
In Eq. (7): C is the courant number; v is the absolute value of the estimated mean; l is the smallest the smallest size of the grid;
Since this paper focuses on studying the complete self-priming period, choosing a smaller time step for the simulation would significantly increase computational resources and time. Therefore, the transient calculation time step is set to 0.0001149 s. Moreover, both the flow rate inside the pump and the value of l are below 10 m/s and 4 × 10⁻³ m, respectively, ensuring that Eq. (7) is satisfied by the Courant number [20].
2.5 Boundary Condition Settings
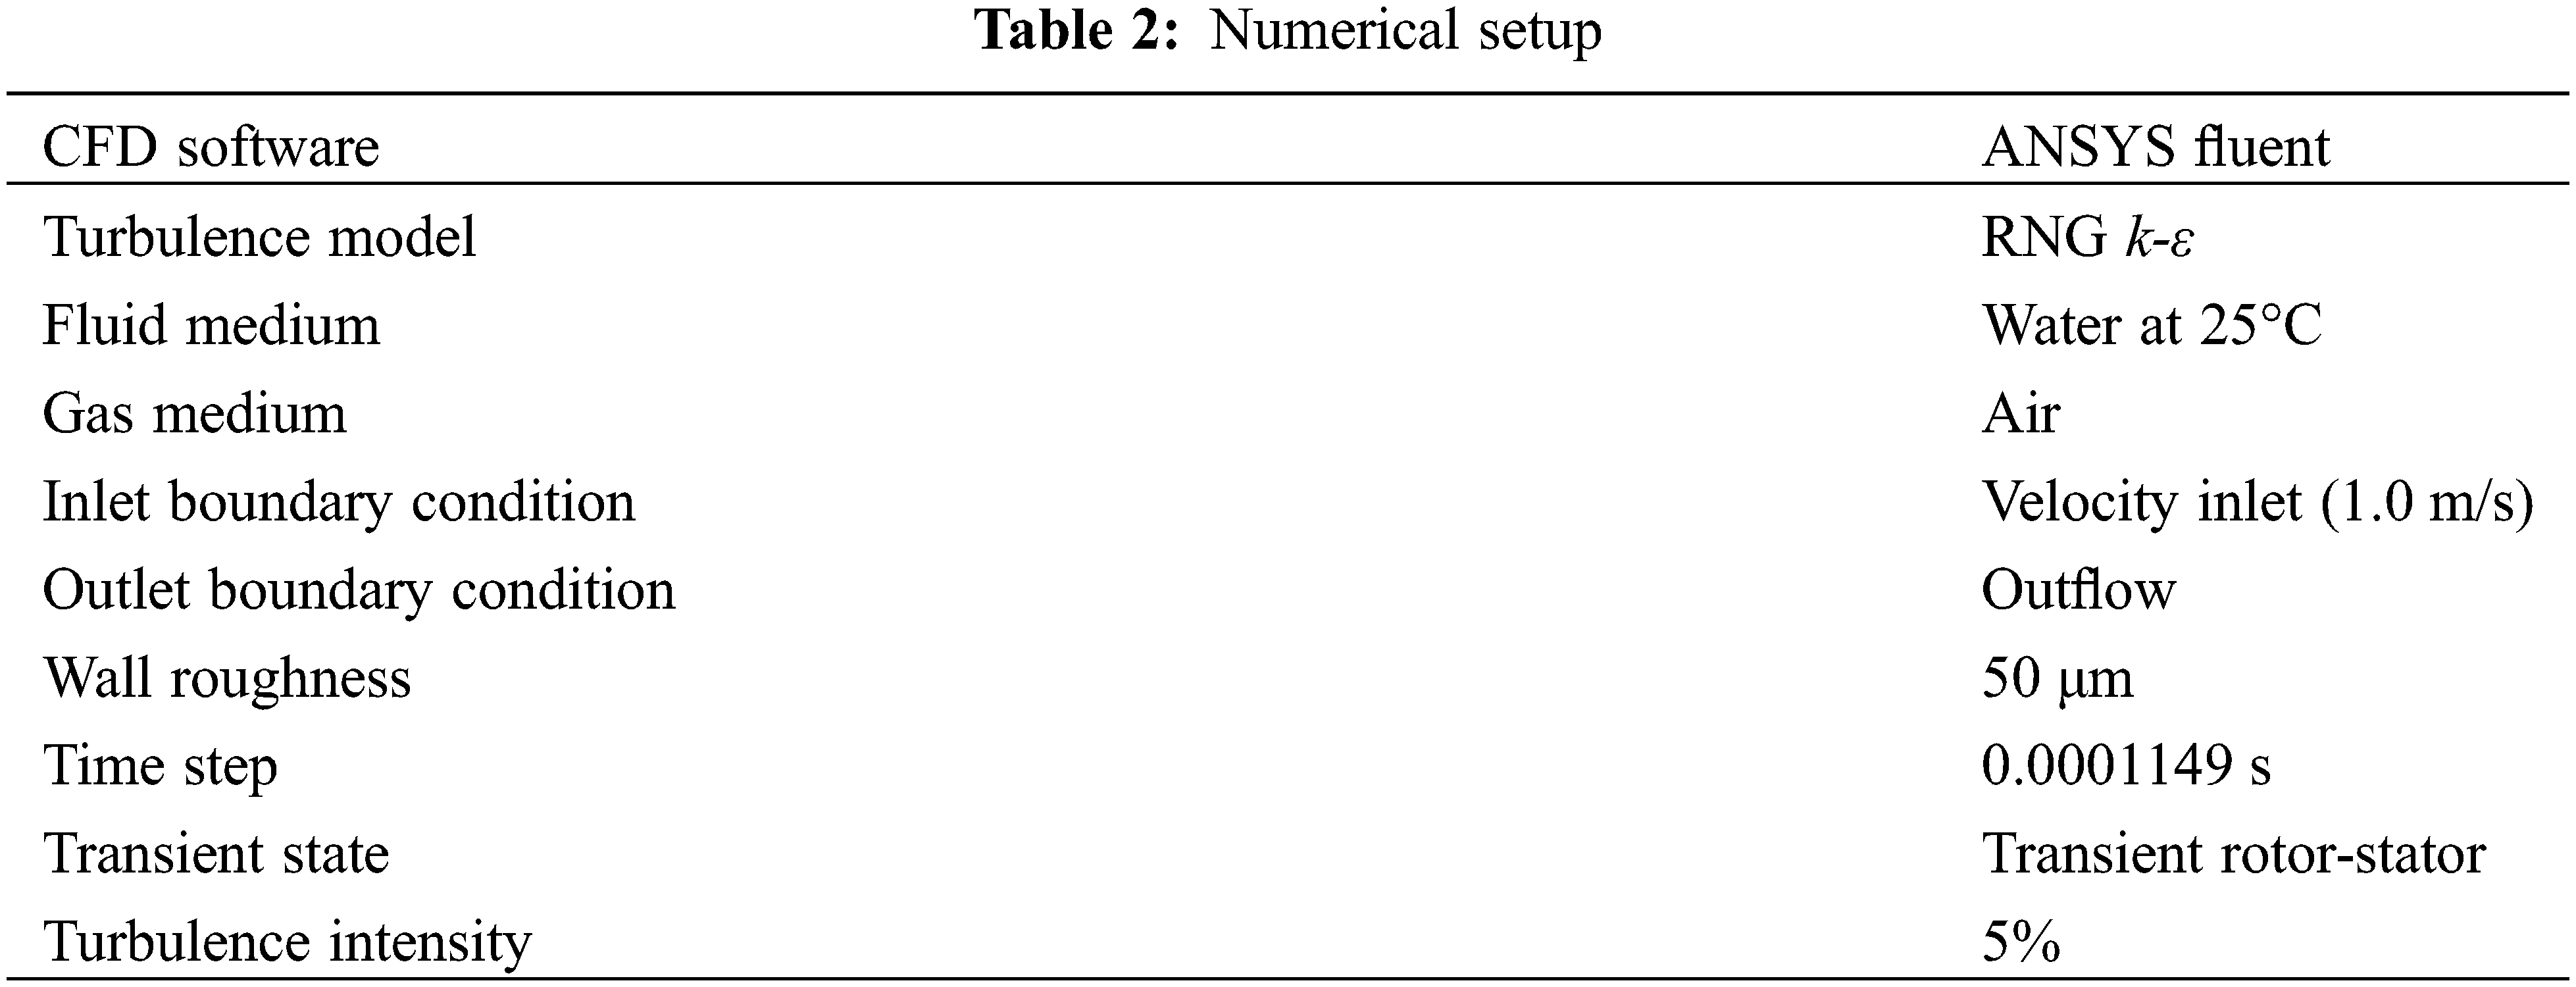
In this paper, the ANSYS software is used for numerical calculations. The pressure-based, fully conservative, finite volume method is used. The VOF multiphase flow model and RNG k-ε turbulent flow model are employed to solve the flow field of the self-priming pump. The time-dependent items are solved using implicit first-order schemes. To minimize numerical dissipation, the convection term is interpolated with third order accuracy using the QUICK method, while the diffusion term is computed using the central difference method. The discrete governing equation is solved using the SIMPLE implicit algorithm [21]. The fluid medium considered is incompressible water at a temperature of 25°C. According to the working principle of self-priming pumps, a certain amount of liquid should be present in the pump before starting. Fig. 2 illustrates the setup of the gas-liquid two-phase distribution in the pump prior to operation. The impeller, volute, and part of the gas-liquid separation chamber are filled with liquid at a volume fraction of 100%. The upper portion of the suction line, discharge line, and gas-liquid separation chamber contains the gas phase at a volume fraction of 100%. The upper limit of iterations for each time step is set to 100. To comprehensively obtain changes in physical quantities in various parts of the pump body during self-priming, monitoring surfaces are set up at the inlet and outlet pipes, impeller inlet and outlet, volute outlet, outlet pipe outlet, and reflux hole to monitor flow parameters. Other boundary conditions are shown in Table 2.
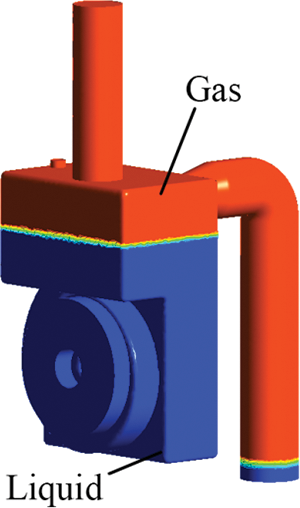
Figure 2: Initial gas-liquid distribution
2.6 Computational Grid Partitioning
In this paper, tetrahedral unstructured grids with high adaptability are utilized for mesh generation in the computational fluid domain. To ensure the accuracy of the numerical calculations, mesh refinement is applied to critical regions such as the diaphragm tongue and the reflux hole, while mesh independence is verified as presented in Table 3. Select H0 based on the trend of the head calculated numerically, and define the relative error r as [22]:
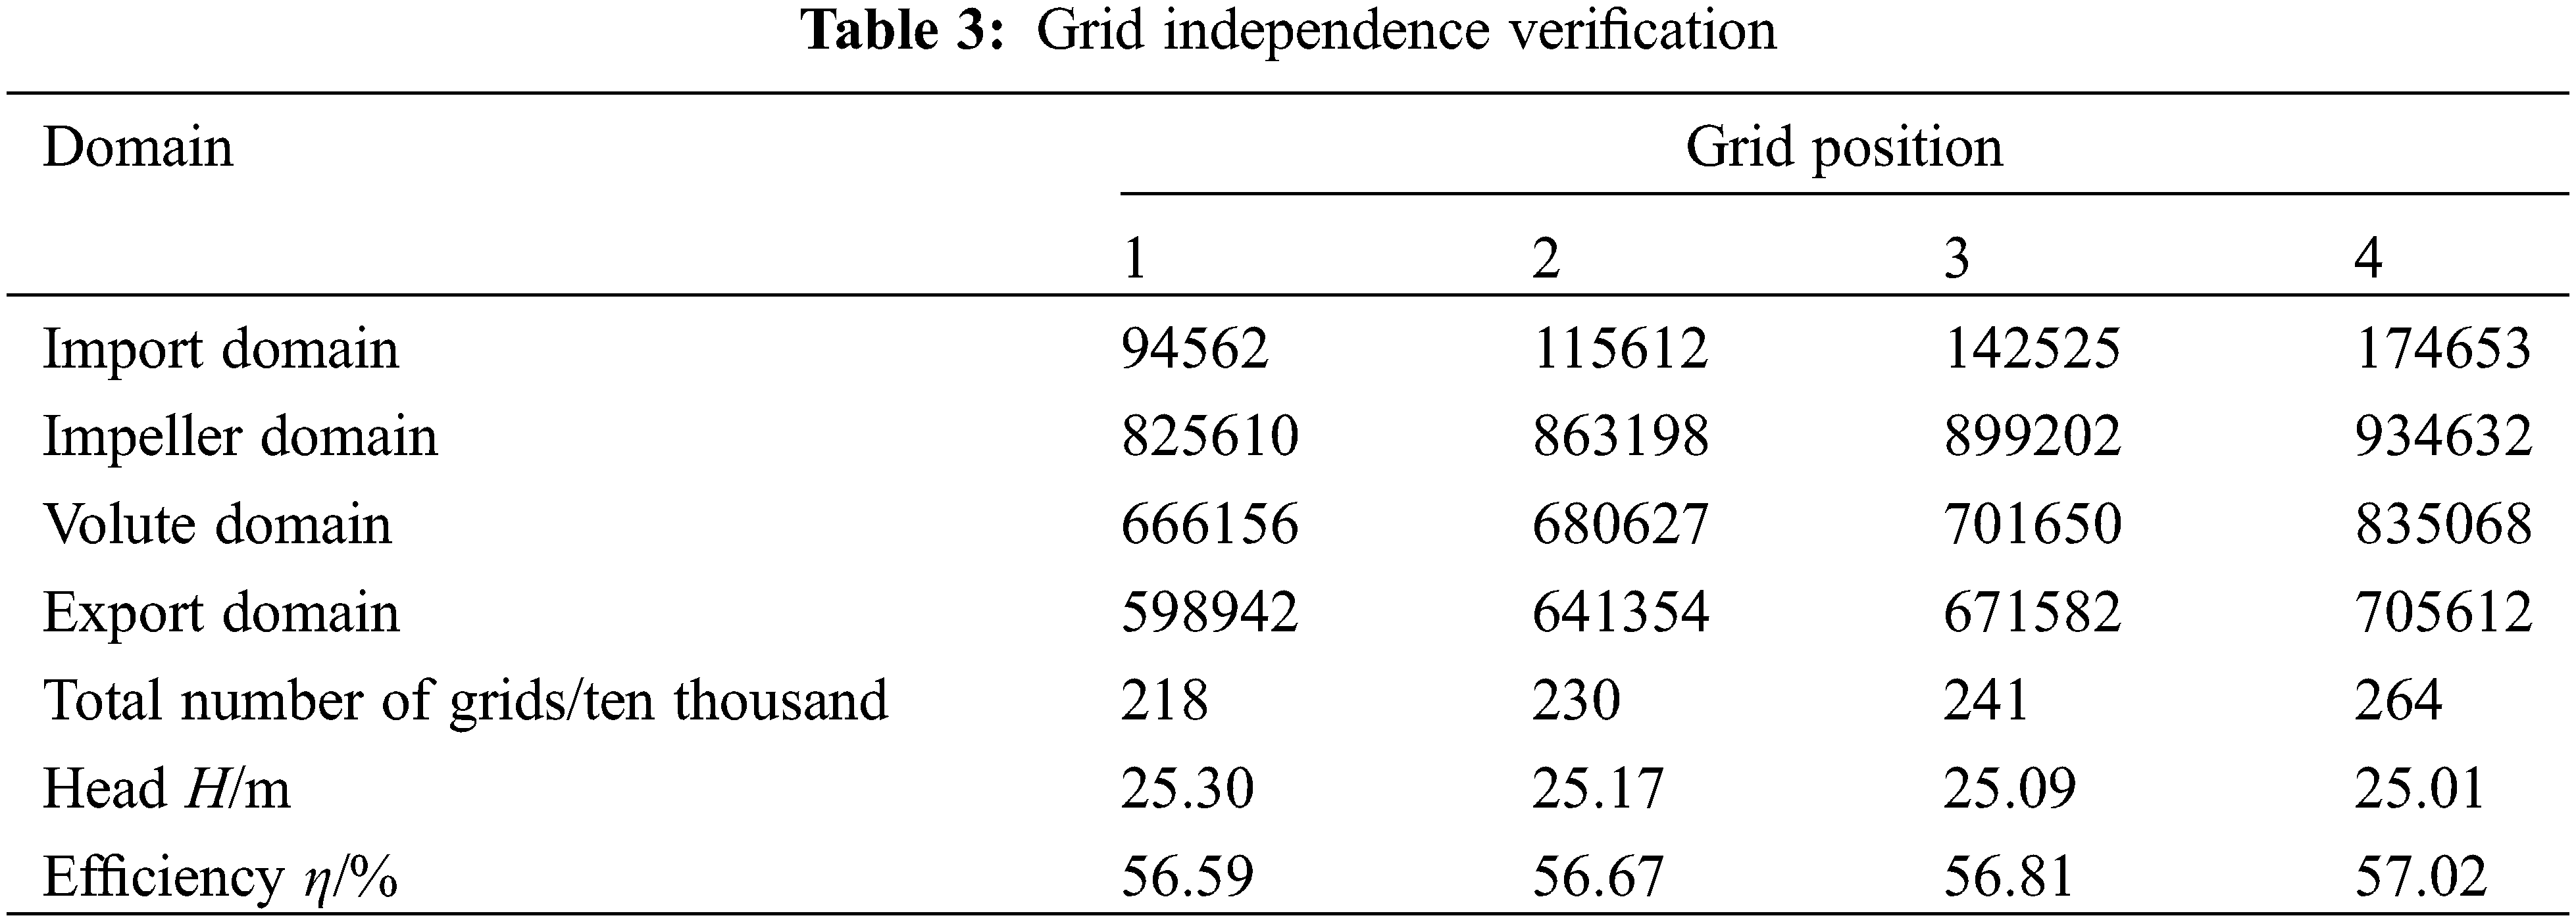
In Eq. (1) H is calculate head; H0 is test head.
When r is smaller, it indicates that the influence of the grid on the calculation results is smaller. When r < 1%, the grid is considered to meet the computational requirements. According to Table 3, H0 is 25.09 m. When the grid size is 2.41 million, obtain the minimum relative error.
In order to conserve resources and optimize computation time, a computational site consisting of 2.41 million grids is selected in this paper. The comprehensive calculation grid model is depicted in Fig. 3.
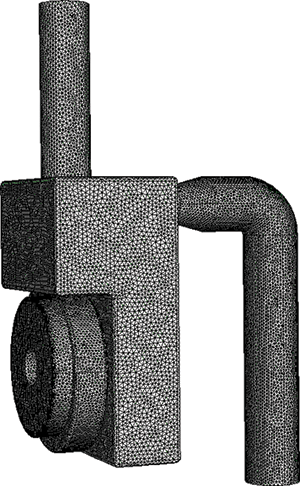
Figure 3: Calculation grids of the self-priming pump
3 Experimental Verification and Analysis
Fig. 4 depicts a schematic diagram of the hydraulic performance test bench used for the self-priming pumps. The test bench includes the following test devices: pressure sensors at the inlet and outlet, a torque tachometer, a flow meter, a motor, a water tank, etc. The motor is a three-phase asynchronous motor rated at 380 V with a speed of 2900 r/min.
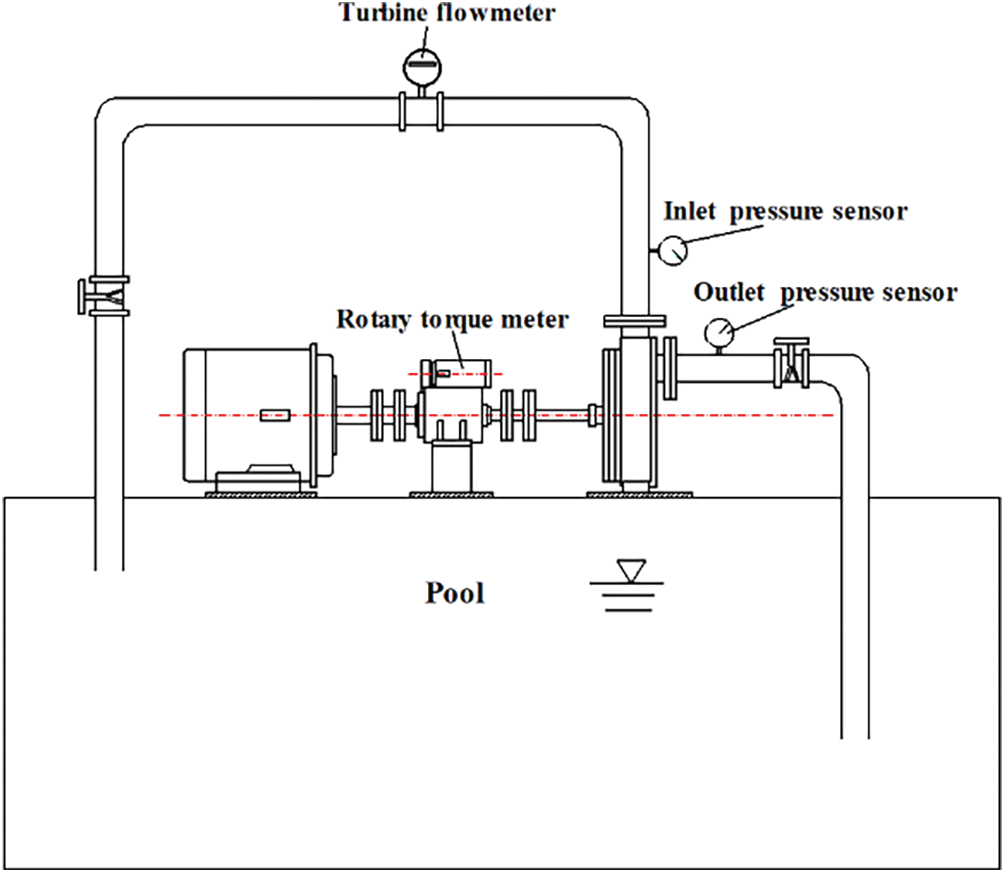
Figure 4: Schematic diagram of hydraulic performance test
The main device parameters are as follows: The range of the inlet pressure sensor is ±0.1 MPa and the accuracy is 0.25. The range of outlet pressure sensor is 0∼0.7 MPa and the accuracy is 0.5. The type of the flowmeter is LWGY-32C intelligent turbine flowmeter with the accuracy grade of 0.5, and the type of the rotary torque meter is NJ1, with the accuracy grade of 0.2 and measuring range of 0∼200 N⋅M.
The test shall be conducted in accordance with the specific operational procedures specified in the Chinese National Standard GB/T3216-2016 “Rotary Power Pump–Hydraulic Performance Acceptance Test–1, 2, 3”. Before the experiment starts, maintain the stability of the water tank and check that the outlet is not submerged in the water body of the water tank to facilitate the discharge of gas during the self-priming process. After the system stabilizes water absorption, 5 sets of inlet and outlet pressure, flow rate, and rotational speed power are collected at each operating point. After similarity transformation, calculate the average of 5 sets of corresponding data under the same working condition, and then calculate the head efficiency.
The results of the energy experiment are presented in Table 4.
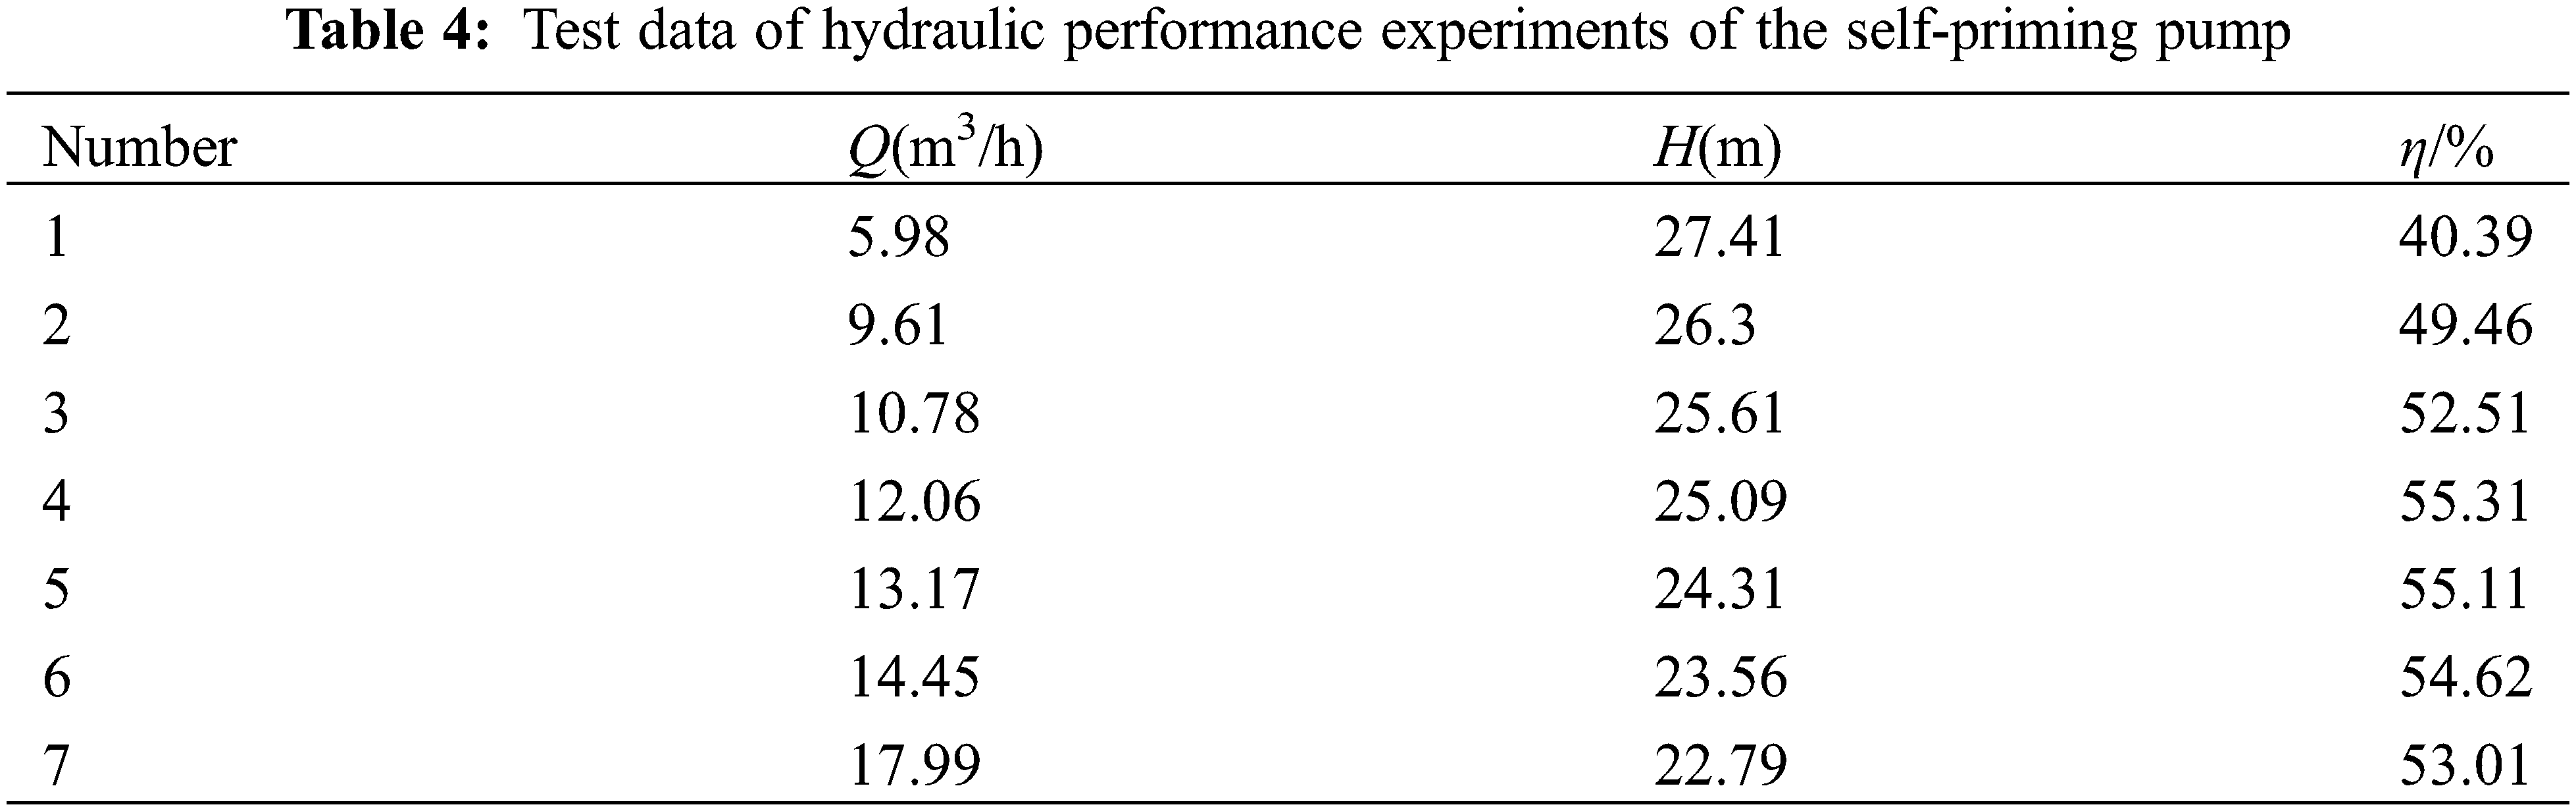
The energy curves are shown in Fig. 5. It can be observed that there is a significant discrepancy between the head and efficiency curves obtained from numerical calculations and experimental measurements when deviating from the design operating conditions. The calculated value is approximately 5.2% higher than the experimental value. However, at the design working condition point, there exists a negligible difference between the calculated and experimental values. The accuracy of the simulated model has been verified to be within 5%, thus further studies can be carried out based on this model.
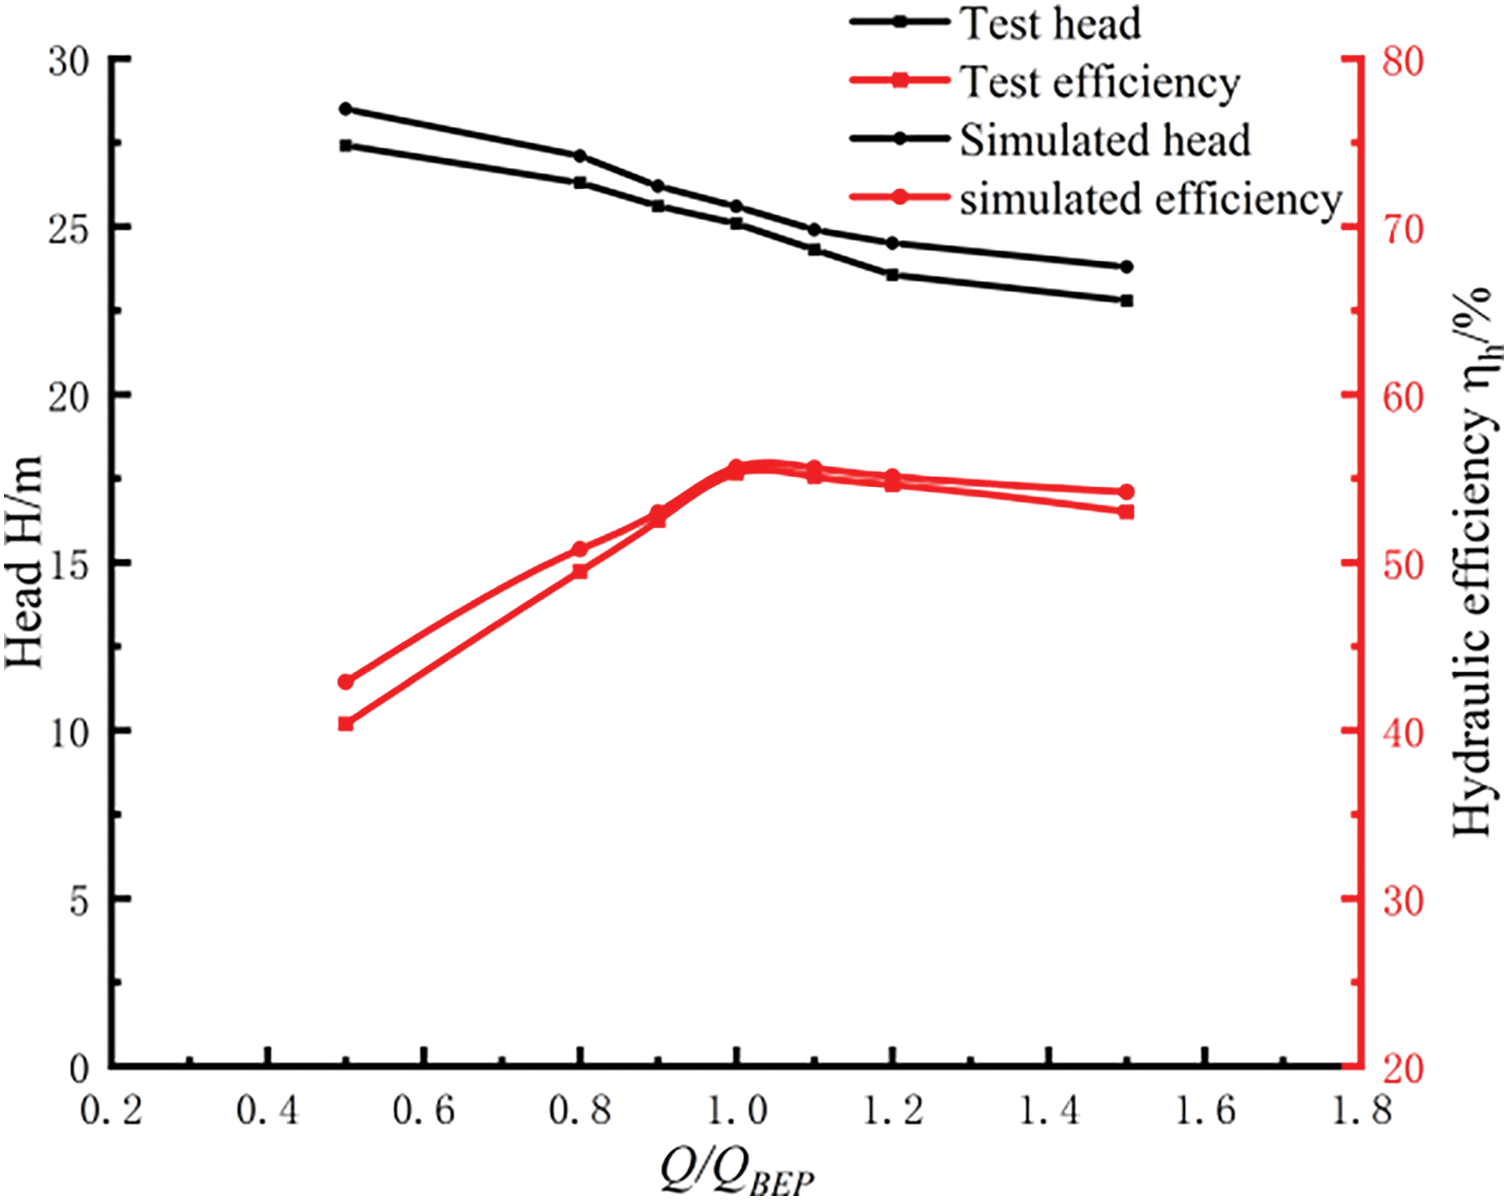
Figure 5: Hydraulic performance curves
4 Calculation Results and Analysis
Based on the size of the volute at the reflux hole, Models 1 and 3 adjust the radial position of the reflux hole by 5 mm. Model 2 represents the original position, as depicted in Fig. 6. At the same time, the calculation model is established according to the three positions. The self-priming performance is a crucial parameter of interest to users during the operation of a self-priming pump. The gas-liquid two-phase flow state and its evolution process play a decisive role in determining the self-priming performance. During the self-priming process, the impeller and volute go through a complicated gas-liquid phase change, which makes the mechanical properties of the self-priming period unstable. So, the gas-liquid two-phase volume fraction and radial force were chosen as the topics of this paper’s research to look at how reflux holes affect self-priming performance at different radial distances.
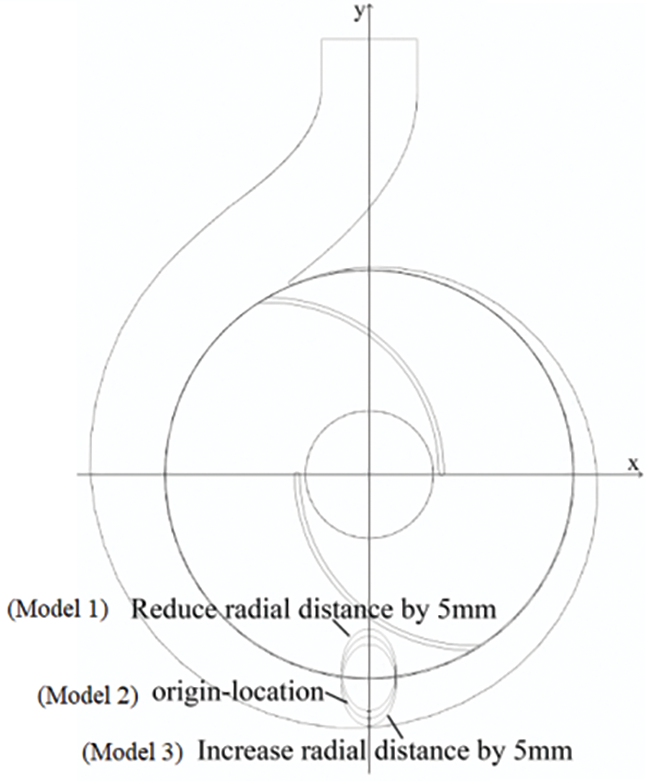
Figure 6: Schematic diagram of radial distances for three models
Fig. 7 depicts the gas-liquid distribution along the axial section of the self-priming pump during its self-priming process for Models 1, 2 and 3. It is evident that at a time of 0.08 s, the self-priming pump has just initiated and there exists a relatively similar axial gas-liquid distribution in all three positions.
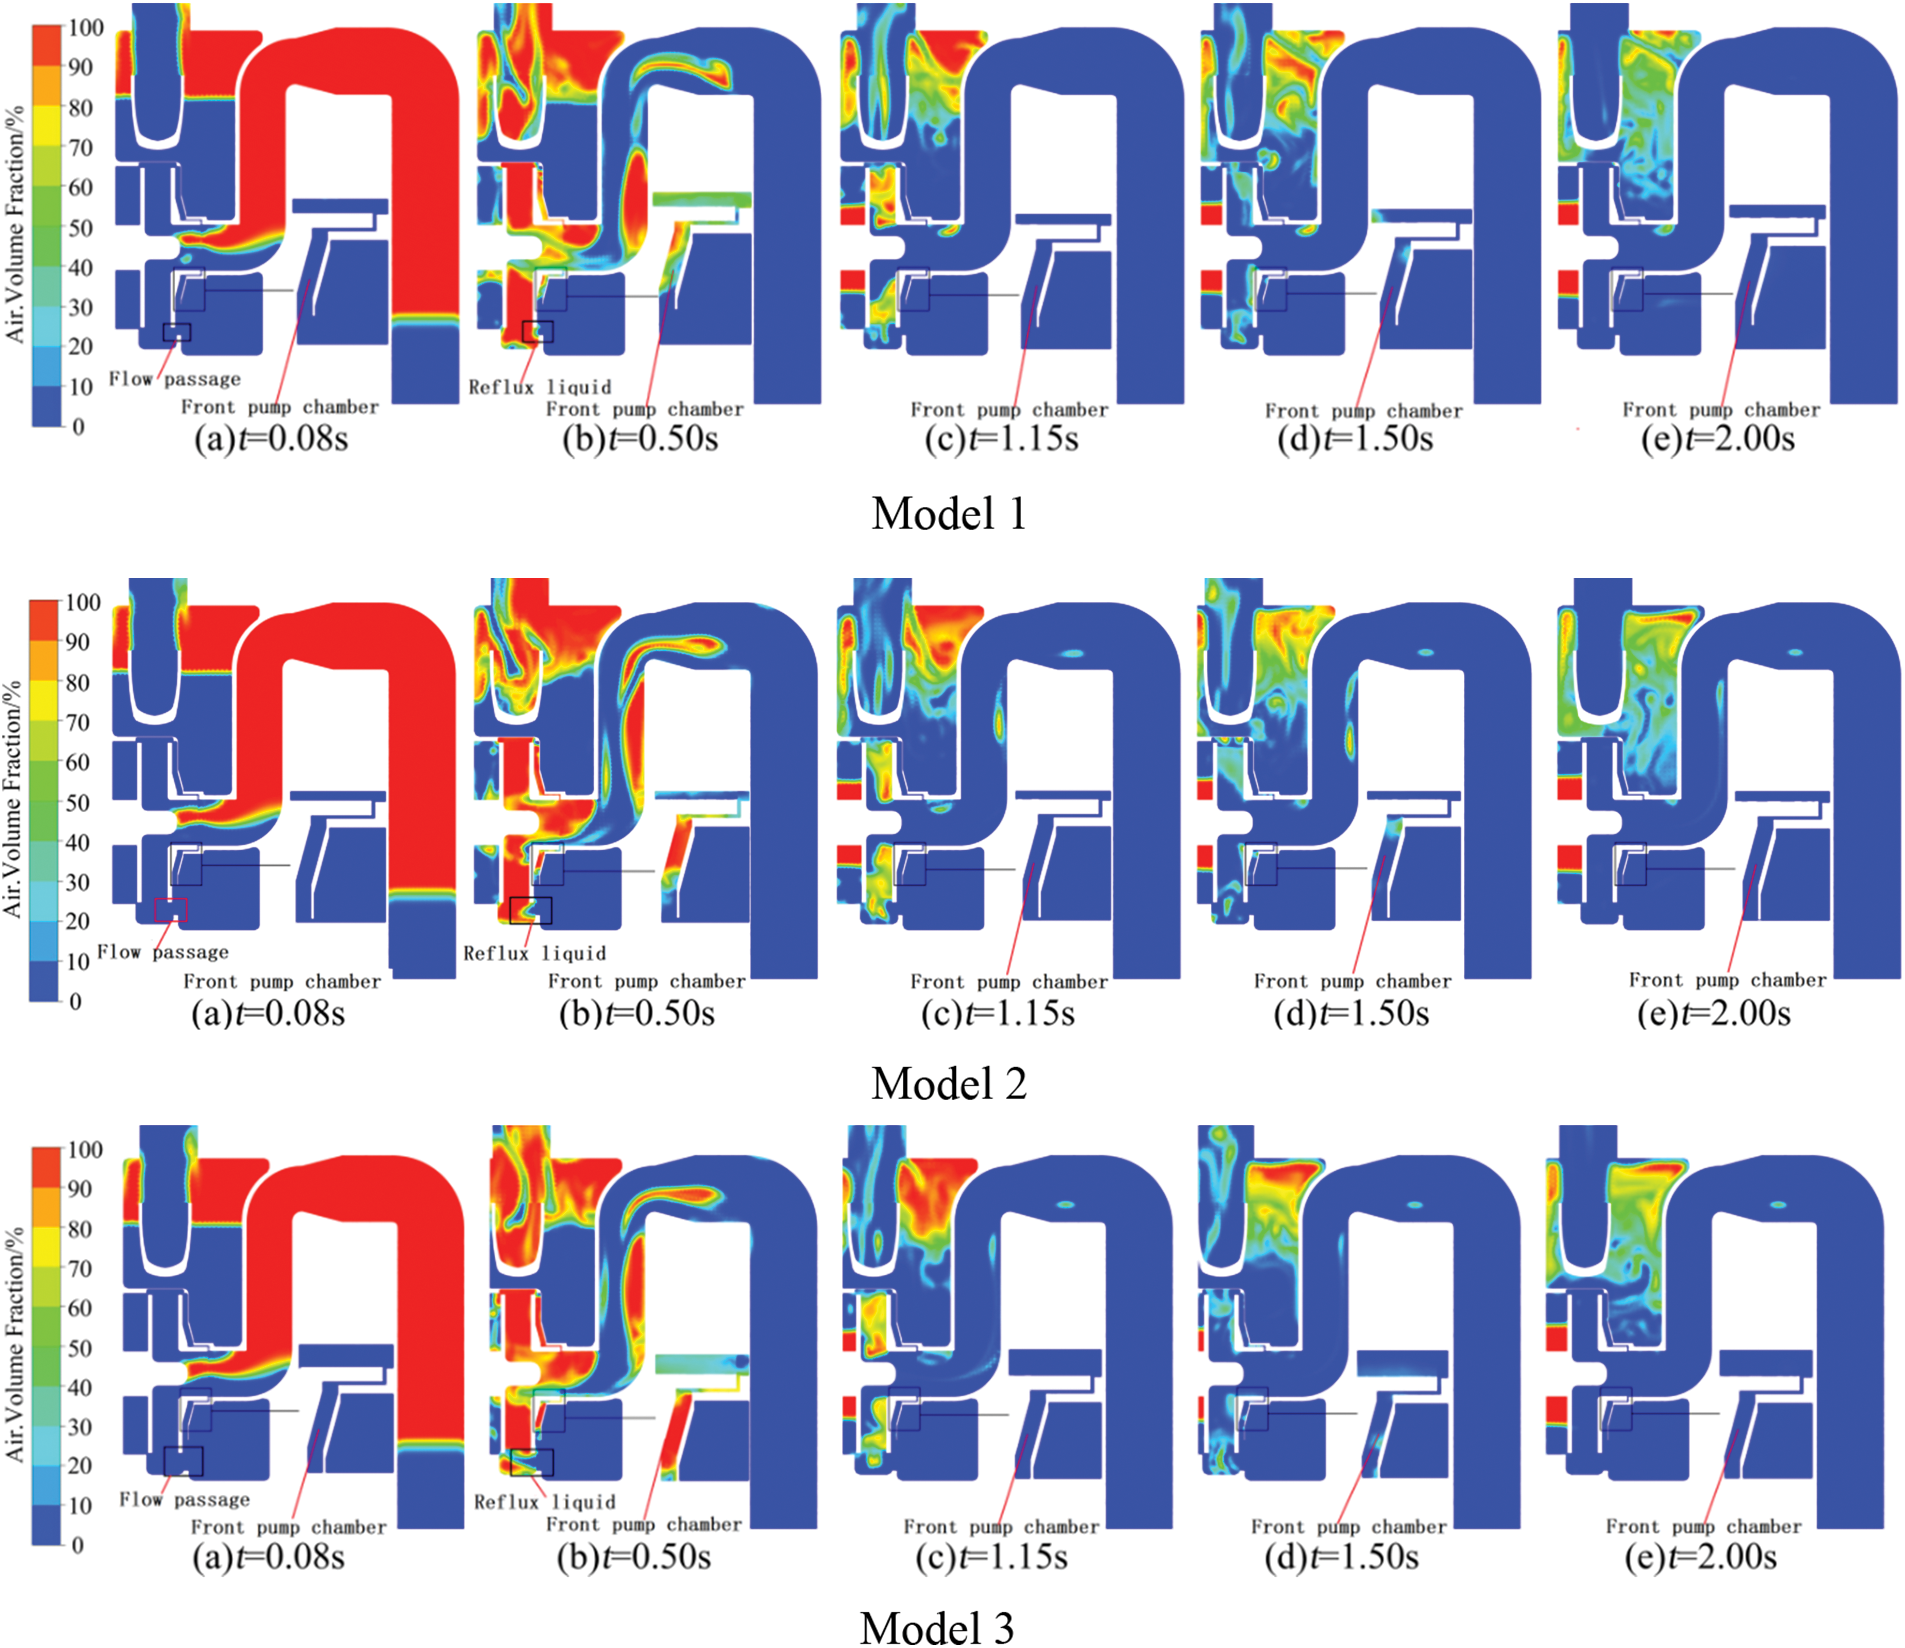
Figure 7: Air volume fraction on the axial direction of impeller inside of the pump
At 0.50 s, the impeller becomes fully occupied by gas and liquid from the inlet pipe is drawn into it. The distribution of liquids entering Model 1 appears relatively symmetric. Meanwhile, the liquid in the storage chamber flows back to the volute through a reflux hole, carrying out the gas-liquid mixture. In Model 2, there is a significant eccentricity distribution of liquid entering the impeller and a larger depth of reflux hole where it enters the volute compared to Model 1. However, in Model 1, there is a relatively shorter distance between liquid in front pump chamber and mouth ring. Model 3 has a relatively large depth of reflux hole; its instantaneous flow rate is higher because there is no front cover blocking return flow through this hole but significant fluctuations can be observed in Fig. 8.
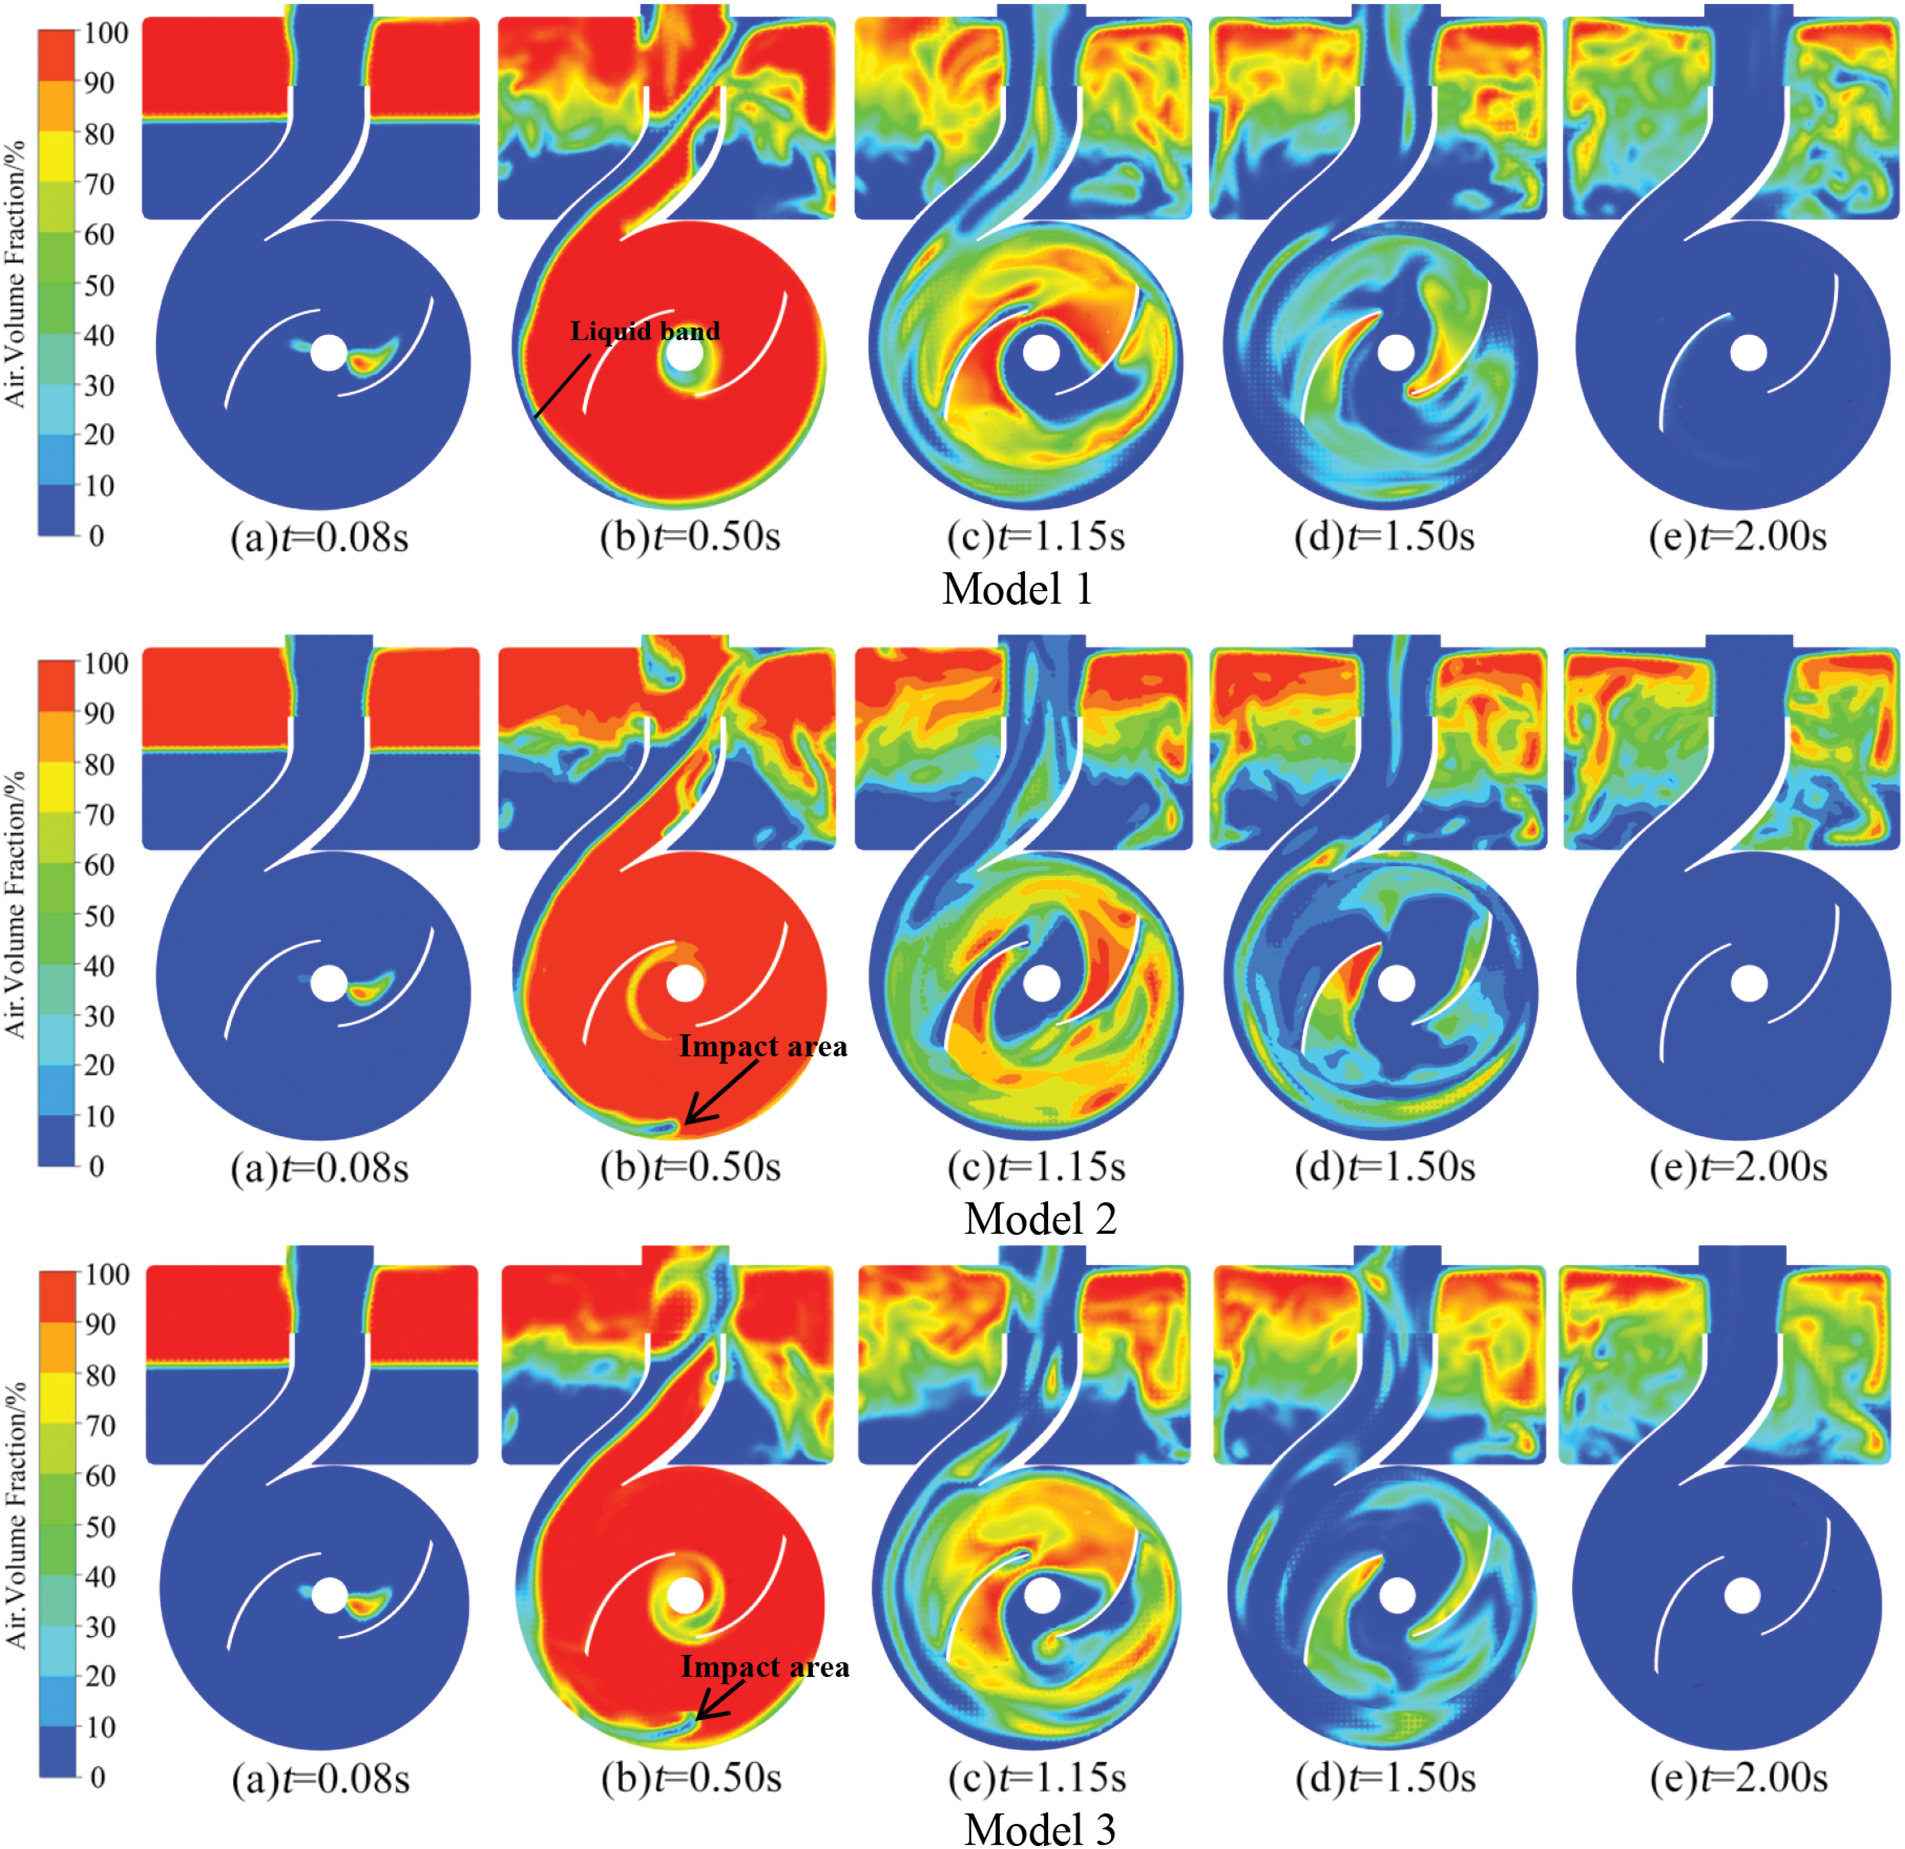
Figure 8: Air volume fraction on the radial direction of impeller inside of the pump
At 1.15 s, the gas volume significantly decreased in the three positions model impellers compared to 0.50 s, and only a small amount of gas remained in the inlet pipe. The gas mass in the inlet in Model 1 is relatively lower than at the other two locations. At 1.50 s, the self-priming pump has reached its final stage of priming, resulting in a relatively low gas volume within the inlet pipe, impeller and volute. The majority of the gas within the impeller is distributed towards the front cover plate.
At 2.00 s, the self-priming period essentially ends, and the gas content in the inlet pipes of all three models further decreases compared to the previous moment. The gas within the impeller and volute has been expelled, and the gas in the forward pump chamber has also been completely discharged. The self-priming pump is now ready to enter its normal operating phase.
It is evident that the discrepancies in the positions of the reflux apertures, which are arranged at three distinct radial distances during the self-priming process of a self-priming pump, primarily manifest themselves in the initial and intermediate stages. The three positions of the reflux holes affect the flow rate and distribution of liquid during self-priming, which in turn affects the internal properties of the self-priming pump. These changes subsequently impact both the flow rate and distribution of liquid through the reflux hole, ultimately influencing its self-priming performance.
The radial distribution of gas and liquid around the impeller during the self-priming process of the self-priming pump at positions 1, 2, and 3 is depicted in Fig. 8.
At 0.08 s, the self-priming pump starts and the impeller rotation discharges liquid from it, drawing gas into the impeller inlet and resulting in a relatively similar distribution of gas and liquid at all three locations.
At 0.50 s the impeller is mostly filled with gas and the liquid in the lower part of the intake pipe is drawn into it. The liquid distribution in the impeller is relatively homogeneous in the position 1 model, while it is eccentric and asymmetric in the position 2 model, and two bundles of relatively symmetric liquid flows are observed in the position 3 model. Figure shows that the liquid returning through the reflux hole undergoes gas-liquid mixing near the inner wall of the volute and then flows into the gas-liquid separation chamber as a mixture. In the position 1 model, there is a liquid band present at the outer edge of the volute from Section 3 to the outlet. However, it should be noted that the volume of liquid on the outer edge of the volute between Sections 3 and 5 is significantly lower than that observed after Section 5. In positions 2 and 3 models, the liquid band predominantly exists along the outer edge of the volute from Section 5 to the outlet, indicating an earlier initiation of gas-liquid mixing in position 1 model. Mainly due to the small distance between the reflux holes in Model 1, most of the area of the reflux holes is located in the front pump chamber, and as a result, the vast majority of the reflux liquid first enters into this chamber before entering other areas, as shown in Fig. 7. At this point, some of the liquid flowing back through the reflux hole will interact with the front cover plate of the impeller, following its rotational effect and acquiring a certain circumferential velocity. However, due to the fact that the rear cover plate mainly relies on wall friction to work on the liquid, the circumferential velocity of the liquid is not large. The low kinetic energy causes the liquid in the front pump chamber to be ejected near the third section of the volute. By comparing the gas-liquid two-phase flow structure from the V-section to the outlet near the inner wall of the volute, it can be observed that Model 1 exhibits a smooth and continuous reflux liquid flow without any significant impact area. In Model 2, there is a relatively obvious reflux impact area where the reflux liquid and gas are mixed, and this mixing area is relatively stable. Model 3 shows a clear reflux impact area which is larger than in other models. In this area, both reflux liquid and gas are mixed but there is significant fluctuation in their mixing.
The location of the impact area from the reflux liquid is found to be higher in Model 3, followed by Model 2, while Model 1 had the lowest position. This contradicts the arrangement of the reflux holes. The phenomenon is primarily associated with the flow passage created by the reflux hole and the outer edge of the impeller, which directly enters the inner part of the volute, as well as with the distribution of reflux liquid entering it. The effective channels from Model 1 to Model 3 exhibit a gradual increase, as depicted in Fig. 7. Meanwhile, according to the preceding analysis, the majority of reflux liquid in Model 1 is transported to various positions within the volute through the rotational effect of the front cover plate, resulting in a more uniform distribution. However, there is a limited inflow of liquid into the volute through the reflux channel. At the same time, this portion of liquid experiences centrifugal force due to impeller rotation and is ejected towards the vicinity of the volute wall. For Model 2 and Model 3, as the reflux hole gradually increases towards that position, the overflow channel also gradually expands, causing a gradual weakening in the effect of impeller rotation. A large amount of liquid forms a jet through this channel and enters the volute. Meanwhile, the gas distribution diagrams in Fig. 7 reveal that near the inner wall of the volute at the outlet of the reflux hole, gas accumulation has altered the flow direction of the reflux liquid. Model 3 exhibits a more pronounced upward trend in reflux liquid compared to Model 2. The aforementioned factors have resulted in variations in the gas-liquid distribution among different reflux holes. It can be observed that, at this stage in Model 1, the liquid reflux exhibits greater stability and a larger gas-liquid interface area.
At 1.15 s, a large amount of liquid and gas are mixed in the impeller, with the gas being concentrated on the suction surface of the blade. The distribution of gas and liquid inside the impeller and volute is chaotic. The gas-liquid distribution in the impeller at positions 1 and 2 exhibits a certain degree of symmetry, while at position 3, a continuous strip of liquid forms at the inner edge of the volute extending from the reflux hole to the tongue.
At 1.5 s, most of the gas within the impeller has been expelled, leaving only a small amount that primarily accumulates on the suction surface of the blade. The gas distribution in the impeller of position 1 model is broader and more homogeneous compared to the other two models. The gas-liquid distribution is slightly narrower in the position 2 and 3 models, but the symmetry of the gas-liquid distribution is worse, especially in the position 2 model where significant amounts of gas accumulate on the accretion plane of the single-sided blade. The gas-liquid mixing region in the volute is intermittently distributed in Modes 1 and 3, while it forms continuous bands in Mode 2.
At 2.00 s, there is negligible gas present in all three models of the impeller and volute, indicating that the self-priming period of the pump has essentially completed.
The variability of the gas mass fraction among the different flow components in the three models is depicted in Fig. 9. It can be observed that the gas mass fraction in the impeller and volute of the three models initially increases and then decreases throughout the entire self-priming process. The gas mass fraction in the inlet pipeline shows a gradual decrease, while it gradually increases in the gas-liquid separation chamber. This change pattern is consistent with the trend of gas mass fraction variation during the self-priming process.
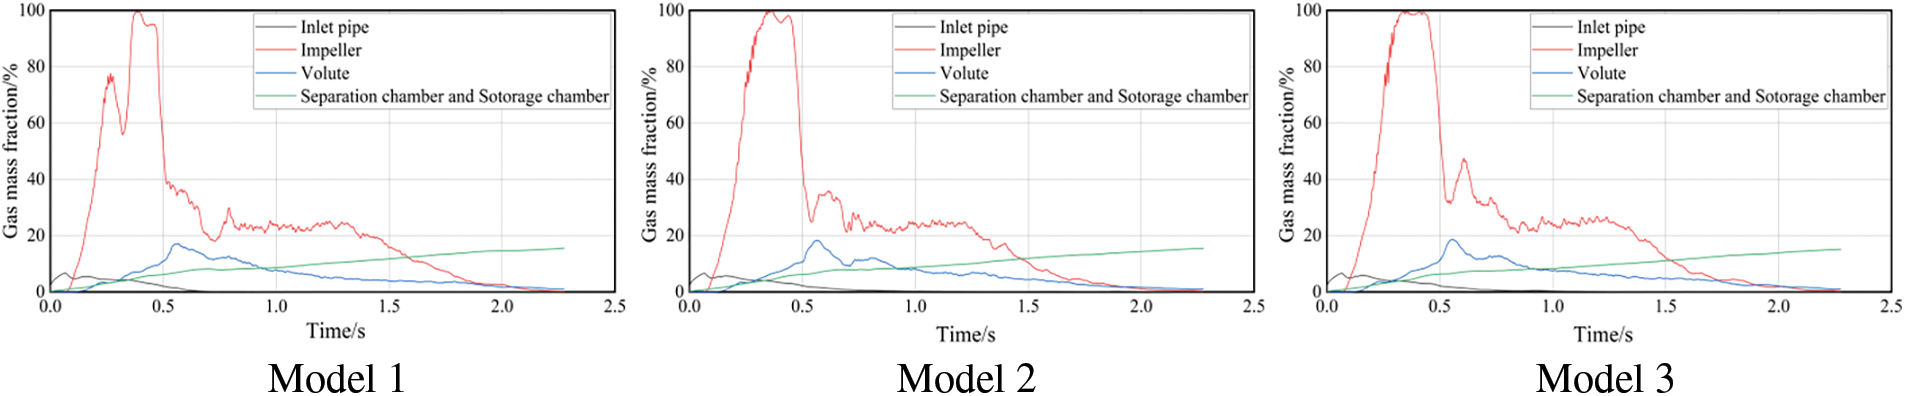
Figure 9: The mass fraction of gas in different structures of self-priming pumps
In the initial stage of self-suction, the gas mainly exists in the inlet pipe. Due to the rotation effect of the impeller, the liquid inside it flows into both the volute and gas-liquid separation chamber. Under negative pressure, gas is drawn into the impeller from the inlet pipeline and then enters the gas-liquid separation chamber where it is discharged due to a combination of remaining liquid inside the impeller and reflux liquid inside the volute, resulting in significant effects. As the self-priming process progresses, the gas in the inlet pipeline continues to decrease. At this point, the liquid in the inlet pipeline is gradually drawn in, resulting in a reduction of gas mass fraction in the impeller. Although the gas mass fraction inside the volute follows a similar trend as the flow rate, there is no significant change in amplitude due to the constant presence of reflux liquid inside.
Comparing the changes in gas mass fraction of three different models, it can be seen that the trend of gas mass fraction changes in other flow passage components is basically the same, except for the impeller. It can be seen that in Model 1, there is a significant decrease in the gas mass fraction inside the impeller at 2.28 s, followed by a fluctuation process of an increase, and the time when the gas mass fraction exceeds 80% is significantly reduced. This phenomenon may be attributed to a large amount of reflux liquid entering the front pump chamber in Model 1, resulting in a small quantity of liquid flowing into the impeller inlet through the ring gap, as depicted in Fig. 7. However, the changes in gas mass fraction inside the impeller of Model 2 and Model 3 exhibit similar patterns, showing an initial rapid increase followed by a subsequent rapid decrease.
In summary, arranging reflux holes with a smaller radial distance can achieve a more effective reflux structure, reduce the interference of reflux liquid on the main flow field of the volute, and to some extent impact the gas phase distribution in flow-passing components such as impellers, thereby improving the flow field structure in the reflux area.
4.2 Pressure Pulsation Analysis
Fig. 10 shows the time-domain variation of the average pressure fluctuations of the three modes on each monitoring surface.
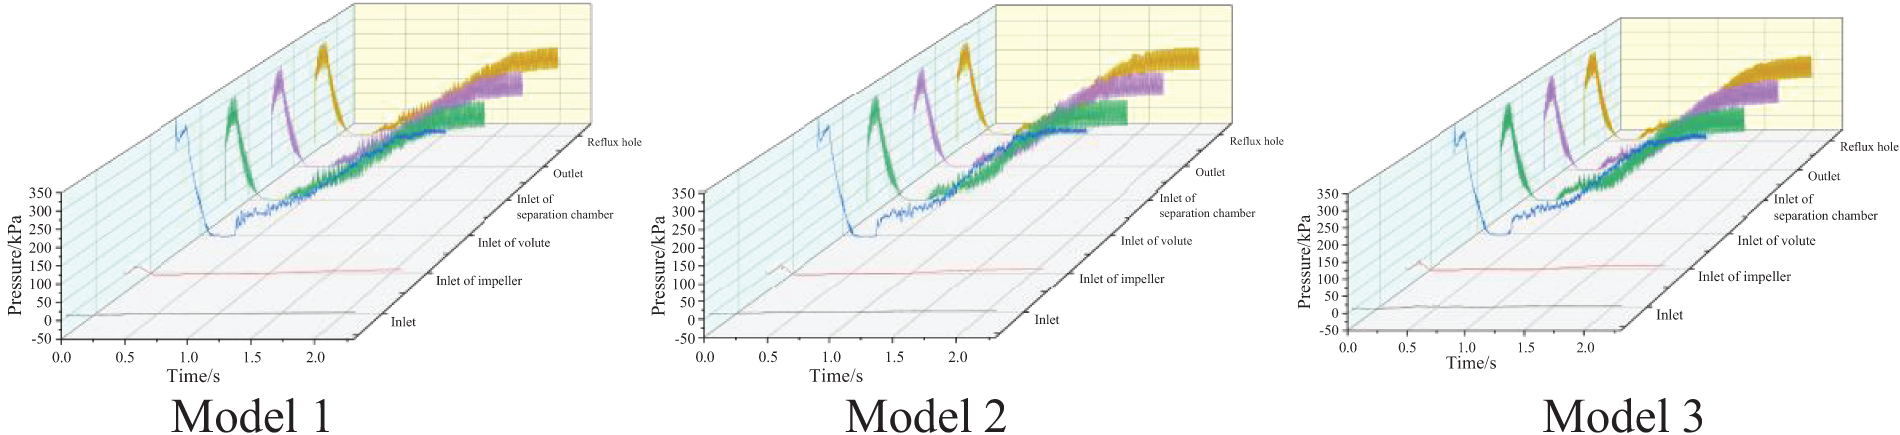
Figure 10: Time domain diagram of pressure fluctuation on monitoring surface
After the self-priming pump is initiated, there is a transient increase in average pressure at each monitoring surface due to water discharge from the impeller. As the impeller enters the exhaust phase, it becomes almost completely filled with gas and the pressure at each monitoring surface begins to decrease. The value of the pressure fluctuation is close to zero, and there are no significant periodic fluctuations. After the liquid is drawn into the impeller, the pressure fluctuations gradually increase at each monitoring surface, resulting in relatively disordered pressure pulsations. As the gas depletes, distinct periodic fluctuations appear in the average pressure fluctuation at each monitoring surface. Meanwhile, Model 3 experiences the largest range of pressure fluctuations due to its greater radial distance and higher susceptibility to impeller interference. The average pressure during the stable stage is approximately 168 kPa, which is about 5% higher than that of Model 2 and 11% higher than that of Model 1, which experiences the smallest range.
Fig. 11 illustrates frequency domain diagrams that show the average pressure fluctuations on monitoring surfaces located in Model 1, 2, and 3.
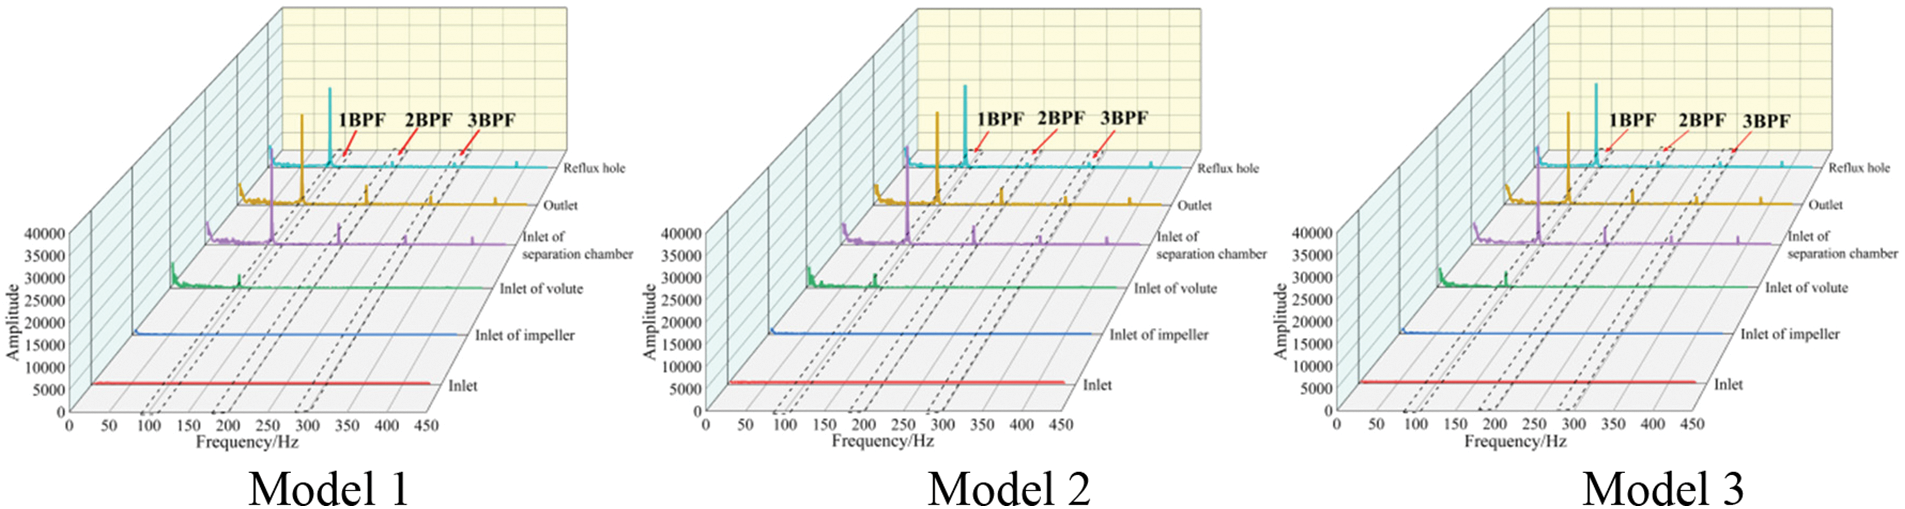
Figure 11: Frequency domain diagram of pressure fluctuation on each monitoring surface
The pressure pulsation frequency curves at the pump and impeller inlets remain relatively stable due to minor fluctuations. Based on the pump speed in Table 1, it can be observed that the shaft passing frequency is 48.3 Hz, and the blade passing frequency (BPF) is 96.7 Hz. The frequency domain curves of pressure pulsations at the inlet of the volute, separation chamber, pump outlet, and reflux hole clearly indicate that the pressure pulsations are primarily concentrated at the blade passing frequency and its second harmonic. This indicates that the primary cause of pressure fluctuations at the mentioned monitoring surface is the interference caused by blade rotation. By combining Figs. 7 and 8, it becomes evident that both gas distribution and its volume fraction strongly correlate with the average pressure fluctuation on each monitored surface during self-priming.
Fig. 12 illustrates the time-domain diagrams of the radial force components exerted by the impeller in the horizontal and vertical directions in Models 1, 2, and 3.
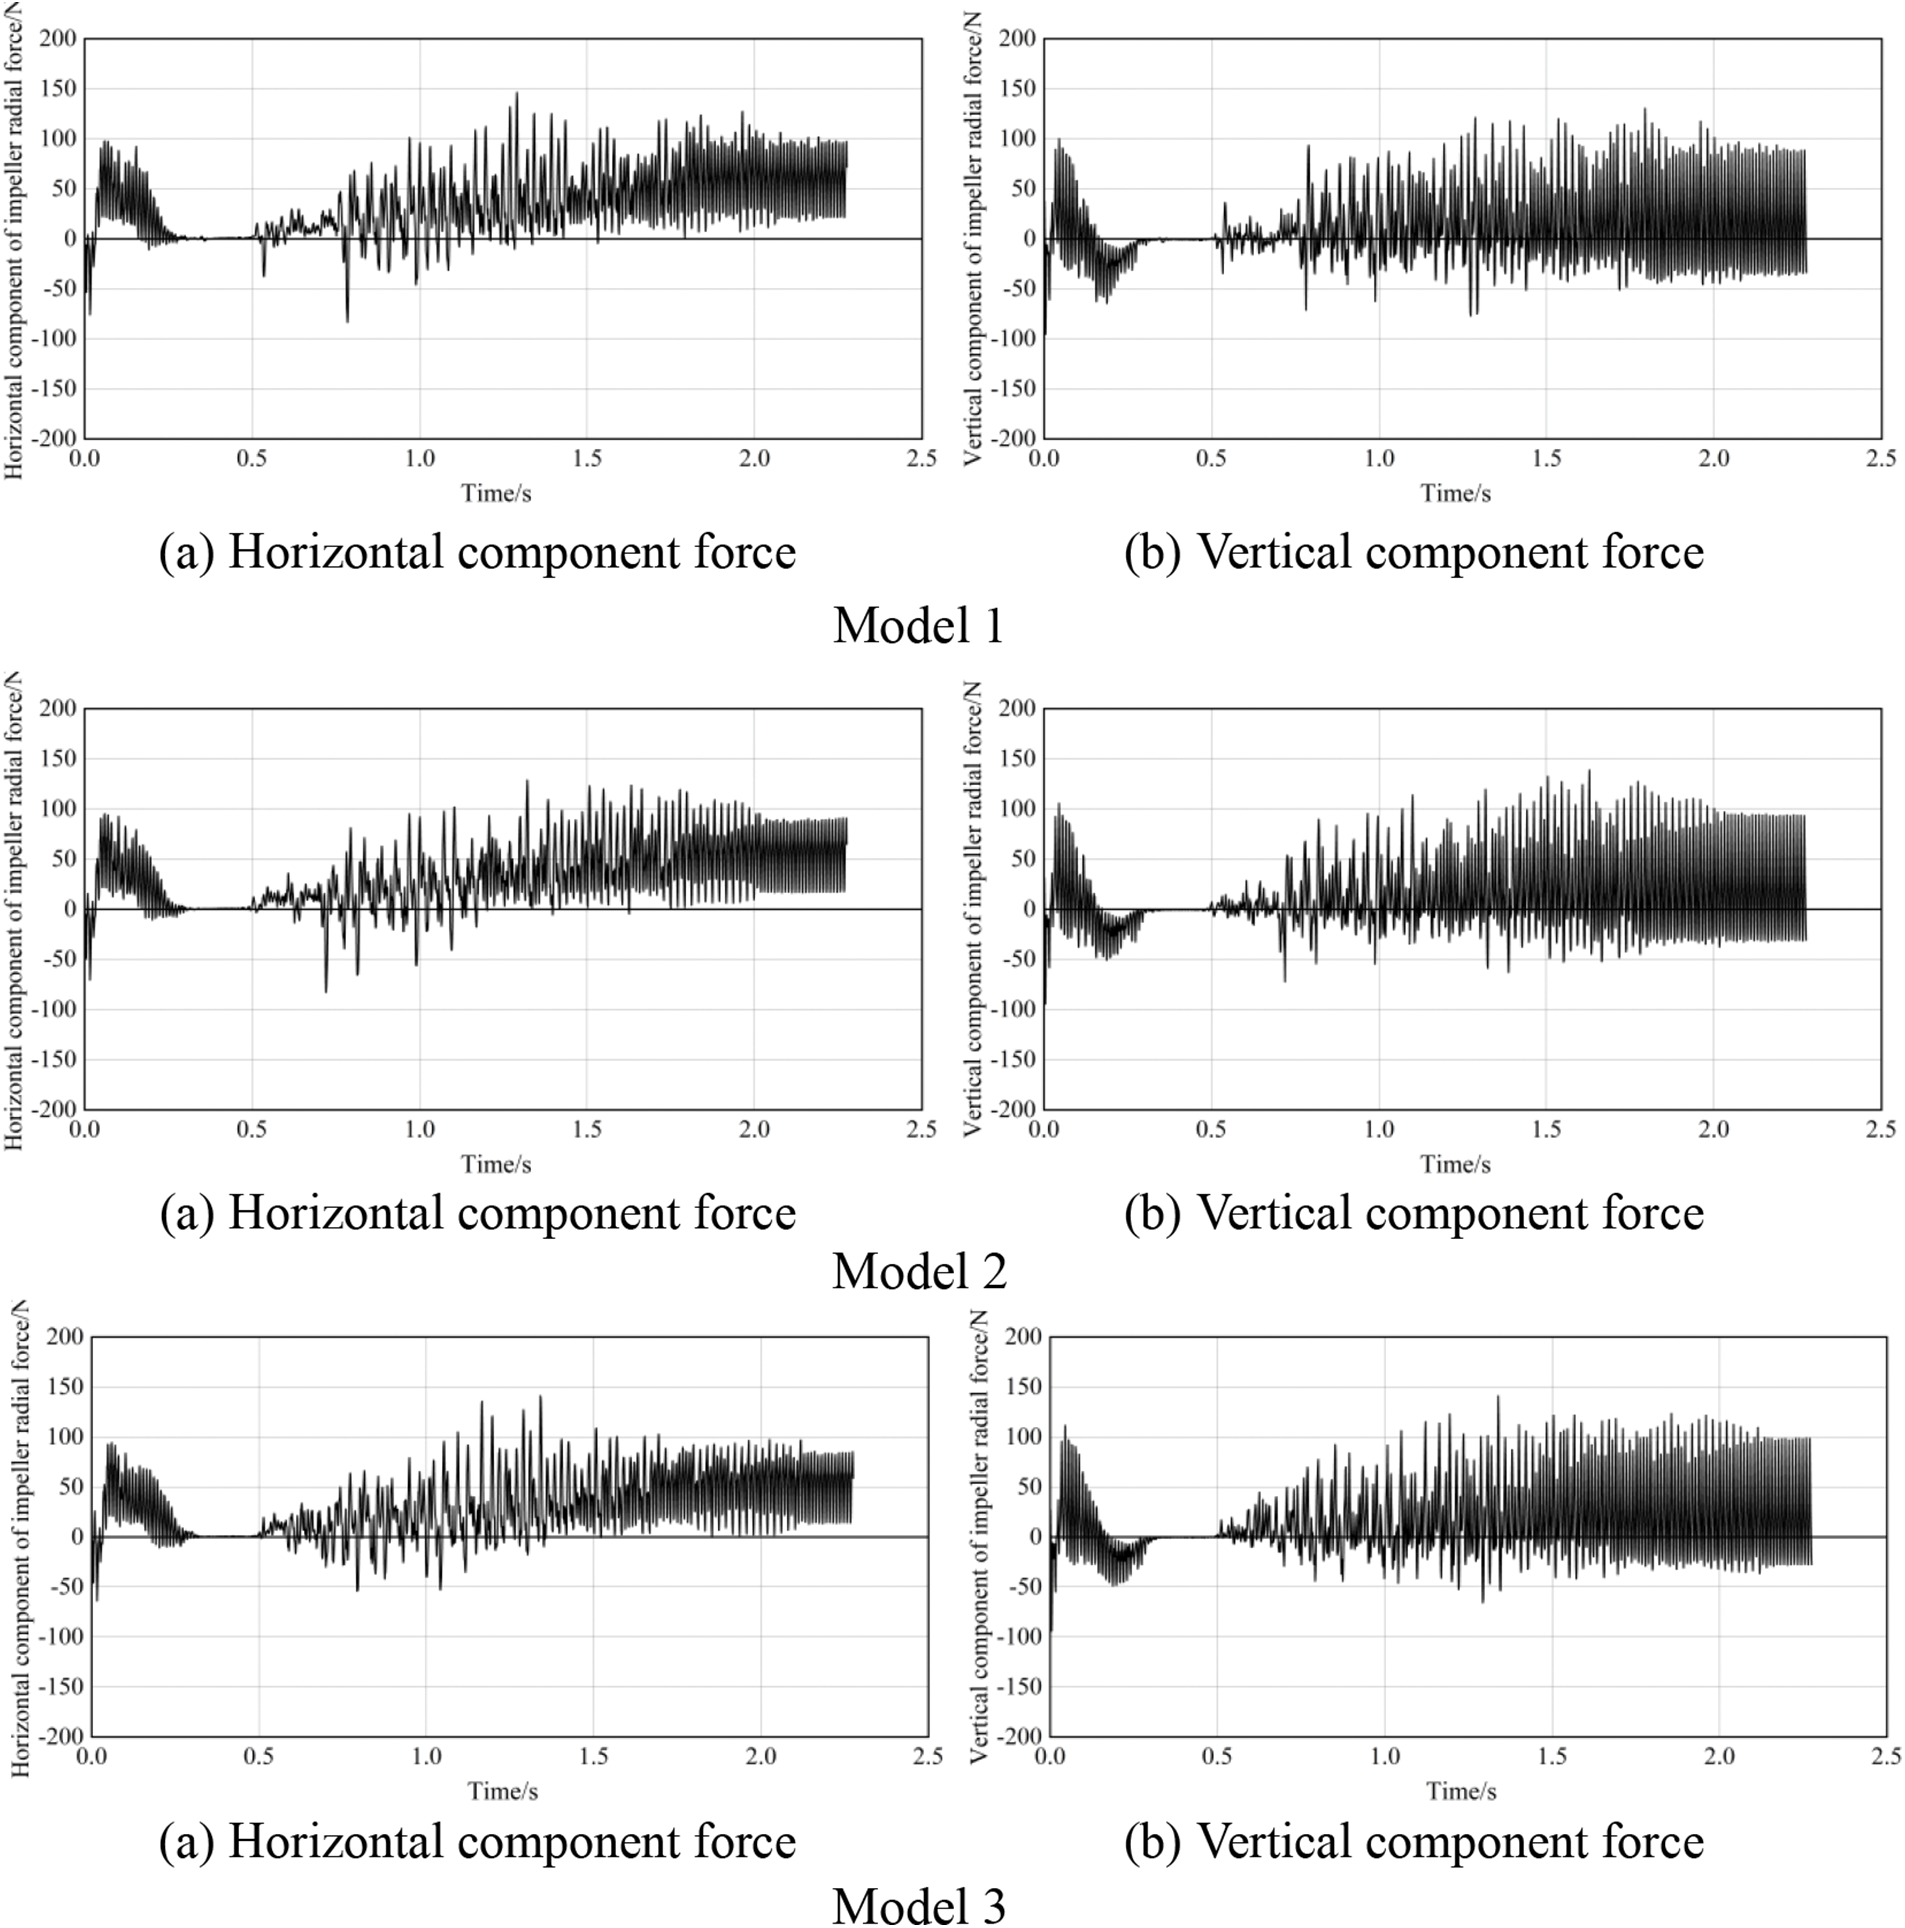
Figure 12: Fluctuation diagram of radial force component of impeller
From the time-domain diagram of the horizontal component of the radial force exerted by the impeller, it is apparent that there is a rapid increase in the horizontal component of radial force at three models following initiation of the self-priming pump, reaching a maximum value of approximately 95 N within 0.1 s. Simultaneously, the maximum deviation in values between the three models remains within 5%. As the gas is drawn into the impeller, its outlet pressure decreases, causing a gradual fluctuation in the horizontal component of the radial force until it reaches zero. The distribution of both gas and liquid inside the impeller, as well as the pressure distribution at its outlet, can affect the radial force exerted by the impeller.
The horizontal component of the radial force on the impeller exhibits irregular fluctuations in the three models around 0.5 s due to various effects, but as the gas inside the impeller gradually diminishes, this component begins to exhibit regular oscillations. By comparing the horizontal components of the radial force in the three models, it can be observed that there are differences in both onset times and amplitudes of stable fluctuations in the horizontal components among these models. Model 1 exhibits stable fluctuations at 2.2 s, while Model 2 and Model 3 exhibit stable fluctuations at 2.0 and 2.1 s, respectively. The time required to stabilize the fluctuation of the horizontal component of the impeller’s radial force in the three models is comparable to that needed for stabilizing the fluctuation of fluid flow rate in the reflux hole. This suggests that fluctuations in reflux fluid flow rate have an impact on gas-liquid distribution within the impeller and volute, which subsequently affects pressure distribution and ultimately leads to variations in the horizontal component. The change in pressure simultaneously affects the reflux velocity of the reflux hole. While the horizontal component of the radial force generated by the impeller fluctuates steadily in all three models, there are differences in both amplitude and mean value. Model 1 has the highest average value, with a 7% increase compared to Model 2 and a 15% increase compared to Model 3. This is because there is a greater influx of reflux fluid into the front pump chamber of the impeller in Model 1.
The trend of the radial force variation is similar in both vertical and horizontal directions, but the horizontal force gradually fluctuates and decreases to zero as gas accumulates inside. The vertical force first reverses and then decreases to zero. The reason is that, during the initial stages of self-priming, the low-velocity fluid flowing back from the reflux hole mixes with the high-velocity fluid flowing out of the impeller. This mixing causes an increase in fluid pressure below the impeller and subjects it to a vertical upward radial force. As the gas fraction inside the impeller increases, the radial force on the impeller approaches that experienced under low-flow conditions. As a result, an increase in pressure above the impeller leads to a reversal in its vertical component of the radial force. This vertical component gradually decreases to 0 as the gas completely fills both the impeller and the boundary region between it and the volute. Unlike the horizontal component, the orientation of the vertical component of the impeller is influenced by dynamic and static interference between the impeller and volute, resulting in variability. Comparing the vertical component of the radial force among the three models, it is observed that there are no significant differences in the vertical component of radial force during the early and middle stages of the self-priming process. Furthermore, the time at which it enters the stable stage is consistent with that of the horizontal component, and in this stable stage, fluctuations in amplitude for the vertical component do not exceed 5%. However, the average vertical component in Model 3 exhibited a 15% increase compared to Model 2 and a 35% increase compared to Model 1, indicating that it was subjected to a greater upward force. The arrangement of the reflux holes in Model 3 facilitates the direct flow of low-velocity fluid into the volute, where it collides with the high-velocity fluid exiting from the impeller. This leads to an increase in pressure at the lower part of the impeller, resulting in an upward radial force on it.
Fig. 13 shows the radial force distribution of the impeller for Model 1, Model 2 and Model 3.
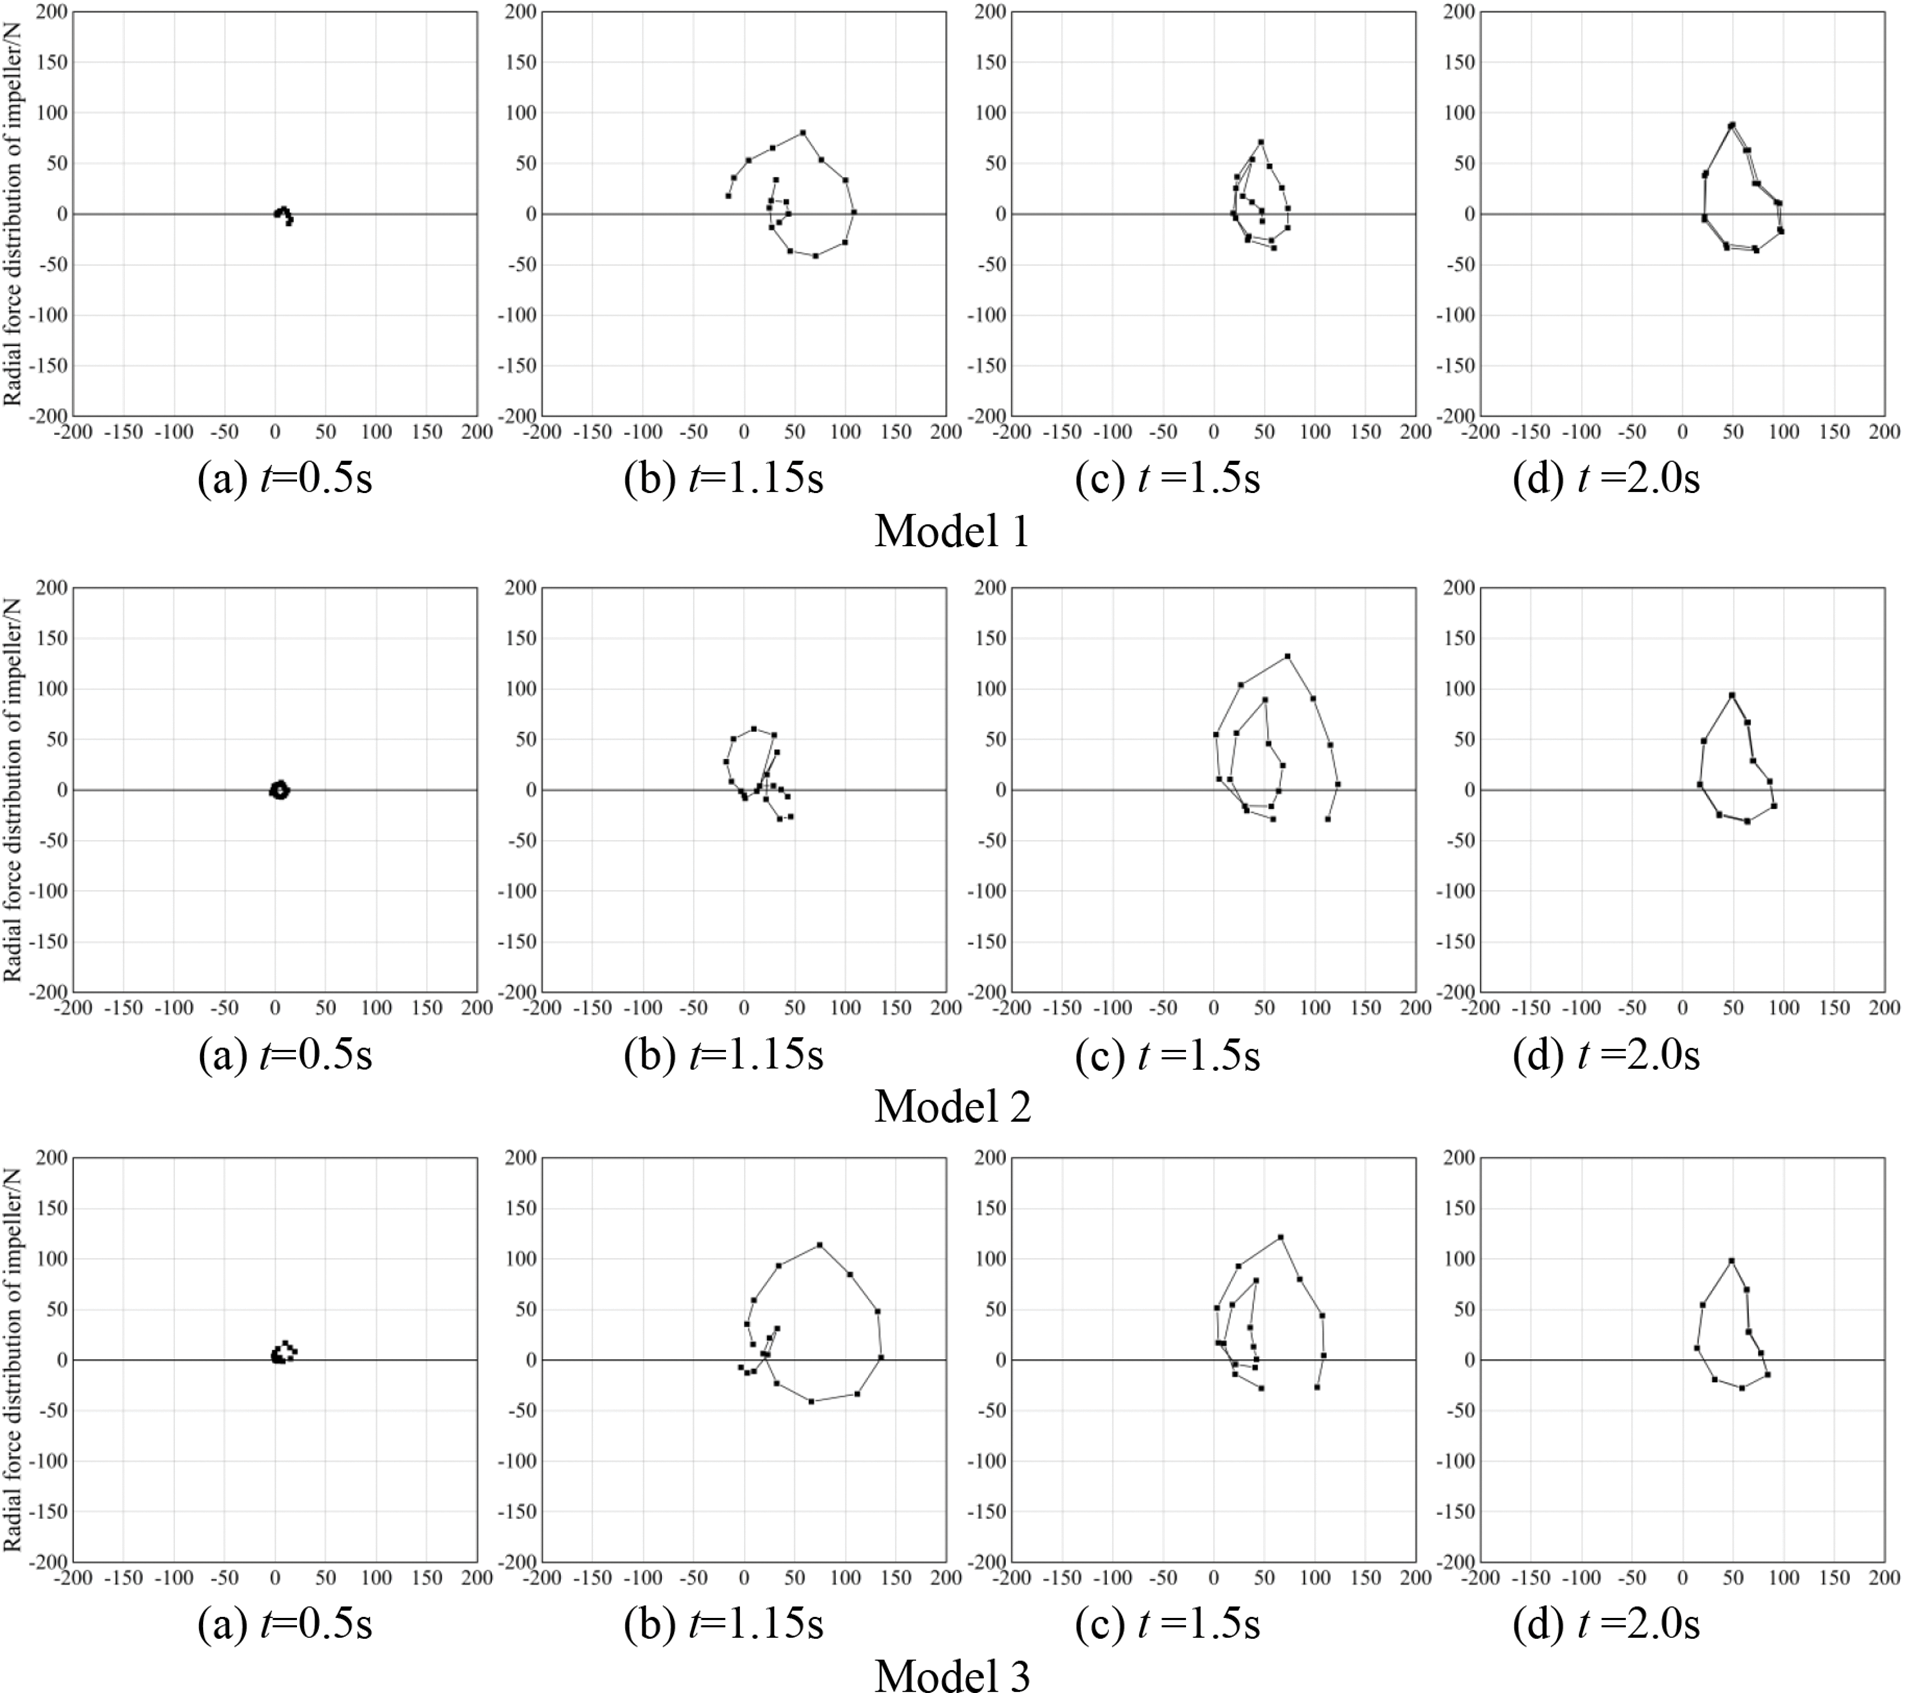
Figure 13: Impeller radial force distribution diagram
At 0.5 s, the gas essentially occupies the impeller in all three models. As the impeller interacts with the gas, its ability to absorb energy decreases, resulting in reduced reaction and combined radial forces on the impeller. Therefore, at this specific moment, all three models demonstrate distributed radial forces around their respective axes.
At 1.15 s, the gas mass fraction inside the impeller is approximately 23% for all three models. However, as the liquid gradually enters the impeller, varying magnitudes of radial forces are observed within each model’s respective impeller. It can be noted that the radial force distribution of each impeller exhibits a relatively disordered state. Model 2 displays the smallest range of radial force distribution, while Model 3 exhibits the largest.
At 1.50 s, the gas content within the impeller continues to decrease. During this period, Model 1 demonstrates a gas mass fraction of 15%, whereas Models 2 and 3 display values of approximately 10% and 12%, respectively. Although possessing the least amount of gas in the impeller, Model 2 presents a broader radial force distribution as a result of its significantly asymmetrical gas dispersion when compared with Model 3.
At 2.0 s, the gas within the impeller is essentially fully expelled, and the combined radial forces of the models tend to stabilize. The distribution pattern of the radial force is similar across all models. However, throughout the self-priming process, Model 1 exhibits a lower resulting radial force than Model 2 and Model 3, thereby improving its mechanical properties to some extent.
The aforementioned analysis indicates that arranging reflux holes with a smaller radial distance can exert an influence on the variation of radial force and enhance mechanical properties to some extent during the self-priming process.
The RNG k-ε turbulence model and VOF model are used to simulate the impact of reflux holes on the self-priming process of a self-priming pump at three different radial positions. Conclusions can be drawn based on simulation results:
(1) The arrangement of reflux holes at different radial distances influences the manner in which reflux liquid enters the volute and also affects the impact of impeller rotation on the reflux liquid, thereby influencing the self-priming performance of the pump.
(2) The smaller radial distance reduces the effective channel for reflux liquid to directly enter the volute, causing some of the liquid to enter the front pump chamber and gain rotational speed due to the rotation effect of the impeller’s front cover plate. This allows it to flow into other positions on the front cover plate, making it easier for reflux liquid to enter the volute and resulting in a more stable flow structure. A larger radial distance will cause more severe impact areas for the reflux liquid in the corresponding volute area and may also create some downstream disturbances. During self-priming, the impeller serves as the main gas gathering area, and a smaller radial distance can reduce the duration of high gas mass fraction in the impeller.
(3) The areas experiencing significant average pressure fluctuations on the monitoring surface are primarily concentrated at the volute inlet, separation chamber inlet, pump outlet, and reflux hole outlet. The average pressure fluctuation exhibits an initial increase followed by a decrease before eventually stabilizing gradually over time. Pressure pulsation is predominantly attributed to both dynamic and static interferences among blades, with its highest amplitude observed at the blade passing frequency.
(4) The changes in the radial force components of the impeller are primarily linked to gas phase transformation. During the entire self-priming process, Model 1 produces a lower radial force than Models 2 and 3. Placing reflux holes at a smaller radial distance can enhance the mechanical performance of the self-priming process to some extent.
(5) It is found in this study that arranging reflux holes at a small radial distance can improve the self-priming performance of a pump to some extent. However, due to the complex flow structure of gas and liquid phases during the self-priming process, there is insufficient depth of analysis and lack of visual experimental research on it. Therefore, more in-depth research will be conducted on the self-priming process from these aspects.
Acknowledgement: The authors acknowledge the support of the National Natural Science Foundation of China for this project.
Funding Statement: The study is supported by the National Natural Science Foundation of China (Research Project No. 52169018).
Author Contributions: The authors confirm contribution to the paper as follows: study conception and design: D. W. Wang, L. J. Cao; experimental guidance: W. D. Wang; analysis and interpretation of results: D. W. Wang, L. J. Cao, J. J. Hu; draft manuscript preparation: D. W. Wang. All authors reviewed the results and approved the final version of the manuscript.
Availability of Data and Materials: Data are available on request.
Conflicts of Interest: The authors declare that they have no conflicts of interest to report regarding the present study.
References
1. Wang, C., He, X., Zhang, D., Hu, B., Shi, W. (2019). Numerical and experimental study of the self-priming process of a multistage self-priming centrifugal pump. International Journal of Energy Research, 43(9), 4074–4092. [Google Scholar]
2. Kanute, J. (2004). Self-priming centrifugal pumps: A primer. World Pumps, 2004(456), 30–32. [Google Scholar]
3. Chang, H., Hong, S., Yu, D., Peng, G., Du, J. et al. (2022). Flow characteristic analysis of the self-priming pump based on the population balance model. Frontiers in Energy Research, 10, 880338. https://doi.org/10.3389/fenrg.2022.880338 [Google Scholar] [CrossRef]
4. Wu, D., Ren, Y., Sørensen, H., Qian, H., Mou, J. (2023). Gas-liquid flow patterns visualization in a self-priming centrifugal pump. Flow Measurement and Instrumentation, 92, 102389. https://doi.org/10.1016/j.flowmeasinst.2023.102389 [Google Scholar] [CrossRef]
5. Huang, S., Su, X., Guo, J., Yue, L. (2014). Unsteady numerical simulation for gas-liquid two-phase flow in self-priming process of centrifugal pump. Energy Conversionand Management, 85(9), 694–700. [Google Scholar]
6. Zhang, Y., Jiang, J. L., Zhang, L. Y., Wei, Q. (2015). Single stage horizontal self-priming pump system assembly and kinematics simulation. 2015 Seventh International Conference on Advanced Communication and Networking (ACN), pp. 36–39. Kota Kinabalu, Malaysia. [Google Scholar]
7. Mou, J., Zhang, F., Wang, H., Wu, D. (2019). Influence of the area of the reflux hole on the performance of a self-priming pump. Fluid Dynamics & Materials Processing, 15(3), 187–205. https://doi.org/10.32604/fdmp.2019.04657 [Google Scholar] [CrossRef]
8. Zhou, P., Wu, Z., Mou, J., Wu, D., Zheng, S. et al. (2019). Effect of reflux hole on the transient flow characteristics of the self-priming sewage centrifugal pump. Journal of Applied Fluid Mechanics, 12(3), 689–699. [Google Scholar]
9. Qian, H., Wu, D., Xiang, C., Jiang, J., Zhu, Z. et al. (2022). A visualized experimental study on the influence of reflux hole on the double blades self-priming pump performance. Energies, 15(13), 4617. [Google Scholar]
10. Lu, Z., He, X., Wang, C. (2018). Influencing factors of self-priming time of multistage self-priming centrifugal pump. DYNA–Ingeniería e Industria, 93(6), 630–635. [Google Scholar]
11. Cheng, X. R., Wang, J. J., Liu, M. J. (2022). Influence of reflux hole position and area on performance of vertical self-priming pump. Journal of Huazhong University of Science and Technology (Natural Science Edition), 50(1), 63–68 (In Chinese). [Google Scholar]
12. Hundshagen, M., Mansour, M., Thévenin, D., Skoda, R. (2021). 3D simulation of gas-laden liquid flows in centrifugal pumps and the assessment of two-fluid CFD methods. Experimental and Computational Multiphase Flow, 3, 186–207. https://doi.org/10.1007/s42757-020-0080-4 [Google Scholar] [CrossRef]
13. Parikh, T., Mansour, M., Thévenin, D. (2020). Investigations on the effect of tip clearance gap and inducer on the transport of air-water two-phase flow by centrifugal pumps. Chemical Engineering Science, 218, 115554. https://doi.org/10.1016/j.ces.2020.115554 [Google Scholar] [CrossRef]
14. Marić, T., Kothe, D. B., Bothe, D. (2020). Unstructured un-split geometrical volume-of-fluid methods–A review. Journal of Computational Physics, 420, 109695. https://doi.org/10.1016/j.jcp.2020.109695 [Google Scholar] [CrossRef]
15. Mulbah, C., Kang, C., Mao, N., Zhang, W., Shaikh, A. R. et al. (2022). A review of VOF methods for simulating bubble dynamics. Progress in Nuclear Energy, 154, 104478. https://doi.org/10.1016/j.pnucene.2022.104478 [Google Scholar] [CrossRef]
16. Mansour, M., Kopparthy, S. B., Thévenin, D. (2023). Improving air-water two-phase flow pumping in centrifugal pumps using novel grooved front shrouds. Chemical Engineering Research and Design, 197, 173–191. https://doi.org/10.1016/j.cherd.2023.07.019 [Google Scholar] [CrossRef]
17. Speziale, C. G., Thangam, S. (1992). Analysis of an RNG based turbulence model for separated flows. International Journal Engineering Science, 30(10), 1379–1388. [Google Scholar]
18. Yakhot, V., Orszag, S. A. (1986). Renormalization group analysis of turbulence. I. Basic theory. Journal of Scientific Computing, 1(1), 3–51. [Google Scholar]
19. Desbrun, M., Gascuel, M. P. (1996). Smoothed particles: A new paradigm for animating highly deformable bodies. Computer Animation and Simulation’96: Proceedings of the Eurographics Workshop in Poitiers, pp. 61–76. Vienna, Springer Vienna. [Google Scholar]
20. Wang, C., Hu, B., Zhu, Y. (2019). Numerical study on the gas-water two-phase flow in the self-priming process of self-priming centrifugal pump. Processes, 7(6), 330. [Google Scholar]
21. Gonza´lez, J., Ferna´ndez, J. N., Blanco, E., Santolaria, C. (2002). Numerical simulation of the dynamic effects due to impeller-volute interaction in a centrifugal pump. Journal of Fluids Engineering, 124(2), 348–355. [Google Scholar]
22. Jin, F. Z., Xi, H., Shou, Q. Y. (2016). Grid-independence in low specific speed centrifugal pump based on PIV. Journal of Drainage and Irrigation Machinery Engineering, 34(7), 567–572 (In Chinese). [Google Scholar]
Cite This Article
 Copyright © 2024 The Author(s). Published by Tech Science Press.
This work is licensed under a Creative Commons Attribution 4.0 International License , which permits unrestricted use, distribution, and reproduction in any medium, provided the original work is properly cited.
 Downloads
 Citation Tools