 Open Access
ARTICLE
Assessment of Carboniferous Volcanic Horizontal Wells after Fracturing Based on Gray Correlation, Hierarchical Analysis and Fuzzy Evaluation
1 No.1 Oil Production Plant of Xinjiang Oilfield, Karamay, 834000, China
2 Hubei Key Laboratory of Oil and Gas Drilling and Production Engineering (Yangtze University), Wuhan, 430100, China
3 School of Petroleum Engineering, Yangtze University, Wuhan, 430100, China
* Corresponding Author: Lijuan Huang. Email:
Fluid Dynamics & Materials Processing 2024, 20(12), 2757-2773. https://doi.org/10.32604/fdmp.2024.056130
Received 15 July 2024; Accepted 12 September 2024; Issue published 23 December 2024
Abstract
A comprehensive method to evaluate the factors affecting the production capacity of horizontal wells in Carboniferous volcanic rocks after fracturing is investigated. A systematic approach combining gray correlation analysis, hierarchical analysis and fuzzy evaluation is proposed. In particular, first the incidence of reservoir properties and fracturing parameters on production capacity is assessed. These parameters include reservoir base geological parameters (porosity, permeability, oil saturation, waterproof height) as well as engineering parameters (fracture half-length, fracture height, fracture conductivity, fracture distance). Afterwards, a two-by-two comparison judgment matrix of sensitive parameters is constructed by means of hierarchical analysis, and the weighting coefficients of the factors are determined, where oil saturation, fracture conductivity and fracture half-length are weighted higher. Finally, the horizontal wells in the target block are categorized in terms of production capacity based on the fuzzy evaluation method, and split accordingly into high-producing, relatively high-producing, medium-producing and low-producing wells. Such a categorization is intended to provide parametric guidance for reservoir fracturing and modification.Keywords
With the relentless advancement of oil and gas exploration and development technologies, Carboniferous volcanic reservoirs have emerged as a pivotal focus in contemporary oil and gas exploration endeavors [1–3]. As a unique type of hydrocarbon reservoir, the intricate geological characteristics and extraction challenges associated with Carboniferous volcanic rocks have garnered significant attention. In such complex geological environments, horizontal well fracturing technology is indispensable for enhancing hydrocarbon production from these reservoirs. Consequently, evaluating the factors influencing their production has become a prominent area of research [4,5]. However, post-fracturing production capacity is influenced by an array of interrelated factors that form a complex system [6–8].
In recent years, significant attention has been directed towards researching the factors affecting the productivity of horizontal wells post-fracturing. Various methods, including gray correlation analysis, hierarchical analysis, and fuzzy evaluation, have been extensively employed to evaluate these influencing factors. As demonstrated by Lian et al. [9] and Kazeem et al. [10], gray correlation analysis is particularly favored for quantitatively analyzing production capacity factors due to its ability to handle incomplete information and uncertain relationships. This method measures the degree of correlation between factors based on the similarity or dissimilarity in their development trends [11]. It does not require strict sample requirements or a typical distribution pattern, ensuring consistency with both quantitative and qualitative phenomenon analyses. Consequently, Xue et al. [12–14] all highlighted in their research that it is an ideal analytical approach for assessing interrelated influencing factors by ranking their degrees of influence. For instance, Long et al. have successfully identified key parameters affecting shale gas reservoir compressibility through gray correlation analysis, providing valuable insights for optimizing fracturing design. By employing gray correlation analysis [15], Liu et al. evaluated the rankings of each parameter’s impact on initial production rates, stable production during stabilization periods, and cumulative gas production over time [16]. The results revealed that fracturing parameters predominantly influence initial production rates, while reservoir conditions exert a greater influence on long-term production capacity.
The hierarchical analysis method, developed by Schaty in 1970, transforms qualitative problems into quantitative ones. It is widely used to decompose complex problems into multiple levels and determine the weights of each factor through pairwise comparisons, enabling a comprehensive evaluation of factors that influence production capacity [17–19]. Mohammadbeigi et al. [20–22] utilized the hierarchical analysis method to build a multi-level evaluation system. This approach allows for the construction of indicators to comprehensively assess post-fracturing production capacity. Li et al. systematically analyzed the capacity-influencing factors of multi-stage fractured horizontal wells for shale gas and comprehensively analyzed the screened eight categories of capacity-influencing factors using the radar area model and fuzzy hierarchical analysis. They determined the weights of the capacity-influencing factors in different partitions by fuzzy hierarchical analysis and established a comprehensive evaluation model of capacity applicable to shale gas wells [23]. Zhang et al. used the hierarchical analysis method to construct an equivalence matrix to determine the weights of each factor and comprehensively evaluate the compressibility of volumetric fracturing in tight sandstone reservoirs [24]. Compared with the traditional evaluation method, the hierarchical analysis method is more conducive to guiding the selection of wells and formations and integrating geo-engineering double sweet spot factors, which is of reference value for the optimized design and construction of fracturing in dense sandstone reservoirs.
As a mathematical tool to deal with uncertainty and fuzziness, the fuzzy evaluation method shows good effectiveness in dealing with factors affecting productivity. Through fuzzy evaluation, the quantification of fracturing effect is realized, providing a reference for subsequent fracturing optimization. The extensive application of the fuzzy evaluation method in horizontal well fracturing assessment enables a comprehensive consideration of multiple influencing factors and facilitates a more thorough and objective evaluation of the fracturing effect. By constructing a complex fuzzy evaluation model, Jiang et al. can accurately evaluate the impact of fracturing construction, thus providing a scientific basis for optimizing fracturing design [25]. With the aim of balancing issues in the context of sustainability and circularity policies, Fetanat et al. considered the applicability of image fuzzy sets to criteria, including environmental, economic, technical, social, and circular aspects [26].
Although gray correlation, hierarchical analysis, and fuzzy evaluation methods have been widely used in petroleum engineering, they still face certain challenges [27,28]. For example, weights for each influencing factor can be determined more accurately, and the depth and detail of fracturing effects can be evaluated by considering various factors, including geology, engineering, and economics, within an intricate fuzzy evaluation model. Addressing these issues will contribute to further enhancing the application of the fuzzy evaluation method in horizontal well fracturing assessment. Given the deepening and escalating complexity of oil and gas field development, researchers are diligently striving to further enhance the fuzzy evaluation method. Their aim is to adapt it to the ever-evolving requirements of oil and gas field development by incorporating additional influencing factors, refining the evaluation model, and optimizing computational efficiency.
This paper proposes a systematic approach that combines gray correlation analysis, hierarchical analysis, and fuzzy evaluation. The assessment methodology takes into account various factors that influence the production capacity of each well, such as pore penetration saturation, waterproof height, and fracture parameters, by establishing a comparative sequence. By utilizing cumulative oil production as a reference series, correlation coefficients and degrees are calculated between elements corresponding to each comparative sequence and the reference sequence using the gray correlation method. This analysis aims to identify the primary controlling factors influencing the effectiveness of fracturing operations. Furthermore, employing hierarchical analysis and fuzzy evaluation methods, this system determines weights and evaluates well-development effects by quantitatively assessing the contribution of influencing factors towards enhancing fracturing effectiveness. Ultimately, these findings can provide guidance for parameter adjustment and optimization during actual construction processes.
2 General Geology and Reservoir Characteristic
The target block is a fault-controlled Carboniferous reservoir divided into three distinct areas: north, center, and south. From north to south, the pressure coefficient gradually increases, and the bottom water becomes increasingly evolved, with the southern area experiencing the most evolved bottom water. The northern part of the reservoir is a thick-layered formation composed of tuffaceous sandstone and tuff, with low bottom water energy and a pressure coefficient of 0.99. The central part is also a thick-layered formation, consisting of volcanic breccia and tuff, with more evolved bottom water and a pressure coefficient of 1.02. The southern part of the reservoir is composed of basalt and volcanic breccia, featuring evolved bottom water, more sufficient energy, and a pressure coefficient of 1.08. As production time prolongs, each area exhibits varying degrees of water content rise, with some wells having notably high water content.
3 Gray Correlation Method to Determine the Degree of Correlation of Factors Affecting Horizontal Well Productivity
Gray correlation analysis is particularly adept at handling incomplete information and uncertain relationships due to several compelling reasons:
(1) Incomplete Data Handling: In real-world applications, data is frequently incomplete owing to various factors such as measurement errors, missing samples, or equipment failures. Gray correlation analysis does not rely on stringent sample requirements or typical distribution patterns, enabling it to operate effectively even with incomplete datasets.
(2) Quantitative and Qualitative Analysis: This method exhibits versatility by handling both quantitative and qualitative data, making it applicable in various scenarios. It measures the degree of correlation between factors based on their similarity or dissimilarity in development trends, rather than relying solely on strict numerical comparisons.
(3) Robustness to Uncertainty: Uncertainty in relationships between factors is inherent in complex systems. Gray correlation analysis inherently accounts for this uncertainty by calculating correlation degrees based on overall trends rather than exact values, rendering it more resilient to outliers.
Initially, the gray correlation theory is employed to illustrate the degree of influence between each factor and the production capacity, objectively reflecting the influencing factors of horizontal well production capacity after fracturing. Subsequently, the weights of each influencing factor are determined through the hierarchical analysis method. Finally, based on the fuzzy evaluation method outlined in the flowchart presented in Fig. 1, the drainage and exploitation effect of each well is assessed.
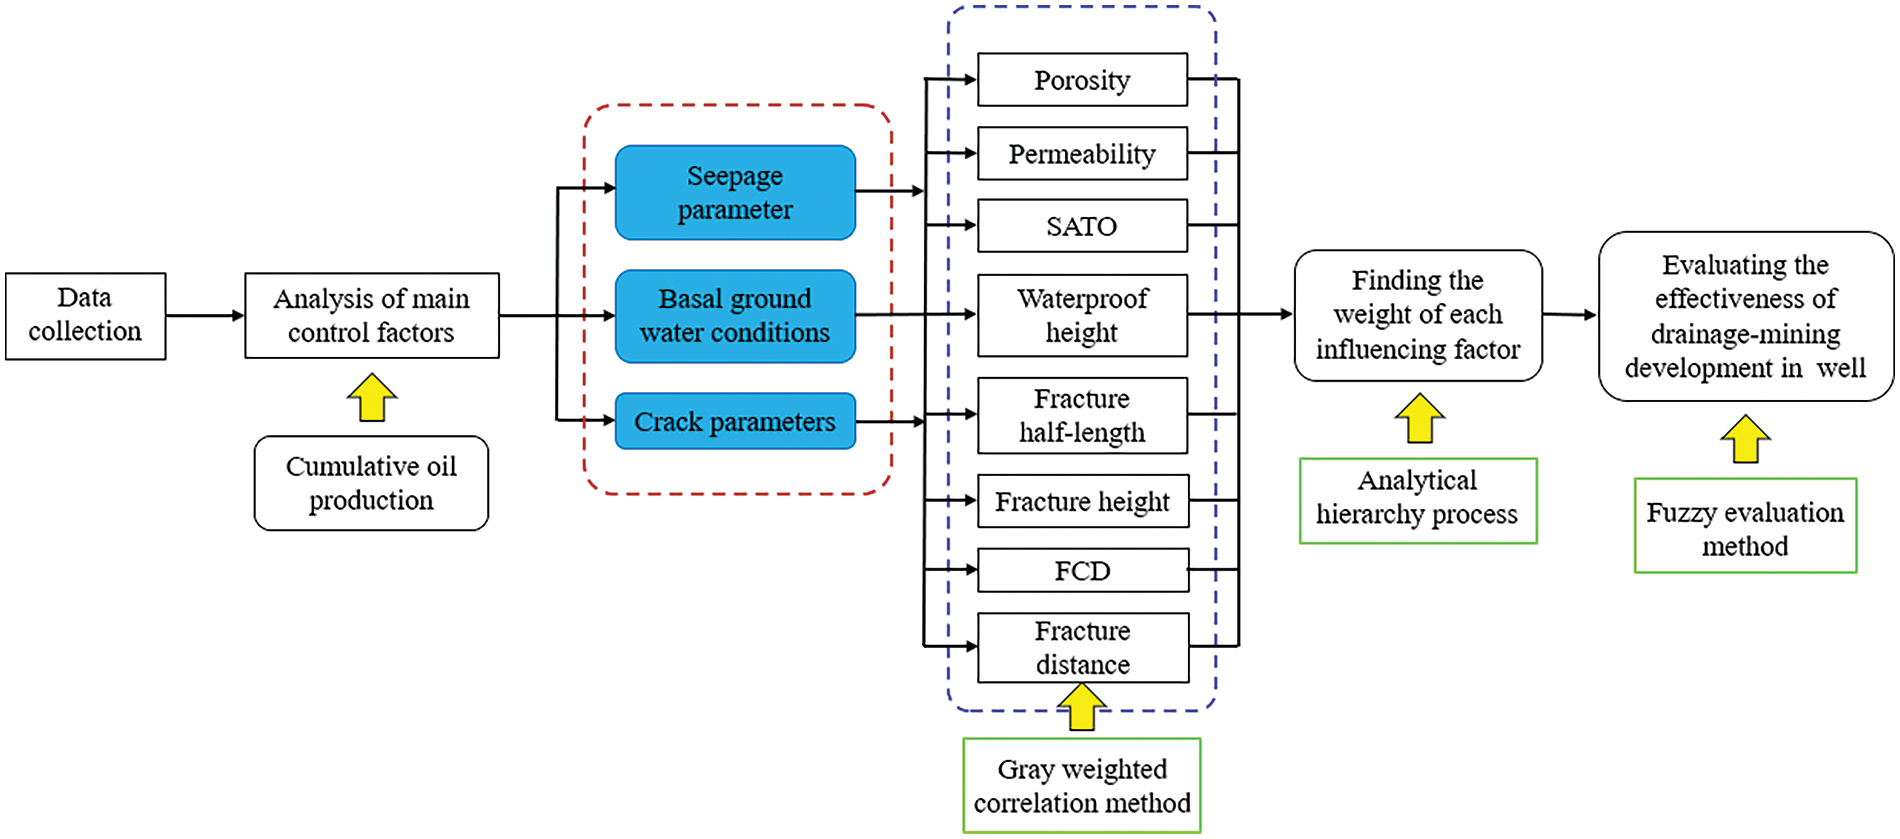
Figure 1: Flow-chart for evaluation of drainage fluid extraction and development
The fracturing stage spacing is defined as the horizontal section length divided by the number of stages, taking into account the varying lengths of each horizontal well. Statistical calculations were conducted on eight key parameters: permeability, porosity, oil saturation (SATO), waterproof height, fracture height, fracture half-length, fracture conductivity (FCD), and fracture distance, for 50 horizontal wells within the target block. The results of these calculations are presented in Fig. 2. In accordance with the gray correlation theory, these eight influencing factors were considered as a comparison sequence (subsequence) Xi, while the cumulative oil production after 1000 days from the start of production was taken as the reference series (parent sequence) X0.
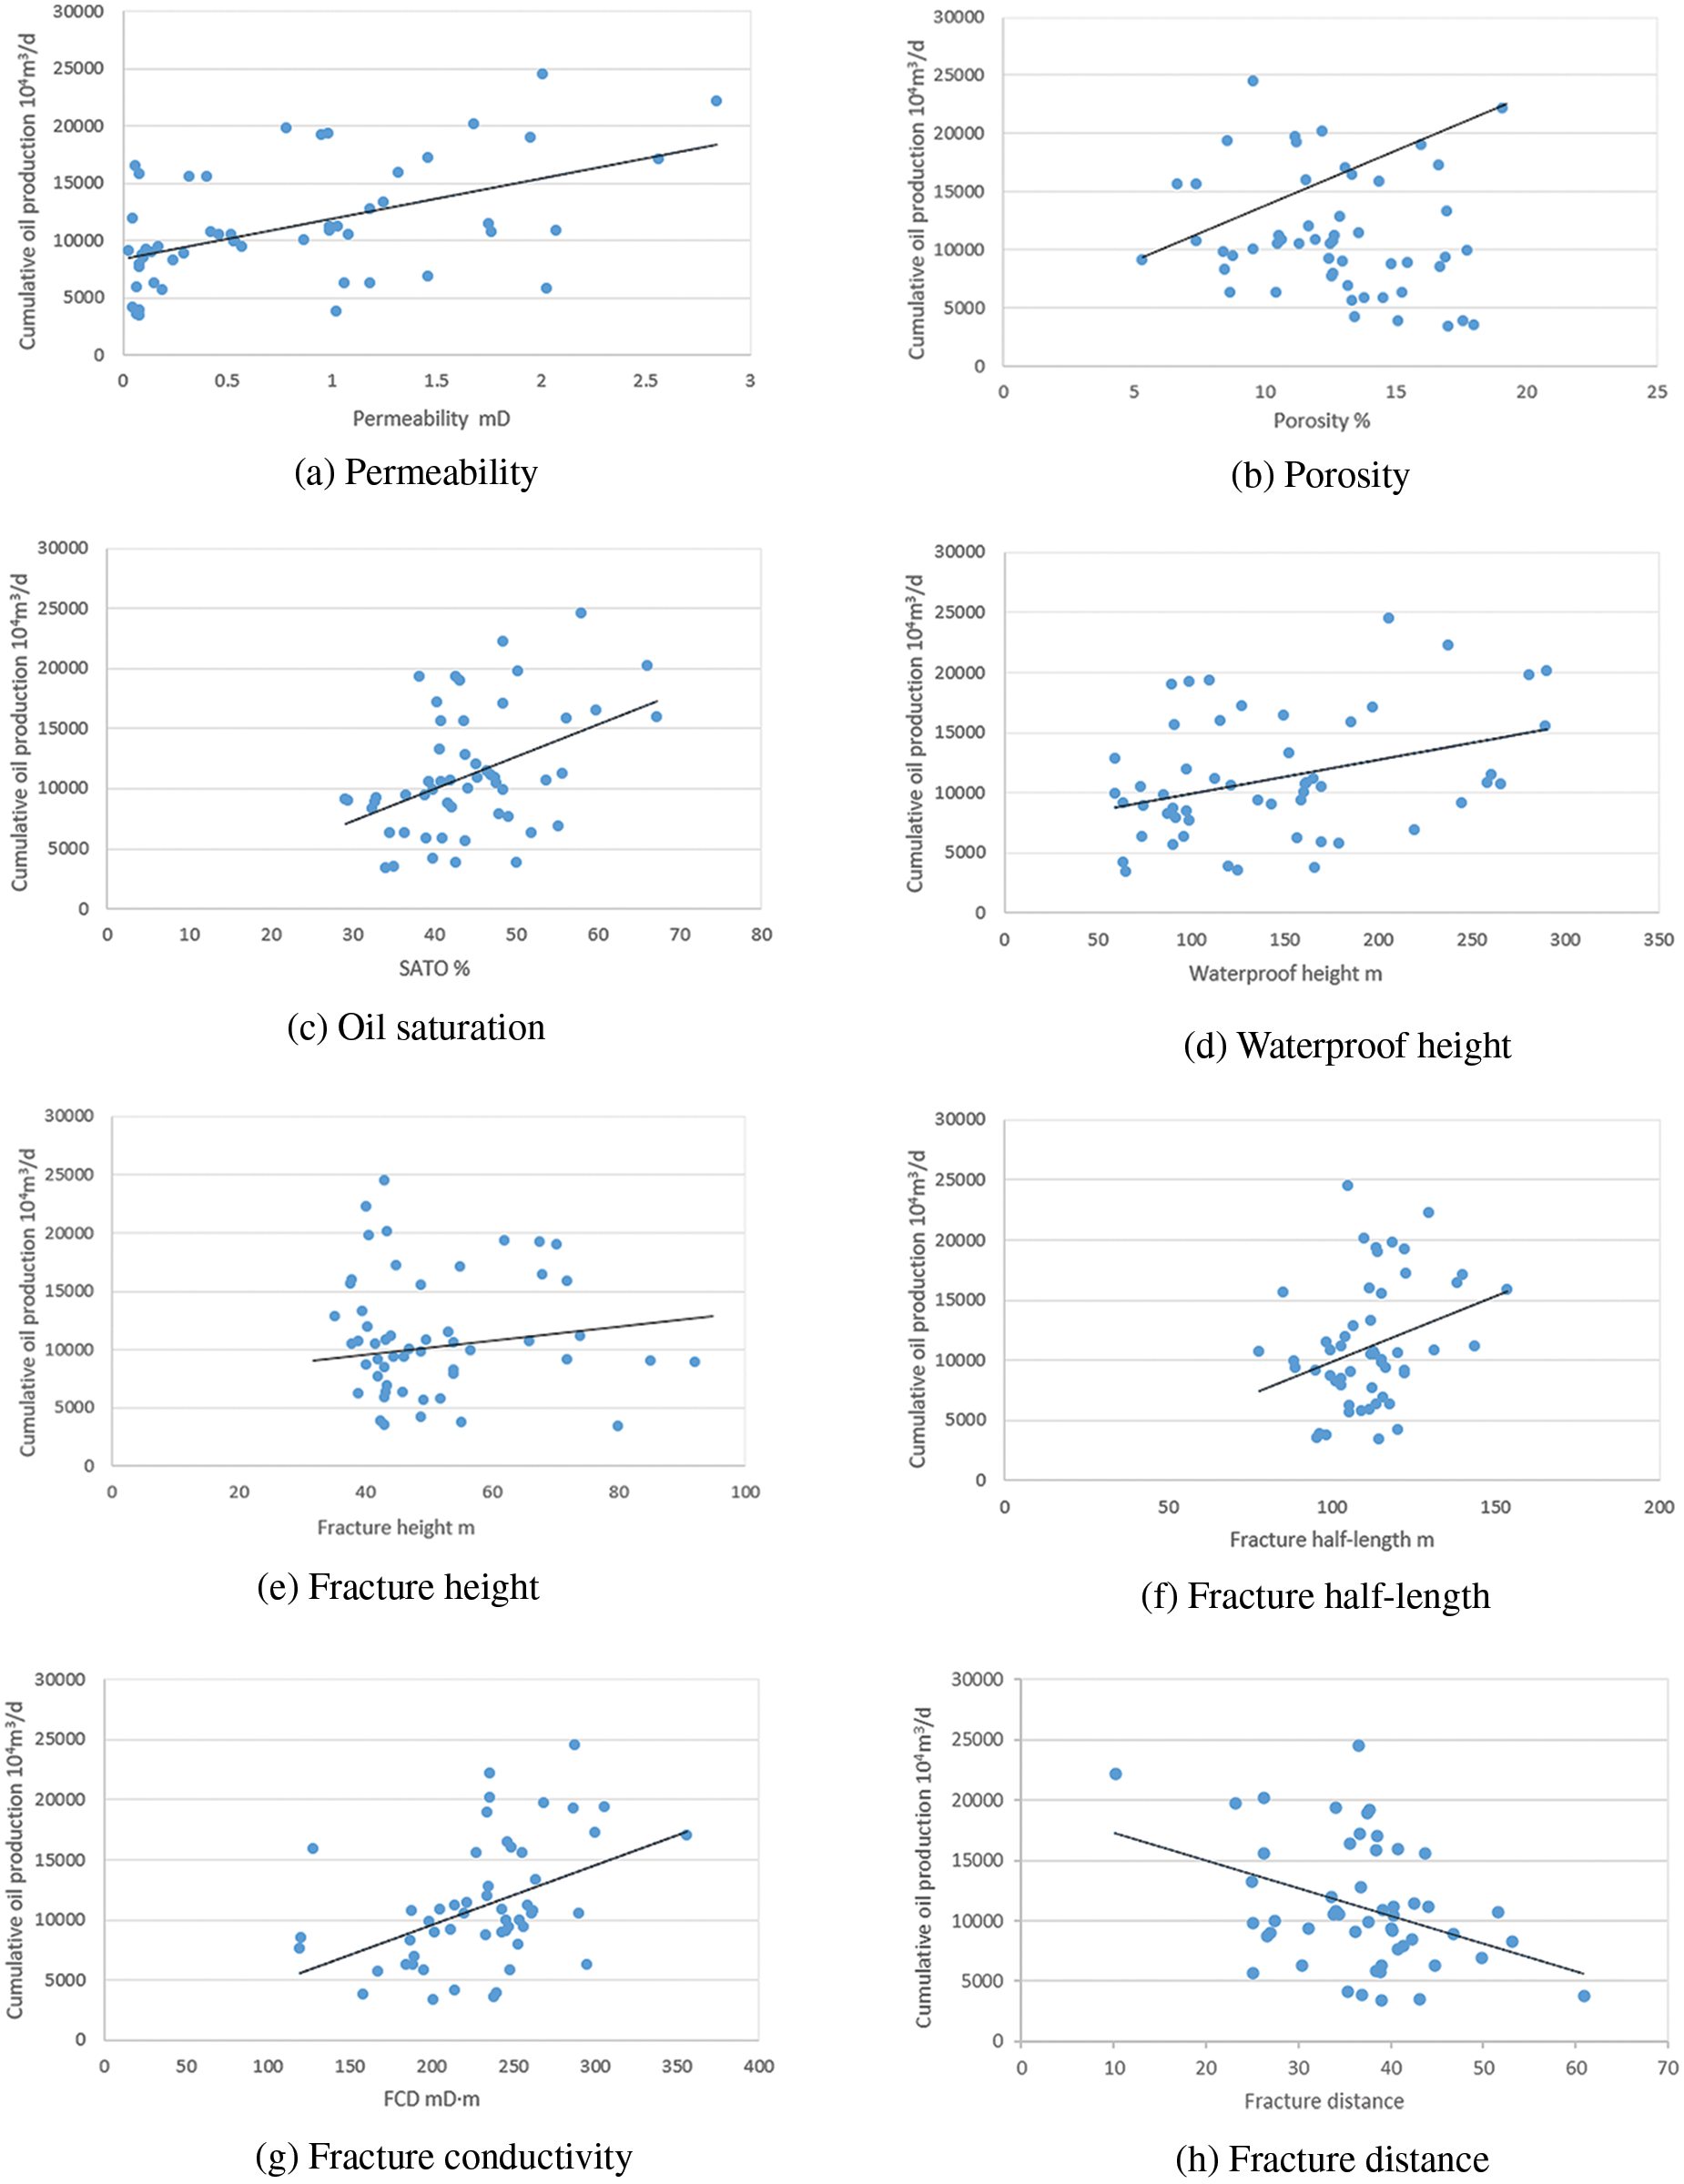
Figure 2: Relationship between oil production of horizontal wells in target blocks and influencing factors
Since the analyzed parameters have different dimensions and orders of magnitude, it is necessary to process the raw data to eliminate these differences and make the data more comparable. The normalization method was used to process the evaluation data, eliminating the influence of magnitude:
where X is the initial value of each factor, Xmin is the minimum value of each factor in all wells, Xmax is the maximum value of each factor in all wells, and Xi is the normalized value of each factor.
3.2 Calculation of Correlation Coefficients
Calculate the correlation coefficient according to Formula (2):
where
The correlation was calculated and normalized according to Formula (3), and the results are shown in Table 1. Therefore, oil saturation, fracture conductivity, and fracture half-length are the three factors with the highest correlation with production.
where

4 Hierarchical Analysis to Determine the Weights of Factors Affecting Horizontal Well Capacity
Advantages of applying hierarchical analysis in determining factor weights:
(1) Decomposing complexity: The hierarchical analysis method (AHP) allows for the decomposition of complex problems into multiple levels, enhancing their manageability. This approach simplifies the analysis by breaking down the problem into smaller, more manageable parts.
(2) Pairwise comparisons: Determining weights through pairwise comparisons aids in minimizing subjectivity. Rather than assigning weights arbitrarily, decision-makers compare factors in pairs, leading to a more structured and objective process.
(3) Consistency check: The consistency test ensures the internal consistency of the judgment matrix, further mitigating subjectivity. If the consistency ratio is excessively high, the judgment matrix must be revised, guaranteeing that the final weights are grounded in a logically coherent framework.
4.1 Creating a Judgment Matrix
Fig. 3 shows the flowchart for determining factor weights in hierarchical analysis. Each criterion in the criterion layer holds a unique weight in the target measure and has a specific proportion in the decision-maker’s mind. To derive accurate proportions for each criterion, it is necessary to establish a pairwise comparison judgment matrix. This matrix represents relative importance comparisons between all factors within a stratum with respect to a specific factor (criterion or objective). Factors are compared two-by-two at the same level using the 9-point comparison matrix method, rather than comparing all factors together. The scale ranges from 1–9 based on the degree of importance rating, as shown in Table 2. The method’s principle is to minimize difficulty when comparing factors of different nature and improve accuracy. Using correlation degrees calculated from Table 1, we determine two-by-two comparison judgment matrices, which are presented in Table 3.
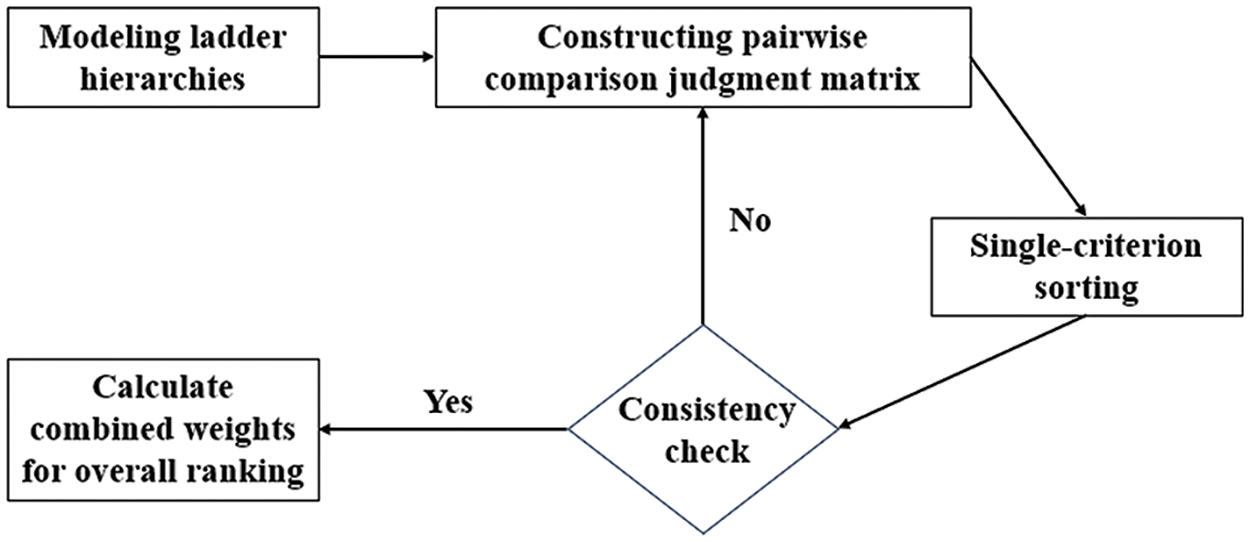
Figure 3: Hierarchical analysis to determine the weights of the factors flowchart


4.2 Checking the Consistency of Judgment Matrices
After obtaining the two-by-two comparison judgment matrix, a consistency test is required. The maximum eigenvalue of the judgment matrix is calculated using the function provided in MATLAB. Then, Formulas (4) and (5) are used to calculate the consistency index and consistency ratio, respectively. If the calculated consistency ratio (C. R.) is less than 0.10, the judgment matrix is considered to have satisfactory consistency. Passing this test indicates that the established judgment matrix meets the requirements. Otherwise, return to the previous step and use the hierarchical analysis method to re-establish the judgment matrix.
where

Referring to Formulas (4) and (5), when n equals 8, we obtain a value of C. I. = 0.0022. According to Table 4, R. I. has a value of 1.41, which yields a calculated C. R. for this judgment matrix as 0.0016 < 0.1, confirming its compliance with consistency requirements.
4.3 Results of Weighting Calculations
Based on the flow chart in Fig. 4, weights are calculated for the judgment matrix that passes the consistency test using arithmetic average, geometric average, and eigenvalue methods [29,30]. The weight calculation results are normalized. The results for the eight factors affecting oil production in 53 horizontal wells in the target block are shown in Table 5. The top three factors are oil saturation, fracture conductivity, and fracture half-length.
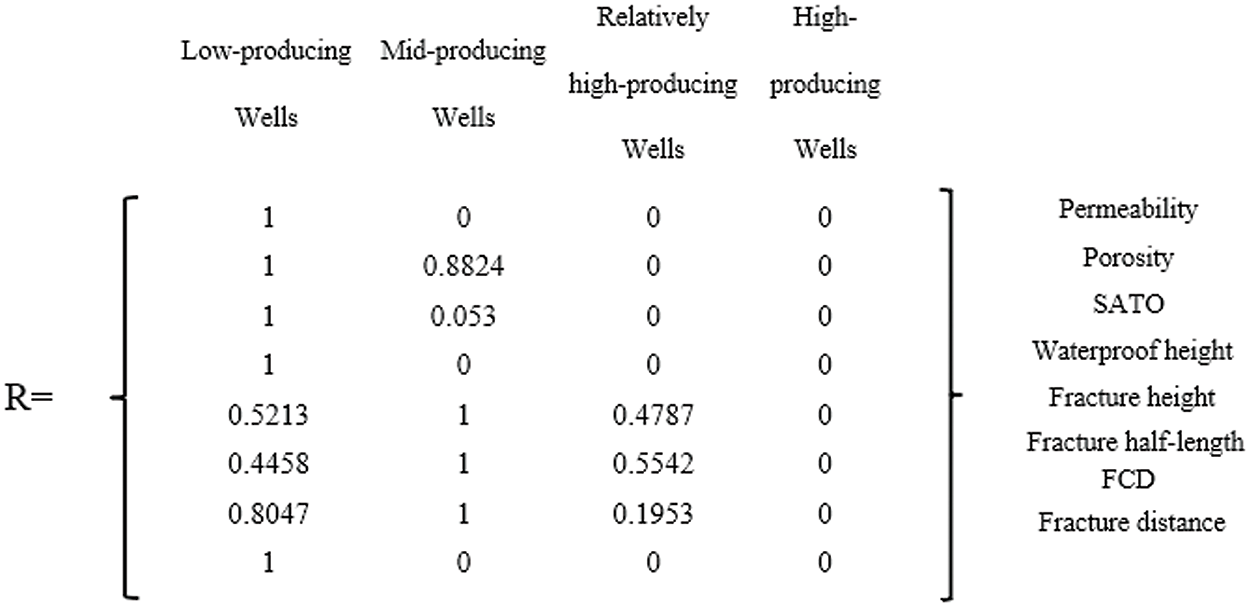
Figure 4: The degree of membership matrix of Well C001

5 Fuzzy Evaluation Method to Determine the Capacity of Horizontal Wells
Specific advantages of fuzzy integrated evaluation methods in dealing with uncertainty and ambiguous information, and practical applications:
(1) Handling Uncertainty and Vagueness: Fuzzy evaluation methods are mathematical tools capable of addressing uncertainty and vagueness inherent in real-world problems. They model the imprecision of data and judgments more realistically than crisp (binary) models.
(2) Quantitative Assessment: Fuzzy evaluation allows for the quantification of fracturing effects, providing a reference for subsequent fracturing optimization. By assigning degrees of membership to different categories, fuzzy logic offers a more nuanced assessment than traditional binary classifications.
(3) Comprehensive Consideration of Factors: By constructing complex fuzzy evaluation models, researchers can consider multiple influencing factors simultaneously, facilitating a more thorough and objective evaluation of fracturing effects. This approach helps identify trade-offs between different factors and provides a solid foundation for decision-making.
(4) Practical Applications: In the context of horizontal well fracturing assessment, fuzzy evaluation can categorize wells based on their production capacity, guiding parameter adjustment and optimization during actual construction processes. The approach is applicable across various stages of the oil and gas exploration and production life cycle.
5.1 Determining Factor Sets and Rubric Sets
As shown in Table 6, multiple risk levels and assignment intervals are obtained according to the fuzzy evaluation method for the final rating. The first step is to determine the set of evaluation factors. The eight influencing factors determined by the gray correlation method are composed into a set of evaluation indexes, U = {permeability, porosity, oil saturation, waterproof height, fracture height, fracture half-length, fracture flow-conducting capacity, and fracturing stage spacing}. According to the production status after multi-stage fracturing and pressing, the rubric set is determined by the cumulative oil production in 1000 days after the start of production, and the rubric set V = {low-producing wells, medium-producing wells, higher-producing wells, and high-producing wells}.

5.2 Determine the Grade of Membership Function
The influencing factors were normalized, and the trapezoidal membership function was employed to determine the membership degree of each influencing factor R. Four wells were chosen as representatives: C001, a low-producing well; C016, a medium-producing well; C4719, a relatively high-producing well; and C4763, a high-producing well. The membership degree matrices for these wells are presented in Figs. 4–7, respectively.
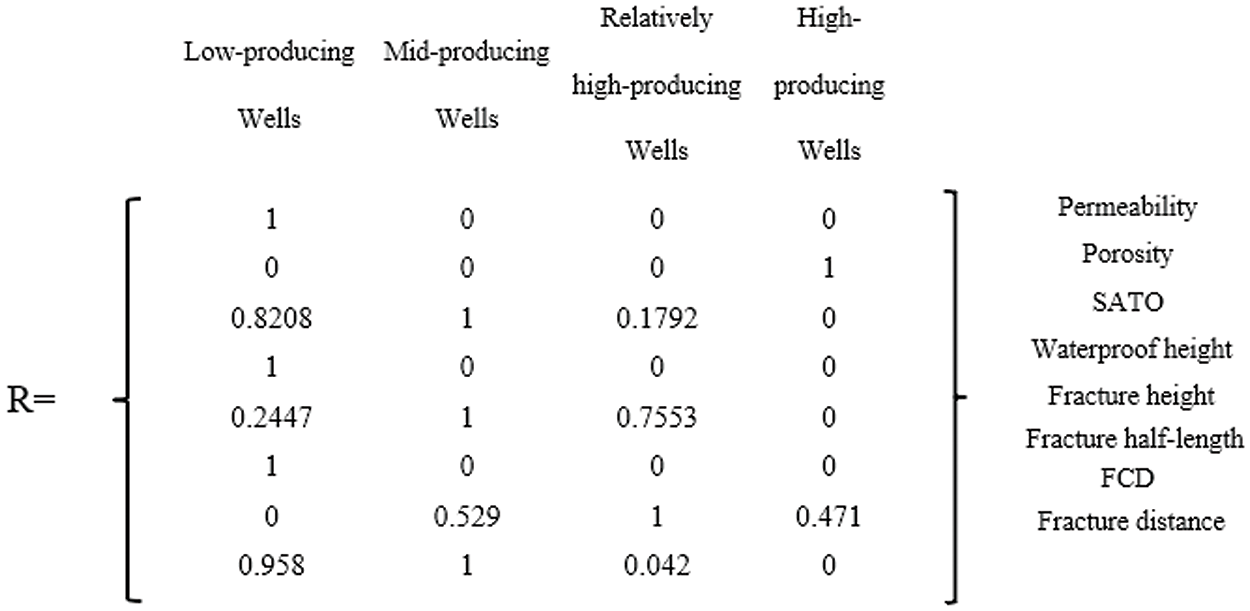
Figure 5: The degree of membership matrix of Well C016
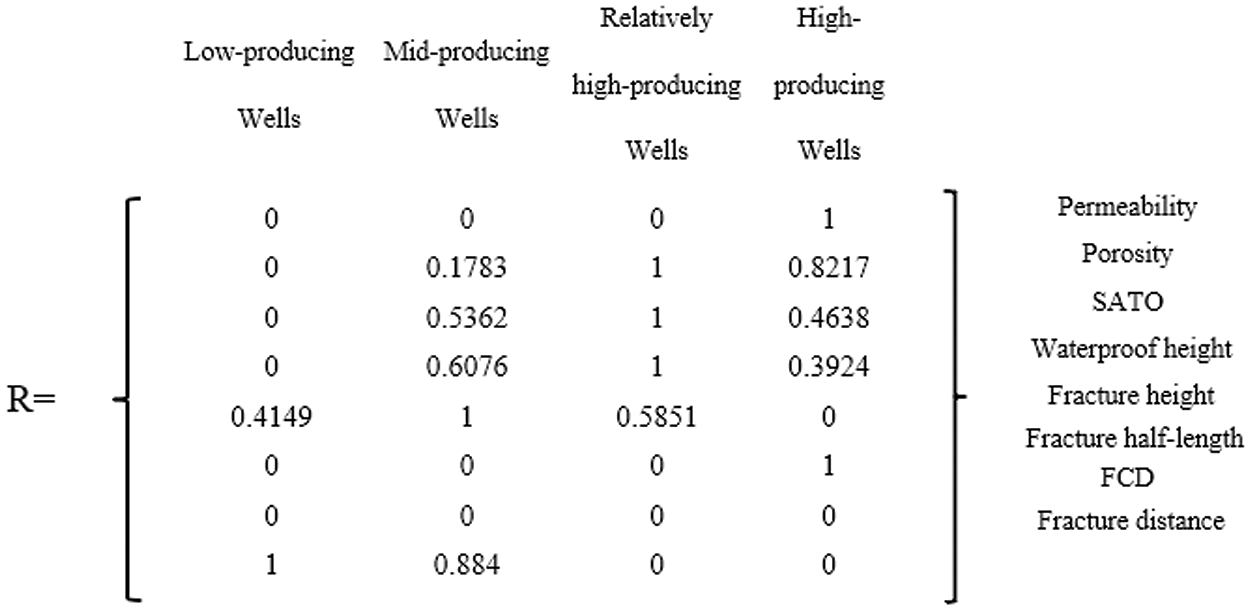
Figure 6: The degree of membership matrix of Well C4719
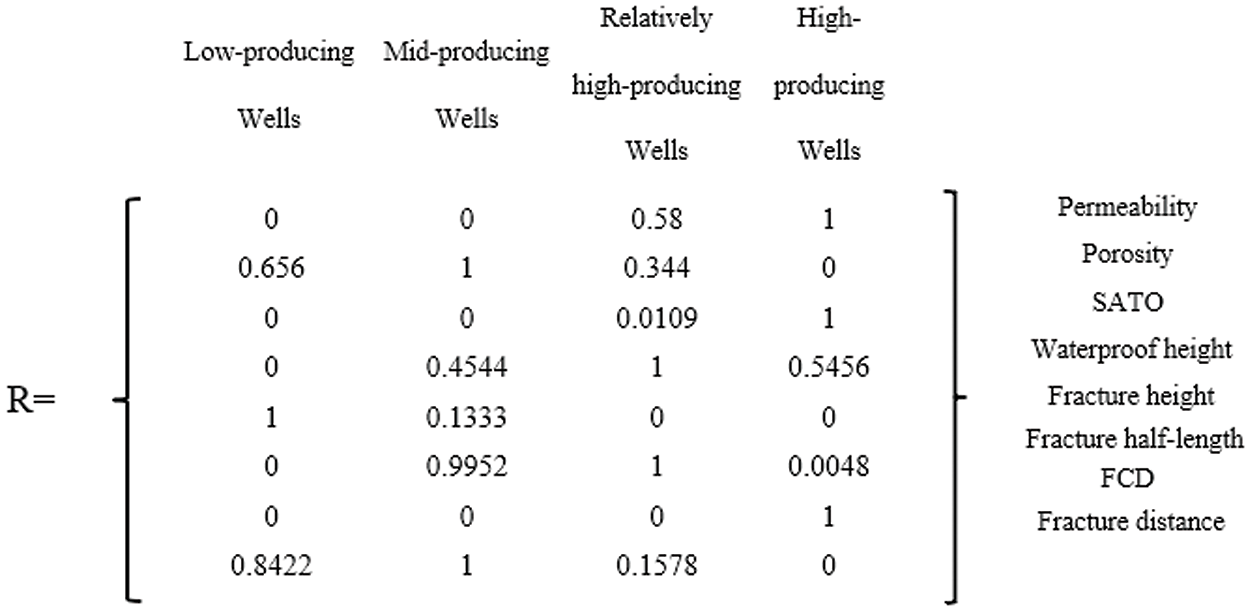
Figure 7: The degree of membership matrix of Well C4763
5.3 Fuzzy Composite Judgment Results
By utilizing the fuzzy synthetic relationship between the degree of membership matrix R and the weights W of the judging indicators set, the fuzzy comprehensive judgment results can be derived, as presented in Formula (6). The fuzzy judgment values for the typical wells are detailed in Table 7 (C001, low-producing), Table 8 (C016, medium-producing), Table 9 (C4719, relatively high-producing), and Table 10 (C4763, high-producing).
where B is the fuzzy composite judgment results, W is the weight of the set of judgment indicators and R is the affiliation matrix.


Using the same method to calculate the fuzzy evaluation values for all 53 wells in the entire area, the results are presented in Table 11. This table includes the fuzzy comprehensive evaluation results for high-producing wells, medium-producing wells, relatively high-producing wells, and low-producing wells, as detailed below.

(1) Data Sensitivity and Incompleteness: Grey association analysis offers advantages in handling incomplete information and uncertain relationships, but it demands high data sensitivity and accuracy. The presence of numerous outliers in the data may compromise the accuracy of the analysis results.
(2) Correlation vs. Causation: Grey correlation analysis reveals correlations between factors but cannot determine causation. Therefore, even if certain factors exhibit strong correlations with capacity, they cannot be directly inferred as the cause of capacity changes.
(3) Subjectivity: The construction of the judgment matrix in analytic hierarchy relies on the subjective judgments of experts. The experience and preferences of different experts may lead to variations in weight allocation, ultimately affecting the final evaluation result.
6.2 Limitations in Interpretation and Applicability of Results
(1) Specific Block Focus: The study results are primarily based on geological and engineering data from a specific block, limiting their applicability to other blocks with dissimilar geological and engineering conditions. The reference value may be limited for blocks with widely varying geological conditions.
(2) Time Sensitivity: The productivity of oil and gas wells is influenced by various factors and changes over time. Therefore, the study results may only be applicable to capacity evaluations within a specific time frame. For long-term oil and gas wells, data and evaluation methods may require regular updates to reflect the latest geological and engineering conditions.
In summary, there are limitations in the hypotheses and methods of this study. To more accurately evaluate the factors affecting the productivity of fractured horizontal wells in Carboniferous volcanic rocks, future studies can consider incorporating additional potential influencing factors, improving data quality and representativeness, and enhancing the objectivity and accuracy of evaluation methods. These efforts will contribute to improving the wide applicability and practical guiding significance of research results.
This paper constructs a comprehensive evaluation system by integrating grey correlation analysis, hierarchical analysis, and fuzzy evaluation methods to scientifically assess geological and engineering factors, optimize fracturing effectiveness, and enhance production capacity.
(1) The objective of this system is to thoroughly investigate the key influencing factors on the production capacity of horizontally fractured wells in Carboniferous volcanic rocks. It aims to provide theoretical support and practical guidance for efficient oil and gas field development. Through this comprehensive evaluation approach, it becomes feasible to accurately identify the primary factors impacting production capacity, laying a solid foundation for optimizing fracturing design and enhancing oil and gas recovery.
(2) The production capacity of the target block is influenced by various parameters, including seepage parameters, bottom water conditions, and fracturing parameters. To assess the degree of influence among these factors, the gray correlation method was employed. The correlation degrees, in descending order, are as follows: oil saturation, fracture inflow capacity, fracture half-length, number of fracturing stages, fracture height, waterproof height, porosity, and permeability. The results indicate that enhancing production performance requires considering not only initial oil saturation but also controlling fracture flow capacity and fracture half-length.
(3) A systematic investigation was conducted on the impact of geological parameters and fracturing modification parameters on the production capacity of multi-stage fractured horizontal wells in Carboniferous volcanic rocks, taking into account geological and engineering influencing factors comprehensively. The hierarchical analysis method was used to calculate the weight coefficients of the factors influencing production capacity. By establishing a fuzzy comprehensive evaluation model for production capacity, low-producing wellheads, medium-producing wells, higher-producing wells, and high-producing wells were identified within the surface target block. The analysis results demonstrate a strong correlation with both fracturing and single well production capacities in the study area.
Acknowledgement: None.
Funding Statement: Natural Science Foundation of China (NSFC), Grant No. 52404016 (Lijuan Huang), Natural Science Foundation of Hubei Province, Grant No. 2024AFB322 (Lijuan Huang), Open Fund of Hubei Key Laboratory of Oil and Gas Drilling and Production Engineering (Yangtze University), Grant No. YQZC202405 (Lijuan Huang).
Author Contributions: The authors confirm contribution to the paper as follows: study conception and design: Junwei Han, Lijuan Huang; data collection: Guohua Li, Wu Zhong, Yuchen Yang; analysis and interpretation of results: Maoheng Li, Zhiwei Chen, Ruichang Ge; draft manuscript preparation: Lijuan Huang, Junwei Han. All authors reviewed the results and approved the final version of the manuscript.
Availability of Data and Materials: The data that support the findings of this study are available from the corresponding author upon reasonable request.
Ethics Approval: Not applicable.
Conflicts of Interest: The authors declare no conflicts of interest to report regarding the present study.
References
1. Quandt D, Busch B, Hilgers C. Evolution of Upper Carboniferous tight sandstone reservoirs in the Ruhr and Lower Saxony basins (NW Germany) of the Central European Variscan foreland. Mar Pet Geol. 2024;163:106774. doi:10.1016/j.marpetgeo.2024.106774. [Google Scholar] [CrossRef]
2. Shalaby MR, Thota ST, Norsahminan DNP, Kamalrulzaman KN, Matter WS, Al-Awah H. Reservoir quality evaluation using petrophysical, well-log analysis and petrographical description: a case study from the Carboniferous-Permian Kulshill group formations, southern Bonaparte Basin, Australia. Geoener Sci Eng. 2023;226:211738. doi:10.1016/j.geoen.2023.211738. [Google Scholar] [CrossRef]
3. El-Ghali MAK, Khan JA, Al-Mandhari K, Al-Hinai N, Moustafa MSH, Abbasi IA, et al. Depositional facies and diagenetic alterations of glacially-related sandstone reservoirs: an example from the late Carboniferous-early Permian Al Khlata Formation in Wadi Daiqa, Oman Mountains. Mar Pet Geol. 2024;167:106961. doi:10.1016/j.marpetgeo.2024.106961. [Google Scholar] [CrossRef]
4. Song XK, Liu YT, Fan PT, Liu XJ. Quantifying the influence of fracture parameters on flow behavior and pressure propagation in complex networks of discrete fractures within low-permeability reservoirs. Phys Fluids. 2023;35(7):76608. doi:10.1063/5.0155979. [Google Scholar] [CrossRef]
5. Xiao H, Zhang H, Wang C, Wang H, He T, Xie X. Discrete element-based multi-cluster hydraulic fracture extension study with temporary plugging and fracturing in horizontal wells. Phys Fluids. 2024;36(6):63306. doi:10.1063/5.0211604. [Google Scholar] [CrossRef]
6. Jonge-Anderson ID, Ma J, Wu X, Stow D, Griffiths DJEG. Bowland Shale well placement strategy–part 2: fracture simulations using a 3D geomechanical model and implications for stratigraphic and spatial horizontal well locations. Energy Geoscience. 2022;3(3):235–54. doi:10.1016/j.engeos.2022.03.004. [Google Scholar] [CrossRef]
7. Garcez J, Zhang M, Ayala LF. Unified early-to-late time forecasting method for multi-fractured horizontal wells in unconventional gas reservoirs with fracture interference effects. Gas Sci Eng. 2023;110:204884. doi:10.1016/j.jgsce.2023.204884. [Google Scholar] [CrossRef]
8. Shah MS, Shah SN. Comparative assessment of mechanical and chemical fluid diversion techniques during hydraulic fracturing in horizontal wells. Pet Sci. 2023;20(6):3582–97. doi:10.1016/j.petsci.2023.07.013. [Google Scholar] [CrossRef]
9. Lian CB, Zhong JH, Cai FL, Zhang JT. Influencing factors analysis of oil field output based on grey correlation analytical method. Nat Gas Geosci. 2006;6:851–3. [Google Scholar]
10. Kazeem RA, Fadare DA, Akande IG, Jen TC, Akinlabi SA, Akinlabi ET. Evaluation of crude watermelon oil as lubricant in cylindrical turning of AISI, 1525 steel employing Taguchi and grey relational analyses techniques. Heliyon. 2024;10(3):e25349. doi:10.1016/j.heliyon.2024.e25349. [Google Scholar] [PubMed] [CrossRef]
11. Singh G, Singh N. Destructive and non-destructive strength performance of iron slag recycled aggregate concrete using regression and grey correlation analysis. Measurement. 2025;239:115422. doi:10.1016/j.measurement.2024.115422. [Google Scholar] [CrossRef]
12. Xue J, Xu G, Yang J, Zhang W, Yu Y. Grey correlation analysis of bio-oil rejuvenated asphalt performance and components. In: 19th COTA International Conference of Transportation Professionals: Transportation in China-Connecting the World, CICTP 2019, 2019 Jul. 6–8; Nanjing, China: American Society of Civil Engineers (ASCE). [Google Scholar]
13. Zhang W, Wei WF. Adaptive emotion neural network based on ITCSO and grey correlation contribution. Neurocomputing. 2023;577:127373. [Google Scholar]
14. Dong X, Liu H, Chen Z, Qi P. An empirical correlation to predict the SAGD recovery performance. J Comput Methods Sci Eng. 2017;17(3):333–45. [Google Scholar]
15. Long ZL, Wen ZT, Hui LI, Zeng XW. An evaluation method of shale reservoir crushability based on grey correlation analysis. Petrol Reserv Eval Develop. 2020;10(1):37–42. [Google Scholar]
16. Liu H, An HY, Liu PC. The application of the grey relation analysis method to the deliverability evaluation of volume fracturing of horizontal well in tight gas reservoirs. In: Proceedings of the Petrochemical Symposium of the 13th Ningxia Young Scientists Forum, 2017 Jul 26; Yinchuan, China. [Google Scholar]
17. Katsuno N, Onishi M, Taguchi T, Ohmoto C, Yamaguchi H, Hashimoto T, et al. Cross-hierarchical analysis of self-assembly dynamics in enzyme-treated rice gel during retrogradation. Food Hydrocoll. 2024;156:110355. doi:10.1016/j.foodhyd.2024.110355. [Google Scholar] [CrossRef]
18. Koucheki R, Wolfstadt JI, Chang JS, Backstein DJ, Lex JR. Total knee arthroplasty with robotic and augmented reality guidance: a hierarchical task analysis. Arthroplast Today. 2024;27:101389. doi:10.1016/j.artd.2024.101389. [Google Scholar] [PubMed] [CrossRef]
19. Xie S, Kumagai S, Kim YM, Saito Y, Yoshioka T. Combining hierarchical clustering analysis with a simplex lattice mixture design in rapidly identifying the pyrolytic interactions and predicting the product yields during the co-pyrolysis of cellulose, xylan, and milled wood lignin. Chem Eng J. 2024;493:152434. doi:10.1016/j.cej.2024.152434. [Google Scholar] [CrossRef]
20. Mohammadbeigi KF, Daniali S, Mohammadbeiki Y. Prioritizing factors affecting Iranian non-oil export using group decision making approach based on hierarchical analysis process. Upravlenie. 2019;7(4):60–6. [Google Scholar]
21. Dupuy N, Galtier O, Ollivier D, Vanloot P, Artaud J. Comparison between NIR, MIR, concatenated NIR and MIR analysis and hierarchical PLS model. Application to virgin olive oil analysis. Analytica Chimica Acta. 2010;666:23–31. doi:10.1016/j.aca.2010.03.034. [Google Scholar] [PubMed] [CrossRef]
22. Nureize A, Watada J. A fuzzy regression approach to a hierarchical evaluation model for oil palm fruit grading. Fuzzy Optim Decis Mak. 2010;9(1):105–22. doi:10.1007/s10700-010-9072-3. [Google Scholar] [CrossRef]
23. Li DH, Tian LY, Nie HK, Peng ZY. Factor analysis and comprehensive evaluation model of shale gas well productivity based on fuzzy analytic hierarchy process: taking Jiao Shiba shale gas field in Sichuan Basin as an example. Petrol Reser Evalu and Develop. 2022;12(3):417–28. [Google Scholar]
24. Zhang C, Xia FG, Xia YQ, Zhou XL. Comprehensive evaluation of friability of tight sandstone reservoirs based on analytic hierarchy process. Drill Product Technol. 2021;44(1):61–4 (In Chinese). [Google Scholar]
25. Jiang CL, Li XL, Wang F, Wang R. Comprehensive evaluation of coal burst risk using optimized linear weighted model. Phys Fluids. 2024;36(5):57113. doi:10.1063/5.0205400. [Google Scholar] [CrossRef]
26. Fetanat A, Tayebi M. A picture fuzzy set-based decision support system for treatment technologies prioritization of petroleum refinery effluents: a circular water economy transition towards oil & gas industry. Sep Purif Technol. 2022;303:122220. doi:10.1016/j.seppur.2022.122220. [Google Scholar] [CrossRef]
27. Aliabadi MM, Mohammadfam I, Khorshidikia S. Human error identification and risk assessment in loading and unloading of petroleum products by road trucks using the SHERPA and fuzzy inference system method. Heliyon. 2024;10(15):e34072. doi:10.1016/j.heliyon.2024.e34072. [Google Scholar] [PubMed] [CrossRef]
28. Fetanat A, Tayebi M. Sustainability prioritization of technologies for cleaning up soils polluted with oil and petroleum products: a decision support system under complex spherical fuzzy environment. Chemosphere. 2022;308:136328. doi:10.1016/j.chemosphere.2022.136328. [Google Scholar] [PubMed] [CrossRef]
29. Lehtonen H. Optimization of grouting material by the analytic hierarchy process. In: ISRM 9th Nordic Grouting Symposium, NGS 2019, 2019 Sep. 2–3; Helsinki, Finland: International Society for Rock Mechanics and Rock Engineering. [Google Scholar]
30. Lee TL, Lin HM, Jeng DS, Tsai SH. Assessment of wave energy potential in Taiwan: the fuzzy analytic hierarchy process. In: 20th International Offshore and Polar Engineering Conference, ISOPE-2010, 2010 Jun. 20–25; Beijing, China: International Society of Offshore and Polar Engineers. [Google Scholar]
Cite This Article
 Copyright © 2024 The Author(s). Published by Tech Science Press.
This work is licensed under a Creative Commons Attribution 4.0 International License , which permits unrestricted use, distribution, and reproduction in any medium, provided the original work is properly cited.


 Submit a Paper
 Propose a Special lssue
 View Full Text
 Download PDF
 Downloads
 Citation Tools