 Open Access
ARTICLE
Analysis of Rotor-Seizure-Induced Pressure Rise in a Nuclear Reactor Primary Cooling Loop
1 College of Energy and Power Engineering, Lanzhou University of Technology, Lanzhou, 730050, China
2 Key Laboratory of Fluid Machinery and System of Gansu Province, Lanzhou, 730050, China
* Corresponding Author: Congxin Yang. Email:
(This article belongs to the Special Issue: Computational Fluid Dynamics: Two- and Three-dimensional fluid flow analysis over a body using commercial software)
Fluid Dynamics & Materials Processing 2024, 20(12), 2907-2926. https://doi.org/10.32604/fdmp.2024.055301
Received 22 June 2024; Accepted 09 September 2024; Issue published 23 December 2024
Abstract
Most of existing methods for the safety assessment of the primary cooling loop of nuclear reactors in conditions of reactor coolant pump (RCP) failure (rotor seizure accident) essentially rely on the combination of one-dimensional theory and experience. This study introduces a novel three-dimensional model of the ‘Hualong-1’ (HPR1000) primary loop and uses the method of matching the resistance characteristics of the tube to ensure that the main pump operates at the rated operating condition. In particular, the three-dimensional unsteady numerical calculation of the RCP behavior in the rotor-seizure accident condition is carried out in the framework of the RNG k-ε turbulence model. The related transient pressure surge law and hydraulic load response are obtained accordingly.Keywords
The HPR1000 reactor core and primary loop system are the core system of the third-generation million-kilowatt pressurized water reactor [1]. The reactor coolant pump is a critical component within the reactor coolant system. The reactor coolant pump is a critical component within the reactor coolant system. When the rotor of the main pump cannot rotate normally due to direct contact with stationary parts, it is referred to as a rotor seizure accident. Under the accident condition of rotor seizure, the steady-state flow of the loop is broken, and the process of water flow transitioning from one steady-state to another is called the hydraulic transition process. The sudden changes in velocity and pressure accompanying this process are known as water hammer, which not only impacts the pump itself but also generates a rapid pressure surge that propagates throughout the loop in an extremely short period of time. The hydraulic load generated by the sudden changes in pressure and inertial impact also acts on the pump and the loop, directly affecting the operational safety of the main pump, tubes and heat transfer tube of the steam generator.
In recent years, scholars around the world have conducted extensive research on the transient characteristics of nuclear main pumps under accident conditions. Gao et al. examined the reactor coolant pump’s transient performance during startup and determined the correlation between system parameters, transient flow rate, transient pump speed, three transient heads, and three transient torques [2]. Alatrash et al. analyzed the inertial pumping ability of the nuclear primary pump during power-off coasting and established a sliding half-life time that exceeds safety standards based on experimentally measured flywheel inertia [3]. Zuo et al. discussed the single-phase water hammer phenomenon resulting from the four-pump-alternate startup in an integral pressurized water reactor (IPWR). They independently developed a new code, named Water Hammer Program (WAHAP), based on the method of characteristics to simulate hydraulic transients in the primary system of IPWR and its components, including the reactor core, once-through steam generators (OTSG), and main coolant pumps [4]. Ni et al. conducted a study on the unsteady flow characteristics in a mixed-flow nuclear reactor coolant model pump and confirmed that pressure pulsations in specific regions are influenced by the shedding vortex wake from the diffuser blade trailing edge of the pump [5]. Su et al. utilized statistical methods to characterize the dimensionless pressure pulsation intensity in the pump, based on variations in physical properties and parameter settings during the startup process of the AP1000. Additionally, they conducted spectral analysis to examine the radial force of the impeller [6]. Long et al. conducted an analysis and investigation of the unsteady pressure pulsation in nuclear main pumps under non-uniform inflow conditions [7]. Lu et al. discovered that the reactor coolant pump featuring a central symmetrical dual-outlet volute structure exhibits superior radial direction balance, while the pump without guide vanes demonstrates better hydraulic performance. Conversely, the pump equipped with guide vanes displays inferior torsional vibration and pressure pulsation [8]. Wang et al. conducted a comprehensive dimensionless analysis of the transient system characteristic curves for the nuclear main pump under various rotor sticking conditions, and derived the response law for system pressure fluctuations [9]. Azzoune et al. introduced a combined experimental and numerical simulation method to examine safety concerns associated with potential loss-of-flow accident (LOFA) scenarios. The findings from the transient (LOFA) investigations indicate that in both situations, the minimum critical heat flux ratio and minimum onset of flow instability ratio for NUR are met with a sufficient margin [10]. Wang et al. discovered that the rotor seizure accident condition represents a transient shift from normal pump operation to reverse turbine conditions. During this event, the high specific pressure energy zone within the pump gradually transitions from the volute to the inlet section. As a result of direct liquid flow impact, the impeller becomes a concentrated area of high stress [11]. Saemi et al. conducted numerical simulations in both two- and three-dimensional (2D and 3D) models to investigate water hammer flows. The asymmetric flow patterns caused by the valve are confined within approximately one pipe diameter upstream of the valve. The dominant contributions of inertia and pressure gradient terms at the moment of pressure wave passage result in abrupt changes in the fluid flow parameters [12]. Wang et al. investigated the transient behavior of nuclear primary pumps during shutdown under power loss conditions [13]. Ye et al. developed a mathematical model to analyze the flowrate and rotation speed of RCP during idling, utilizing numerical calculation and dimensionless methods to examine flow, head, torque, pressure, and speed variations under idle conditions. Additionally, they employed the Q criterion vortex identification judgment method in combination with surface flow spectrum morphology analysis to diagnose the vortex dynamic characteristics on RCP blade [14]. Li et al. developed a computational theory for the hydraulic load of the primary circuit LOCA based on the transmission characteristics of pressure surges following the LOCA, and conducted calculations for the maximum limit load post-break [15]. Behroozi et al. investigates the transient behavior and water hammer in pipelines resulting from rapid changes in the operation of parallel pumps. The findings indicate that the transient characteristics of the system are entirely contingent upon the shutdown and start-up pattern of the pump group [16]. Li et al. conducted a simulation of the RCP shutdown accident in a single circuit of the reactor. The results indicate significant changes in pressure within the pipeline system, with the flow rate dropping rapidly to 1.7% of stable operation at 10 s. Furthermore, there is a dramatic alteration in pressure at the inlet and outlet of the impeller, leading to changes in blade load and a gradual decrease in velocity within the impeller passage. Additionally, both pressure and velocity within the guide vane exhibit continuous decline [17]. Lu et al. conducted experiments and bidirectional fluid-structure coupling calculations to investigate the transient structural load characteristics of the RCP during a nuclear main pump rotor sticking accident [18]. Liu et al. utilized numerical simulation methods, wavelet analysis, and entropy generation theory to obtain the dynamic static pressure energy distribution and entropy generation distribution of the time domain characteristics, time spectrum, and energy characteristics of the pressure pulsation of the nuclear main pump under idle operating conditions [19]. An et al. discovered that the RCP was likely to transition into the extreme operational state of reverse pump mode in the event of a large-scale flow interruption and loss of cooling accident (LBLOCA) at the inlet of the reactor coolant pump (RCP). They identified that the high-speed flow generated in the cavitation zone was the primary factor influencing changes in pump head, while the vapor volume fraction on the surface of the impeller blade played a crucial role in altering pump head [20]. Song et al. conducted an analysis on the influence mechanism of non-uniform flow on the performance of RCP. The findings indicate that non-uniform inflow leads to an increase in total head loss within the RCP, with the total head loss in the impeller and diffuser increasing by approximately 17% and 32%, respectively [21]. Li et al. utilized computational fluid dynamics techniques to perform transient numerical simulation of the nuclear main pump shaft stuck accident conditions, and obtained instantaneous variations in the external characteristics, internal pressure field, impeller blade load, and stress characteristics of the nuclear main pump under different stuck shaft conditions [22]. Liu et al. identified the flow separation caused by the asymmetric structure of the steam generator and the sudden change in cross-section when connected to the inlet tube as the primary factors contributing to non-uniform inflow. This reveals the formation mechanism of RCP non-uniform inflow and proposes an improved design scheme to enhance RCP performance under non-uniform inflow conditions [23]. Cui et al. developed a high-precision three-dimensional transient flow calculation method for the closed system of the “Hualong One” reactor and the primary system, in order to accurately capture the transient internal flow transition process and hydraulic load impact of the reactor coolant system under accident conditions. They also identified the pressure wave oscillation pattern and transient hydraulic load characteristics in both the reactor and primary system during the transition process [24].
The majority of existing literature focuses on studying the hydrodynamic characteristics within centrifugal nuclear main pumps using simplified open-system models. This article, however, is based on the reactor primary loop system and employs a method to match the resistance characteristics of the tube in order to ensure that the main pump operates at its rated operating condition. Numerical calculations are utilized to determine the pressure surge and hydraulic loads generated in the system pipeline during the rotor seizure process, providing input for dynamic characteristics analysis of the reactor primary loop and serving as a technical reference for the design and safety assessment of the steam generator and other components.
2 Numerical Calculation Method
The coolant of the main pump and the loop fully develop into unsteady three-dimensional turbulent flow, so the internal flow development of the main pump needs to be described using the most basic turbulence equation. Fluid mechanics mainly includes three conservation equations, namely continuity equation, momentum equation and energy equation. Due to the fact that the heat transfer process of the steam generator and the phase change heat transfer in the nuclear reactor are not covered in the text, only the fluid continuity equation and momentum equation are considered in the numerical calculation process of the main pump. Substituting the averaged quantities into the original transport equations results in the Reynolds averaged equations given below:
where,
This paper chooses RNG k-ε turbulence model to simulate the unsteady flow of the main pump and loop system accurately. In this model, the influence of small-scale is reflected through large-scale motion and modified viscosity terms, and the modified turbulent kinetic energy k and dissipation rate ε [25]. The transport equation is:
By modifying the turbulent dynamic viscosity coefficient and considering the rotation and rotational flow in the average flow, the model is able to provide more accurate predictions of transient flow effects and streamline bending. An additional term has been added to the ε equation to reflect the time-averaged rate of change of the mainstream, which results in the generated terms in the RNG k-ε model are not only related to the flow condition, but also effectively improve the accuracy of the ε equation.
Therefore, this paper adopts RNG k-ε turbulence model for accurately simulating unsteady flow in both main pump and loop systems.
3.1.1 3D Model of the Primary Loop
The primary loop of the HPR1000 is composed of three independent circuits, as illustrated in Fig. 1. Given the assumption that each circuit in the loop operates independently and the likelihood of rotor seizure accidents occurring simultaneously in all three circuits is extremely low, it is inferred that only one circuit experiences a rotor seizure accident while the other two remain in normal operating conditions. As a result, the primary loop can be simplified as a single-circuit system.
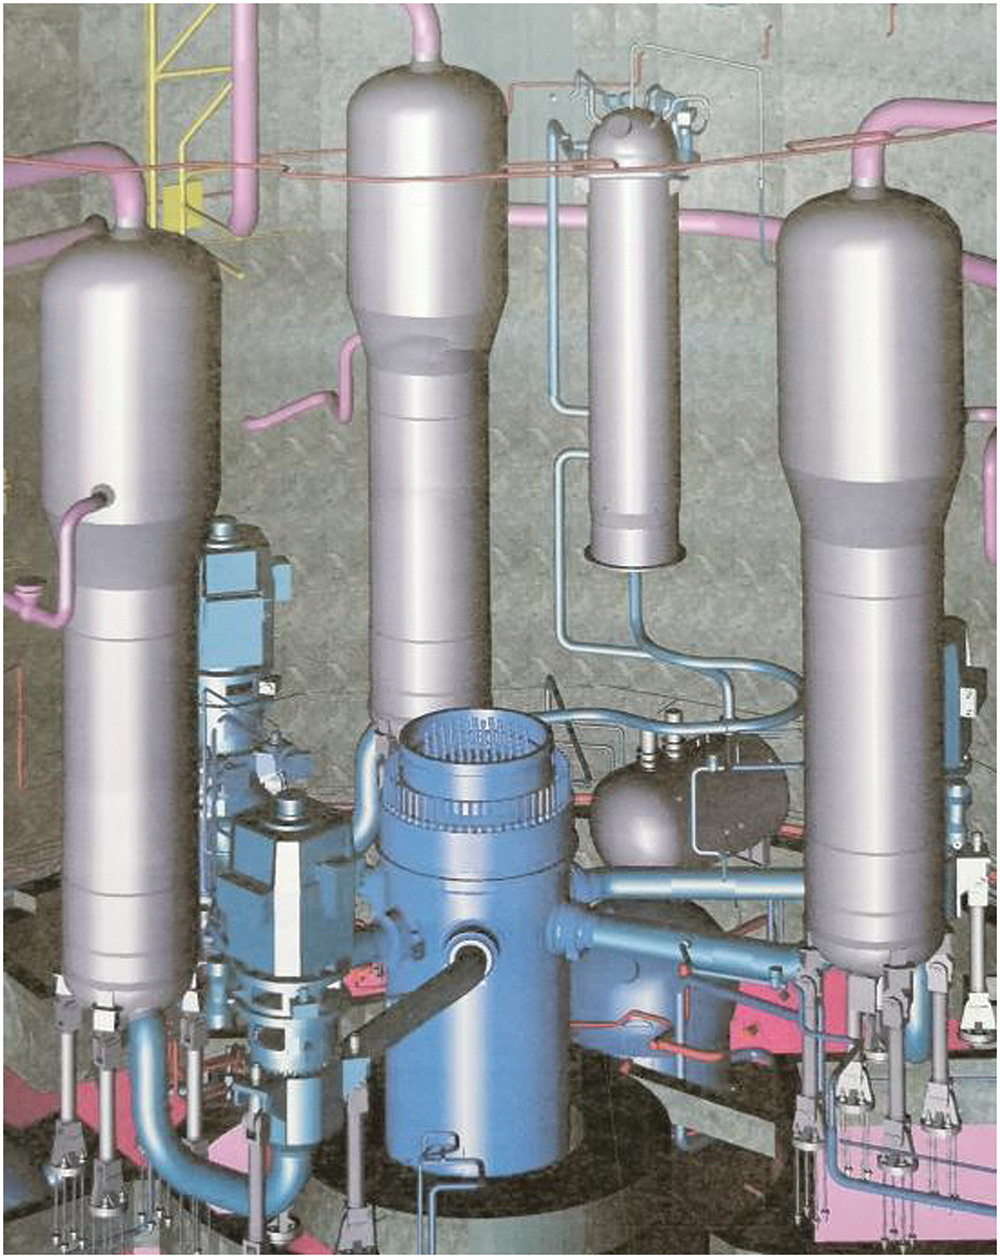
Figure 1: The primary loop of the HPR1000
The internal structure of the steam generator reactor is intricate, necessitating structural simplification for the single-circuit steam generator. Drawing from the structural characteristics of the HPR1000 reactor core steam generator and the principle of maintaining a constant cross-sectional area for heat transfer tubes, the equal area of heat transfer tubes is simplified into three inverted U-shaped tubes. The resistance element radius on the heat transfer tube is adjusted accordingly to ensure that the resistance characteristics of the simplified three inverted U-shaped bends are equivalent to those of the original heat transfer tube [26] as depicted in Fig. 2.
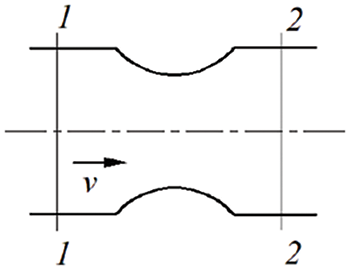
Figure 2: Resistance element
For tapered tubes, the energy loss is caused by the collision between the fluid and the wall due to the reduction of the tube section during the process of the flow. Moreover, after collision between these fluid particles and the wall, the velocity direction is changed, and the collision with the particles still moving in the original direction makes the original orderly movement disorder, until a long time after entering the small-section pipeline, this disorder gradually disappears.
According to the Bernoulli equation, the local loss hj of sections 1 and 2 of pipelines is approximately expressed as:
where, vi is the average flow velocity of the corresponding cross-section, m/s; pi is the average pressure of the corresponding cross-section, Pa; αi is the kinetic energy correction coefficient of the corresponding cross-section, which is taken as 1 due to the uniform flow pattern; zi is the potential energy at the corresponding position of the cross-section.
Similarly, the other parts of the circuits have been simplified and matched with resistance characteristics, allowing the nuclear main pump to operate at the rated operating point in the primary loop system of the reactor.
The Fig. 3 shows the three-dimensional simplified model of a single loop reactor:
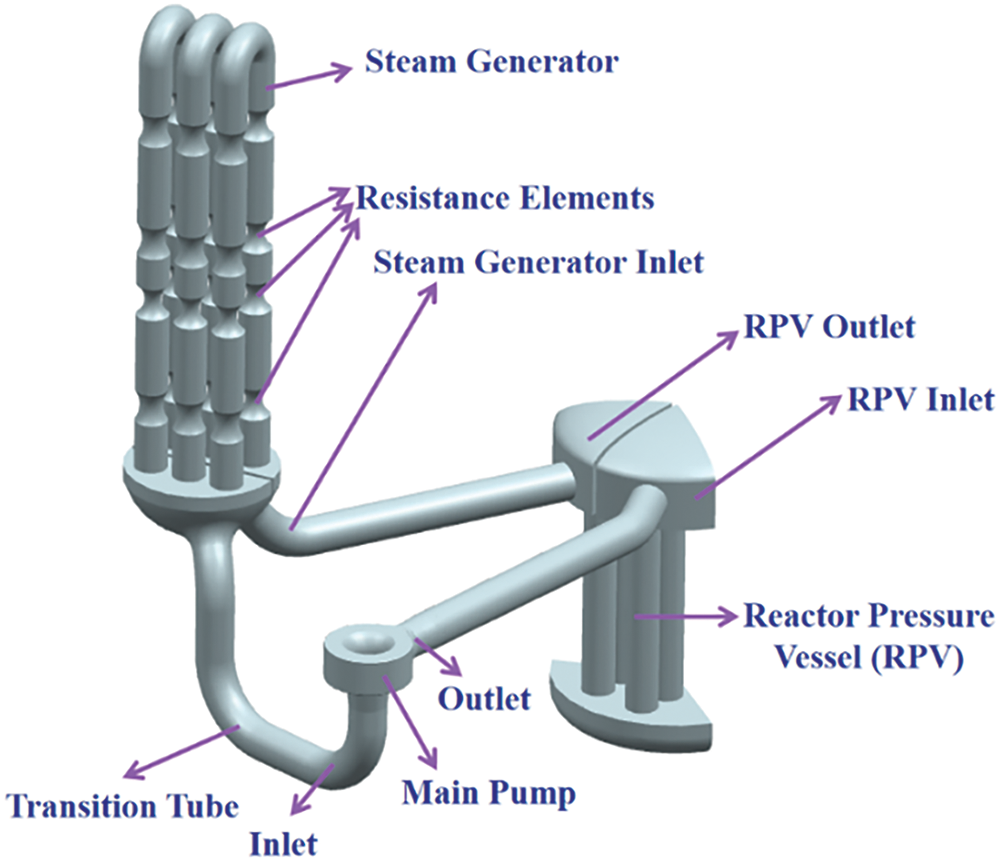
Figure 3: Three-dimensional simplified model of a single circuit
3.1.2 Pump Model and Parameters
The three-dimensional model of the coolant pump is shown in Fig. 4, and the parameters are shown in Table 1.
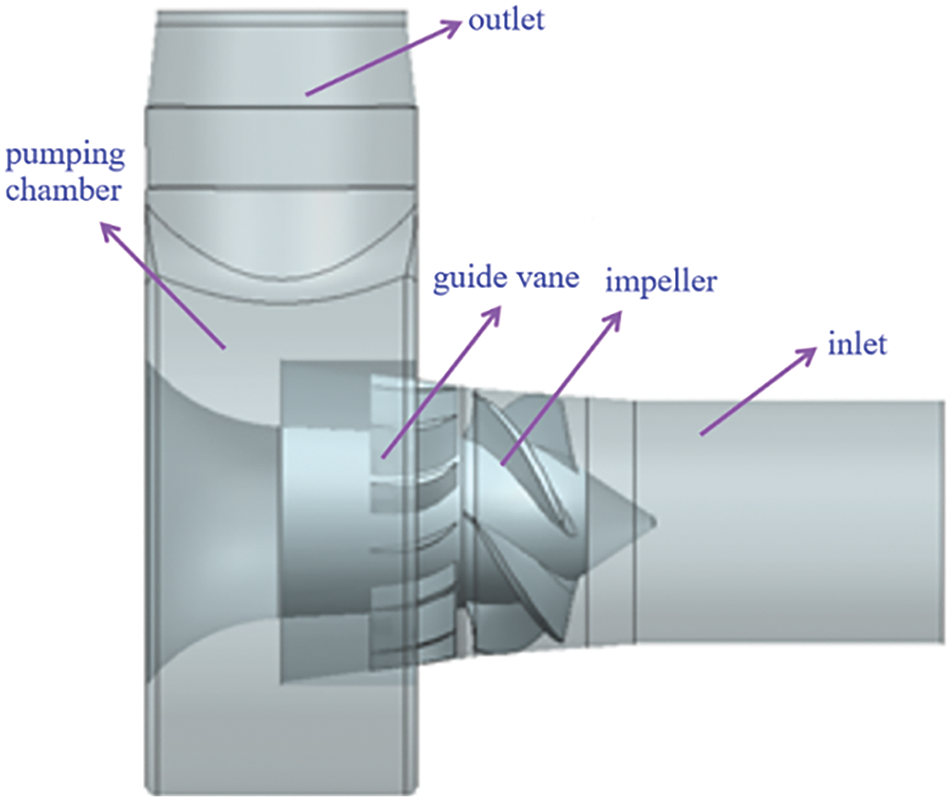
Figure 4: Three-dimensional model of the coolant pump

The grid division adopts TurboGrid and ICEM CFD to divide the flow components of the nuclear main pump into hexahedral grids, and all wall grids are encrypted to meet the requirements of the turbulence model y+ = 30~300. Considering the limited computing resources while ensuring the convergence and reliability of numerical simulation, the grid independence test shown in Fig. 5 is conducted with the pump efficiency as a reference. After comprehensive consideration, the total number of fluid domain grids selected for the nuclear main pump is 12.28 million. The grid division of each flow passage component is shown in Fig. 2, with a total number of 18.3 million grids, including 4.1 million impeller grid units, 3.95 million guide vanes, 4.23 million pressure chambers, and 6.02 million pipeline system grids.
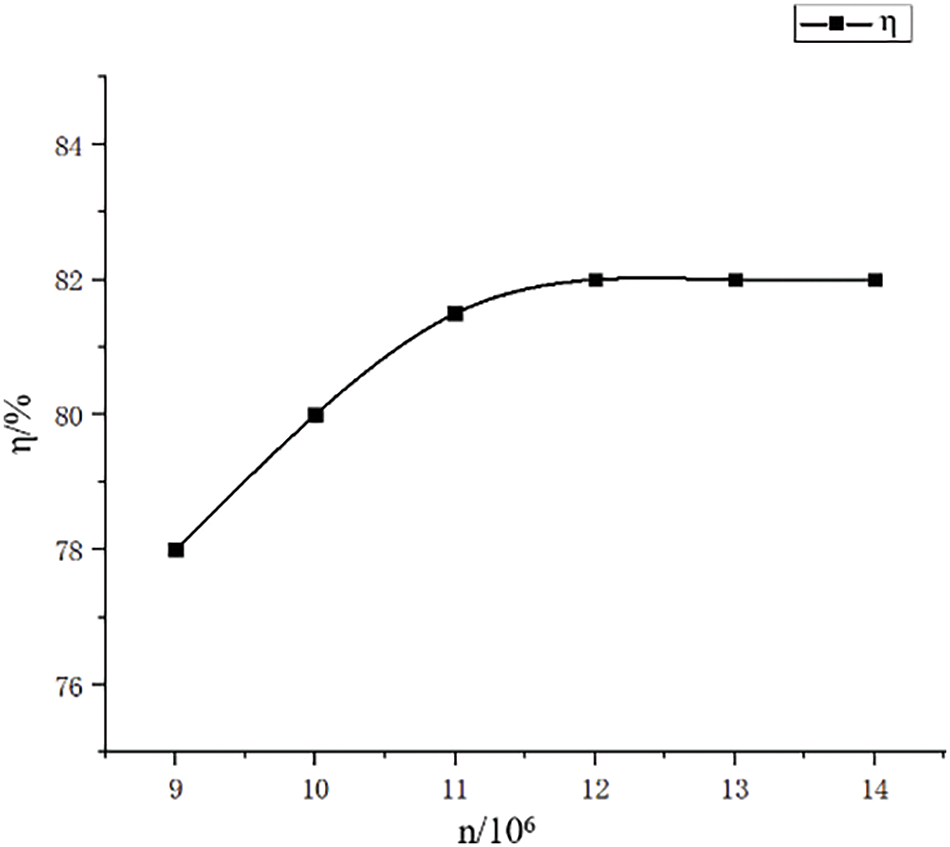
Figure 5: Grid independence verification
The grids of the coolant pump and tubes shown as Fig. 6.
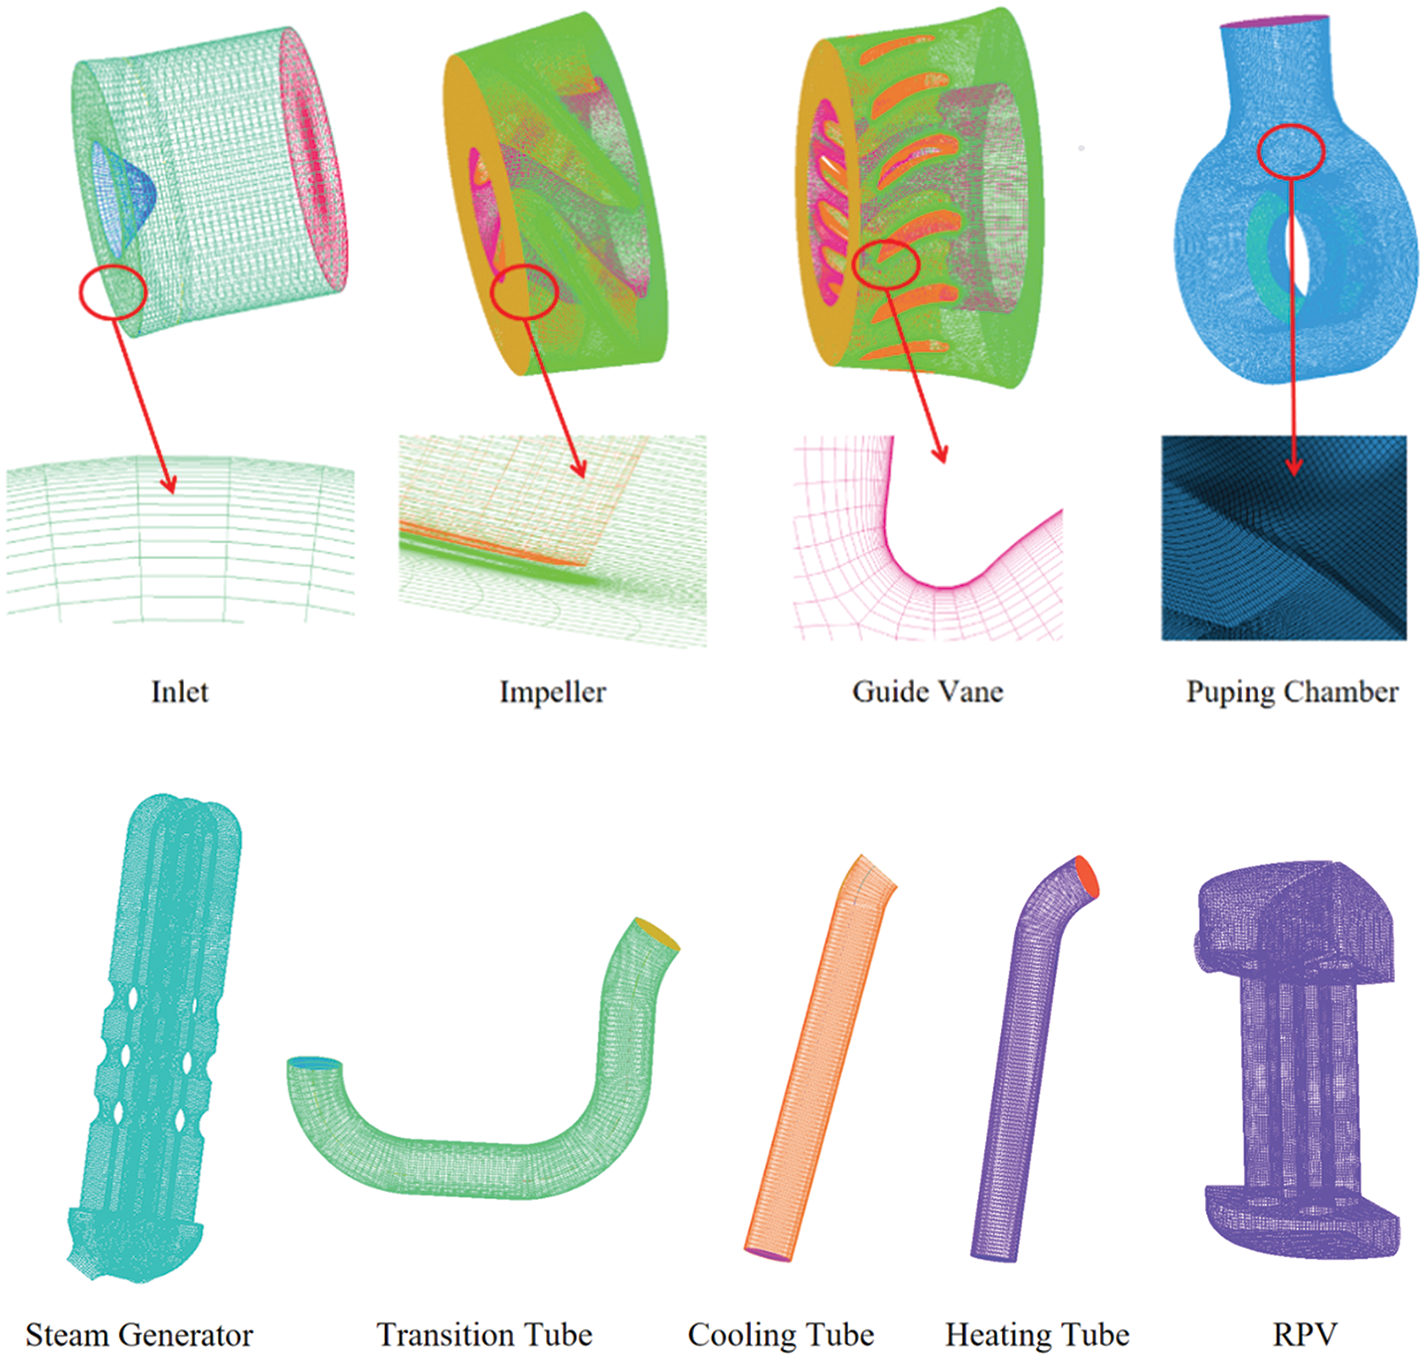
Figure 6: Grids of the coolant pump and tubes
3.3.1 Numerical Simulation and Boundary Condition Setting
This article is based on the ANSYS-CFX software for numerical simulation, utilizing the RNG k-ε turbulence model to close the Navier Stokes equations. The consideration of rotational effect in high strain flow is achieved by adjusting the turbulent viscosity. Discretization of physical quantities on the control body interface is carried out using the second-order upwind scheme, and the coupled solution of pressure and velocity is accomplished through the SIMPLEC algorithm. A scalable wall function is employed to correlate corresponding physical quantities in both near wall region and turbulent core region. Data transmission between computational domains is facilitated through interfaces. In unsteady calculations, rotating and static interfaces are configured with sliding mesh model, while static interface remains unset.
The water hammer phenomenon will occur in the rotor seizure accident, so the compressibility of the fluid must be considered [27]. The fluid is pressurized water without boiling, and its physical properties in the working environment are ρref = 745 kg/m3, dynamic viscosity μ = 9.42 × 10⁻⁵ kg/(m
The nonlinear variation law of speed during the main pump stagnation process is investigated, as depicted in Fig. 7. The speed variation curve with time is inputted as a boundary condition into the numerical setting to achieve nonlinear oscillation of the speed during the transition process of the rotor seizure accident, based on numerical calculation software. Additionally, 10 cycles (0.404 s) of stable working condition calculation were conducted before the main pump seizure to accurately determine pressure fluctuation and load distribution in the system before and after stagnation. The rotor entered seizure condition at 0.404 s, locking and decreasing in speed to 0 rpm within 0.3 s.
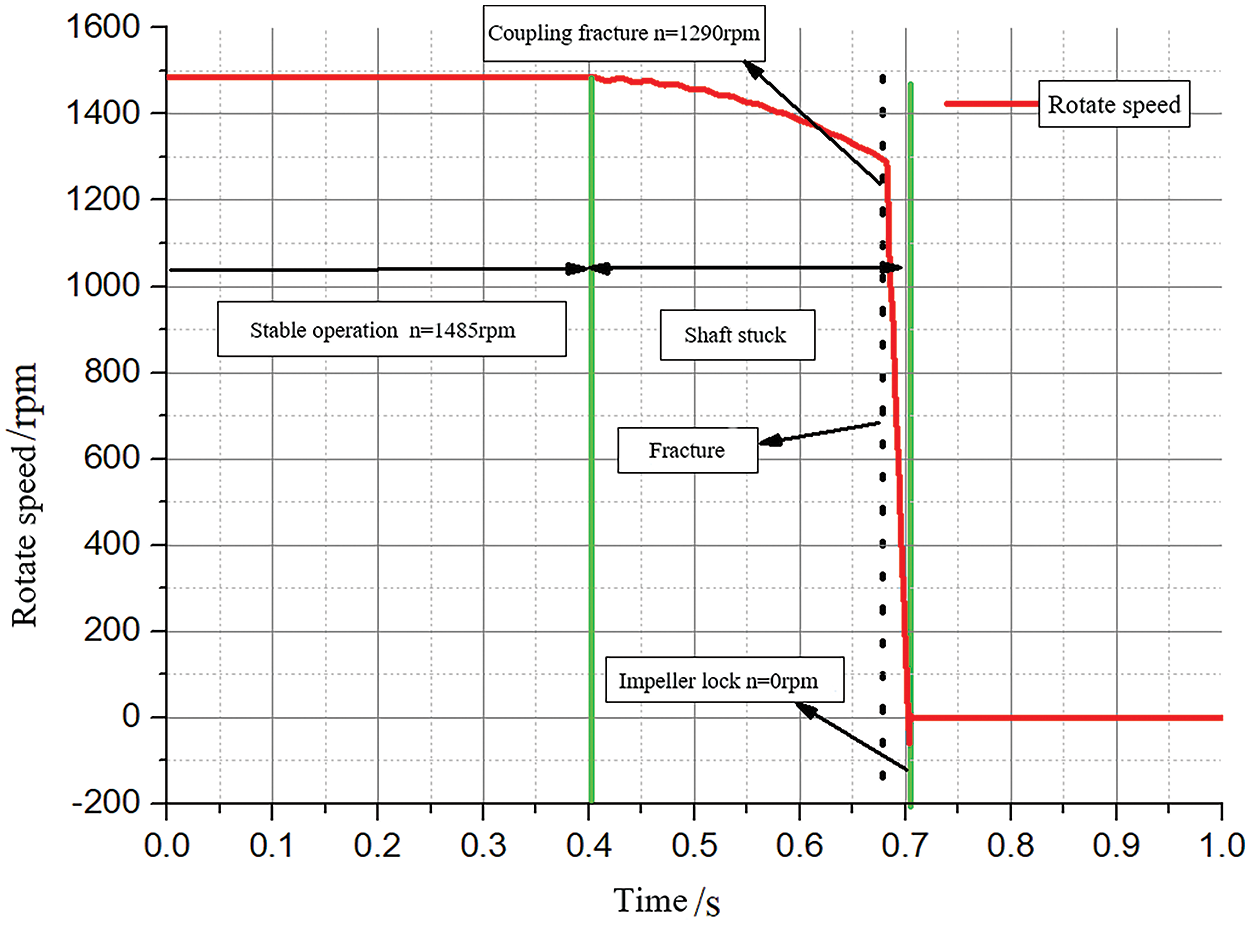
Figure 7: Rotor speed
The selection of time step size is critical in numerical calculations. A smaller time step brings the simulation closer to real transient flow, but excessively small sizes can lead to wastage of computational resources. Therefore, segmented settings are necessary. Prior to the accident, the time step size is 0.0003367 s, indicating a rotation of 3° by the impeller; The accident occurs at 0.404 s with a time step of 0.0002761 s before the speed fracture. During the fracture period from 0.682 to 0.9 s, the time step is set at 0.0002155 s, returning to 0.0003367 s after the fracture ends.
3.3.5 Distribution of Monitor Points and Monitor Walls in the Primary Loop System
Take the impeller’s rotation center as the coordinate origin, with the positive direction of the X-axis along the transition pipe and the positive direction of the Y-axis along the cold pipe section. The positive direction of the Z-axis is in a vertical downward orientation.
During the rotor seizure process, the change in coolant flow direction at the tube bend results in more severe pressure surge and hydraulic load compared to the straight section. To accurately measure the pressure surge and hydraulic load of the tube during rotor seizure, pressure monitoring points and monitoring wall division are arranged for each bend section of the circuit as depicted in Fig. 8.
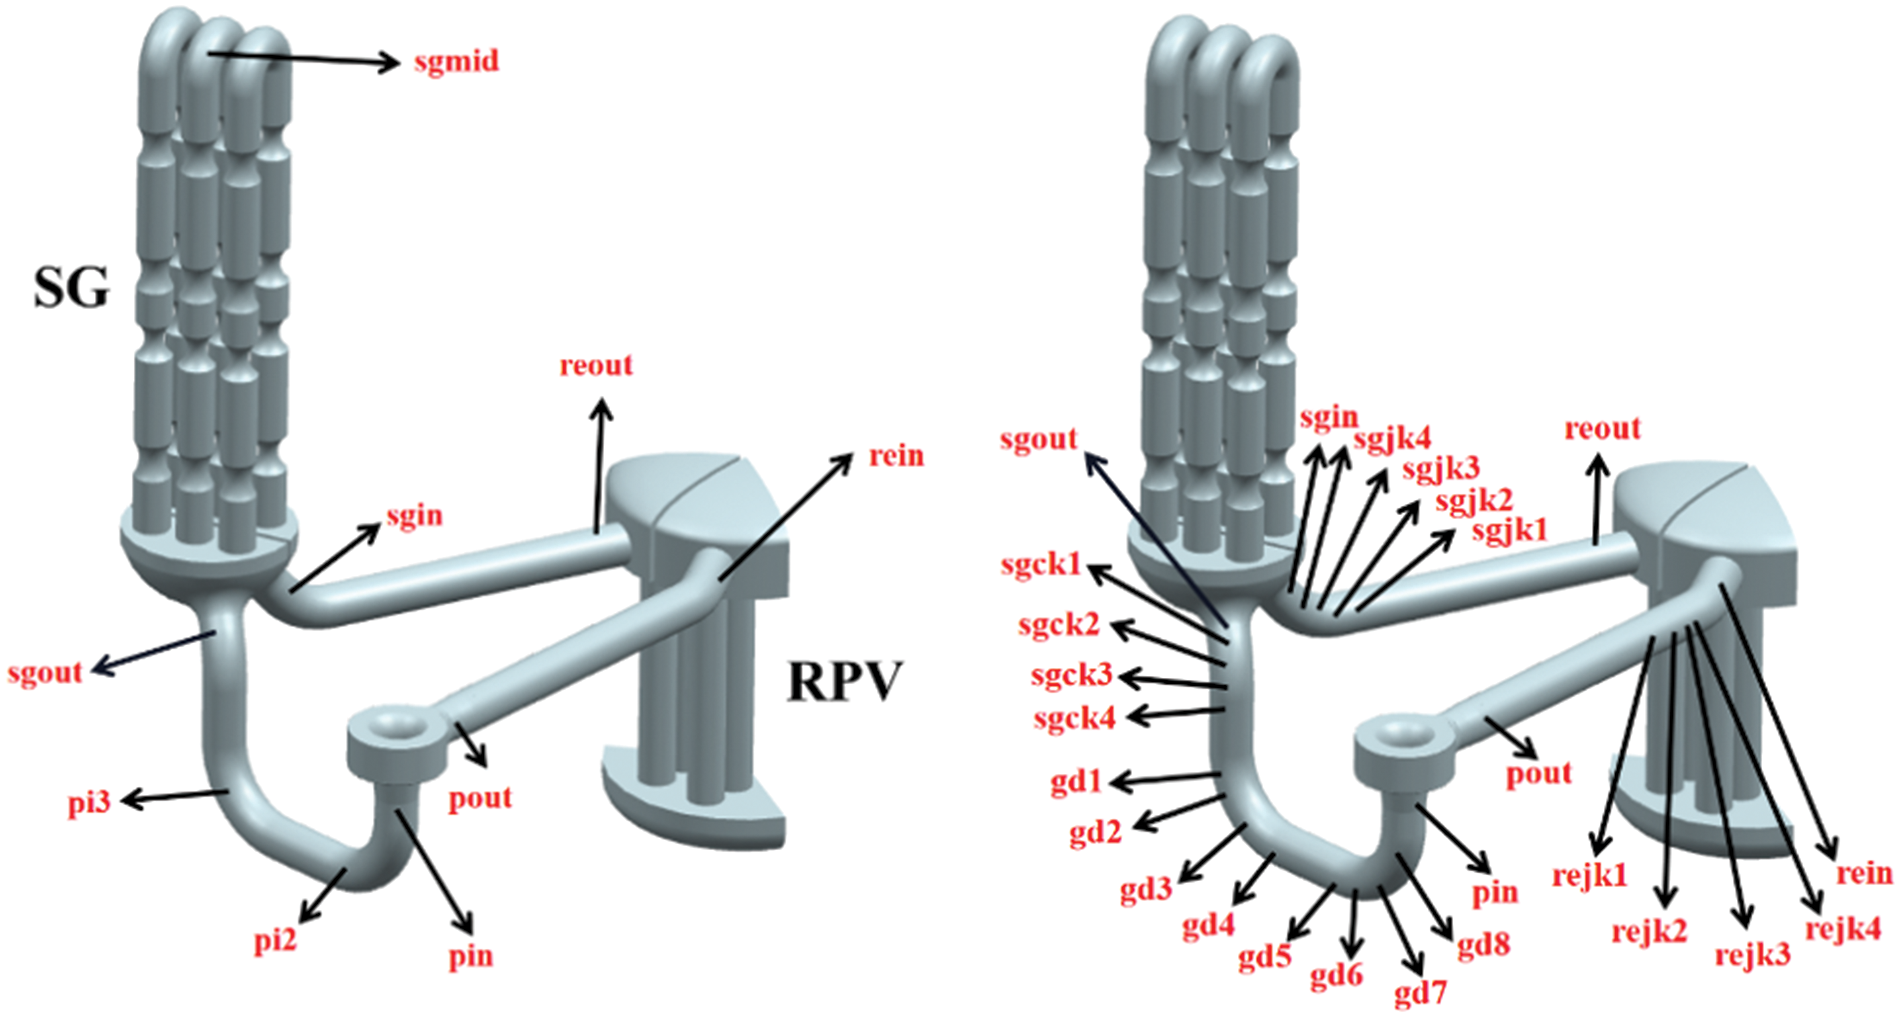
Figure 8: Transient pressure monitoring points and detection wall positions
A monitoring point ‘pinlet’ is installed in the center of the main pump inlet tube. Monitoring points ‘pi2’ and ‘pi3’ are arranged at the center of the two bends in the transition tube section, and each bend section is divided into four equal wall surfaces, namely ‘gd1~gd8’. Monitoring points ‘sginlet’,’sgmid’, and ‘sgoutlet’ are arranged in the center of the inlet, middle, and outlet tubes of the steam generator, and each elbow at the inlet and outlet is divided into four equal wall surfaces, ‘sgjk1-4’ and ‘sgck1-4’. Pressure monitoring points ‘rein’ and ‘reout’ are arranged at the centers of the inlet and outlet of the RPV, and the inlet section is divided into four equal wall surfaces, ‘rejk1-4’. A monitoring point ‘pout’ is installed in the center of the main pump outlet tube.
The hot test performance curve of the coolant pump is obtained by converting the cold test curve. At the rated operating point, the calculated head of the main pump is 92.1 m, and the test head is 90.8 m. The calculated head of the main pump is 1.2% higher than the test value; At the rated operating point, the calculated efficiency of the main pump is 82%, the test efficiency is 79%, and the calculated efficiency is 3% higher than the test value.
As is shown in Fig. 9, comprehensive analysis shows that considering the calculation error and the geometric uncertainty of the test main pump, the hydraulic performance of the main pump can meet the performance requirements of the original main pump hydraulic model, with an error value of within 4%, which meets engineering requirements and can replace the original coolant pump hydraulic model.
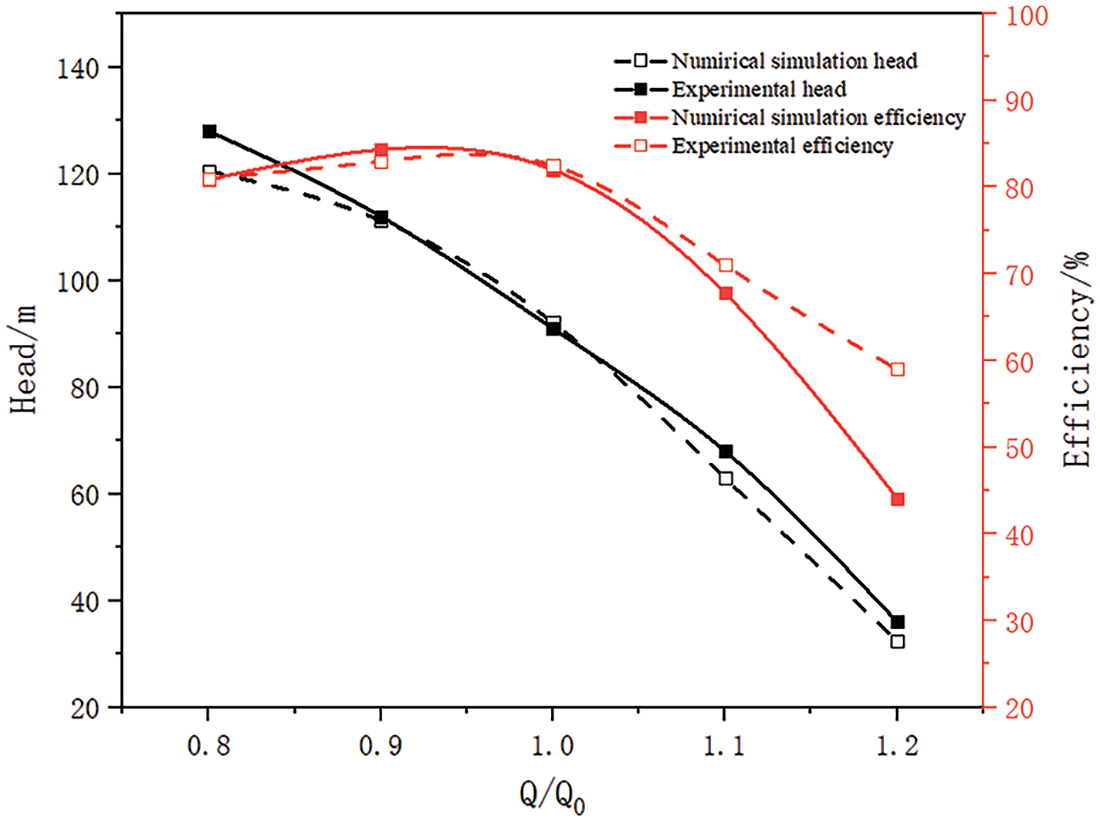
Figure 9: Experimental and computational external characteristic curves
4 Numerical Results and Analysis
4.1 The Pressure Surge of the Tube during Rotor Seizure Transition Process
Fig. 10 illustrates the variation of pressure over time during a rotor seizure accident at 9 pressure monitoring points in the circuit. It demonstrates that, under normal operation of the coolant pump, the pressure curve at each monitoring point exhibits slight oscillations within their respective numerical ranges. Due to resistance loss in flow passage components, the pressure gradually decreases from the main pump outlet to its inlet along the coolant movement direction through the loop, particularly when passing through the RPV and steam generator. Subsequently, the coolant pump resumes operation to compensate for energy loss.
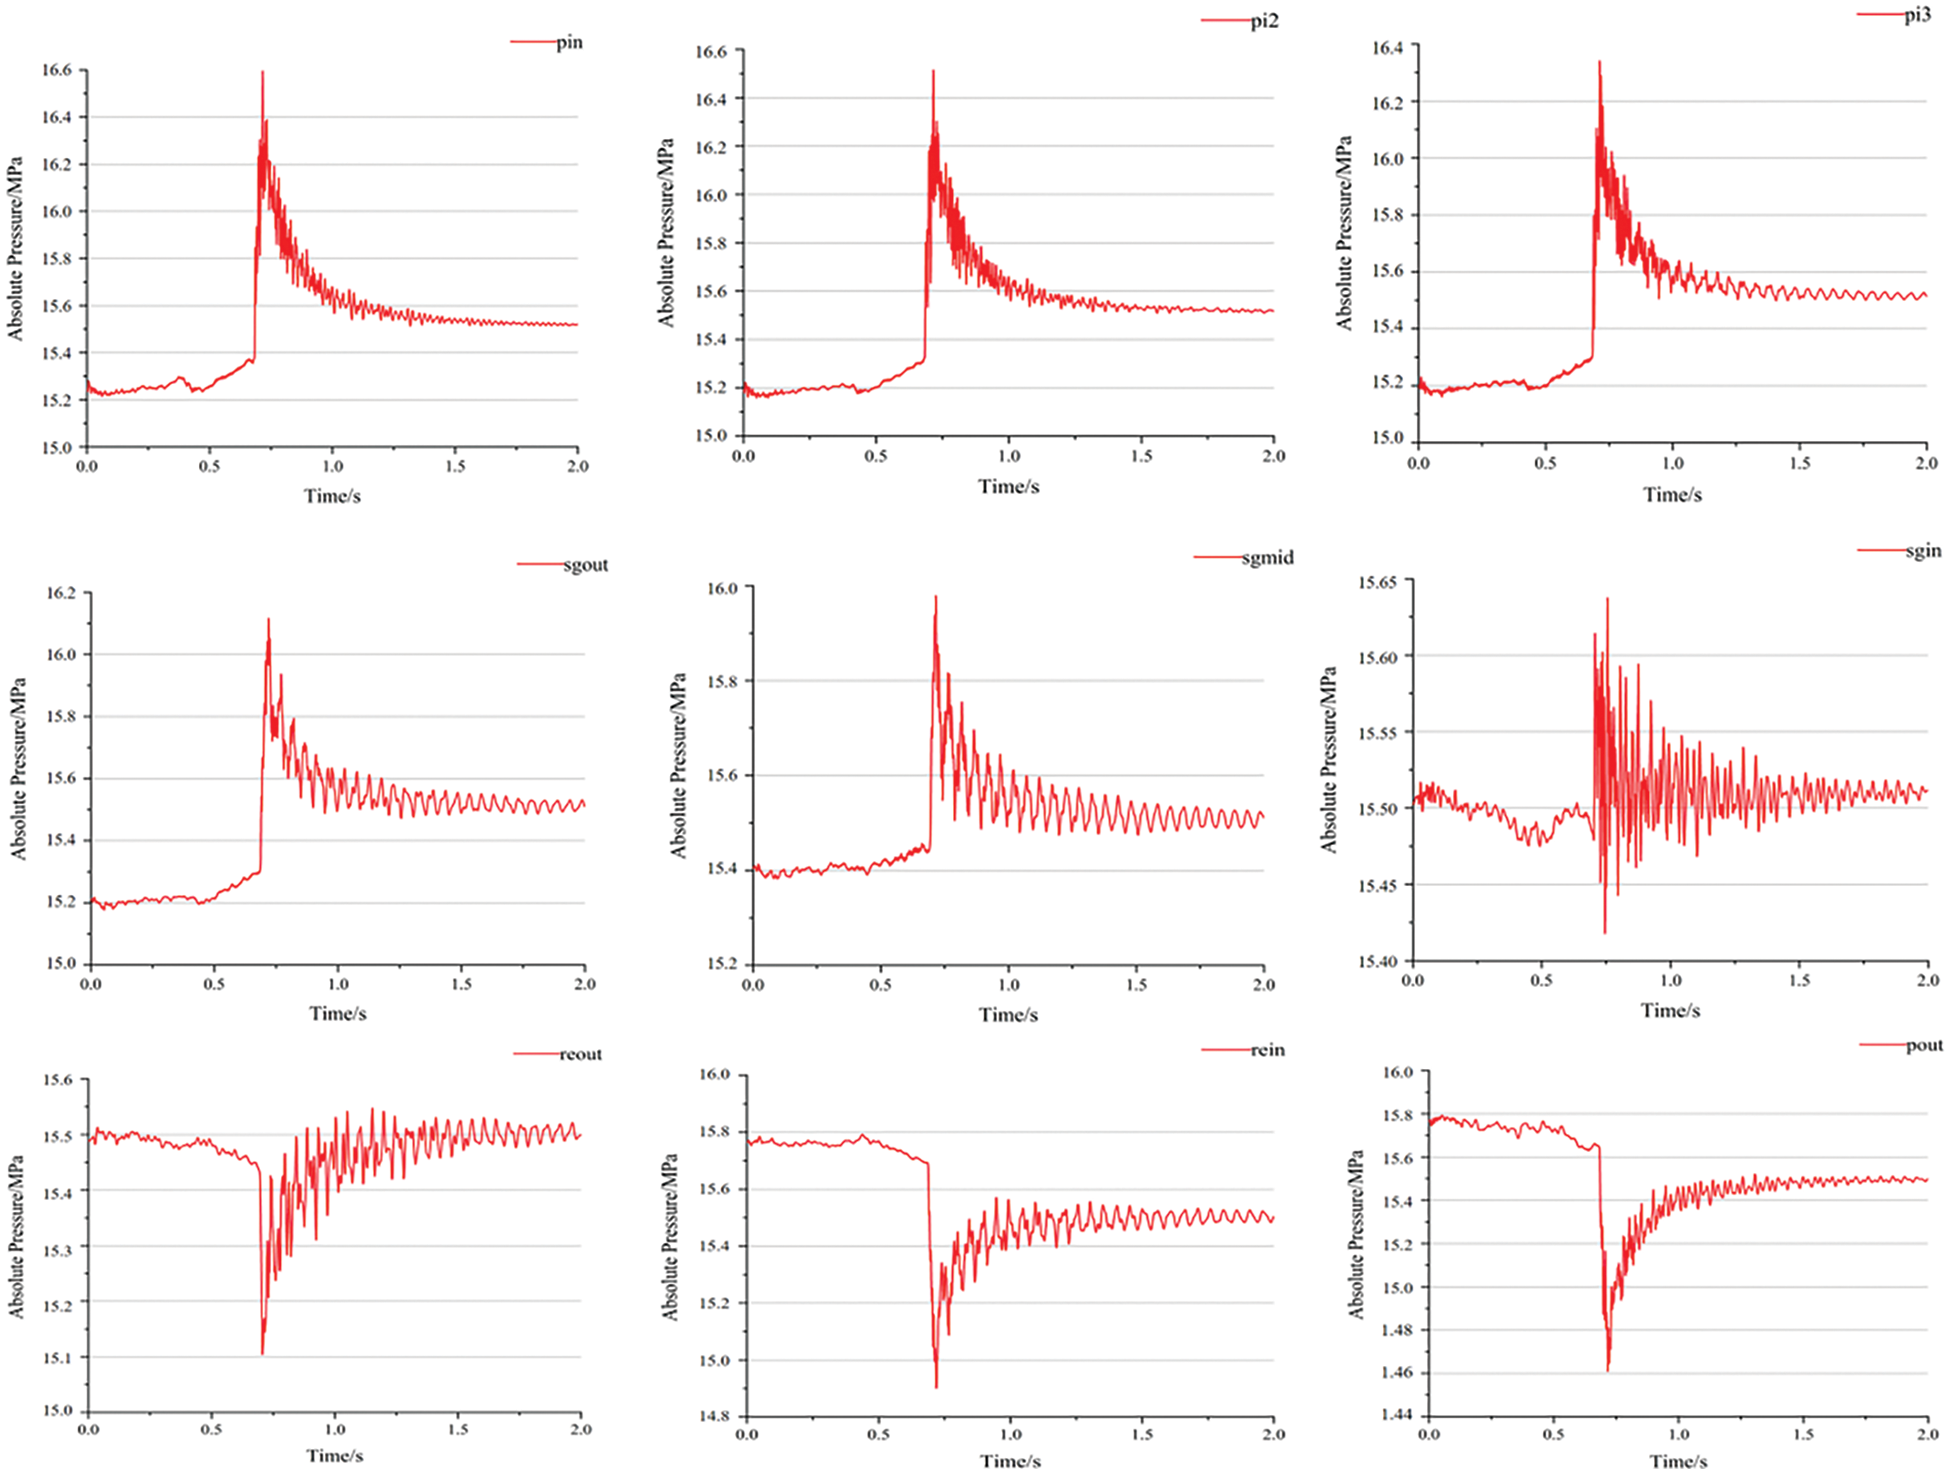
Figure 10: Change of pressure at the monitoring point in the circuit
After the rotor seizure accident, the impeller of the coolant pump seized, resulting in a blockage of fluid at the main pump inlet and causing an increase in pressure and density. However, due to the constant volume of the closed loop circulation system, the rotor seizure led to the compression of coolant from the main pump inlet to the steam generator inlet (increasing density), which subsequently caused expansion and stretching of coolant at other positions (from pump outlet to RPV) (decreasing density). This ultimately resulted in a decrease in pressure, with local sudden changes propagating along the tube in the form of sonic waves.
From the inlet of the coolant pump to the outlet of the steam generator, the pressure values of pin, pi2, pi3, sgout and sgmid rise sharply at first, and start to fluctuate and drop after reaching the peak values of 16.60, 16.52, 16.34, 16.12 and 15.98 MPa. When the transient pressure surge passes through the heat transfer tube of the steam generator, the transient pressure surge generated by the clamping stagnation process of the rotor is dissipated in the flow passage of the heat transfer tube, so that the transient pressure surge of the steam generator inlet section sgin is relative.
From the outlet of the reactor pressure vessel to that of the main pump, the pressure values of reout, rein, and pout initially drop steeply and then rise gradually after reaching the minimum values of 15.10, 14.90, and 14.61 MPa, respectively.
When the transition process of the rotor seizure is over, with the decrease of the flow in the loop, the pressure surge presents periodic oscillation and decay, and the pressure oscillation curves tend to be consistent and gradually stabilize at about 15.5 MPa which is the reference pressure.
As shown in Table 2 for the 9 peak transient monitoring points of the circuit, the results show that the maximum peak pressure in the transition process of rotor seizure is located at the inlet pinlet monitoring point of the coolant pump, with a value of 16.60 MPa, and the minimum valley pressure is located at the outlet Pout monitoring point of RPV, with a value of 14.61 MPa.

4.2 The Hydraulic Load of the Tube during Rotor Seizure Transition Process
When the rotor seizure accident occurs, the fluid will produce hydraulic pressure at the location where there is a change in flow area and direction within the loop during the process. Fig. 11 shows the change of the hydraulic load with time at two bends in the transition tube section. It can be seen that the load on the monitoring surfaces gd1–8 of the transition tube rises rapidly at first, and after reaching the peak value, it appears periodic oscillation attenuation. The two monitoring surfaces gd1 and gd4 on the outer side of the bend are slightly larger than the monitoring surfaces gd2 and gd3 on the inner side, and the load after the transition is slightly larger than the load during normal operation. The variation law of the monitoring surface load force is consistent with the pressure oscillation law of the pressure detection point at the bend center. The Table 3 shows the normal operation load of monitoring surface and the peak load of rotor seizure accident condition.
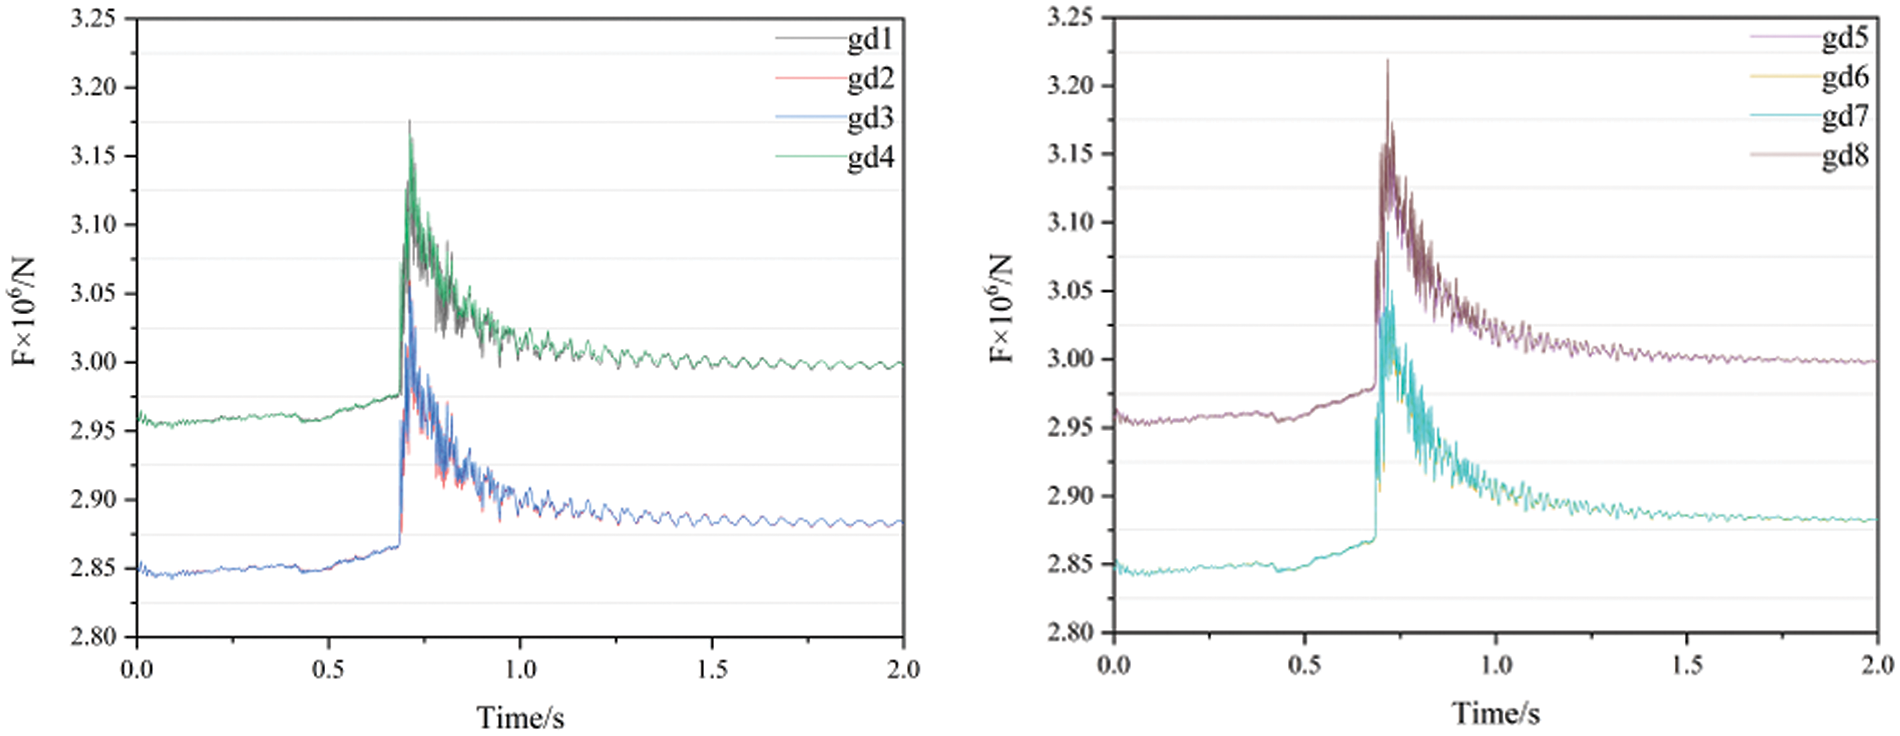
Figure 11: Change of hydraulic load at the monitoring face in the transition tube

Fig. 12 shows the change of the hydraulic load with time at two bends in the inlet and outlet tube of the steam generator. It can be seen that the load on the monitoring surface sgjk1~4 at the inlet of the steam generator rises first, and its peak value is less than the peak value of the outlet monitoring surface and then drop with oscillation. The load on monitoring surface sgck1~4 at the outlet of the steam generator rises rapidly first, and then drop with oscillation after reaching the peak value. The two monitoring surfaces sgjk1 near the outer side of the bend section, sgjk4 is slightly larger than the inner monitoring surface sgjk2, sgjk3, the same sgck1, sgck4 is slightly larger than the inner monitoring surface sgck2, sgck3, the load after the transition of the inlet monitoring surface is slightly smaller than the load during normal operation, and the load after the transition of the outlet monitoring surface is slightly larger than the load during normal operation. The variation law of the monitoring surface load force is consistent with the pressure oscillation law of the pressure detection point at the bend center. Table 4 shows the normal operation load of monitoring surface and the peak load of rotor clamping stagnation.
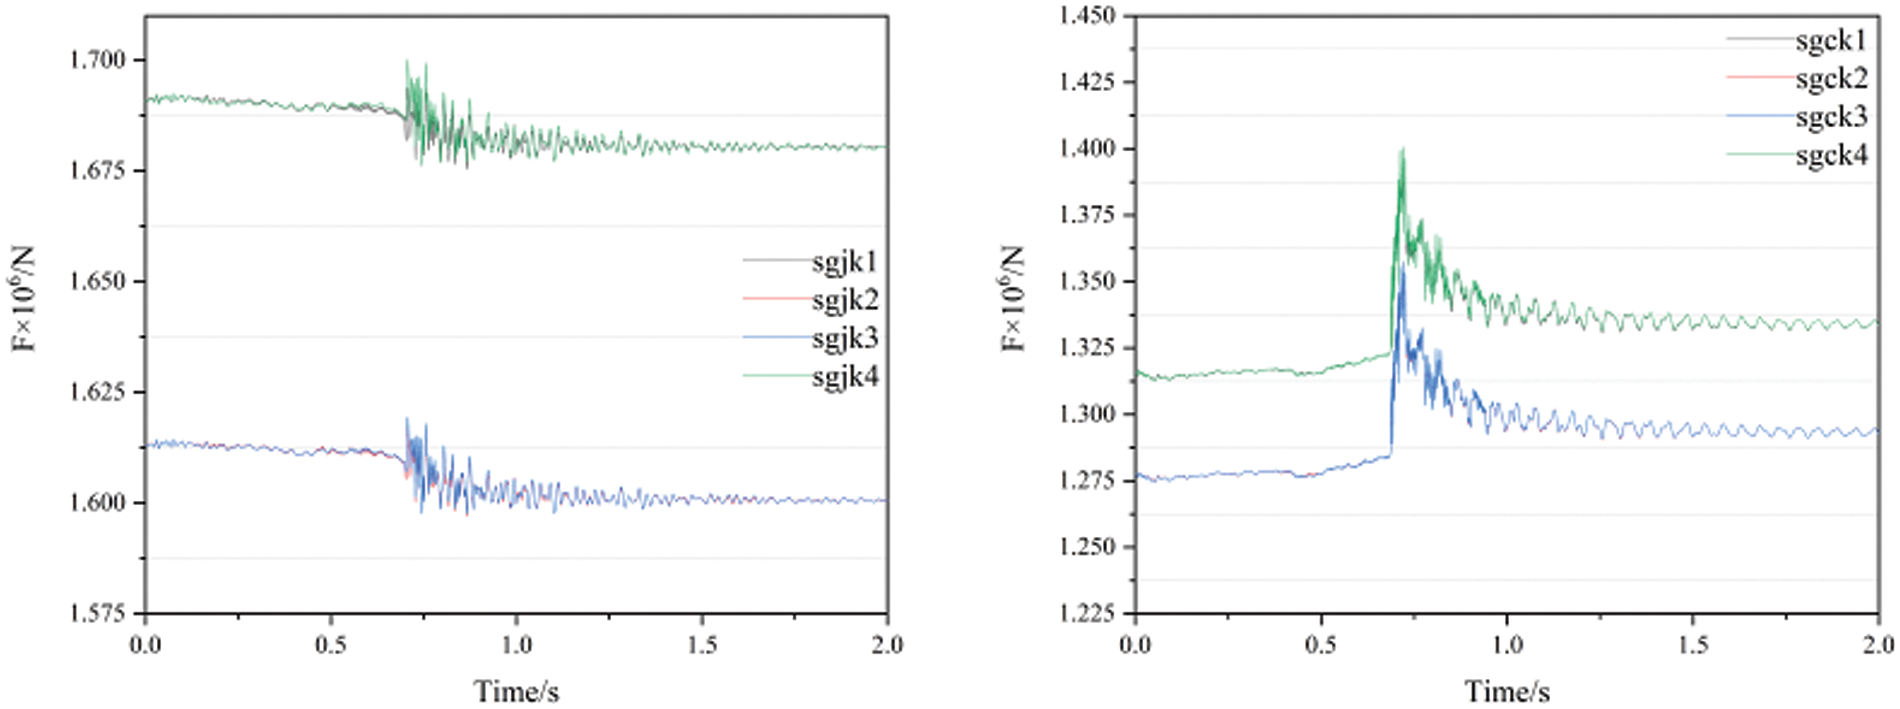
Figure 12: Change of hydraulic load at the inlet and outlet of steam generator

The Fig. 13 shows the change of hydraulic load with time at the bend of the RPV inlet. It can be seen that the load on monitoring surface rejk1~4 of the inlet firstly drops sharply and then rises to a stable state after reaching the valley value. The two monitoring surfaces rejk1 and rejk4 near the outer side of the bend are slightly greater than rejk2 and rejk3 of the monitoring surface near the inner side. After the transition, the load is slightly greater than the load during normal operation. The variation law of the monitoring surface load is consistent with the pressure oscillation law of the pressure detection point at the bend center. Table 5 shows the load of normal operation and the rotor seizure condition value.
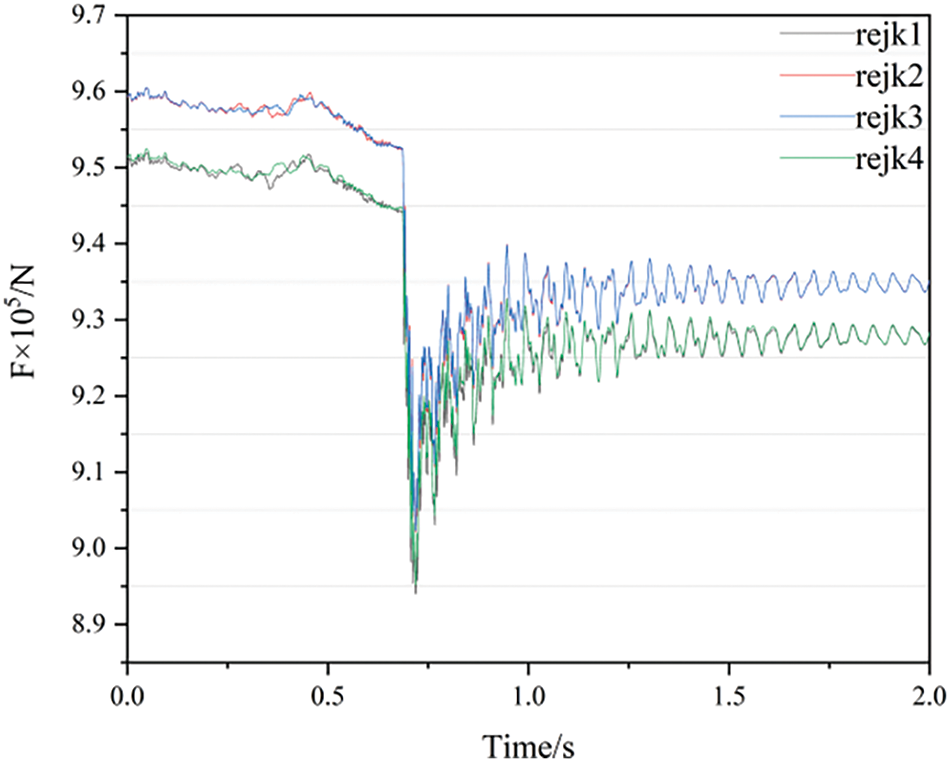
Figure 13: Change of hydraulic load at the inlet of the RPV

The maximum hydraulic load of the bend section during the transition process is located on the monitoring surface of the transition tube, with a value of 3.22 × 10⁶ N, minimum valley load located in the inlet section of the reactor pressure vessel, with a value of 8.94 × 10⁵ N.
4.3 The Pressure Distribution of SG and RPV
Four operating points T1, T2, T3, and T4 are defined for analysis. T1 is the operating point when the pump operates normally in 0 s, T2 is the operating point when the speed drops to 0 r/min for the first time, T3 is the operating point when the flow rate drops to 50% of the rated operating flow rate, and T4 is the operating point when the transition process ends and stabilizes again.
The Fig. 14 shows the pressure distribution on the wall of the steam generator at four operating points. At T1, when the main pump is operating normally, the pressure on the inlet side of the steam generator is greater than the outlet side pressure. As the fluid passes through the resistance element, the velocity increases, resulting in a lower pressure at the resistance element. After the rotor seizure accident at T2 moment, the pressure surge generated by the blockage of the pump inlet fluid was transmitted to the inlet position of the steam generator, causing the outlet wall pressure to be greater than the inlet pressure, and the resistance element also had a smaller pressure. At T3 moment, the flow rate significantly decreases, and the pressure surge is dissipated by the flow passage components. The outlet side is slightly larger than the inlet side wall, and the pressure is greater than other walls at the top U-shaped position due to a change in fluid direction. At T4 moment, the circuit has stabilized again, with a flow rate close to 0 m/s, and the pressure at this time is the system working reference pressure of 15.5 MPa. From the Fig. 15, it can be seen that the pressure change at the inlet side of the steam generator is relatively small, while the pressure surge on the outlet side is more significant. The reason is that during the rotor seizure transition process, when the transient pressure surge passes through the heat transfer tube of the steam generator, energy is dissipated inside the flow channel of the heat transfer tube, resulting in a more stable transient pressure surge in the inlet section of the steam generator.
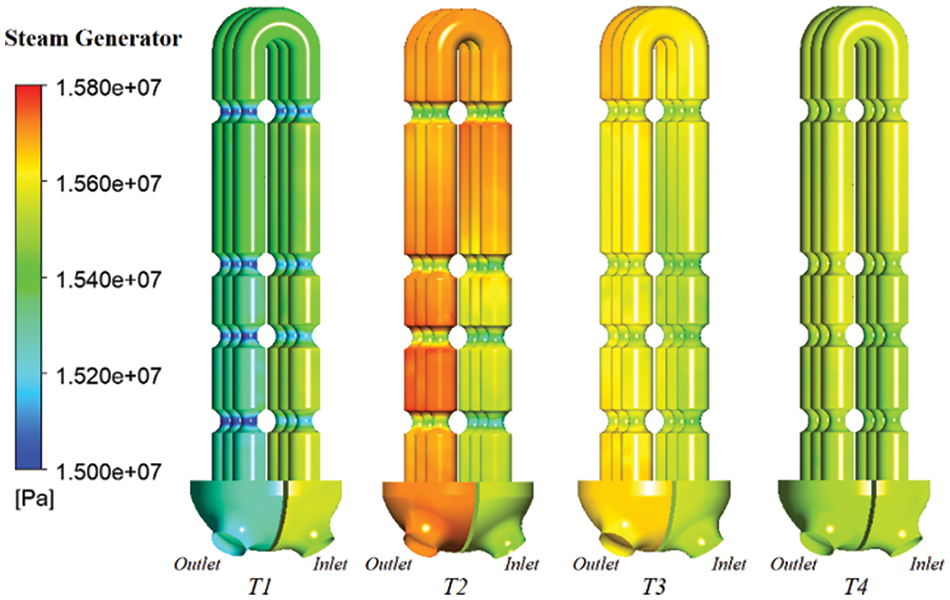
Figure 14: The pressure distribution of SG
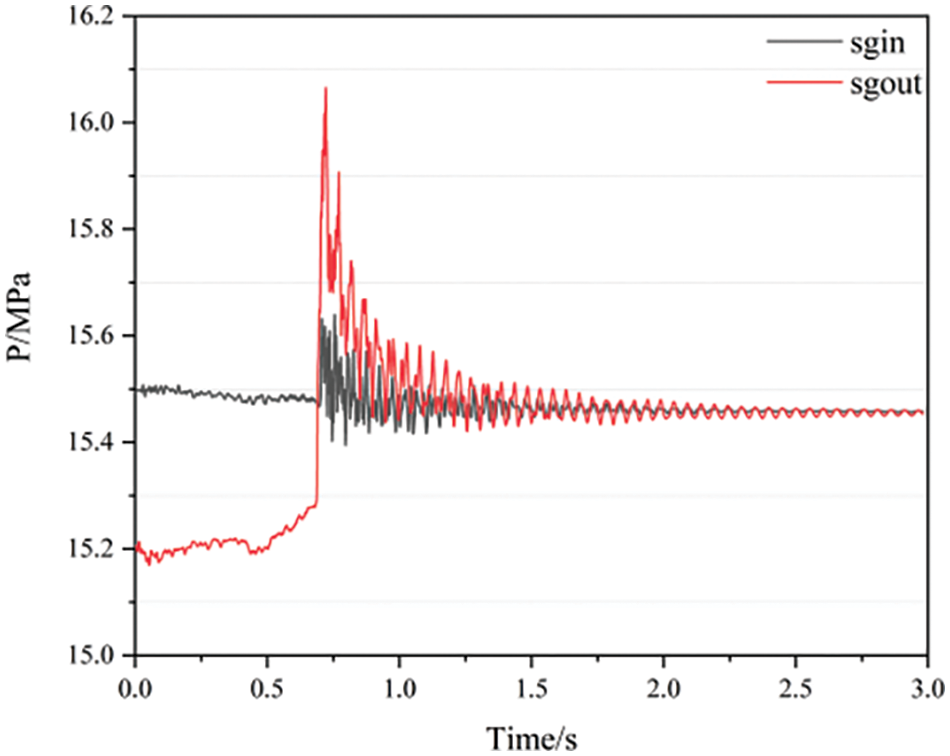
Figure 15: Change of pressure of sg inlet and outlet
The Fig. 16 shows the pressure distribution on the wall of the reactor pressure vessel at four operating points. At T1 moment, when the main pump is operating normally, the pressure on the inlet side of the steam generator wall is greater than the pressure on the outlet side. After the rotor became stuck at T2 moment, the coolant from the main pump outlet to the reactor pressure vessel outlet expanded and stretched, resulting in a decrease in pressure. The resulting pressure drop wave was transmitted to the inlet of the steam generator, causing the outlet wall pressure to be lower than the inlet pressure. At T3 moment, the flow rate significantly decreases, and the pressure surge is dissipated by the flow passage components. The inlet side pressure is slightly lower than the outlet side wall surface. At T4 moment, the circuit has stabilized again, with a flow rate close to 0 m/s, and the pressure at this time is the system working reference pressure of 15.5 MPa. According to the pressure curve, the pressure surge on the inlet side of the reactor pressure vessel is more significant, while the pressure surge at the outlet is smaller. The reason is that during the rotor stagnation transition process, when the transient pressure surge passes through the reactor pressure vessel, energy is dissipated inside the pressure vessel, resulting in a more stable transient pressure surge in the outlet section. From Fig. 17, it can be seen that the pressure change at the inlet side of the RPV is greater than that at the outlet. The reason is that the inlet of the RPV is closer to the outlet of the main pump, and during the rotor seizure transition process, when the transient pressure surge passes through the pipeline of the RPV, energy is dissipated inside the pipeline.
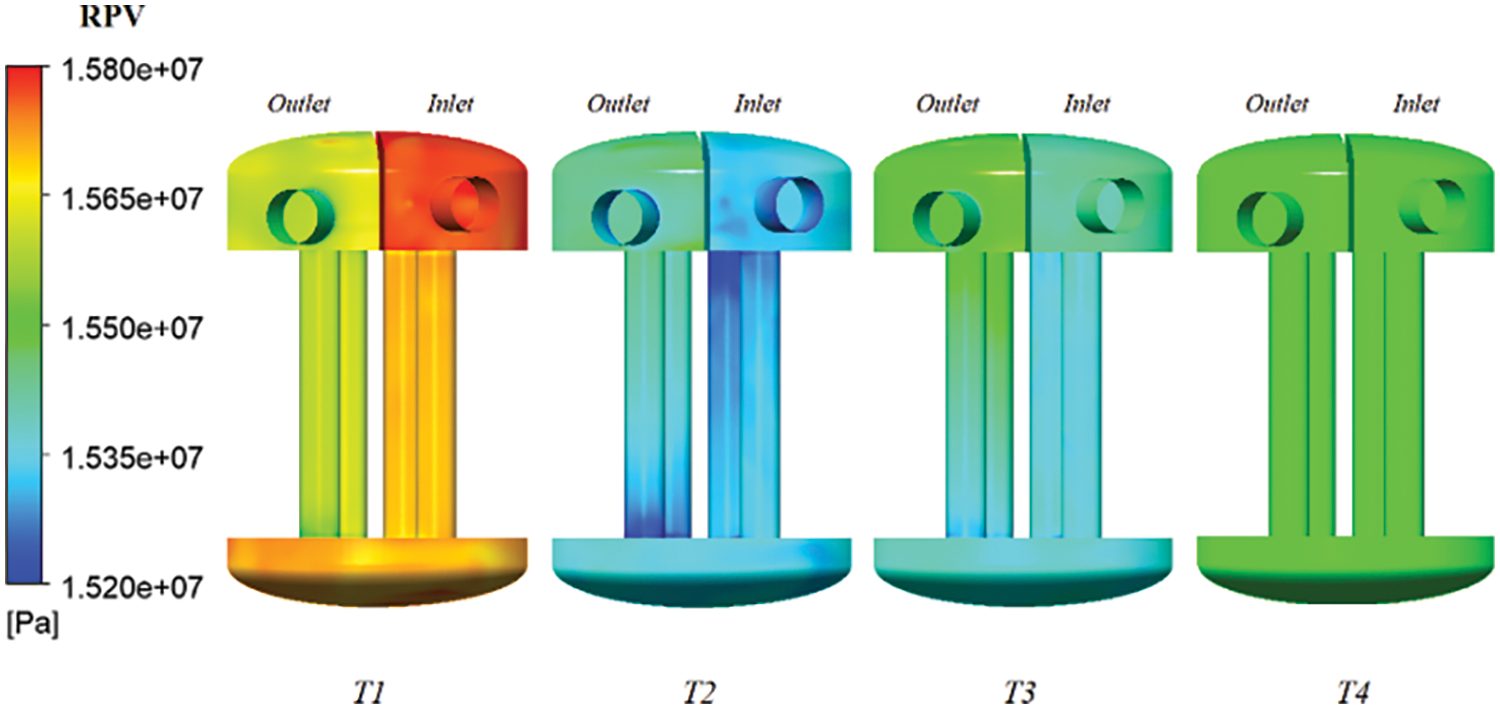
Figure 16: The pressure distribution of RPV
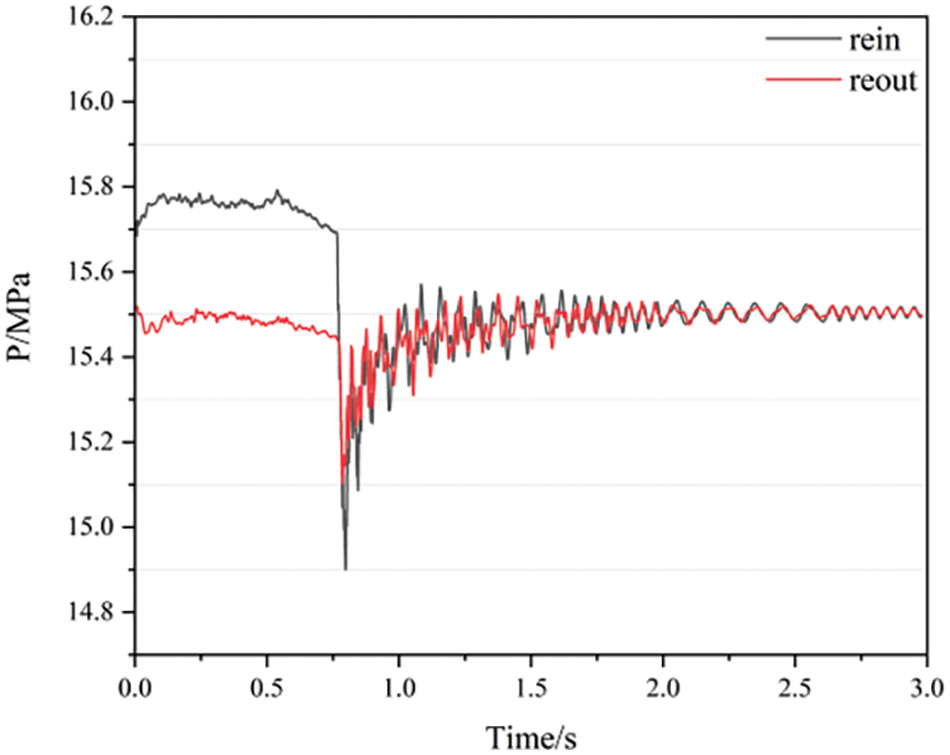
Figure 17: Change of pressure of RPV inlet and outlet
This article is based on a simplified three-dimensional model of the reactor primary loop system and utilizes an unsteady numerical prediction method. It obtains the transient pressure surge law and component hydraulic load response in the primary loop under rotor seizure accidents, providing technical references and data support for the design and dynamic safety assessment of components in the reactor primary loop system.
(1) The rotor seizure accident caused the water hammer phenomenon, causing a sudden change in local pressure in the tube and transmitting along the circuit in the form of pressure surge. The peak pressure in the circuit is located at the pump inlet, with a maximum pressure of 16.6 MPa, the pressure valley is located at the pump outlet, with a minimum pressure of 14.61 MPa. The pressure surge is transmitted and dissipated along the curcuit from these two positions.
(2) After the rotor seizure accident, hydraulic loads will be generated at locations where the flow area and direction change during the flow process in the circuit. The maximum load is located at the bend near the inlet of the pump, with a value of 3.22 × 10⁶ N, the minimum load is located near the bend at the inlet of the reactor pressure vessel, with a value of 8.94 × 10⁵ N.
(3) After the rotor seizure accident, because it is close to the inlet of the main pump, the pressure at the outlet of the steam generator is relatively high. The top of the U-shaped tube generates more pressure due to a change in flow direction, and the pressure at the inlet and resistance components is relatively low. Similarly, the pressure drop generated at the inlet of the reactor pressure vessel is more obvious due to the closer to the outlet of the main pump.
Acknowledgement: None.
Funding Statement: The authors received no specific funding for this study.
Author Contributions: The authors confirm contribution to the paper as follows: study conception and design: Congxin Yang, Yanlei Guo; data collection: Haoyu Cui, Sen Zhao, Tianzhi Lv; analysis and interpretation of results: Haoyu Cui; draft manuscript preparation: Haoyu Cui. All authors reviewed the results and approved the final version of the manuscript.
Availability of Data and Materials: The datasets generated during and/or analyzed during the current study are available from the corresponding author on reasonable request.
Ethics Approval: Not applicable.
Conflicts of Interest: The authors declare no conflicts of interest to report regarding the present study.
References
1. Wu L, Xu Y, Cao R, Liu C, Li P, Zhang Z. Development of Hualong No.1 reactor and primary circuit system. Nucl Power Eng. 2019;40(S1):1–7. [Google Scholar]
2. Gao H, Gao F, Zhao X, Chen J, Cao X. Analysis of reactor coolant pump transient performance in primary coolant system during start-up period. Ann Nucl Energy. 2013;54(2):202–8. doi:10.1016/j.anucene.2012.11.020. [Google Scholar] [CrossRef]
3. Alatrash Y, Kang H, Yoon H, Seo K, Chi DY, Yoon J. Experimental and analytical investigations of primary coolant pump coastdown phenomena for the Jordan Research and Training Reactor. Nucl Eng Des. 2015;286(6):60–6. doi:10.1016/j.nucengdes.2015.01.018. [Google Scholar] [CrossRef]
4. Zuo Q, Qiu S, Lu W, Tian W, Su G, Xiao Z. Water hammer characteristics of integral pressurized water reactor primary loop. Nucl Eng Des. 2013;261:165–73. doi:10.1016/j.nucengdes.2013.03.038. [Google Scholar] [CrossRef]
5. Ni D, Yang M, Gao B, Zhang N, Li Z. Flow unsteadiness and pressure pulsations in a nuclear reactor coolant pump. J Mech Eng. 2016;62(4):231–42. doi:10.5545/sv-jme.2015.3192. [Google Scholar] [CrossRef]
6. Su S, Wang P, Xu Z, Ruan XD, Kong WJ. Research on pressure pulsation and radial force during the start-up process of nuclear main pumps. Nucl Power Eng. 2017;38(3):110–4. [Google Scholar]
7. Long Y, Wang D, Yin J, Hu Y. Experimental investigation on the unsteady pressure pulsation of reactor coolant pumps with non-uniform inflow. Ann Nucl Energy. 2017;110:501–10. doi:10.1016/j.anucene.2017.07.010. [Google Scholar] [CrossRef]
8. Lu Y, Zhu R, Fu Q, Wang X, An C, Chen J. Research on the structure design of the LBE reactor coolant pump in the lead base heap. Nucl Eng Technol. 2018;51(2):546–55. doi:10.1016/j.net.2018.09.023. [Google Scholar] [CrossRef]
9. Wang XL, Lu YG, Zhu RS, Fu Q, Chen YM, Zhong WY. Experimental study on transient characteristics of reactor coolant pump under rotor seizure accident. Ann Nucl Energy. 2019;136:107039. [Google Scholar]
10. Azzoune M, Boumedien A, Lababsa D, Boulheouchat MEH, Ameur A. Analysis of a loss-of-flow accident resulting from the primary pump shaft break transient of the NUR research reactor. J Nucl Sci Technol. 2019;56(1):130–45. doi:10.1080/00223131.2018.1532845. [Google Scholar] [CrossRef]
11. Wang XL, Lu YG, Zhu RS, Fu Q, Chen YM, Zhong WY. Study on the transient evolution law of internal flow field and dynamic stress of reactor coolant pump under rotor seizure accident. Ann Nucl Energy. 2019;133(10):35–45. doi:10.1016/j.anucene.2019.05.001. [Google Scholar] [CrossRef]
12. SaemI S, Raisee M, Cervantes MJ, Nourbakhsh A. Computation of two- and three-dimensional water hammer flows. J Hydraul Res. 2018;57(3):386–404. [Google Scholar]
13. Wang XL, Xu W, Wang HL, Zhu RS, Zhao YY, Zhong HZ. An experimental study on transient characteristics of a nuclear reactor coolant pump in coast-down process under power failure condition. Front Energy Res. 2020;8:579291. doi:10.3389/fenrg.2020.579291. [Google Scholar] [CrossRef]
14. Ye D, Lai X, Luo Y, Liu A. Diagnostics of nuclear reactor coolant pump in transition process on performance and vortex dynamics under station blackout accident. Nucl Eng Technol. 2020;52(10):2183–95. [Google Scholar]
15. Li W, Lv H, Zhang J. Development and verification of LOCA hydraulic load analysis software HLPS. Nucl Power Eng. 2021;42(4):159–65. [Google Scholar]
16. Behroozia M, Vaghefi M. Numerical investigation of water hammer due to transient in parallel pumps. Int J Civil Eng. 2021;19(12):1415–25. doi:10.1007/s40999-021-00640-w. [Google Scholar] [CrossRef]
17. Li DH, Li YB, Zhang F, Guo YL, Yang CX, Wang XY. Study on hydraulic characteristics of reactor coolant pump shutdown transition process based on primary circuit closed system. Process Energy Syst Eng. 2022;9:130. doi:10.3389/fenrg.2021.808393. [Google Scholar] [CrossRef]
18. Lu Y, Long Y, Zhu R, Wang Z, Wang X. Transient structural load characteristics of reactor coolant pump rotor system in rotor seizure accident. Ann Nucl Energy. 2021;164:108631. [Google Scholar]
19. Liu A, Research on pressure fluctuation and energy characteristics of reactor cooling pump under idling operation. Xihua University: China; 2022. [Google Scholar]
20. An C, Li H, Chen Y, Zhu R, Fu Q, Wang X. Research on flow resistance characteristics of reactor coolant pump under large break LOCA at inlet. Nucl Eng Des. 2022;395(10–11):111856. doi:10.1016/j.nucengdes.2022.111856. [Google Scholar] [CrossRef]
21. Song Y, Huang S, Xu R, Zhang Z, Yin J, Wang D. Influence mechanism of the non-uniform inflow on performance of reactor coolant pump. Ann Nucl Engery. 2023;180:109467. doi:10.1016/j.anucene.2022.109467. [Google Scholar] [CrossRef]
22. Li Y, Qu Z, Guo Y, Li DH, Yang CX, Pan J, et al. Study on the hydrodynamic characteristics of the transient process of a nuclear main pump stuck shaft accident. Nucl Power Eng. 2023;2(177):177–84. [Google Scholar]
23. Liu L, Yin J, Chen Y, Feng L, Liu L. Influence of non-uniform inflow on performance of reactor coolant pump and improved design. Nucl Eng Des. 2023;410:112402. [Google Scholar]
24. Cui H, Tan X, Wang Y, Kuang C, Su S. Study on transient hydraulic load of reactor coolant system under the condition of reactor coolant pump rotor seizure. Nucl Power Eng. 2024;45(1):230–6. [Google Scholar]
25. Yakhot V, Orszag SA. Renormalization group analysis of turbulence. I. Basic theory. J Sci Comput. 1986;1(1):3–51. doi:10.1007/BF01061452. [Google Scholar] [CrossRef]
26. Zhang W. Adjustment and matching of equivalent flow resistance of small tube clusters as major components of nuclear power systems. Lanzhou University of Technology: China; 2022. [Google Scholar]
27. Foldyna J, Ríha Z, Sitek L, Švehla B. Numerical simulation of transmission of acoustic waves high-pressure system. In: International Congress on Ul Trasonics, 2007; Vienna, Austria. [Google Scholar]
Cite This Article
 Copyright © 2024 The Author(s). Published by Tech Science Press.
This work is licensed under a Creative Commons Attribution 4.0 International License , which permits unrestricted use, distribution, and reproduction in any medium, provided the original work is properly cited.


 Submit a Paper
 Propose a Special lssue
 View Full Text
 Download PDF
 Downloads
 Citation Tools