 Open Access
ARTICLE
Numerical Simulation of Gas-Solid Flow Processes in an Ash Conveying Pipeline with Multiple Feeds
1 College of Transportation, Ludong University, Yantai, 264025, China
2 School of Energy and Power Engineering, Northeast Electric Power University, Jilin, 132012, China
* Corresponding Author: He Wang. Email:
Fluid Dynamics & Materials Processing 2024, 20(12), 2721-2739. https://doi.org/10.32604/fdmp.2024.055174
Received 19 June 2024; Accepted 13 September 2024; Issue published 23 December 2024
Abstract
Pneumatic conveying technology, as an efficient material transportation method, has been widely used in various industrial fields. To study the powder transportation in horizontal ash conveying pipes, this study relies on the Computational Particle Fluid Dynamics (CPFD) numerical method. The characteristics of the gas-solid two-phase flow under continuous air supply conditions are analyzed, and the effects on particle movement of factors such as feed port spacing, inlet air velocity, and the number of discharge ports are explored accordingly. The research results show that when the inlet velocity is 5 m/s, adjacent discharged particles come into contact after 8 s. As the inlet air velocity increases, the contact time between adjacent discharge ports is shortened. When the feed port spacing increases from 0.5 to 2 m, the dust accumulation thickness decreases by about 0.6 times. Additionally, when the spacing reaches a certain value, the rate of decrease in dust accumulation thickness begins to diminish.Keywords
Pneumatic conveying is a method of transporting solid or liquid phases over long distances through the use of airflow, typically within enclosed pipelines. This method is widely used in various industries for particle transport, such as energy fuel transport, cement transport, granular drug transport, and dust transport [1–3]. Fig. 1 is the electrostatic precipitator pneumatic ash conveying equipment. This mode of transportation offers advantages such as simple systems, convenient operation, and easy implementation of automatic control. However, pneumatic conveying consumes a significant amount of energy and is generally suitable for transporting small-diameter particles [4].
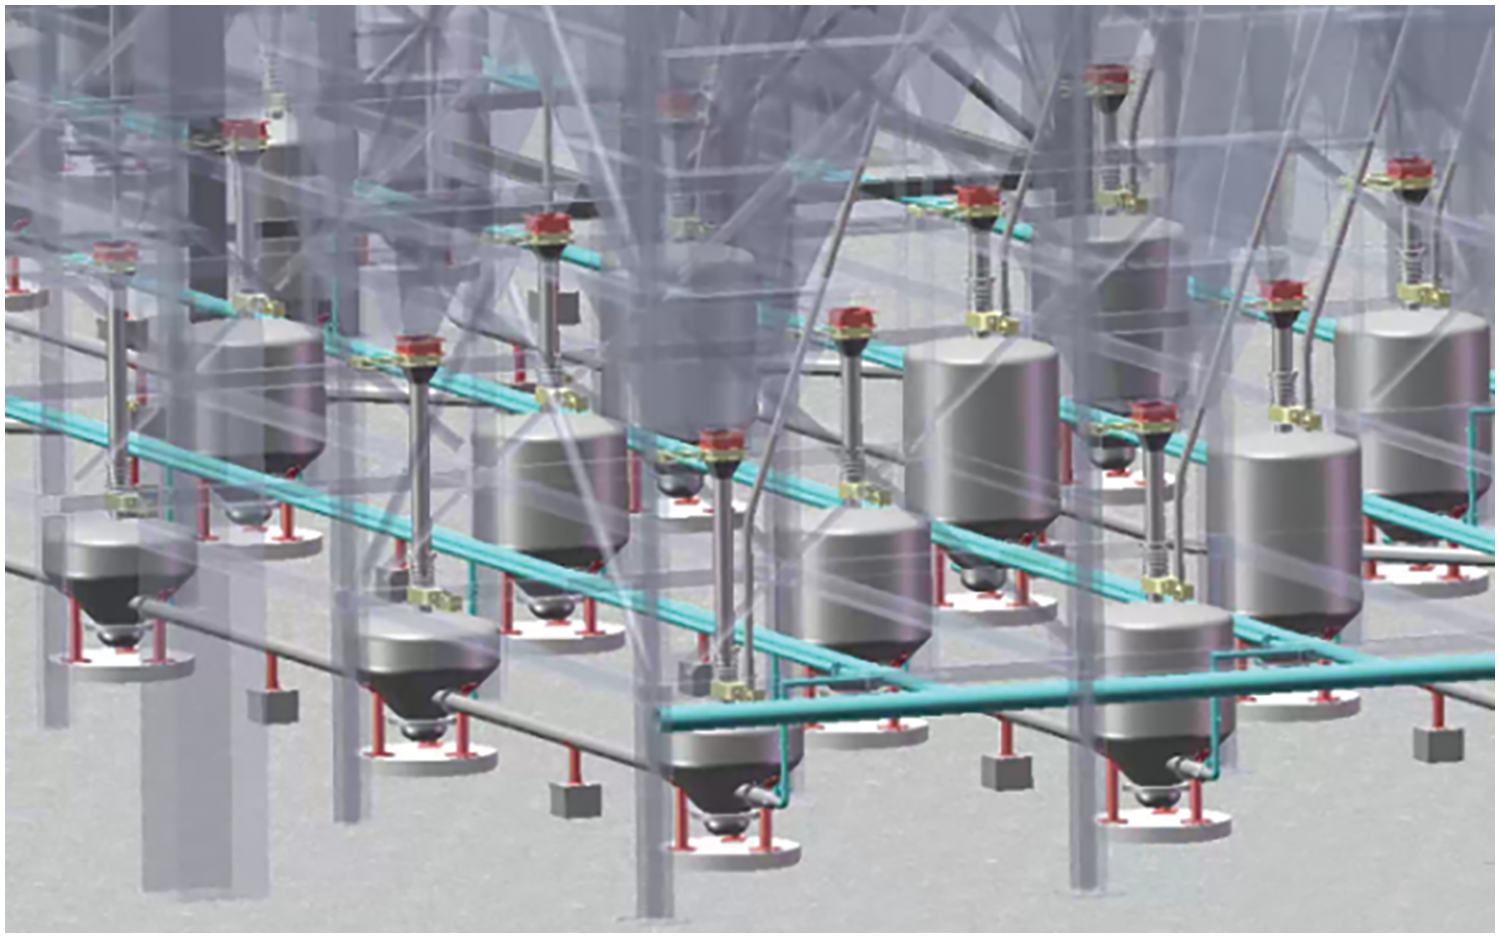
Figure 1: Electrostatic precipitator pneumatic ash conveying equipment
In recent years, to overcome the drawbacks of dilute-phase pneumatic conveying such as low solid-to-gas ratio, low transmission efficiency, frequent particle breakage, severe pipeline wear, and high gas consumption and energy consumption, significant progress has been made in the research on dense-phase pneumatic conveying technology [5,6]. With the deepening research by numerous researchers on the theory of gas-solid two-phase flow during the pneumatic conveying process, whether in theoretical or experimental aspects, important progress has been achieved [7,8].
In terms of experimental research on pneumatic conveying, Gourav et al. [7] studied the motion patterns of 58 kinds of powder during pneumatic conveying and classified the flow patterns of these powders by Froude number terms based on loose packing density, which provided a reference for predicting the flow patterns of powder in tubes. Rajabnia et al. [9] studied the aeration degassing behavior of four different materials, and the results showed that the time constant ratio had a greater effect on the cotton seed in the tube, and when the value was the lowest, the cotton seed would show obvious embolization flow in batch feeding and continuous pneumatic conveying. Rajabnia et al. [10] proposed an optimization algorithm to study the pneumatic conveying of four different biomass materials, demonstrating that the optimization model can predict pressure with an error range of 30%.
In terms of numerical theory research on pneumatic conveying, Erken et al. [11] used Computational Fluid Dynamics (CFD) coupled Discrete Element Method (DEM) to compare the flow patterns of particles with different shapes in horizontal pipes and took into account the effects of particle size, length-diameter ratio and pressure gradient on flow stability. Orozovic et al. [12] constructed a numerical model of single slug flow based on the finite difference method, and solved the stability problem of coupling the high dynamic characteristics of a single slug with stable solid and gas feeds. Yang et al. [13] used comparison metrics such as injection ratio, energy consumption ratio, residual particle mass, and total energy consumption ratio to obtain optimized structural parameters for gas-solid ejectors under various indices. This provides a reference for the design of gas-solid ejectors and pneumatic conveying systems under different operating conditions.
The above research has laid a theoretical foundation for the optimization design of related technology of pneumatic conveying powder in horizontal tubes. However, the situation of simultaneous feeding of multiple feed ports is rarely introduced, and the opening of material ports cannot be ignored in the conveying process of materials in horizontal tubes. This paper aims to conduct numerical research based on the Computational Particle Fluid Dynamics (CPFD). The characteristics and laws of gas-solid two-phase flow process are deeply explored to provide new ideas and methods for the development and optimization of pneumatic conveying technology.
2 Research Object and Theoretical Basis
Fig. 2 is the grid diagram of the research object in this paper. There are four dust blanking ports in thess horizontal direction of the conveying pipeline. The diameter of the air inlet is 0.15 m, the diameter of the dust blanking port is 0.1 m, the total length L is 8 m, and the spacing is d. The air enters from the left and right, and the dust enters from the blanking port. In Fig. 2, the outlet is defined as a pressure outlet boundary, the air inlet is defined as a velocity inlet boundary, and the dust inlet is defined as a mass inlet boundary with no air inflow, and the mass flow rate of the dust inlet is 1 kg/s. All other boundaries are defined as wall boundaries. Given that the range of inlet velocities studied in this paper is 5 to 13 m/s, the airflow entering the conveying pipe is theoretically expected to exit through the outlet within 1.6 s. To ensure stable discharge of powder at the outlet position, a simulation duration of 10 s was determined through preliminary simulations for comparative analysis.

Figure 2: Study objects and grids
This study employs the Euler-Lagrange method to solve the motion processes of particles and fluid [7]. The interaction relationship between the discrete phase particles and the fluid phase is described using the Navier-Stokes equations. The gas-phase turbulence process is described by LES numerical model, and accorded to the scale of vortex structure, the corresponding method is used to solve the problem. In the source term particle group method. When the vortex structure size is relatively large, the Navier-Stokes equation is selected for calculation, when the scale of vortex structure is small, Smagorinsky model is used. In the process of pneumatic conveying, there is an interaction force between gas and solid powder. In the numerical model constructed in this paper, the drag force model is used to describe the interaction force [14]. The Smagorinsky model is represented as [15]:
Among them,
Snider [16] proposed a coupling solution method using the Euler-Lagrangian method to improve the efficiency of solving the three-dimensional motion of particles. Compared to other multiphase flow numerical methods, this method constructs “particle clusters” to bundle a certain number of physically consistent particles into a computational particle. During the gas phase flow process, the computational particle is subject to gravity, frictional forces, and particle-particle collision forces. The movement of the gas phase and the particle phase is solved through their respective control equations. In this process, the control equation corresponding to the gas phase is [17]:
In the above equation,
In the equation,
The drag model involved in this paper is Wen-Yu/Ergun [18,19] model, which is obtained through the linear transformation of Wen-Yu model and Ergun model, so the coefficient determined by the drag model is expressed as Eq. (7):
In the equations,
The normal stress involved in the collision or contact between particles is calculated, which can be expressed as follows:
In the equation,
Based on the theoretical foundation of CPFD, This algorithm employs the PISO (Pressure-Implicit with Splitting of Operators), which divides the factors causing changes in particle velocity and position at each time step into three independent parts: the first part includes body forces, gas-phase pressure gradient forces, gravity, and isotropic forces; the second part involves solid-phase stress gradient forces; and the third part consists of collision damping forces. In gas-solid fluidization where the mean solid volume fraction is relatively high, isotropic forces and collision damping forces can generally be neglected. In the current theoretical framework, the Partial Donor Cell method is used to discretize the fluid equations [20]. Fluid velocities are tracked at the cell faces, while pressure, density, mass concentration, and temperature are computed within or at the center of the cells. When calculating the advection terms in the mass, momentum, or energy transport equations, the value of the quantity sought is determined based on the values from two adjacent cells, Q1 and Q2. The variable
where u is the velocity,
Partial donor cell The partial donor cell scheme is a weighted average of central difference and up wind convection. A limiter is applied to automatically weight the central difference and upwind quantities.
The PDC method defines a donor cell Qd, and an acceptor cell Qa as:
where the weighting factor Ф is calculated as:
and Φ is limited between 0 and 1, if α = 0 and β = 0. then the convection is center differencing which is unconditionally unstable without sufficient amount of diffusion. if α = 1 and β = 0. then the convection is upwind which tends to be too diffusive. Values for α and β must be between 0.1 and 1, the simulation settings in this article are set to α = 0.3 and β = 1.
This paper takes the pneumatic conveying of electric dust removal in a factory as the research object, the dust particle density is 2600 kg/m3, the dust particles are assumed to be spherical, and the influence of temperature on the two-phase flow is ignored. The direct interaction between particles and the wall is controlled by the normal and tangential momentum retention coefficients [21]. In general, in order to accurately describe the two-phase motion process in the pneumatic conveying process [22], the normal momentum coefficient is 0.75. When the particle size distribution is ignored, the tangential momentum coefficient takes a value of 0.15. Other simulation model parameters are shown in Table 1.

This paper uses the CPFD Barracuda Virtual Reactor as the simulation tool, which employs Cartesian grids. To verify the accuracy and reliability of the grid division, the outlet velocity at three different grid resolutions was compared, and a grid independence verification was conducted. The results are shown in Fig. 3. The results indicate that when the number of grids are 267,528 and 401,292, the outlet velocities are quite similar. To save computational resources while ensuring computational accuracy, the number of grids is 267,528 was ultimately chosen for the calculations in this paper.
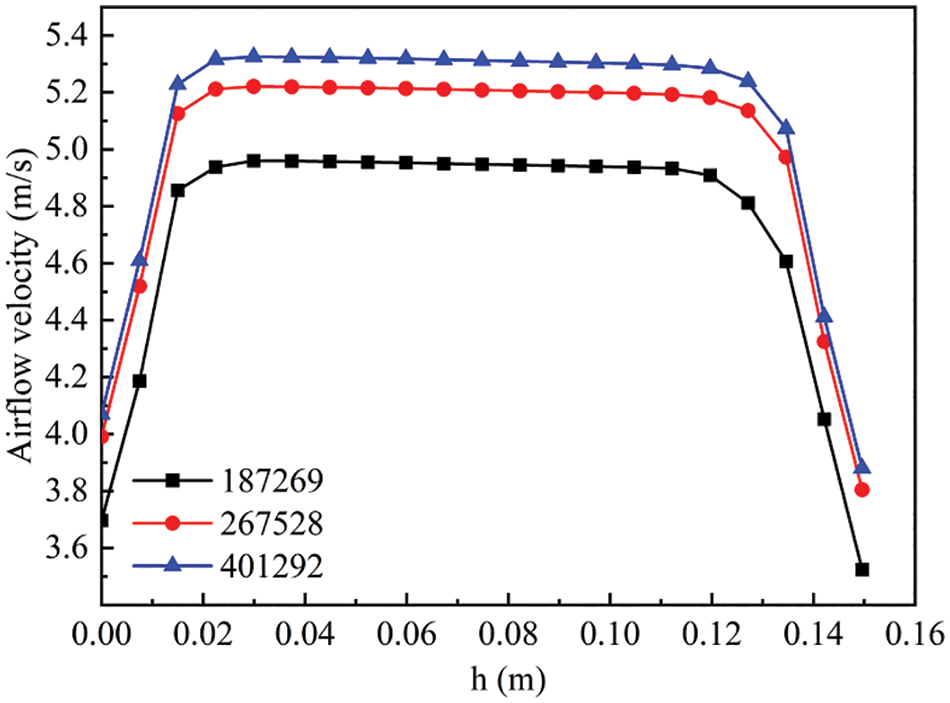
Figure 3: Grid independence verification
3.1 Influence of the Opening of the Feed Port on the Pneumatic Conveying Process
In practical engineering applications, the opening condition of the dust discharge port directly affects the amount of material in the horizontal pipeline, and the opening and closing of the discharge port are controlled by the electronic control door. In this section, 1–4 opening and closing conditions of the discharge port are selected for simulation in order to explore the influence of different number of discharge ports on the pneumatic conveying process. The current horizontal airflow inlet velocity is 5 m/s, the dust inlet mass flow rate is 1 kg/s, and the outlet is at standard atmospheric pressure.
3.1.1 Influence of the Opening of the Feed Port on the Advancing Speed of Dust Particles
Fig. 4 shows the distribution of dust movement velocity in the horizontal conveying tube at each moment. The results show that with the extension of conveying time, the thickness of dust accumulation at the bottom increases, while the horizontal air flow mainly acts on the surface powder, and the conveying effect on the already accumulated dust is weak.
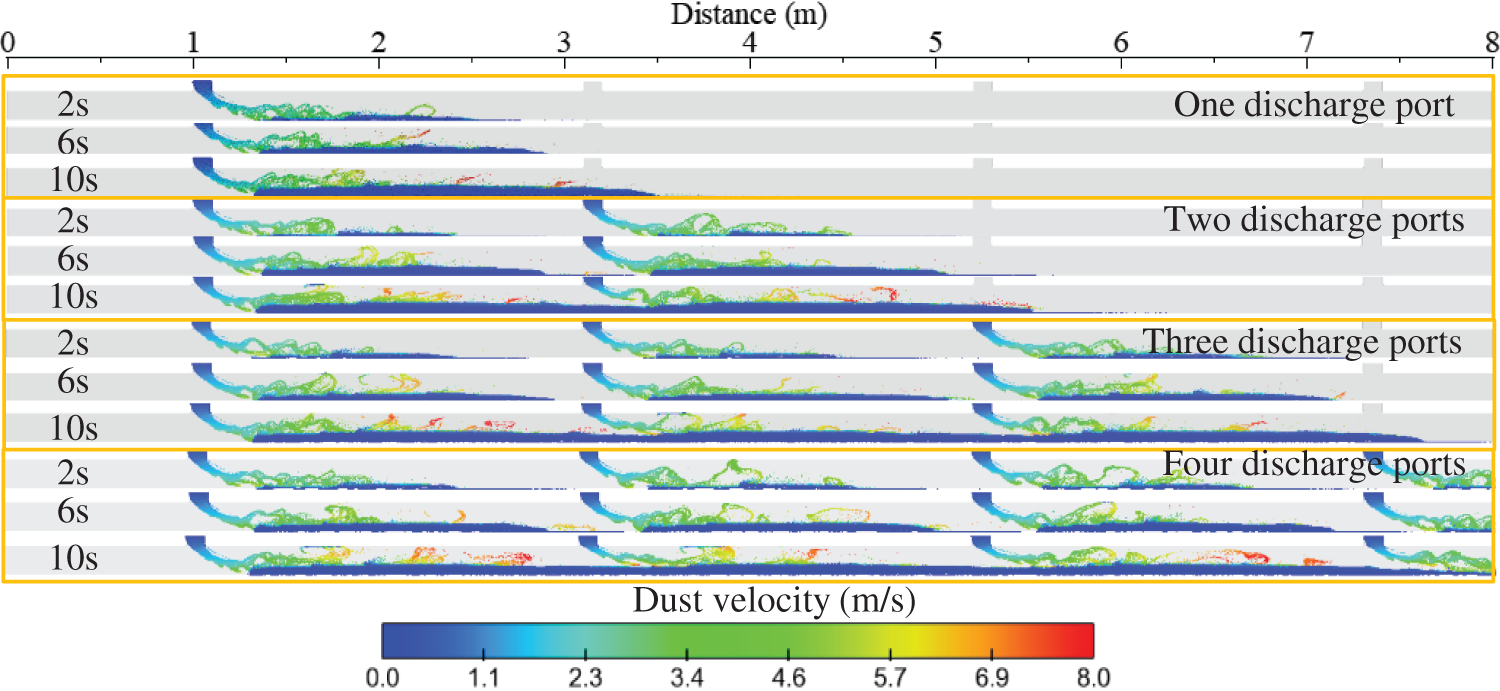
Figure 4: Dust movement speed at each moment
Fig. 5 shows the distribution of air velocity in the horizontal conveying tube at each moment. In combination with the particle velocity changes in Fig. 4, it can be found that with the increase of particle accumulation, the width of the airflow channel will shrink, and the airflow velocity above the particles will be increased, and the high-speed airflow will also increase the velocity of the surface particles. At the same time, due to the horizontal migration of particles, the high-speed airflow enhances the particle disturbance, resulting in the irregular distribution of unaccumulated particles, resulting in a slightly higher airflow above the conveying pipe than the central airflow. The location is in the area behind the blanking port, and at the same time, just below the blanking port, a high-speed area will also appear, and almost no particles in this area exist.
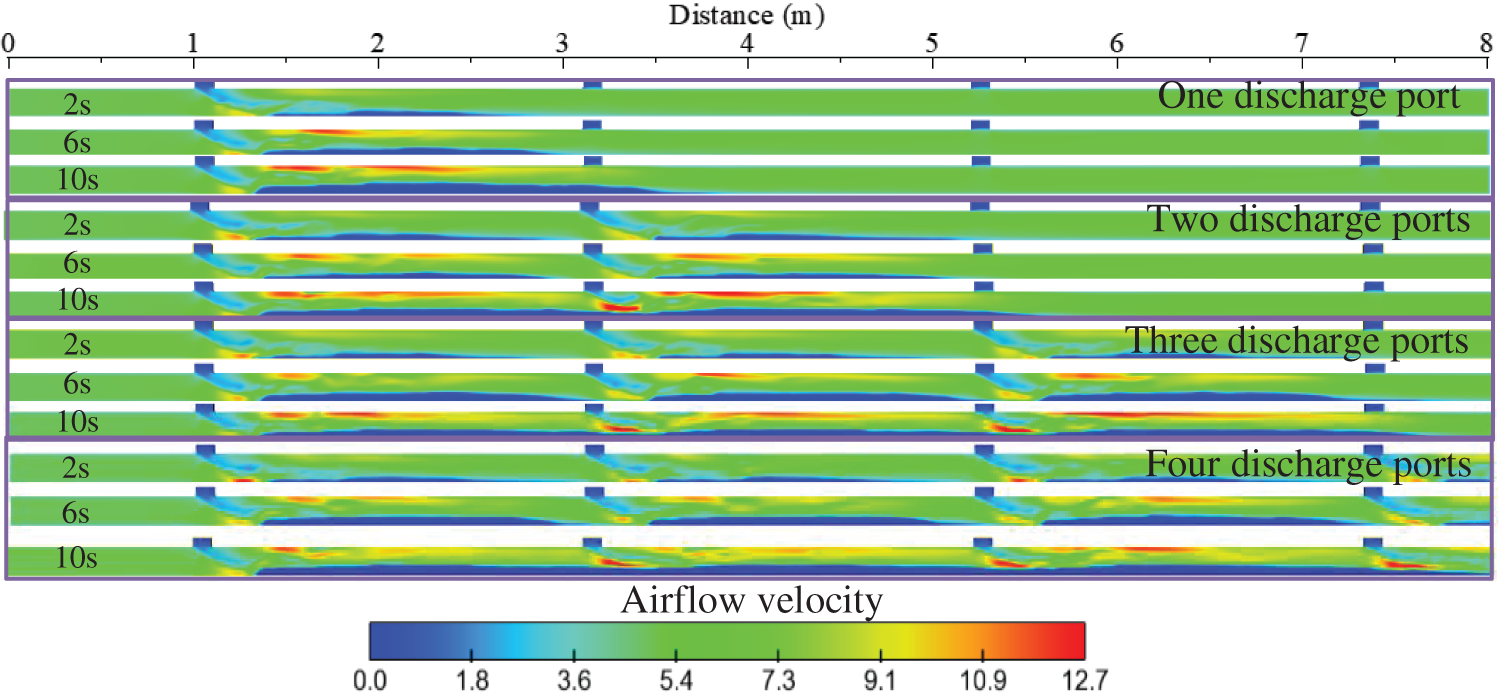
Figure 5: Airflow velocity at each moment
In order to further analyze the change of particle migration velocity, this section calculates the maximum air velocity in the conveying tube at each moment, as shown in Fig. 6. According to the results in the figure, when the inlet air velocity is 5 m/s, the maximum air velocity can be increased to about 3 times of the initial inlet velocity. With the increase of conveying time, the maximum air velocity fluctuates up and down at 12 m/s, which also indicates that with the increase of the feed amount, the air flow area in the tube is stable. In addition, the above results can be found that when there are 3 and 4 discharge ports, during the period of 8–10 s, the air flow in the tube is stable. The maximum air velocity is slightly increased, and in other periods, the corresponding air velocity of different number of discharge ports is relatively close, indicating that different number of discharge ports have no obvious influence on the maximum air velocity.
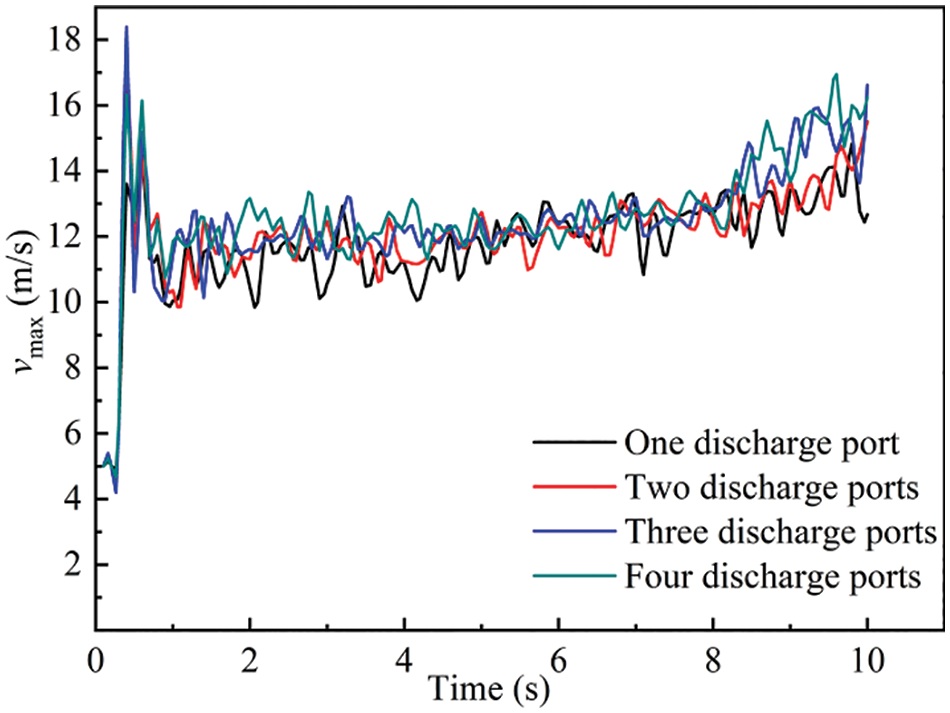
Figure 6: Change of maximum air velocity with time
The maximum particle movement velocity is an important indicator to characterize the particle migration effect, which can reflect the particle migration effect in the pipe to a certain extent. Fig. 7 shows the change of the maximum particle velocity in the conveying pipe over time, and the results show that the maximum particle velocity is significantly lower than the maximum air flow velocity. The high-speed area of air flow and the high-speed area of particle movement are not in the same position. Therefore, under the current air flow velocity, the overall transport capacity of air flow for dust is not ideal. The change law of maximum particle velocity in Fig. 7 is basically consistent with that of maximum air flow velocity in Fig. 6, but the trend of increase of maximum particle velocity occurs from 4–10 s. It shows that the process of air velocity increase has a certain delay.
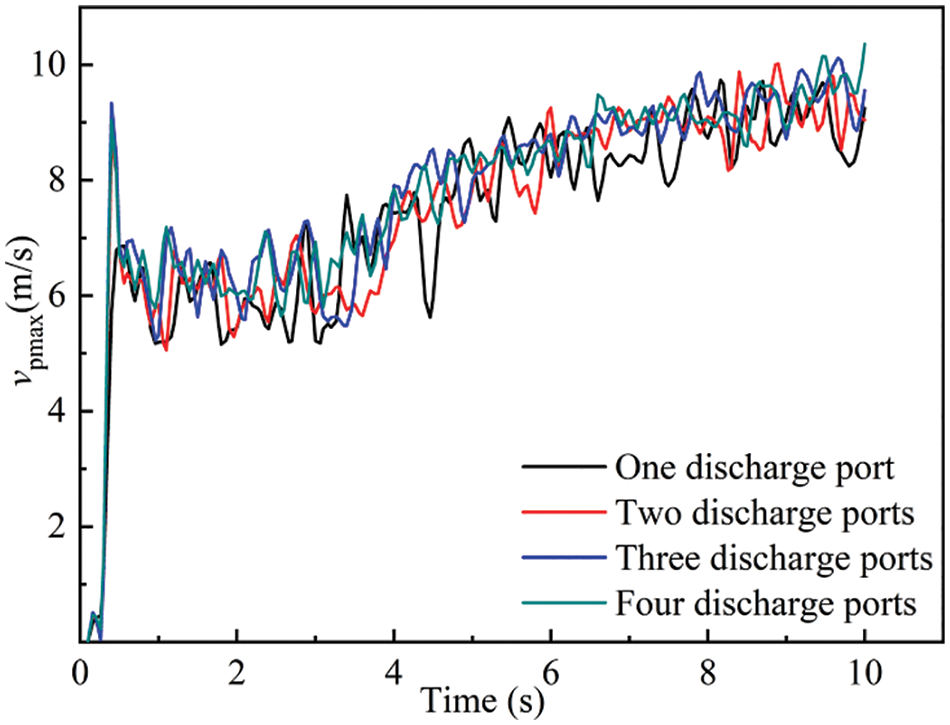
Figure 7: Changes of maximum dust velocity with time
3.1.2 Influence of the Opening of the Feed Port on the Accumulation Thickness of Dust Particles in the Tube
To further analyze the accumulation of dust within the pipe, this section will use dust volume fraction as an indicator to compare the impact of the number of feed ports on particle accumulation thickness. Fig. 8 shows the distribution of dust volume fractions at different time points during the pneumatic conveying process. It can be observed that as the quantity of particles in the pipe increases with feeding time, the spreading distance of the powder also extends. When the number of discharge ports increases, the phenomenon of adjacent discharges beginning to contact occurs. The time point at which adjacent discharges first come into contact is defined as the initial contact time. In the figure, after 8 s of conveying, adjacent discharges start to contact each other, thereby forming a uniformly thick particle accumulation region.
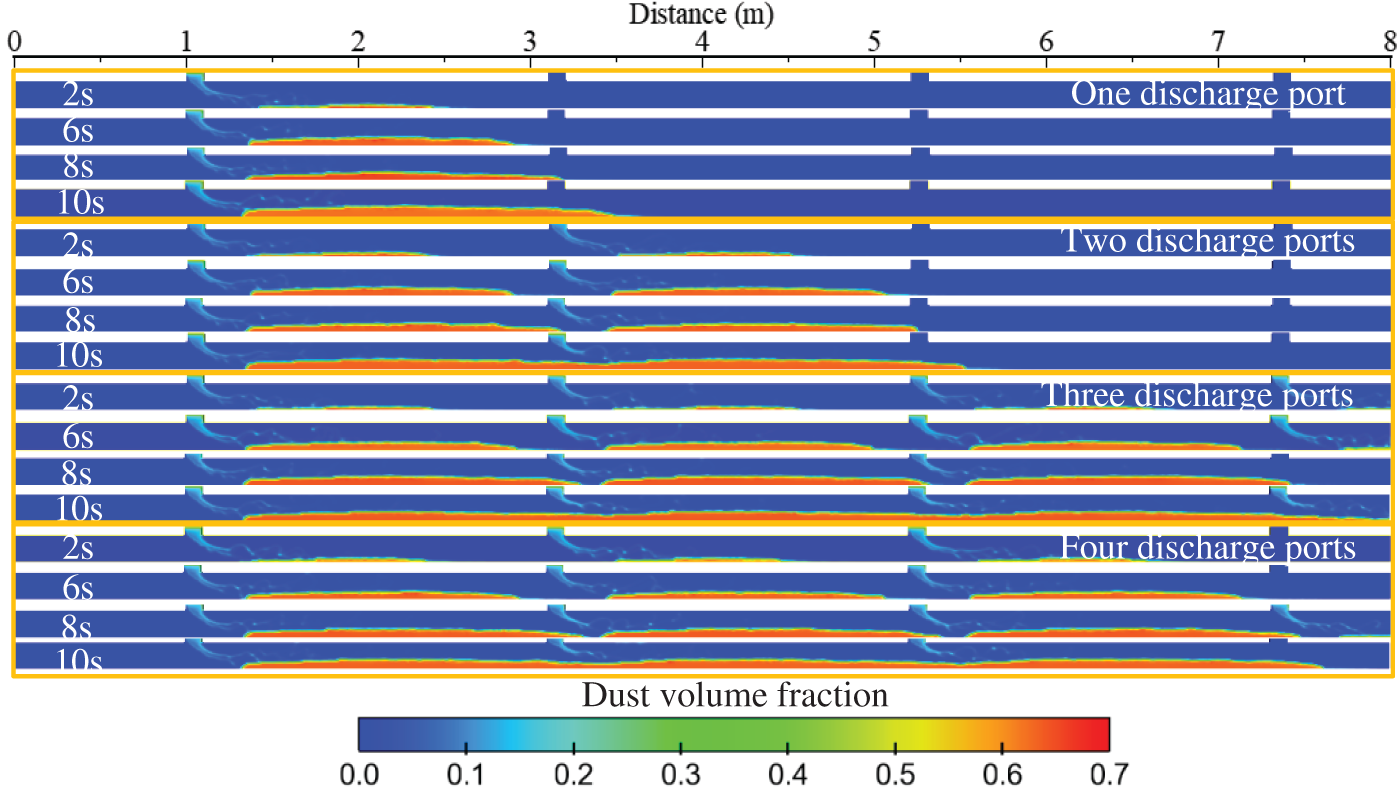
Figure 8: Dust volume fraction during pneumatic conveying
The 8 s is regarded as the boundary time of adjacent discharge collection, the dust volume fraction in the horizontal direction of the bottom area of the conveying pipe is collected, as shown in Fig. 9. The results indicate that before adjacent discharges come into contact, the horizontal airflow can increase the spreading length of the particles. At 2 s of airflow action, the spreading length is 1 m; at 6 s of airflow action, the spreading length is 1.5 m; and at 8 s of airflow action, the spreading length is 1.75 m, it can be seen that the spreading speed of particles will decrease with the longer the acting time.
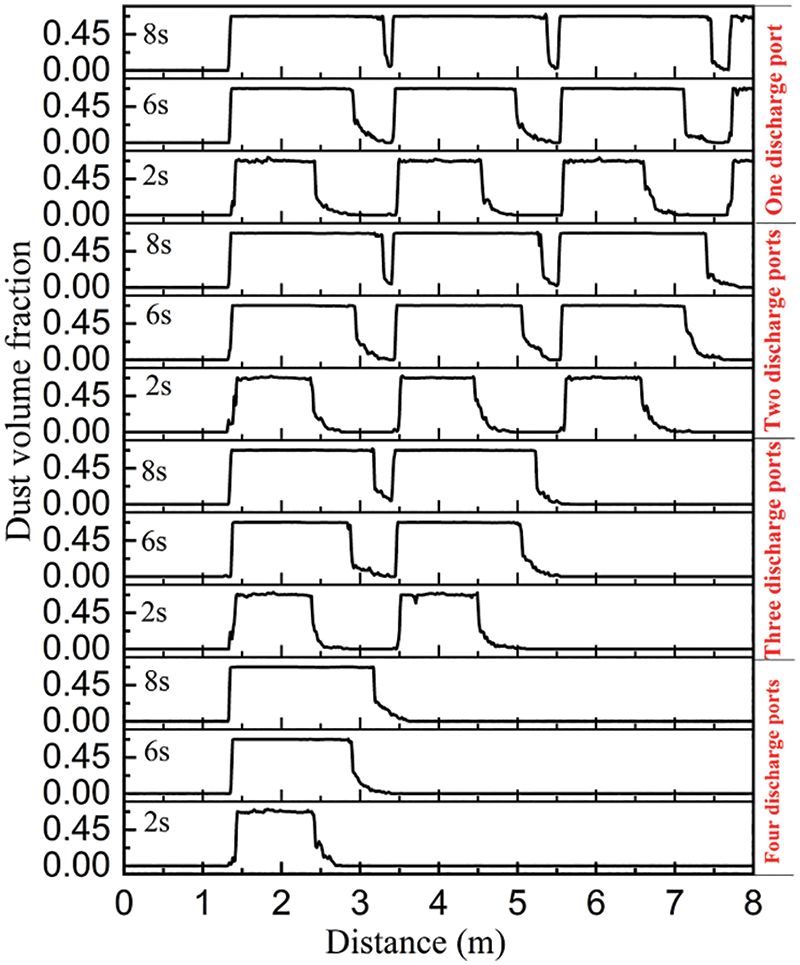
Figure 9: Distribution of dust volume fraction in horizontal direction
Fig. 10 shows the change of the maximum accumulation thickness of dust over time. The results indicate that with longer transport times, more particles accumulate inside the pipe. When there is no contact between adjacent discharges, the dust accumulation thickness is essentially unaffected by the number of discharge ports, and the dust accumulation thickness changes with time in an almost linear trend. However, once adjacent discharges come into contact, the more discharge ports there are, the greater the accumulation thickness, and the dust accumulation thickness exhibits a nonlinear trend over time. It is evident that having too many discharge ports is more likely to cause clogging issues within the pipe. According to Figs. 4 and 5, the greater the dust accumulation thickness, the smaller the top airflow channel, and when the air intake is constant, the top airflow speed increases. This in turn increases particle velocity and easily increases the risk of wear in the top area of the pipeline.
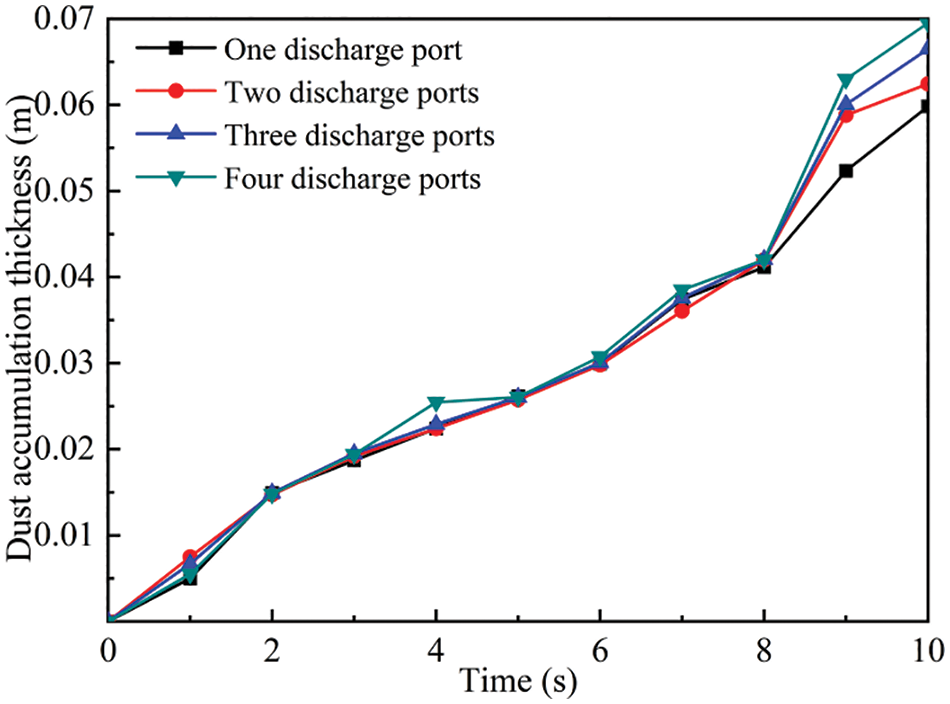
Figure 10: Variation of the maximum accumulation thickness of dust over time
3.2 Influence of Inlet Flow Rate on Pneumatic Conveying Process
The inlet velocity is an important parameter that affects the velocity of dust particles in gas-solid two-phase flow. In this section, the movement behavior of dust particles in the pipeline under different inlet velocity conditions is studied, and the law of influence of inlet velocity difference on powder advancing velocity is discussed.
3.2.1 Influence of Inlet Velocity on Dust Particle Propulsion Velocity
In a pneumatic conveying system, the air inlet velocity determines the particle migration velocity and the particle movement pattern in the pipe. Fig. 11 shows the dust movement velocity distribution under different inlet velocity conditions. The results show: When the inlet flow velocity is larger, the overall particle movement velocity will also be significantly increased. Meanwhile, too large inlet flow velocity will make the particle movement trajectory more chaotic, improve the proportion of solid gas in local areas, and help improve the particle transportation effect during multi-outlet discharge. At the same time, it will shorten the initial contact time between adjacent discharges and increase the horizontal spreading length of the dust.
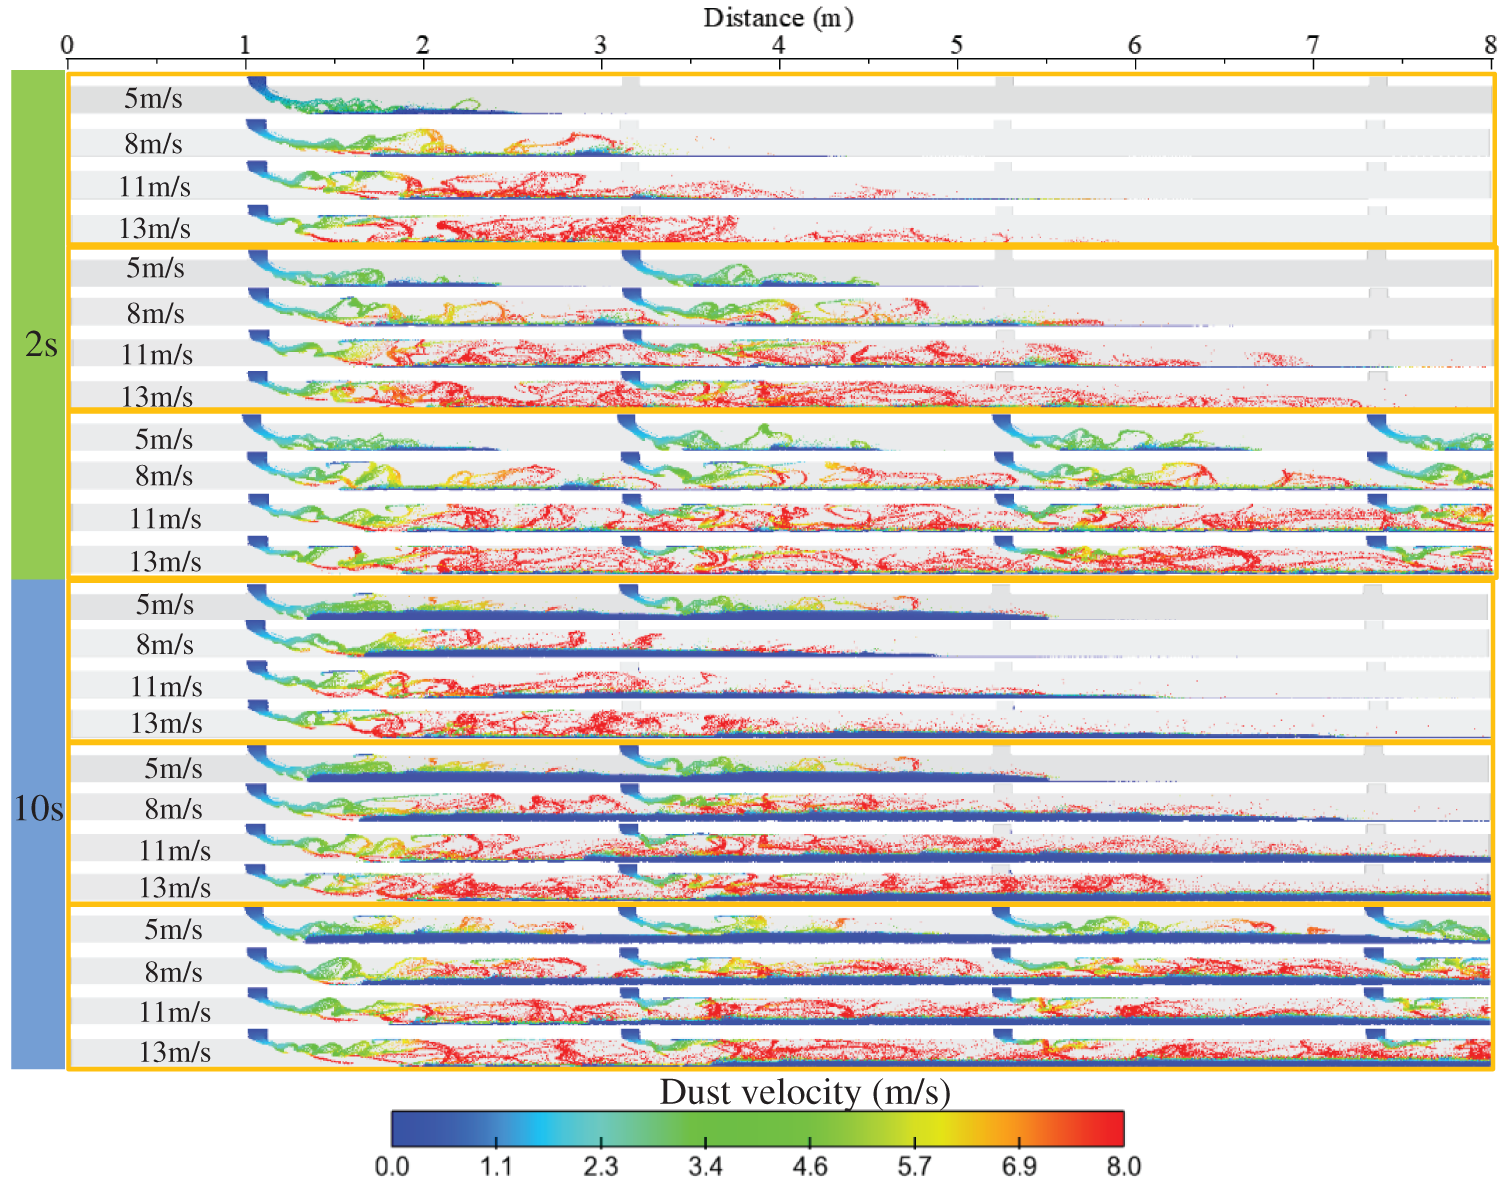
Figure 11: Dust movement speed at different times
Fig. 12 shows the distribution of air velocity under different inlet flow rates. The results show that the higher the inlet air velocity, the more chaotic the air velocity in the rear area of the discharge port; meanwhile, too large inlet air velocity will increase the high-speed area of the discharge port at the back, resulting in obvious differences in gas-solid velocity in the area near each discharge port.
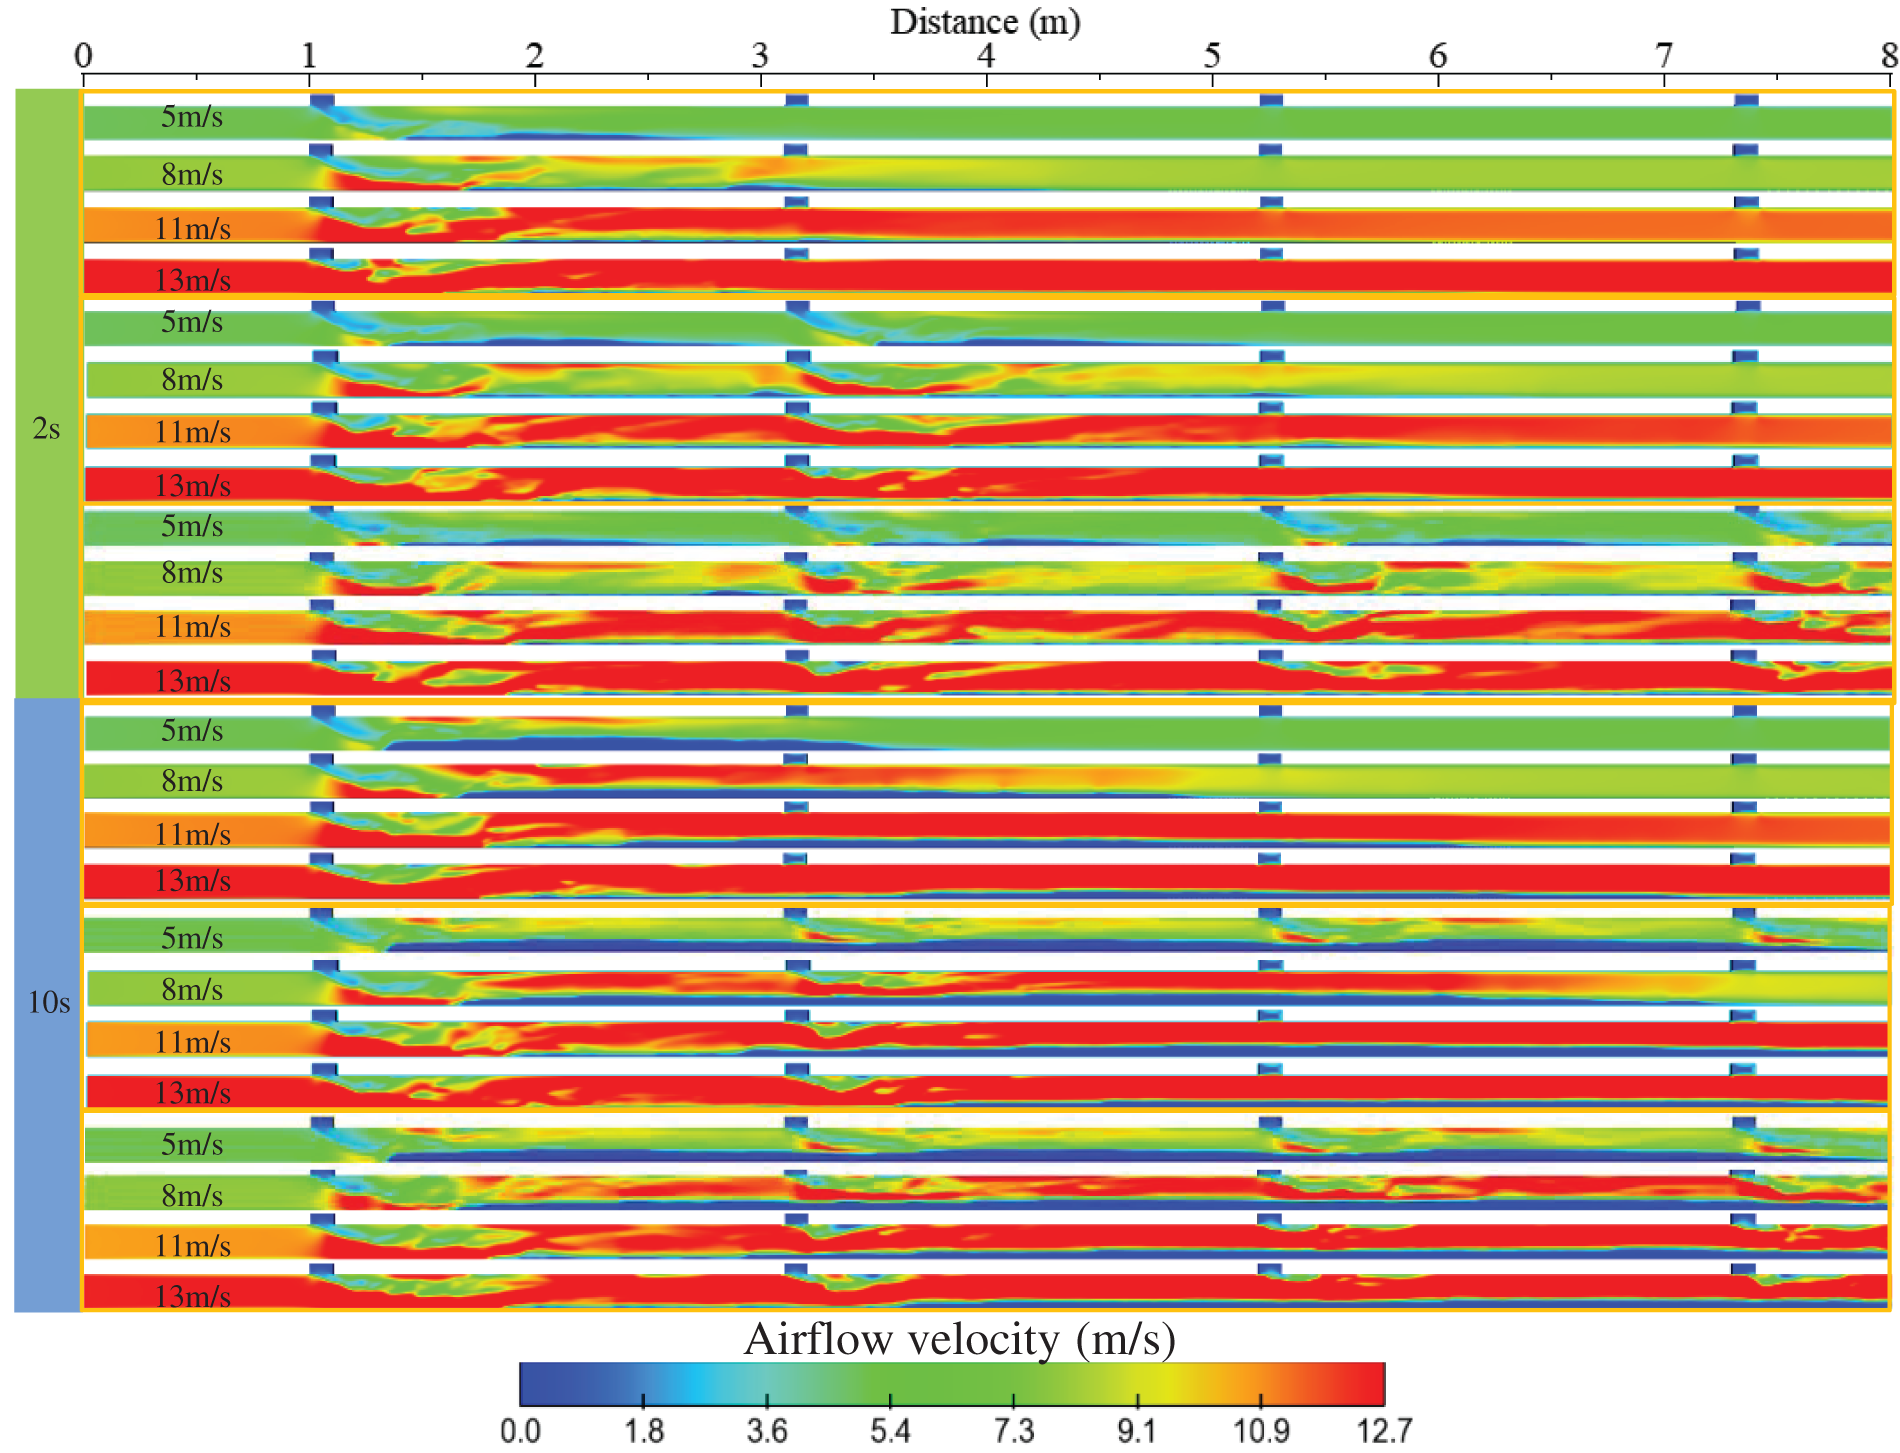
Figure 12: Airflow velocity at different times
For a unified quantitative analysis, the ratio of maximum flow velocity to inlet flow velocity will be used as a comparison index, as shown in Fig. 13. Fig. 13a shows the change of the velocity ratio during the discharge of one discharge port, and Fig. 13b shows the change of the air velocity ratio over time during the discharge of four discharge ports. The results show that: When there is only one discharge port feeding, the smaller the inlet velocity, the larger the ratio between the maximum air velocity and the inlet velocity, and the more obvious the air velocity ratio fluctuates with time. When the inlet air flow reaches 5 m/s, the air velocity ratio can reach about 2.5; when the inlet air flow reaches 8 m/s, the air velocity ratio can reach about 2; when the inlet velocity is further increased, the flow rate of the inlet is about 2.5. The ratio of air velocity did not increase significantly, and the value remained at about 1.6. When the number of discharge ports increases, the influence of different inlet flow velocity conditions on the ratio of air velocity will be weakened.
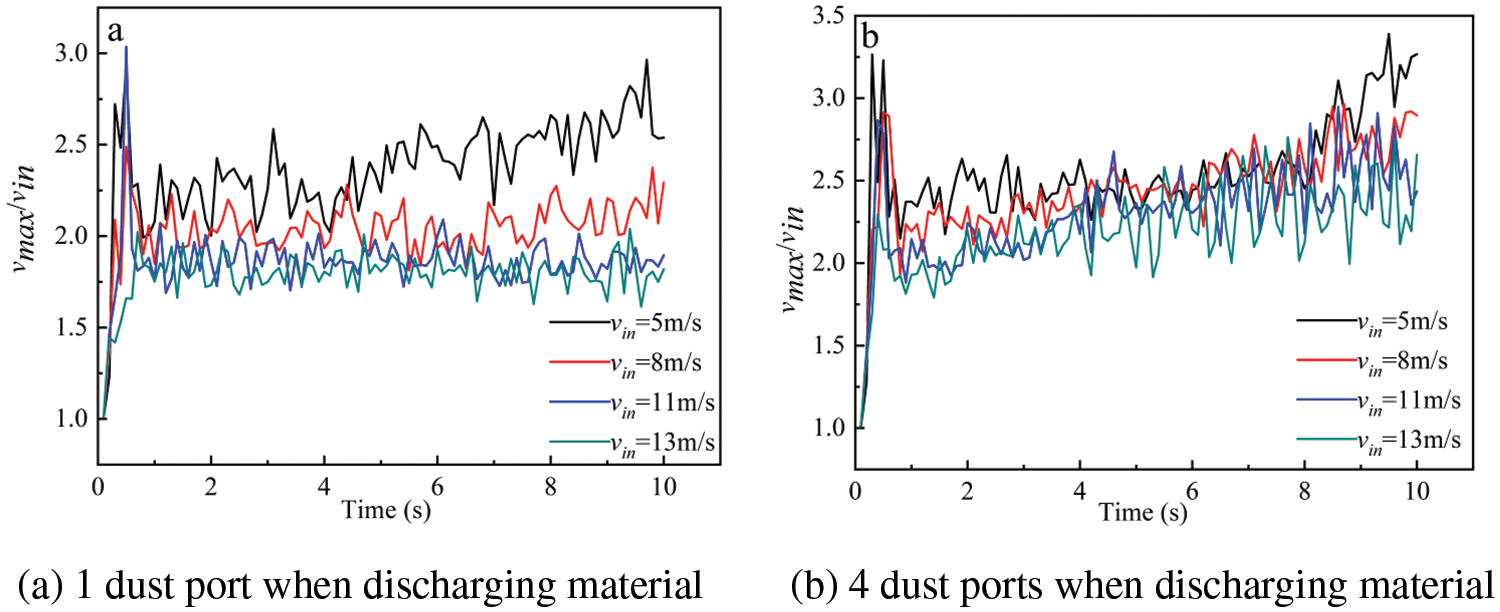
Figure 13: The ratio of maximum airflow velocity to inlet velocity changes with time
Fig. 14 shows the ratio of maximum dust movement velocity to inlet velocity changing over time. The results show that: When the inlet air flow reaches 5 m/s, the maximum velocity ratio is about 1.8; when the inlet air flow reaches 8 m/s, the velocity ratio can reach about 1.4, eventually, the velocity ratio will fluctuate steadily around 1.2. When the number of discharge ports increases, the velocity ratio does not change significantly, but the overall value fluctuation decreases, indicating that the inlet flow rate increases, which is conducive to the stable dust flow rate in the pipe.
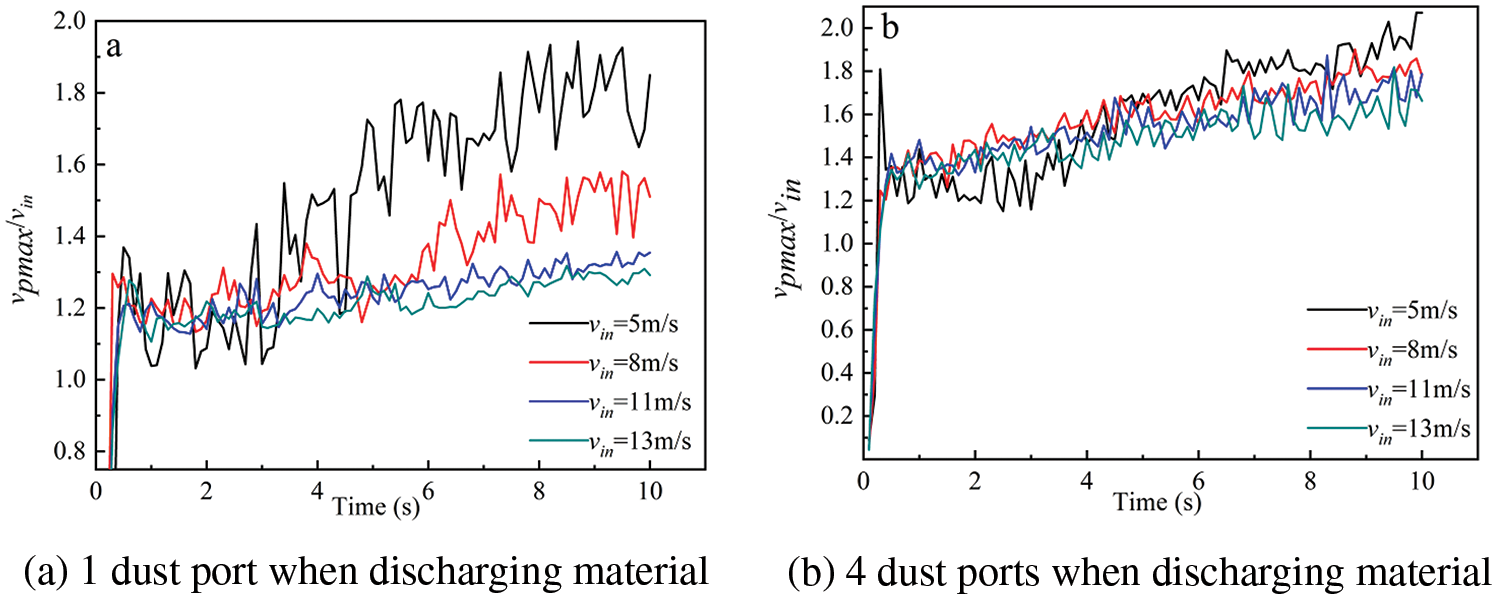
Figure 14: The ratio of maximum dust movement velocity to inlet velocity changes with time
3.2.2 Influence of Inlet Flow Rate on Accumulation Thickness of Dust Particles in Pipe
Fig. 15 shows the distribution of dust volume fraction under different inlet speed conditions. The results indicate that as the inlet airflow velocity increases, the particle spreading length also increases. Specifically, when the inlet velocity is 5 m/s, adjacent discharge particles come into contact after 8 s. As the inlet airflow velocity increases, the initial contact time between adjacent feed ports will be shortened. When the inlet flow velocity increases to a certain value, the dust dense area in the rear section will be slightly increased.
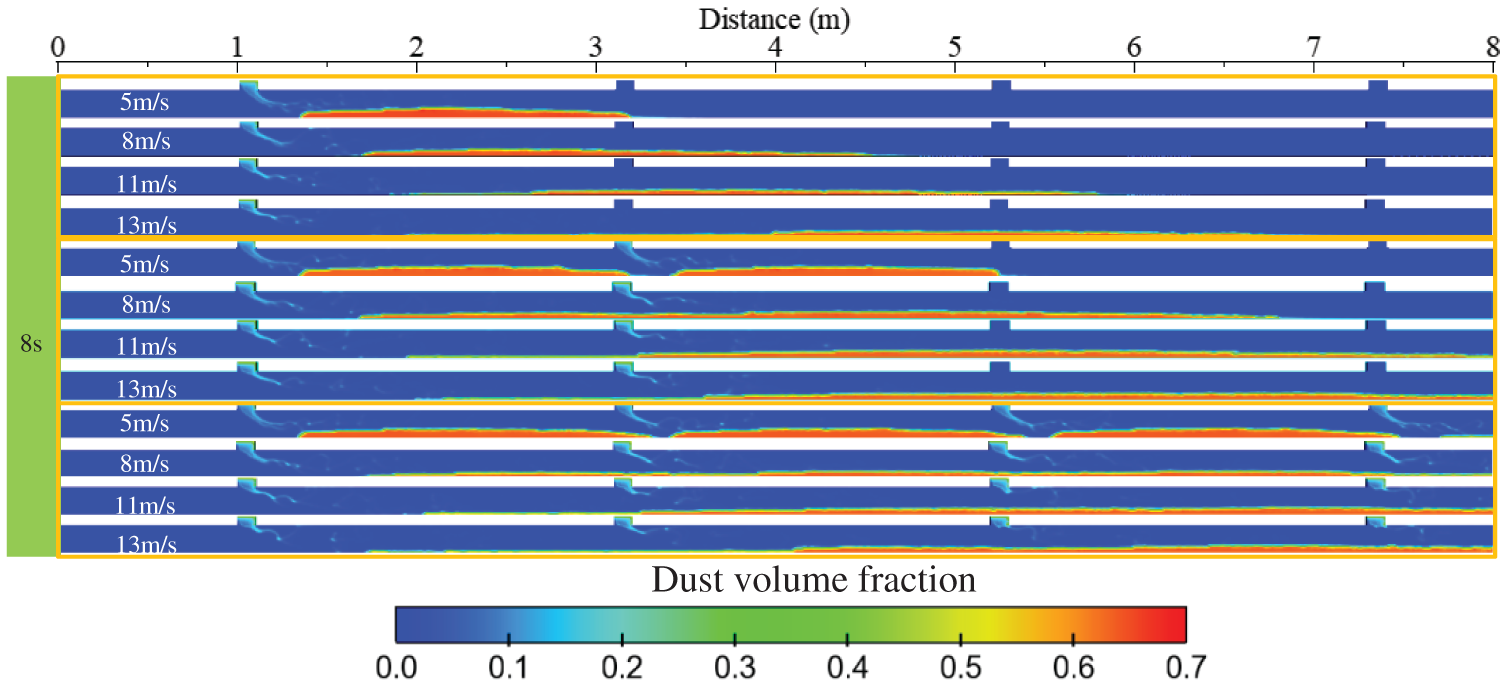
Figure 15: Distribution of dust volume fraction under different inlet velocity conditions
Fig. 16 shows the distribution of dust volume fraction in the horizontal direction. The results indicate that when feeding from a single discharge port, the dust spreading length increases with the inlet airflow velocity. Specifically, when the inlet velocity is 5 m/s, the dust spreading length is approximately 1.75 m; at an inlet velocity of 8 m/s, the dust spreading length is approximately 3 m; at an inlet velocity of 11 m/s, the dust spreading length is approximately 4 m; and at an inlet velocity of 13 m/s, the dust spreading length is approximately 4.5 m. When the number of discharge ports increases to four and the inlet flow velocity is 5 m/s, the dust released from adjacent discharge ports does not come into contact at 8 s. However, as the flow velocity is further increased, the dust from adjacent discharges begins to converge. With the increase in inlet airflow velocity, the particle volume fraction near the airflow inlet side becomes lower than the material accumulation volume fraction (0.7), indicating that this portion of the material is more thoroughly mixed with the airflow and exhibits better flow properties.
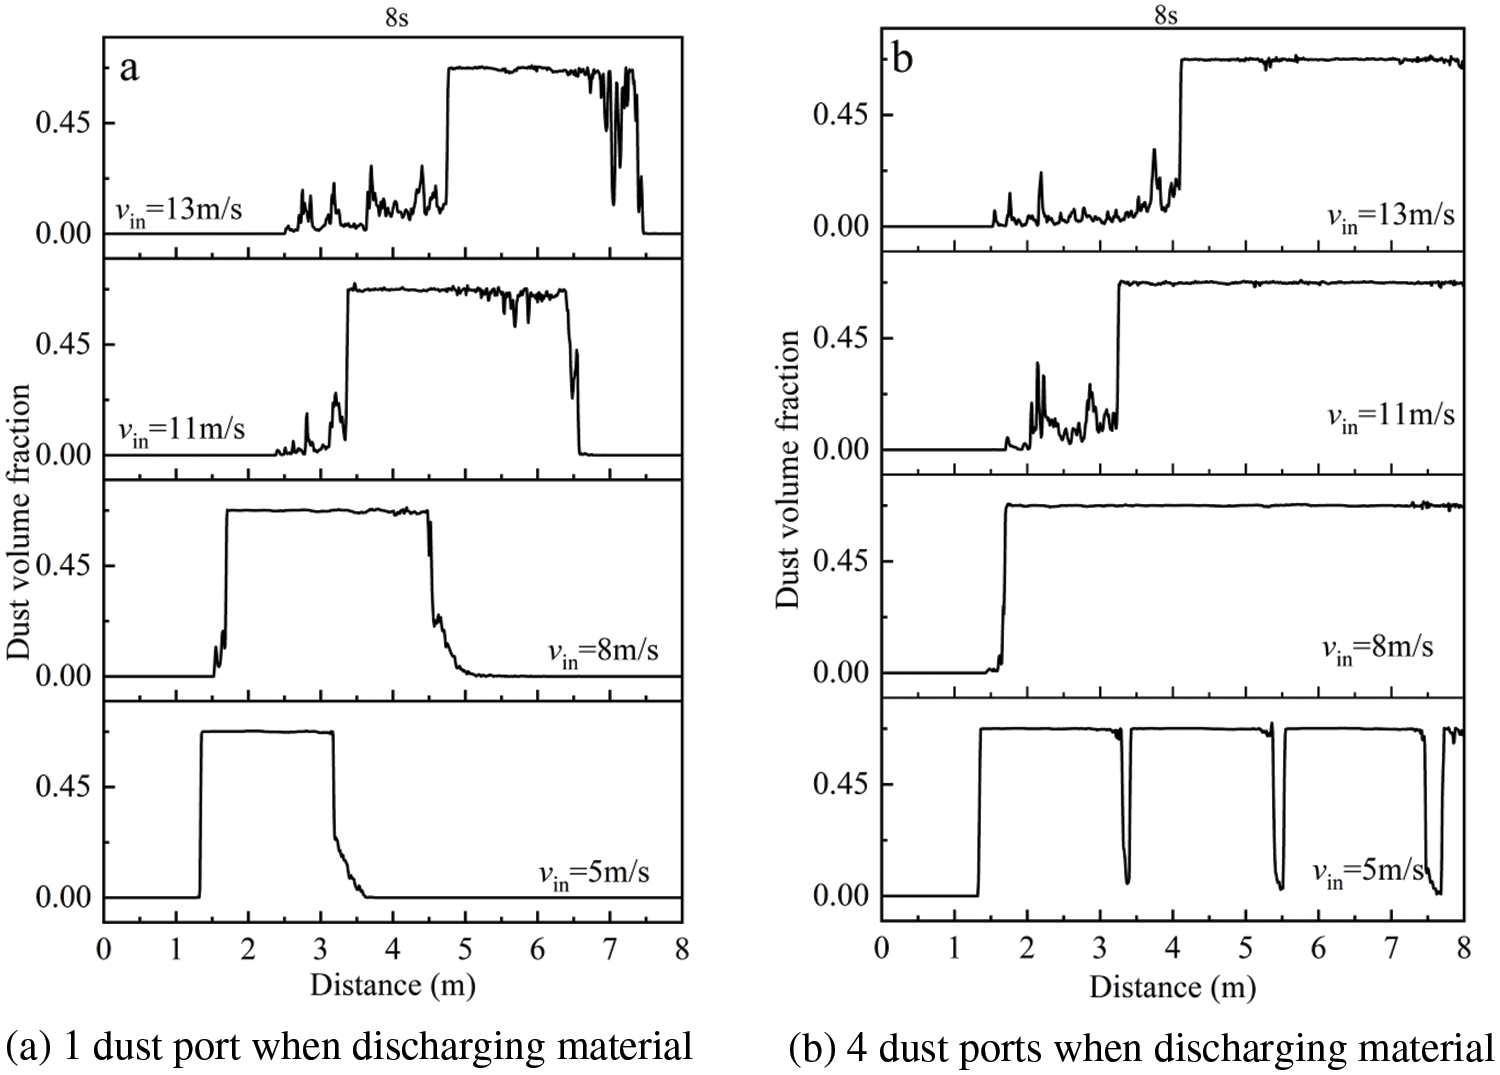
Figure 16: Distribution of dust volume fraction in horizontal direction
Fig. 17 shows the relationship between dust accumulation thickness and inlet air velocity. The results show that when a single discharge port is fed, the dust accumulation thickness decreases with the increase of inlet flow velocity, showing a linear relationship as a whole. When the number of discharge ports is increased to 4, when the inlet air velocity is increased to 13 m/s, the dust accumulation thickness will be slightly increased. Therefore, too high inlet air velocity will also cause the dust migration speed to slow down.
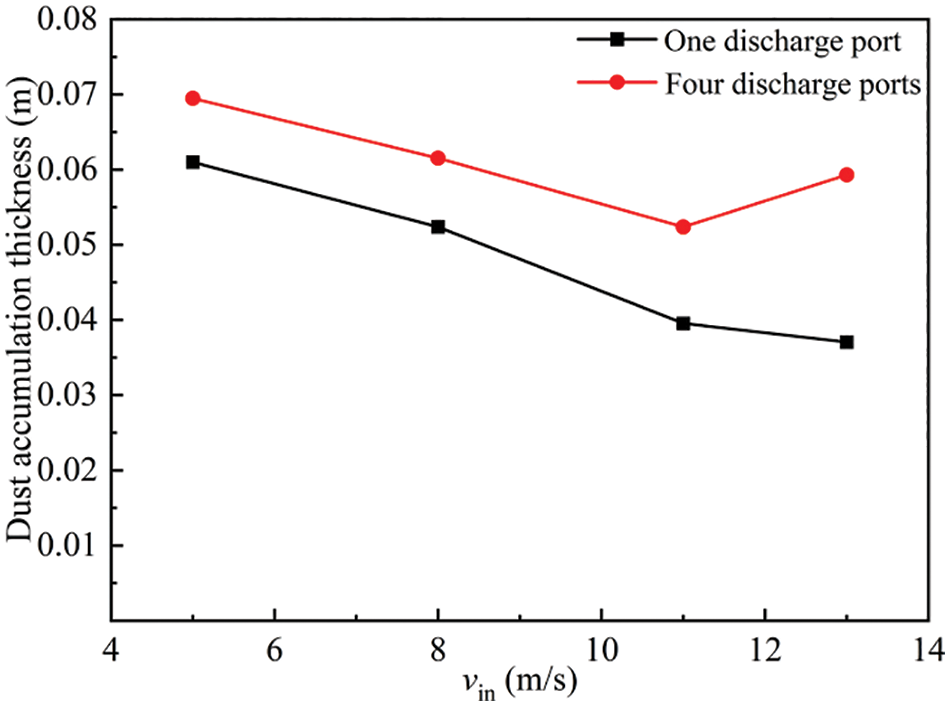
Figure 17: Relation of dust accumulation thickness with inlet air velocity
3.3 Influence of Blanking Port Spacing on Pneumatic Conveying Process
In the process of pneumatic conveying, the difference of blanking port spacing will also affect the accumulation thickness of dust particles in the pipe. The change of the spacing of the blanking ports can change the speed and direction of the air flow, thus affecting the transmission behavior of dust particles in the tube. This section simulates the pneumatic conveying process when four blanking ports feed at the same time, and analyzes the influence of four different spacing of blanking ports on the material flow.
3.3.1 Influence of Blanking Port Spacing on Dust Particle Advancing Speed
Figs. 18 and 19, respectively show the distribution of dust movement velocity and air flow velocity under different blanking spacing. The results show that the advancing velocity of dust particles is larger under smaller blanking spacing. This is because smaller spacings cause the dust from adjacent feed ports to come into contact more quickly, thereby reducing the width of the airflow channel, increasing the airflow velocity, and accelerating the movement speed of surface particles. As the blanking spacing increases, the upper level of discharge has more space to spread out, thereby avoiding particle clogging problems. At the same time, it will also reduce the proportion of high-speed airflow area and reduce the wear of the conveying pipeline in the gas-solid two-phase flow.
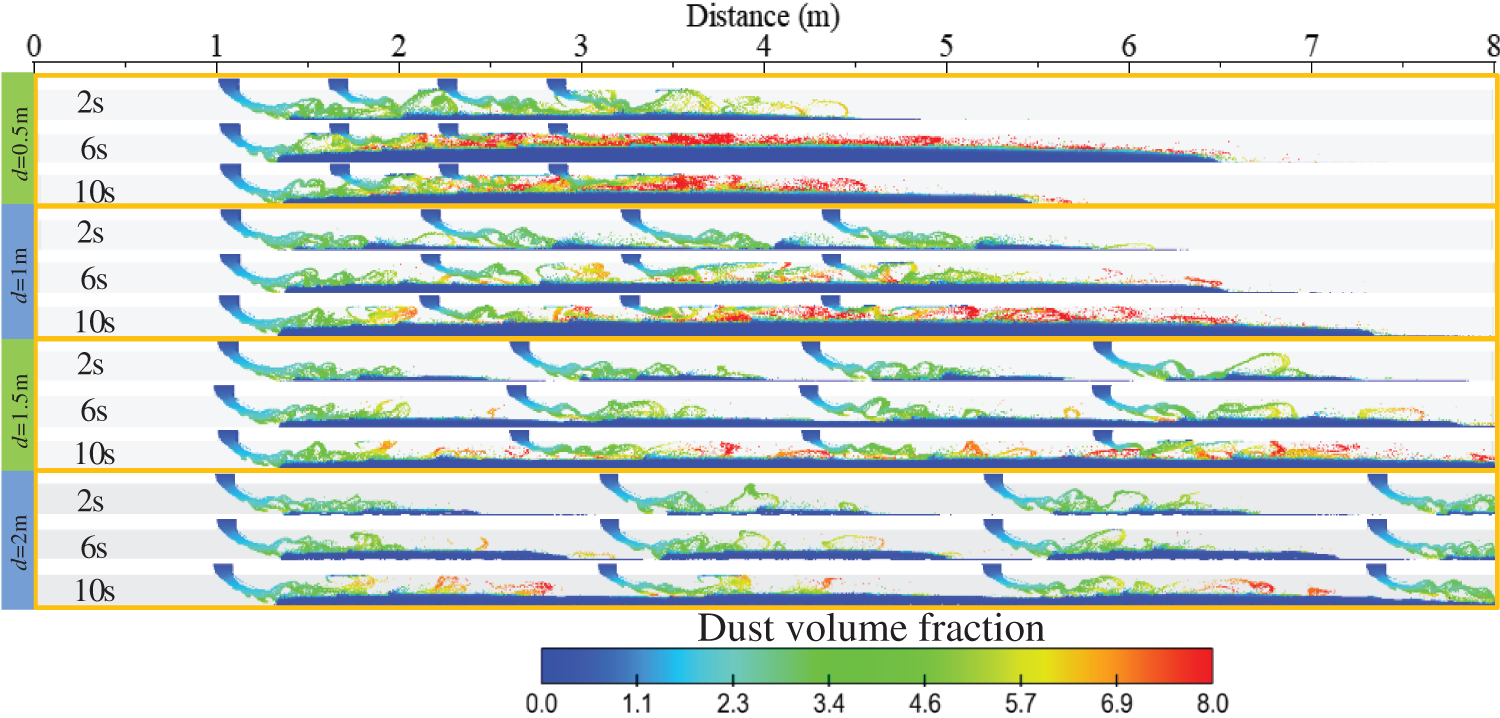
Figure 18: Dust movement velocity under different blanking intervals
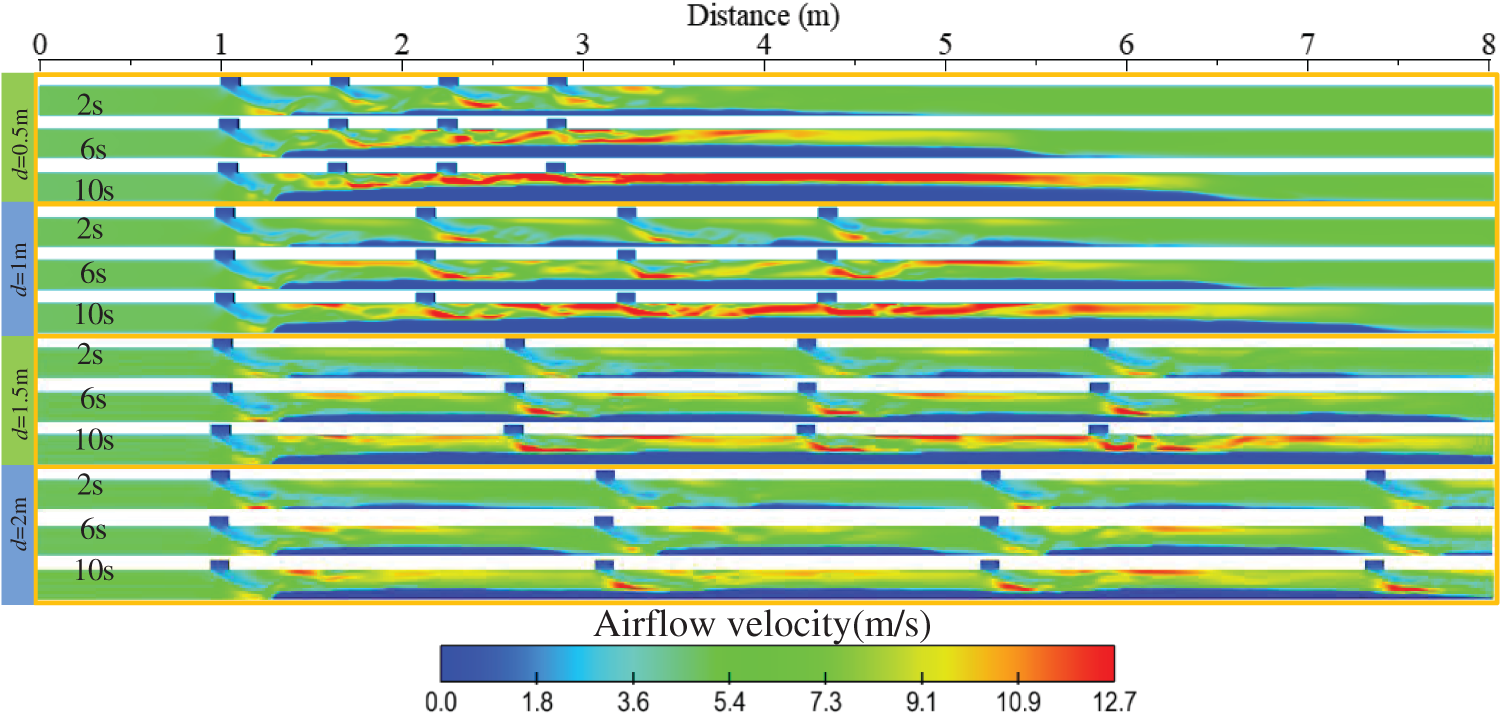
Figure 19: Airflow velocity at different blanking intervals
Figs. 20 and 21 respectively show the changes of maximum air velocity and maximum particle velocity with time under different blanking intervals. The results indicate that with different discharge port spacings, both the maximum airflow velocity and the maximum particle velocity tend to increase with the feeding duration. When the discharge port spacing is increased fourfold, the maximum airflow velocity and the maximum particle velocity decreased by 0.25–0.5 times. Combined with the velocity distribution in Figs. 18 and 19, it can be found that when the blanking port spacing ranges from 0.5 to 1.5 m, The particles with larger velocities are located after the third discharge port, while the high-speed air flow area appears after the second discharge port, and the smaller the spacing, the larger the high-speed area of air flow and particle movement. It can be seen that reducing the discharge spacing can only improve the surface dust flow speed but does not improve the overall particle propulsion efficiency.
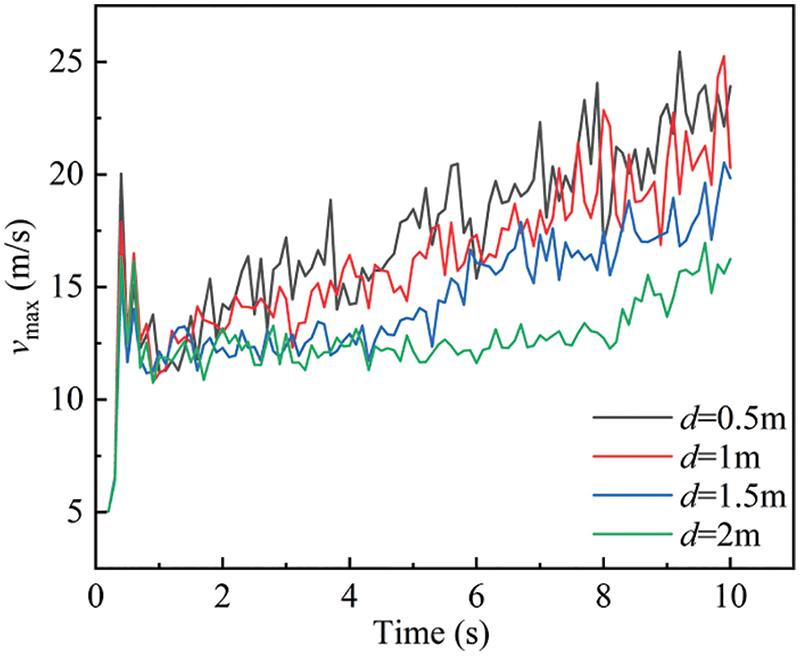
Figure 20: Change of maximum air velocity with time under different blanking intervals
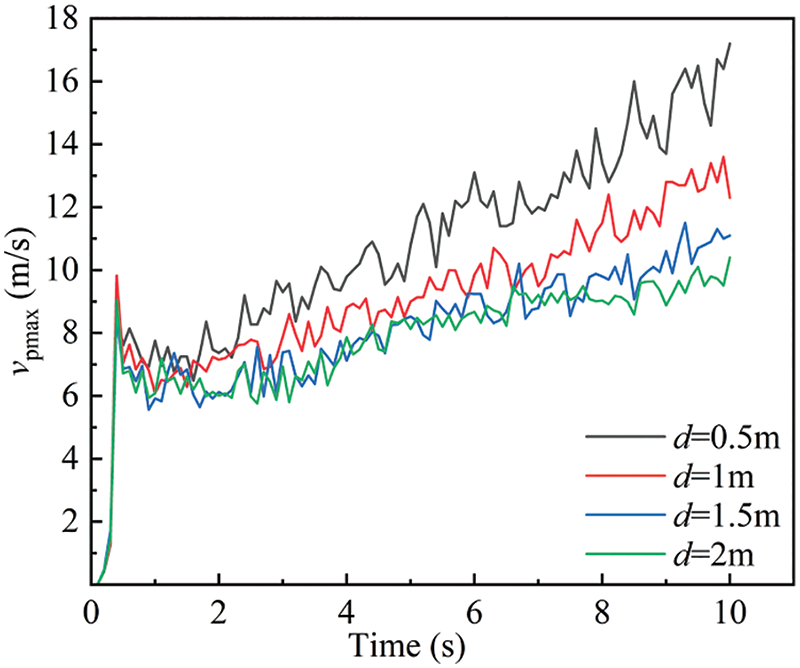
Figure 21: Change of maximum particle velocity with time under different blanking intervals
3.3.2 Influence of Blanking Port Spacing on the Accumulation Thickness of Dust Particles in the Pipe
To further compare the effects of different feed port spacings on the dust accumulation thickness within the pipeline, this section will analyze and compare the particle volume fractions at the initial contact time for each spacing (when adjacent discharge particles first come into contact), as shown in Fig. 22. The results show that as the smaller the blanking interval, the shorter the initial contact time will be, so that the particles will accumulate rapidly, and the thickness of the particles will also increase. In addition, the relationship between the starting position of the particles to accumulate and the spacing of the blanking port is not obvious, but the spreading length of the particles released by a single inlet in the tube increases with the spacing of the blanking port.
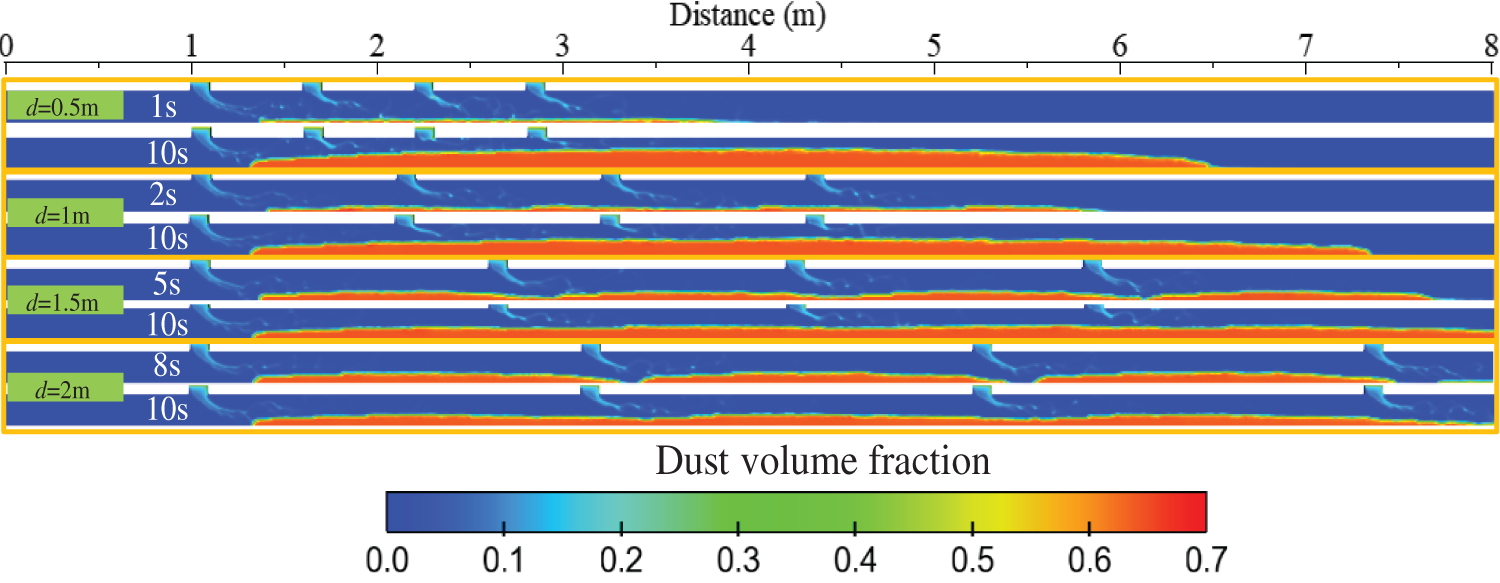
Figure 22: Distribution of dust volume fraction under different blanking intervals
Fig. 23 shows the variation of dust accumulation height with the spacing between the feeding ports, the results indicate that the smaller the spacing, the greater the particle accumulation thickness. When the spacing is 0.5 m, the dust accumulation thickness is 0.113 m; when the spacing is 2 m, the dust deposition thickness is 0.069 m, the spacing is increased by 4 times, the dust deposition thickness is reduced to about 0.6 times, and when the spacing rises to a certain value, the dust deposition thickness has a weakening trend.
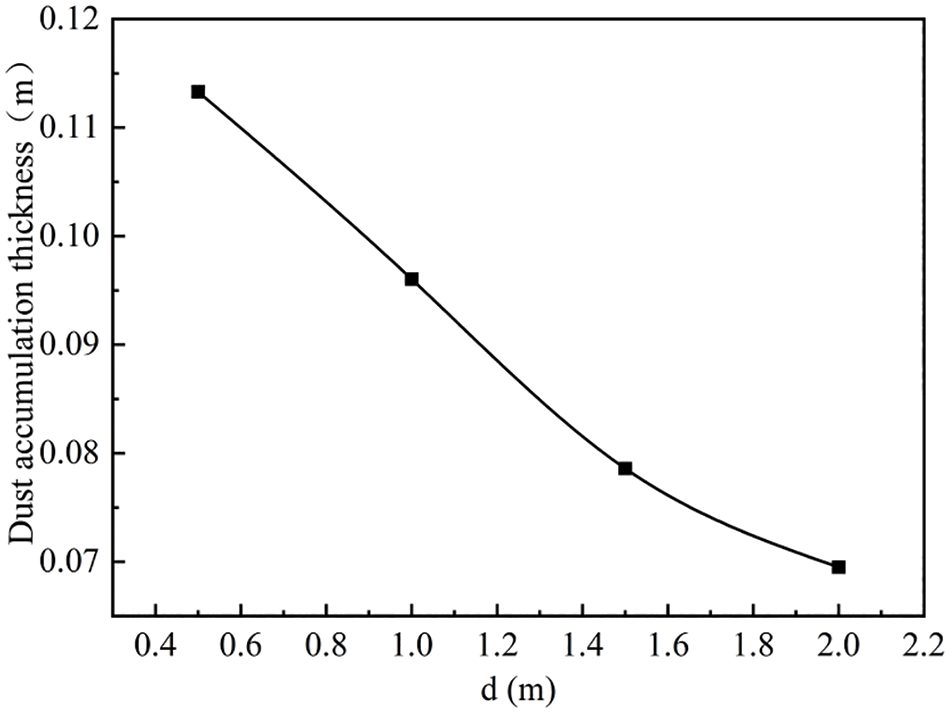
Figure 23: The change of dust accumulation height with the spacing of blanking ports
Pneumatic conveying is a complex two-phase flow process. In practical engineering, factors such as gas-solid ratio, intake method, number of inlets, main airflow velocity, and inlet angle all affect the conveying efficiency. This paper focuses on the gas-solid two-phase flow process within a horizontal pipe under continuous gas supply conditions. It analyzes the influence of the number of discharge ports, inlet airflow velocity, and the spacing between discharge ports on the dust movement process, laying the foundation for optimizing the material clogging process. The main conclusions of this study are as follows:
(1) When the number of feed ports increases, the thickness of the accumulated dust also increases, thereby narrowing the airflow space and increasing the airflow velocity near the outlet area. When adjacent discharges do not come into contact, the thickness of the dust accumulation is essentially unaffected by the number of feed ports, and the thickness of dust accumulation changes approximately linearly over time. However, when adjacent discharges come into contact, the more feed ports there are, the greater the thickness of the accumulation, and the thickness of dust accumulation changes non-linearly over time. Therefore, having too many feed ports can easily cause blockages within the pipe due to excessive dust accumulation.
(2) The higher the inlet velocity, the smaller the increase in the maximum internal velocity. When the inlet velocity is 5 m/s, adjacent discharge particles come into contact after 8 s. As the inlet airflow velocity increases, the initial contact time between adjacent discharge ports shortens. When the inlet airflow velocity increases to a certain value, the dense dust region in the latter part of the pipe slightly increases.
(3) When the spacing is 1.5–2 m, the residence time of particles between adjacent discharge ports increases first and then decreases. When the spacing increases by 4 times, the dust accumulation thickness decreases to about 0.6 times. However, when the spacing rises to a certain value, the decreased rate of dust accumulation thickness tends to weaken.
Acknowledgement: The paper is supported by Yantai Next Generation Industrial Robot and Intelligent Manufacturing Engineering Laboratory.
Funding Statement: The authors received no specific funding for this study.
Author Contributions: The authors confirm contribution to the paper as follows: study conception and design: He Wang; data collection: Kairuo Chen; analysis and interpretation of results: He Wang, Xiangliang Wang; draft manuscript preparation: He Wang. All authors reviewed the results and approved the final version of the manuscript.
Availability of Data and Materials: The datasets generated during and/or analyzed during the current study are available from the corresponding author on reasonable request.
Ethics Approval: Not applicable.
Conflicts of Interest: The authors declare no conflicts of interest to report regarding the present study.
References
1. Gao H, Wang X, Chang Q. Multi-scale analysis on the pulverized coal flow behaviors under high pressure dense-phase pneumatic conveying. Particuology. 2022;60:107–14. doi:10.1016/j.partic.2021.05.002. [Google Scholar] [CrossRef]
2. Wang C, Li W, Li B, Jia Z, Jiao S, Ma H. Study on the influence of different factors on pneumatic conveying in horizontal pipe. Appl Sci. 2023;13:5483. doi:10.3390/app13095483. [Google Scholar] [CrossRef]
3. Zheng Y, Zhang D, Rinoshika H. Multi-scale analysis on particle dynamics in horizontal pneumatic conveying with oscillating air flow. Powder Technol. 2023;15(420):118398. doi:10.1016/j.powtec.2023.118398. [Google Scholar] [CrossRef]
4. Zhou JW, Xu YJ, Guo XL, Cai WS, Wei X, Jiang HX. Numerical simulations on the flow regime characteristics of horizontal pneumatic conveying using CFD-DEM. Powder Technol. 2024;438:119641. doi:10.1016/j.powtec.2024.119641. [Google Scholar] [CrossRef]
5. Kalman H, Rawat A. Flow regime chart for pneumatic conveying. Chem Eng Sci. 2020;16(211):115256. doi:10.1016/j.ces.2019.115256. [Google Scholar] [CrossRef]
6. Klinzing GE. A review of pneumatic conveying status, advances and projections. Powder Technol. 2018;15(333):78–90. doi:10.1016/j.powtec.2018.04.012. [Google Scholar] [CrossRef]
7. Saluja G, Mallick SS, Karmakar S. Developing pneumatic conveying classification diagram for powders. Powder Technol. 2024;1(438):119671. doi:10.1016/j.powtec.2024.119671. [Google Scholar] [CrossRef]
8. Zhao HZY. CFD-DEM simulation of pneumatic conveying in a horizontal pipe. Powder Technol. 2020;1(373):58–72. doi:10.1016/j.powtec.2020.06.054. [Google Scholar] [CrossRef]
9. Rajabnia H, Orozovic O, Williams K, Lavrinec A, Ilic D, Jones M. Investigating the relationship between the time constant ratio and plug-flow behaviour in the pneumatic conveyance of biomass material. Processes. 2023;11(6):1697. doi:10.3390/pr11061697. [Google Scholar] [CrossRef]
10. Rajabnia H, Orozovic O, Williams KC, Lavrinec A, Ilic D, Jones MG, et al. Optimizing pressure prediction models for pneumatic conveying of biomass: a comprehensive approach to minimize trial tests and enhance accuracy. Processes. 2023;11(6):1698. doi:10.3390/pr11061698. [Google Scholar] [CrossRef]
11. Erken O, Ooi JY, Gupta P, Capozzi L, Hanley KJ. Parameters affecting plug characteristics in dense phase pneumatic conveying of ellipsoidal particles. Powder Technol. 2024;437:119561. doi:10.1016/j.powtec.2024.119561. [Google Scholar] [CrossRef]
12. Orozovic O, Lavrinec A, McCloy R, Meylan MH. A framework for modelling single slug horizontal pneumatic conveying. Powder Technol. 2023;427:118611. doi:10.1016/j.powtec.2023.118611. [Google Scholar] [CrossRef]
13. Yang D, Li L, Gao K, Zhou F, Ma W, Jiang H. Simulation study on the injection performance of the gas-solid injectors for large particles. Powder Technol. 2022;409:117819. doi:10.1016/j.powtec.2022.117819. [Google Scholar] [CrossRef]
14. Andrews MJ, O’Rourke PJ. The multiphase particle-in-cell (MP-PIC) method for dense par ticulate flows. Int J Multiphase Flow. 1996;2(22):379–402. doi:10.1016/0301-9322(95)00072-0. [Google Scholar] [CrossRef]
15. Smagorinsky J. General circulation experiments with the primitive equations. Mon Weather Rev. 1963;91(3):99–164. doi:10.1175/1520-0493(1963)091<0099:GCEWTP>2.3.CO;2. [Google Scholar] [CrossRef]
16. Snider DM. An incompressible three-dimensional multiphase particle-in-cell model for dense particle flows. J Comput Phys. 2001;2(170):523–49. doi:10.1006/jcph.2001.6747. [Google Scholar] [CrossRef]
17. Qiu GZ, Ye JM, Wang HG, Wang XF, Wang FJ, Sun YK, et al. CPFD simulation of gas-solids flow in annular combustion chamber of large-scale circulating fluidized bed. J Univ Chinese Acad Sci. 2016;2(33):218–22 (In Chinese). [Google Scholar]
18. Mo JY. Effect of inter-phase drag law in CFD simulation of liquid characteristics in a solid-liquid stirred tank. China: Beijing University of Chemical Technology; 2012. [Google Scholar]
19. Zhu X, Dong P, Tu Q, Zhu Z, Wang H. Investigation of gas-solids flow characteristics in a pressurised circulating fluidised bed by experiment and simulation. Powder Technol. 2020;15(366):420–33. [Google Scholar]
20. Amsden AA, Rourke PJ, Butler TD. KIVA-II: A computer program for chemically reactive flows with sprays. Los Alamos, NM, USA: Los Alamos National Lab. (LANL); 1989. LA-11560-MS. doi:10.2172/6228444. [Google Scholar] [CrossRef]
21. Liang Y, Zhang Y, Li T, Lu C. A critical validation study on CPFD model in simulating gas-solid bubbling fluidized beds. Powder Technol. 2014;263:121–34. doi:10.1016/j.powtec.2014.05.003. [Google Scholar] [CrossRef]
22. Ariyaratne WKH, Ratnayake C, Melaan MC. Application of the MP-PIC method for pre-dicting pneumatic conveying characteristics of dilute phase flows. Power Technol. 2017;310:318–28. [Google Scholar]
Cite This Article
 Copyright © 2024 The Author(s). Published by Tech Science Press.
This work is licensed under a Creative Commons Attribution 4.0 International License , which permits unrestricted use, distribution, and reproduction in any medium, provided the original work is properly cited.


 Submit a Paper
 Propose a Special lssue
 View Full Text
 Download PDF
 Downloads
 Citation Tools