 Open Access
ARTICLE
Aerodynamic Noise Distribution in Wind Turbines with Different Microporous Blade Tip Structures
School of Mechanical Engineering, Shanghai DianJi University, Shanghai, 201306, China
* Corresponding Author: Yuanjun Dai. Email:
Fluid Dynamics & Materials Processing 2024, 20(12), 2809-2842. https://doi.org/10.32604/fdmp.2024.054011
Received 16 May 2024; Accepted 15 August 2024; Issue published 23 December 2024
Abstract
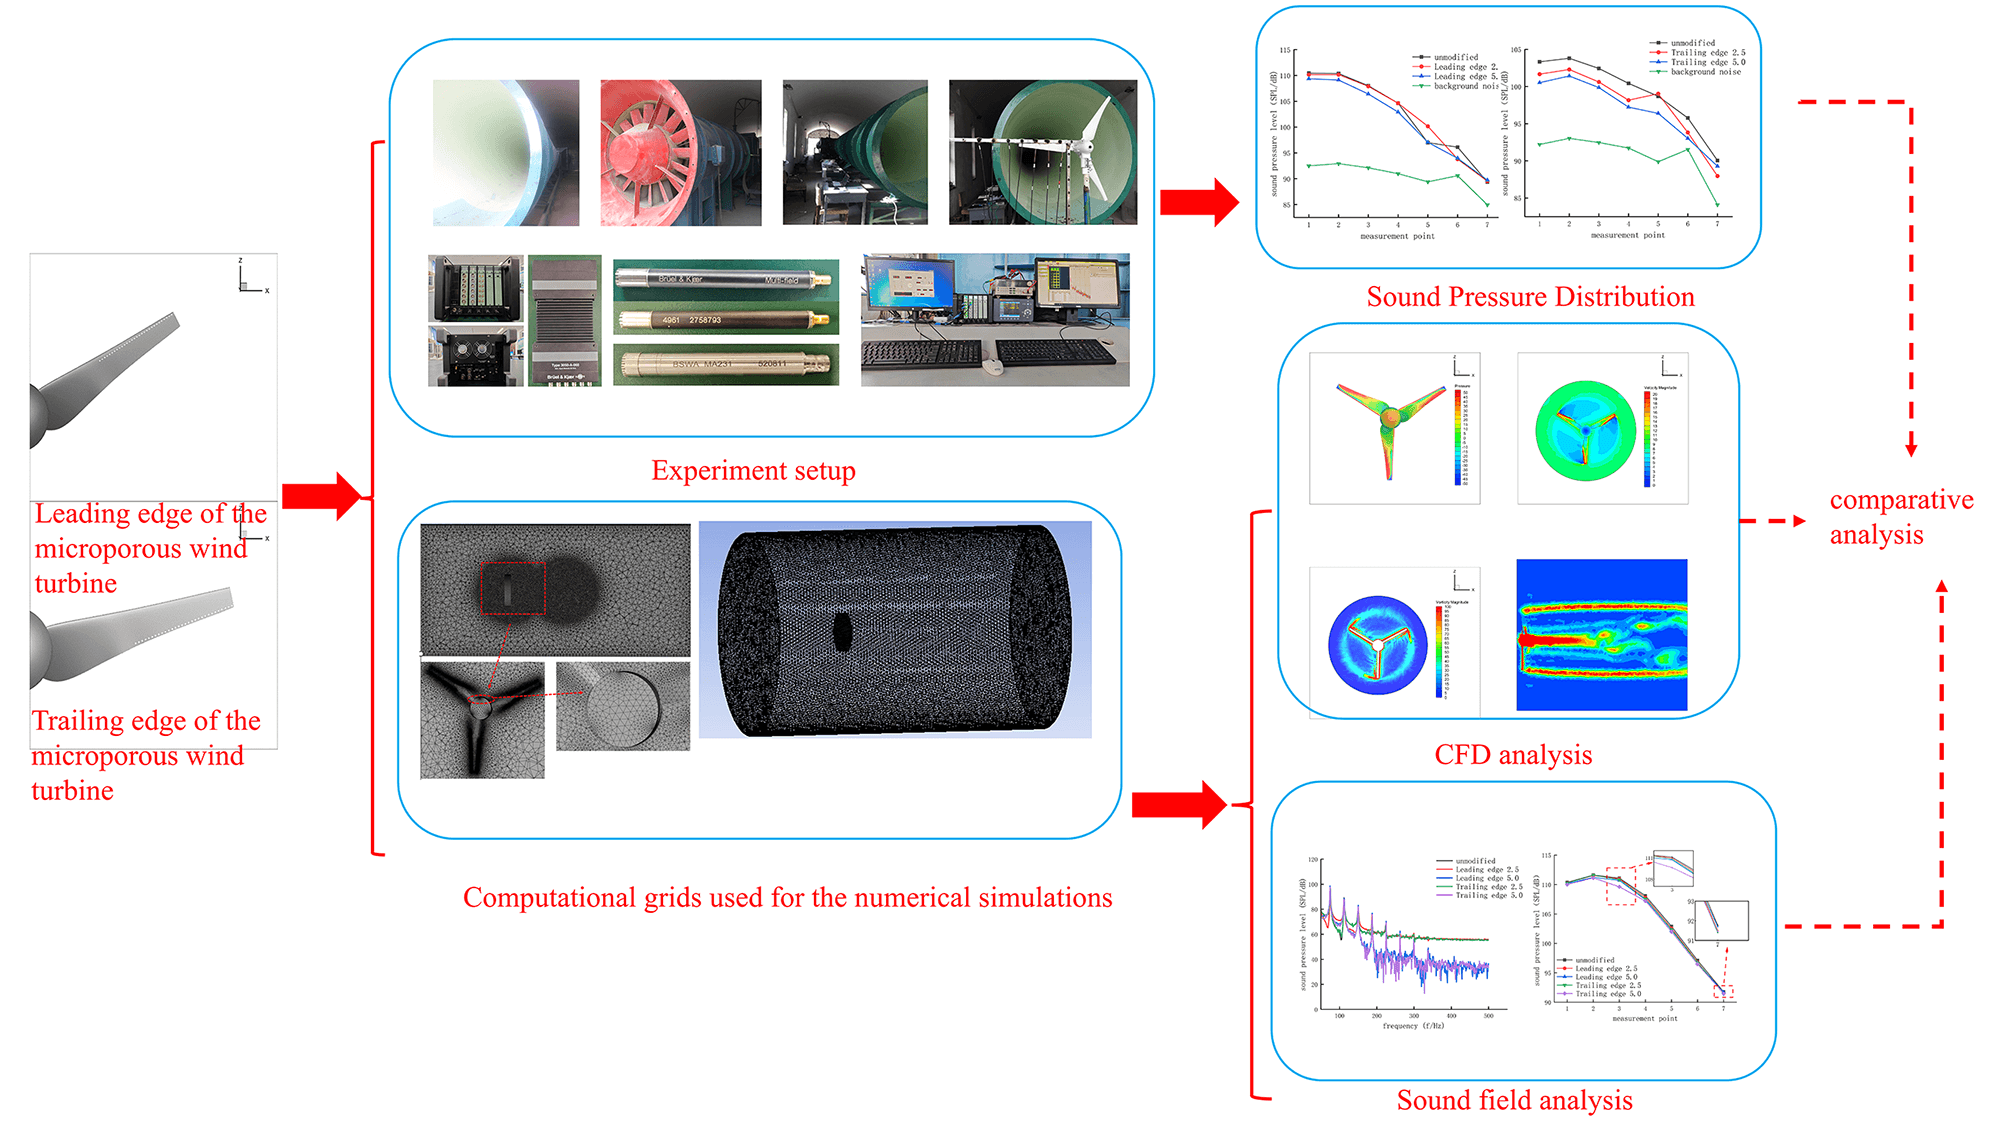
A linear microporous blade tip structure is designed in order to reduce the aerodynamic noise of a wind turbine during operations. Various structures of such a kind are considered and the related aerodynamic noise is determined in the framework of large vortex simulation and acoustic array test methods. The findings demonstrate that various blade tip designs can enhance the vortex trajectory in the tip region and lessen the pressure differential between the blade’s upper and lower surfaces. In particular, the wind turbine’s maximum linear velocity at the blade tip can be increased by 10%–23% while also effectively reducing the radial and axial aerodynamic noise during operation. A trailing edge microporous structure displays a better noise reduction effect than a leading edge microporous structure, and the maximum sound pressure level is reduced by an average of 1.92%–3.63%. The main factors influencing the wind turbine’s aerodynamic noise are its size and placement of microporous holes.Graphic Abstract
Keywords
The escalation of climate change and the upward trend in global temperatures have prompted a concentrated effort towards reducing emissions and promoting renewable energy sources. Numerous nations have pledged to decrease greenhouse gas emissions actively and have implemented measures to enhance financial backing and assistance for renewable energy sources, particularly wind energy. In recent years, there has been notable advancement in wind energy technology. Advancements in the design and production of wind turbines have led to increased efficiency, resulting in a decrease in the cost of wind electricity. Several nations have implemented governmental measures to promote the advancement of renewable energy, such as wind energy. During operation, wind turbines create noise [1,2], mainly composed of mechanical and pneumatic elements. Aerodynamic noise is the primary source of noise in wind turbines. It is created by variables such as the rapid movement of wind turbine blades, unstable airflow between the blades and the tower, and disturbances in airflow caused by the interaction between many wind turbines. Wind turbines can generate aerodynamic noise [3], negatively impacting the nearby population and nature [4,5]. Elevated noise levels can disturb the daily routines and sleep patterns of inhabitants nearby, diminishing their overall quality of life. Furthermore, noise can have detrimental impacts on species and ecosystems. Hence, investigating aerodynamic noise emitted by wind turbines safeguards the natural habitat and maintains ecological equilibrium.
Pourrajabian et al. [6] performed the initial optimization analysis of aerodynamic noise in a 750 W turbine by modifying the shape of both solid and hollow blades. The underlying code has been demonstrated to reduce aerodynamic noise while maximizing power output effectively. Zhang et al. [7] studied the aeroacoustic and aerodynamic performance of wind turbine airfoils. They examined the impact of leading-edge projections near the blade’s outer region. The study used experimental tests and numerical calculations to analyze how these projections inhibit airflow separation. Aihara et al. [8] computed sound transmission using the Ffowcs Williams and Hawking’s acoustic analogs. The sound pressure of the turbine was forecasted and verified against the measured outcomes during high blade tip speed ratio working conditions. Su et al. [9] employed the improved delayed separation vortex simulation (IDDES) technology and the Ffowcs Williams and Hawkins (FW-H) acoustic analog method to model the transient flow field and make predictions about the noise in the far-field. The accuracy of the CFD model is confirmed by comparing its results with the existing experimental data on power coefficients. Botha et al. [10] introduced an enhanced approach for predicting aerodynamic noise in vertical axis wind turbines. This method integrates the most up-to-date model for predicting airfoil noise. Hashem et al. [11] conducted a study comparing the noise levels generated by a wind turbine without any additional features and several types of wind turbines equipped with a wind lens. The results showed that wind turbines with a wind lens produced significantly louder noise. Li et al. [12] examined the impact of trailing edge thickness on wind turbine airfoils’ aerodynamic and aerodynamic noise properties. They used computational methods to verify the influence of trailing edge thickness on aerodynamic noise. Cao et al. [13] developed a numerical technique to create a noise map for a specific wind farm. Using the wind speed distribution data obtained from the wind farm, they simulated the propagation of noise from the wind turbine sources throughout the entire wind farm. In their study, Cotté [14] suggested combining an Amiet theory-based source model with a parabolic equation code to accurately simulate wind turbines’ noise emission and propagation in a non-uniform atmosphere. Dai et al. [15] employed acoustic equations to establish their study’s sound source integration plane. They then gathered acoustic field data for the rotor wake flow field to ascertain the most favorable angle of attack for the incoming flow. This study investigates the dispersion and transmission of sound waves in the wake of the rotor and the acoustic properties of noise that are influenced by external factors. Ottermo et al. [16] used a microphone array to quantify the noise levels produced by a 200 kWH-rotor vertical-axis wind turbine at four distinct locations. The majority of the noise was found to originate from a limited range of azimuths. Wang et al. [17] investigated the impact of wind turbine blade erosion on aerodynamic performance and noise characteristics, with a focus on the negative effects of erosion and the difficulties in detecting noise caused by it. Ye et al. [18] enhanced wind turbine blades’ aerodynamic performance and power production efficiency through modifications to the airfoil pattern, namely by using Gurney flaps. Additionally, they identified the drawbacks of higher drag and noise. In their study, Volkmer et al. [19] examined three techniques to enhance the blades of small horizontal-axis wind turbines to address the issue of noise. Through rigorous testing and analysis, they determined the most optimal solution that balances reducing noise and maintaining aerodynamic performance. In their investigation, Lee et al. [20] researched to forecast and quantify the aerodynamic noise produced by a 10 kW wind turbine. Yang et al. [21] introduced a novel approach that utilizes a convolutional neural network to forecast the aerodynamic noise of wind turbine airfoils. This method overcomes the constraints of conventional techniques and showcases its potential in designing low-noise airfoils. Madrigal Avalos et al. [22] conducted wind tunnel experiments to study the impact of three passive flow control techniques on reducing three-dimensional losses at the tip of a vertical axis wind turbine. They verified the effectiveness of these techniques in improving the power coefficient. They identified the end plate technique as optimal for enhancing performance while highlighting its potential issues. Dinh Le et al. [23] improved the efficiency of the Savonius wind turbine by adopting a new airfoil design that is particularly well-suited for use in urban areas. They confirmed its effectiveness by analyzing the flow dynamics and doing a POD analysis. Nakhchi et al. [24] utilized the Extreme Gradient Boosting (XGBoost) machine learning technique to forecast horizontal-axis wind farms’ power, wake, and turbulence properties when subjected to yaw control. The findings demonstrated that XGBoost outperforms ANN (Artificial neural network) and deep learning algorithms regarding power prediction, error reduction, and training time for wind farms with yaw misalignment. Sun et al. [25] investigated the propagation of aerodynamic noise generated by multiple wind turbines and developed an effective hybrid method to jointly predict wind turbines’ aerodynamic and aeroacoustic performance. Zhang et al. [26] studied the aerodynamic noise generated by wind turbines and their distribution characteristics, especially the noise problems faced when installed close to residential areas. Liao et al. [27] explored how to extract low-frequency elements from wind turbines’ aerodynamic noise background to improve online monitoring efficiency. Li et al. [28] introduced a new optimisation method for wind turbine blade design, which considers not only the structural strength and stiffness of the blade, but also the noise and power generation efficiency. Llorente et al. [29] explored the effects of applying trailing edge serrations to wind turbine blades on their aerodynamic performance.
Overall, the scholarly research on wind turbine aerodynamic performance primarily centers around numerical modeling, while the investigation into enhancing wind turbine aerodynamic performance centers around modifying the blades. This work focuses on two objectives: optimizing the aerodynamic performance of the wind turbine and lowering the aerodynamic noise generated during its operation. It also involves designing a tiny wind turbine with a linear microporous blade tip structure. The positions of the unmodified leading and trailing edges can be adjusted by altering the diameter of the micropores’ hole pattern. These edges are categorized as follows: leading edge with a 2.5-hole pattern, leading edge with a 5.0-hole pattern, trailing edge with a 2.5-hole pattern, and trailing edge with a 5.0-hole pattern. This study examines the aerodynamic properties of wind turbines with various linear microporous tip structures. The investigation integrates extensive vortex simulations with acoustic equations and experimental methods. The objective is to analyze the impact of different linear microporous tip structures on the aerodynamic noise generated by wind turbines.
2.1 Modified Design of Leaf Tip Structure
To mitigate the aerodynamic noise generated by wind turbines during their operation, we draw inspiration from the alteration of the blade tip structure of wind turbines. This study presents the design of a compact wind turbine, including a linear microporous blade tip structure. The design incorporates adjustable microporous hole diameters and allows for flexibility in positioning the leading and trailing edges. The study aims to investigate the impact of various linear microporous blade tip architectures, including unmodified, leading-edge 2.5-hole patterns, leading-edge 5.0-hole patterns, trailing edge 2.5-hole patterns, and trailing edge 5.0-hole patterns, on the aerodynamic noise of wind turbines.
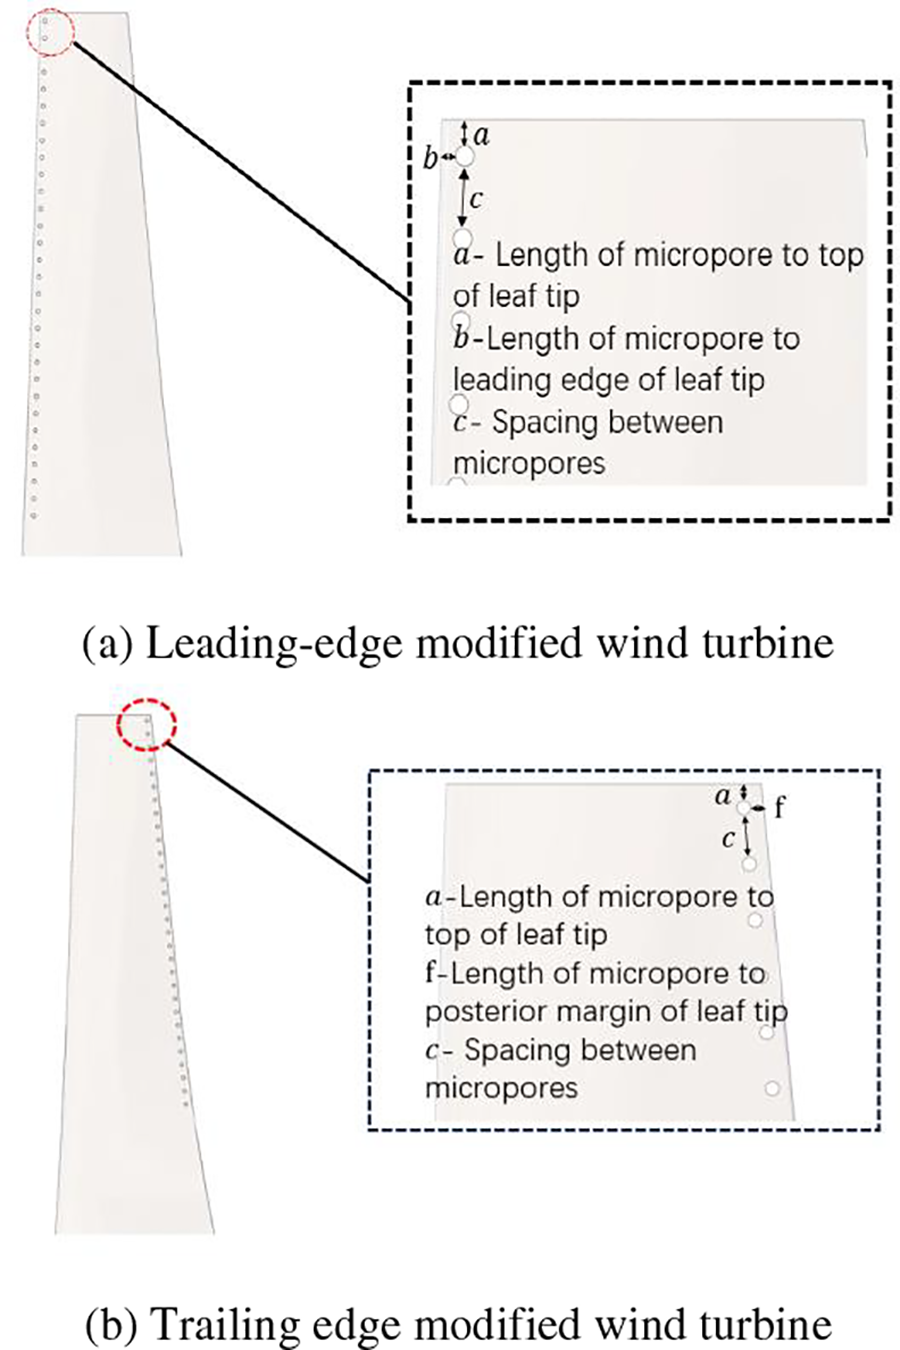
Figure 1: Schematic diagram of linear microporous blade tip structure

This document presents the wind turbine’s rated design power of 300 W, rated design wind speed of 8 m/s, and rated design rotating speed of 750 r/min.Various linear microporous tip structures and blade bodies are developed to assess the impact of the transition region between the tip structure and the blade body on the wind turbine’s aerodynamic performance. These structures aim to achieve a seamless circular connection by fitting the airfoil section with curves. The blade parameters are presented in Table 2, while the three-dimensional model of the wind turbine is depicted in Fig. 2.

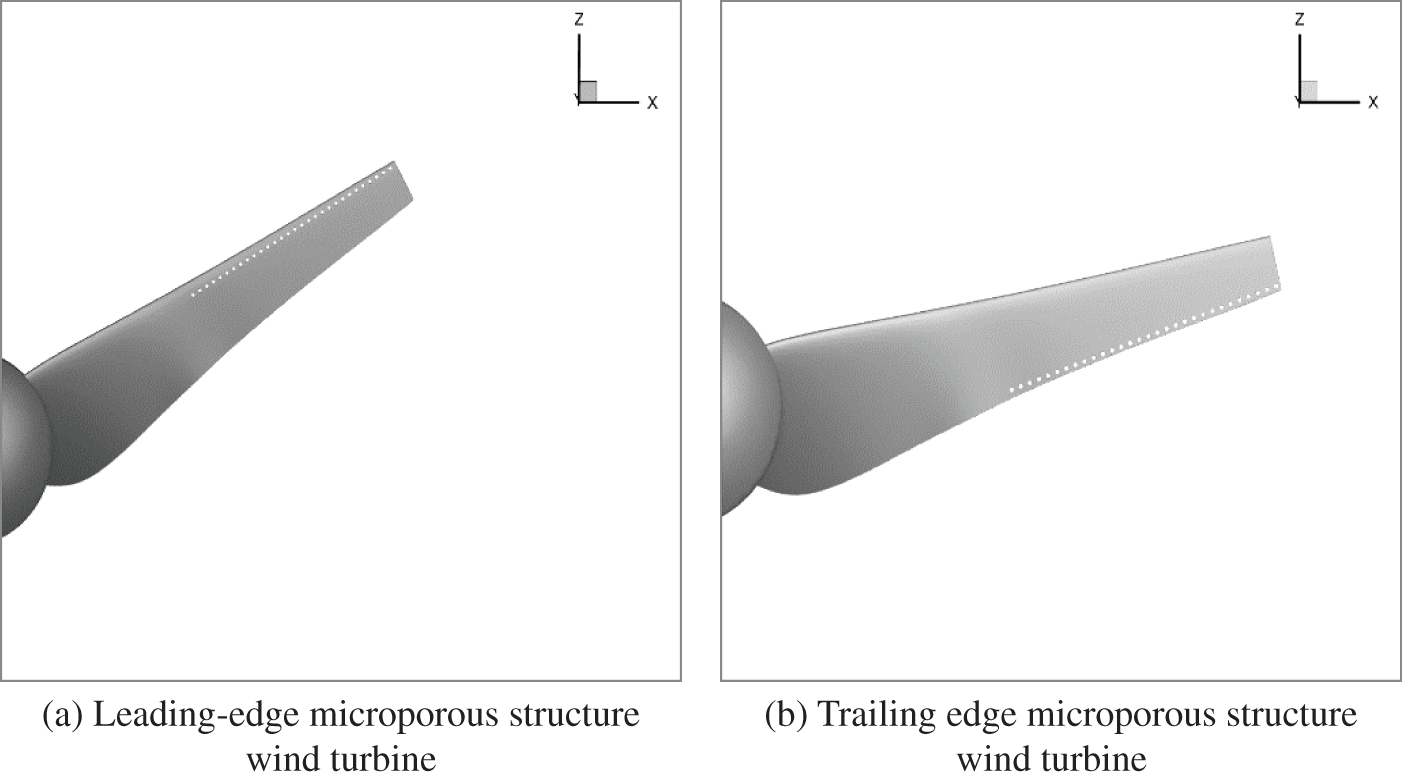
Figure 2: Blade tip modified before and after wind turbine models
This work presents the design of a small wind turbine equipped with a linear microporous tip structure. The objective is to comprehensively analyze the aerodynamic properties of wind turbines with various linear microporous tip structures. This analysis is conducted using a combination of numerical simulations and acoustic array experiments. The study consisted of two parts: Study 1, which focused on numerical computation, and Study 2, which involved a pilot test component. As shown in Fig. 3. The graphic below illustrates the pilot test section. The post-processing’s numerical calculation phase mainly determines the blade surface’s flow field, including pressure, linear velocity, trailing vortex volume, radial vortex volume, and other relevant physical parameters.
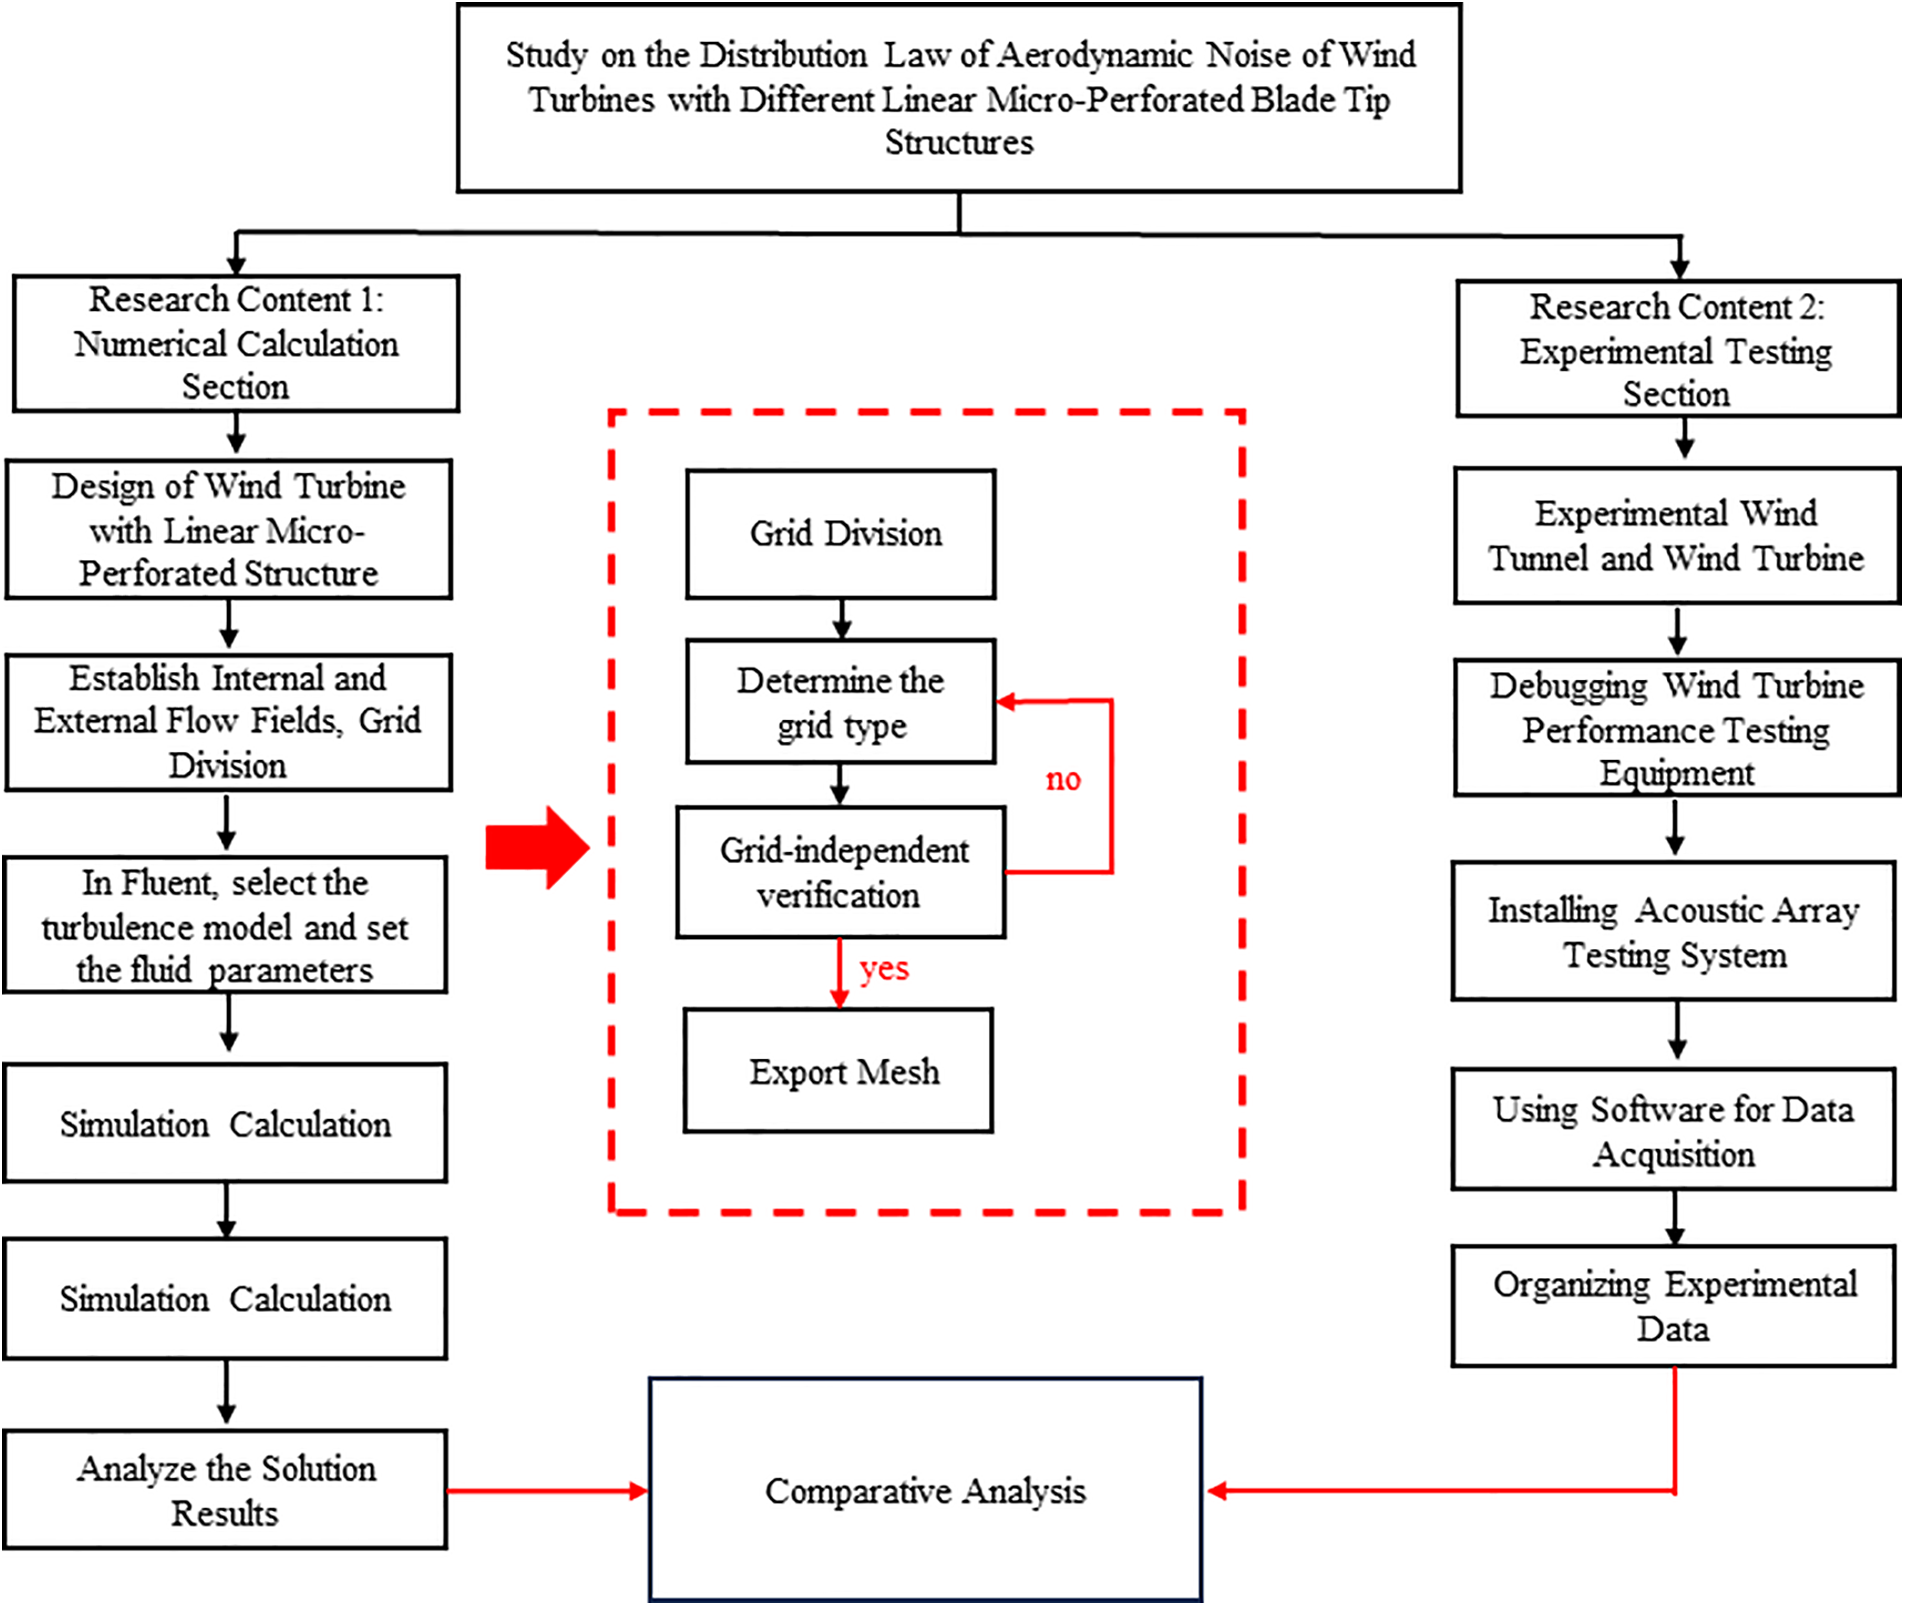
Figure 3: Technology roadmap
Furthermore, this analysis examines the aerodynamic noise produced by wind turbines with various linear microporous blade tip architectures, focusing on both radial and axial components. Additionally, the study investigates the spectral features of this noise. Spectral features of this noise are employed to uncover the alteration in the aerodynamic properties of a wind turbine following the adjustment of the blade tip construction. As part of Research Component 2, specifically the Pilot Testing component. A comparative analysis is conducted on the radial propagation test and axial propagation test of radiated sound in the wake area of a wind turbine. The study examines the aerodynamic properties of wind turbines with various linear microporous tip structures.
3 Calculation Parameter Setting
A wind turbine model with various linear microporous blade tip constructions is created, incorporating three primary components: the wind turbine itself, the revolving area, and the stationary area. The rotating domain has a radius of 1.5 times the radius of the wind turbine (1.5 R), while the stationary domain has a radius of 8 times the radius of the wind turbine (8 R). The total length of the stationary domain is 24 times the radius of the wind turbine (24 R). The rotating domain is located eight times the radius of the wind turbine away from the velocity inlet and 16 times the radius of the wind turbine away from the pressure outlet. In this context, R represents the radius of the wind turbine with different linear microporous blade tip structures. Modify the subject. The outer and rotating domains are graphed independently during meshing and combined in the fluent setup. When configuring the Meshing Meshing setup in Ansys software, choose CFD as the preferred Physics option and Fluent as the preferred Solver option for meshing in a rotational domain. The mesh was subsequently encrypted using the following settings: Capture Curvature and Capture Proximity were selected for Size Adjustment, Neighborhood Gap Factor was set to 2, and in Mesh Adjustment, Expansion Options were chosen for the first Aspect Ratio, which was set to 6. The Maximum Number of Layers was set to 3, and the Growth Rate was set to 1.2. After generating the grid, the grid quality was again assessed using the grid quality information. The criterion for evaluating the grid quality was skewness, with an average value of 0.2649, which satisfied the criterion. In this study, it is imperative to precisely determine specific computational characteristics of the wind turbine following the CFD numerical simulation. Thus, to meet the accuracy criteria of the calculation, the surface of the wind turbine and the spinning domain are assigned a smaller mesh size.
In Comparison, the stationary domain is assigned a larger mesh size. The stationary domain meshing was performed by choosing CFD as the preferred physics and Fluent as the selected solver. The mesh was then encrypted and dimensioned using Capture Curvature and Capture Proximity. The expansion option was set to Smooth Transition, with a maximum of 3 layers and a growth rate of 1.2. A local encryption was employed to insert two local coordinate systems to enhance the observation of the flow field features near the rotational domain and in a specific area behind it. The local coordinate system option allows for selecting a coordinate system based on the origin, rotation domain, and a particular area. Settings are then made using X, Y, and Z coordinates, followed by the selection of geometry size adjustment in the mesh delimitation. The sphere’s radius is determined based on the two local coordinate systems; subsequently, the mesh is encrypted. The skewness is chosen as the criterion after generating the mesh and examining its quality in the mesh quality information. The average value of 0.20324 meets the required level. This research utilizes a polyhedral mesh, effectively decreasing the number of meshes and minimizing computing expenses.
Additionally, using a polyhedral mesh can improve the accuracy of unit and flow surfaces by minimizing interpolation errors and preventing the propagation of incorrect values. This paper utilizes CFD numerical simulation to determine the precise computational characteristics of the wind turbine. A smaller mesh size is applied to the wind turbine surface and rotating domain to meet the accuracy requirements, while a larger mesh size is used for the stationary domain. The division of the mesh is illustrated in Fig. 4.
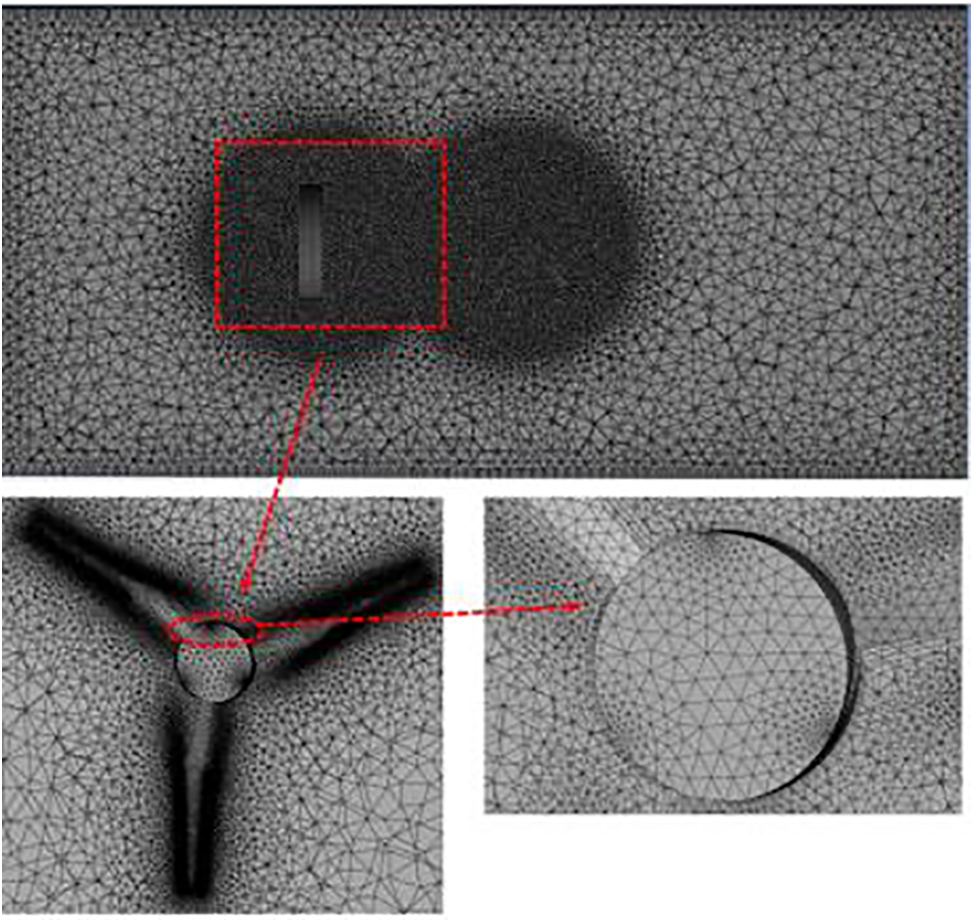
Figure 4: Grid division
The precision of the grid has a direct impact on the correctness of the computational outcomes. It is necessary to establish the optimal number and size of meshes to assess the effect of the number of meshes on the flow field results. Grid-independence verification will ensure that variations in cell size maintain the quality of the calculated results. The number of grids in the rotating region is progressively encrypted and divided into five distinct numbers of computational domain grids, namely 1,045,131, 2,159,970, 2,996,691, 4,099,094, and 5,518,007 cells, respectively, taking into account the time cost of computing. The models above were computed using a y+ value of less than 1. Table 3 displays the least relative error of 0.34722%. The rotating domain contains 2,338,935 grid cells, while the outer watershed has 1,760,159 grid cells. The relative error of the grid is 0.347222%, demonstrating a high level of computational accuracy.

3.2 Fluent Solution and Boundary Condition Setting
This work utilizes the computational fluid dynamics (CFD) approach to numerically simulate various linear microporous tip structure wind turbines. Examining these turbines’ flow field and aerodynamic noise characteristics is the objective. The technique for solving numerical computations is as follows: Firstly, the wind turbine model is divided into two parts in the meshing process. The separate divisions are to enhance the accuracy of the calculation. The outer watershed and the rotating domain are plotted separately in the meshing and combined in the fluent setup. The mesh file is imported into Fluent, and the necessary settings are configured. Ultimately, the solution outcomes are exported, and the post-processing software is employed to examine the aerodynamic properties of the wind turbine both before and after the blade tip alteration. The solution and boundary conditions are established in the following manner:
(1) Verify the accuracy of the model’s mesh size. Note that the default unit for drawing the mesh is meters. Thus, the mesh unit will be converted to millimeters during scaling. Additionally, check for any negative volume in the generated mesh. If negative volume is present, the mesh nodes should be re-divided.
(2) Choose Large Eddy Simulation as the turbulence model in the Fluent setup, WALE as the subgrid-scale model, and pick the acoustic equations (Ffowcs Williams & Hawkings). The user chooses the export option to export the raw data in ASD format and simultaneously compute the acoustic signals. The model parameters were set as follows: the incoming flow velocity was chosen as eight m/s, the Y-component of the incoming flow direction was selected as 1, and the remaining model parameters were set to 0. The blade of the wind turbine is designated as the source of noise. The coordinates (X, Y, Z) of 35 noise points will be assigned to their respective locations based on the test’s noise point locations.
(3) Implement wind turbine rotation using slip mesh (Mesh motion). Connect the wind turbine rotation and stationary domains through an interface connection to transfer data. Set the wind turbine rotational speed to 750 revolutions per minute (r/min), and set the direction of the rotational axis (x, y, z) to (0, −1, 0).
(4) Configure the inlet of the stationary domain as a velocity-inlet and specify the incoming wind speed as eight m/s. Set the outlet of the stationary domain as a pressure outlet and define the outlet ambient pressure as 1 atm.
(5) The pressure-velocity coupling algorithm chosen is SIMPLE, known for its faster convergence, more effective pressure correction, and enhanced overall computational efficiency. Convergence can typically be attained in a reduced number of iterations, resulting in time savings for computational processes. It has improved stability when handling flows with high Reynolds numbers and flow fields characterized by intricate geometries. It necessitates a reasonably low level of mesh quality and is also very compatible with unstructured meshes. SIMPLE applies to a broad spectrum of flow types, encompassing laminar and turbulent flows, steady state, and transient flows. It also excels at handling complex problems involving multiple interconnected fields of physics. The SIMPLE method enhances the coupling between pressure and velocity by refining the computation of the pressure correction term, improving the solution’s precision and stability.
(6) Specify the number of time steps as 1000 and set the time step to 0.001 s. To achieve a stable and accurate computation of the flow field and sound pressure level does not appear to modify the subject’s, to achieve a stable and precise calculation of the flow field and sound pressure level, the torque of the wind turbine is continuously monitored. The calculation is considered to be converged when the residual curve of the transient simulation decreases significantly within a time step, typically by two to three orders of magnitude, and the torque of the wind turbine remains stable.
The primary objective of this experiment is to assess the aerodynamic noise generated by the wind turbine in the immediate downstream area while maintaining a constant incoming wind speed. The experiment took place in the exit section of the B1/K2 low-speed wind tunnel at the “Provincial and Ministry Joint Key Laboratory of Wind and Solar Energy Utilization Technology” at the Inner Mongolia Institute of Technology (IMIT). The testing instruments and software for associated computations were sourced from the Key Laboratory of Energy Efficient Utilization Technology of Xinjiang Engineering Institute. The noise test instrument used in the experiment was the PULSE system manufactured by B&K in Denmark. The microphone that produced the noise was the B&K model 4189-A-021.
This experimental investigation was conducted in the exit portion of the B1/K2 low-speed D.C. wind tunnel at Inner Mongolia University of Technology. The wind tunnel has two experimental sections, one with an open mouth and one with a closed mouth, and the Rui current may be varied. The wind tunnel has a total length of 24.59 m and consists of several primary structural components, including the power section, closed experimental section, open experimental section, and frequency converter. The maximum power output of the dynamic section is 55 kilowatts. The closed experimental section has a length of 3 m and a diameter of 1.0 m (D = 1.0 m). The wind speed is ≤60 m/s, the diameter of the open k-check section is D = 2.0 m, the wind speed is ≤20 m/s, and the turbulence degree inverter has a frequency range of 0.0 to 60.0 Hz, with its construction depicted in Fig. 5. The power analyzer utilized is the FLUKE 4000CN model, with a maximum input voltage of CATII 1000 V and a maximum input current of CATII 1000 A. It boasts an accuracy of ±0.2%.
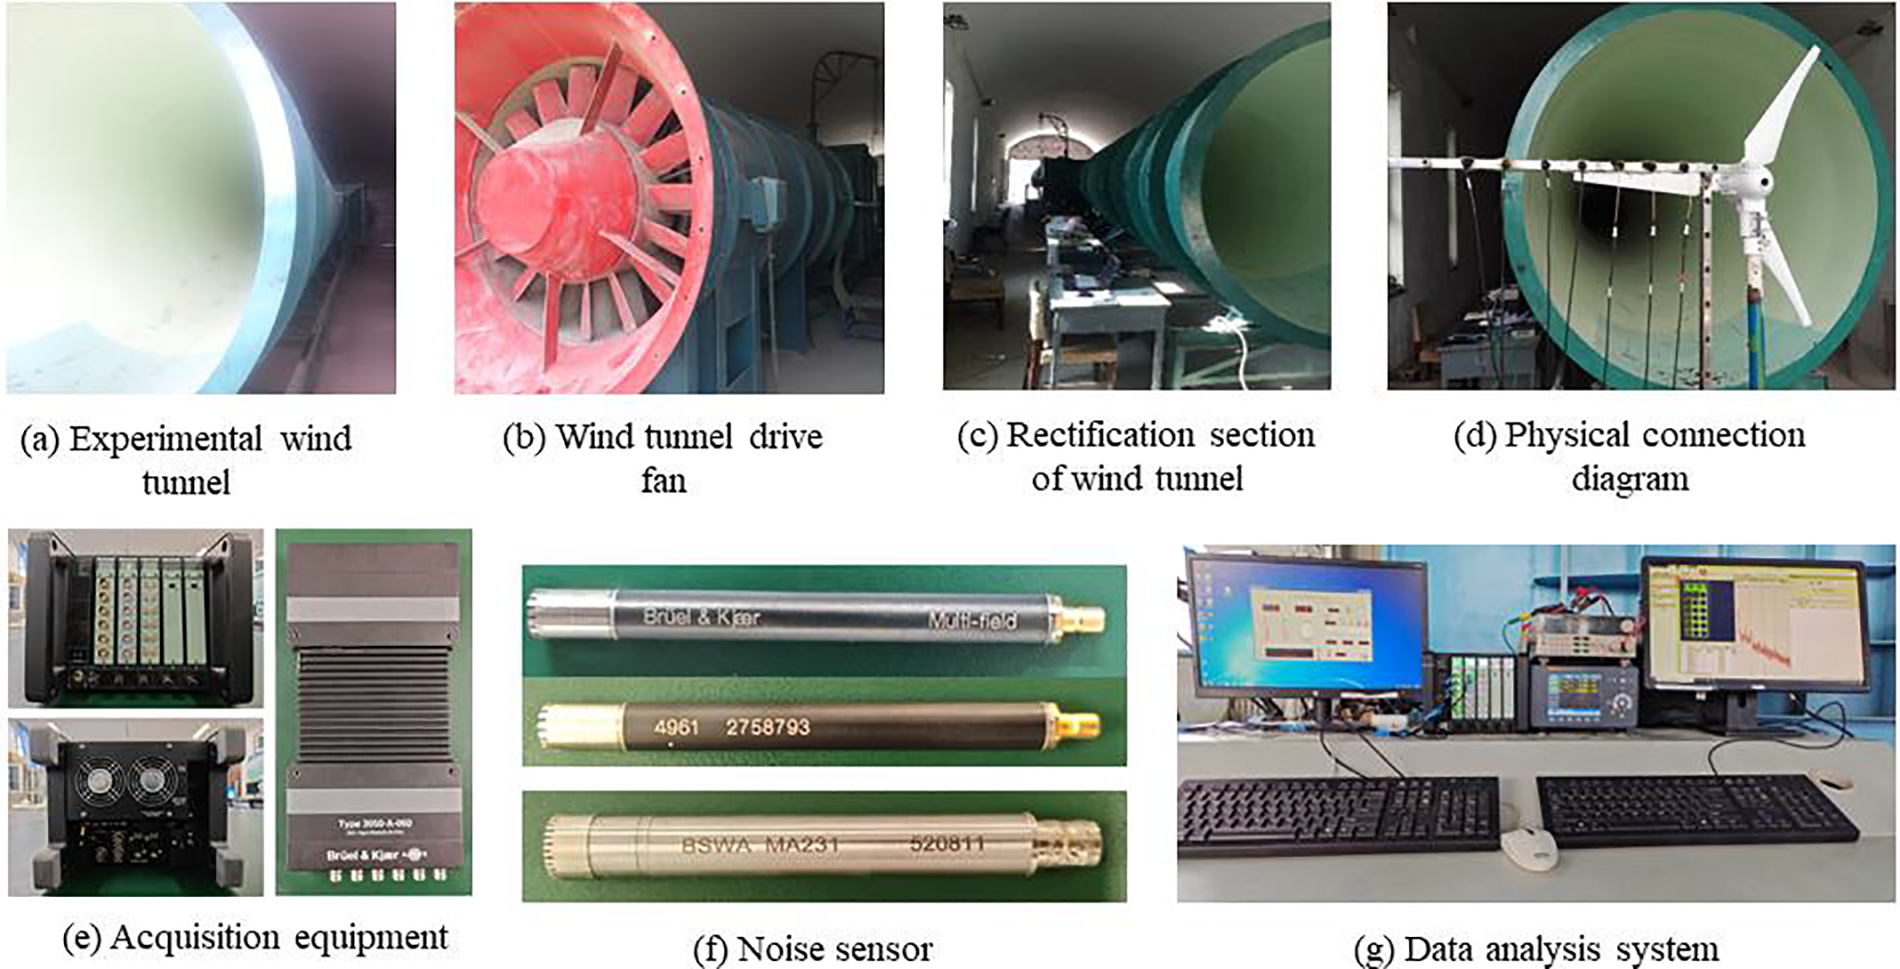
Figure 5: Experimental equipment
Additionally, the load meter employed is the IT8512A+ model from IDEXX Company. Modify the subject: If it is necessary to operate both the power analyzer and load meter during testing. Instrumentation will allow for the measurement and control of rotational speed and output power under various working situations, as depicted in Fig. 5. The wind turbine has a stall because it is rotating too fast, as shown in Fig. 5g. The experiment involves collecting the aerodynamic noise signal of a wind turbine wind wheel using a noise sensor. The B&K 4961 type sensor is used, which has a compact design with dimensions of L = 79.3 mm and Φ = 7 mm. The sensor’s physical diagram and parameter model are shown in Fig. 5f. The sensor has a sensitivity of 58.2 mV/Pa, a range of 20–130 (dB), a frequency range of 5–20 k (Hz), a power supply requirement of 24–28 (V), an accuracy of 0.3 (dB), and a mass of 5.0 (g). The frequency is measured in hertz (Hz), the power requirements range from 24 to 28 volts (V), the accuracy is 0.3 decibels (dB), and the mass is 5.0 grams (g), as depicted in Fig. 5f. The wind turbine parameters for the test wind turbine are identical to the values listed in Table 2, with the blade material specified as polyester fiber. The data acquisition system employs the Brüel&Kjaer Model 3660-C-100. The data acquisition system consists of a Brüel&Kjær Model 3660-C-100 equipped with five wireless LAN-XI modules, two Model 2831-a battery modules, and a Model 3053-B-12 high-density 12-channel data acquisition front-end channel. This configuration is depicted as (e) in Fig. 5. The Brüel&Kjaer Noise Analysis System Type 3660-C-100 is a sophisticated instrument designed for precise sound and vibration measurements. The basic specifications of the device include a frequency range of 20–20 kHz, making it appropriate for a broad range of acoustic measurements. Capable of accommodating a maximum of 16 channels, enabling the collection of measurements from many points simultaneously. A dynamic range over 120 dB guarantees accurate and low-noise measurements. The high-resolution data capture is achieved by a sampling rate of up to 51.2 kHz. Enables the direct connection of IEPE accelerometers and microphones to support various sensor types. It consists of high-pass and low-pass filters to condition the signal. Enables seamless data transmission and analysis by connecting to a computer through a LAN or USB interface. Enables A.C. power input to guarantee consistent and reliable functioning over an extended period.
The test is carried out in compliance with the GB/T 19068.3-2003 standards. Wind Tunnel Testing Methods and GB/T 19068.2-2003 for Off-grid Wind Turbine: Part 3 The second part of the off-grid wind turbine project focuses on test methods, namely the GB/T 6882-2008 Acoustic Sound Pressure Method for determining sound power levels of noise sources. Wind tunnel testing was performed in the exit section of the B1/K2 low-speed wind tunnel. The task used a specialized testing apparatus designed for small-scale wind turbines. Five blade variations (unmodified, leading-edge 2.5-hole pattern, leading-edge 5.0-hole pattern, trailing edge 2.5-hole pattern, and trailing edge 5.0-hole pattern) were specifically developed to meet the experimental requirements for conducting noise characterization investigations. The wind turbine is installed based on the current operational circumstances, with the turbine and generator spindle being immediately fastened together and the generator is positioned on the test tower. The wind turbine is placed squarely at the center of the wind tunnel, and the rudder is fixed simultaneously. This experimental setup is illustrated in Fig. 6.
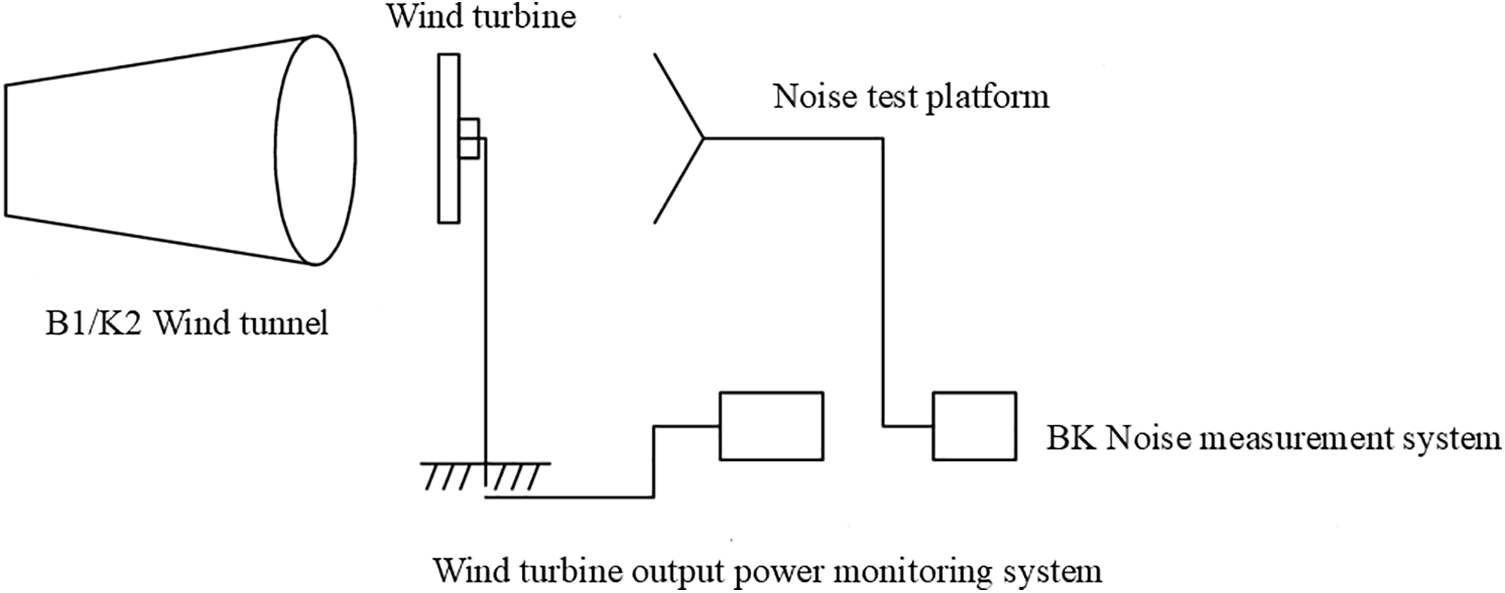
Figure 6: Test scheme diagram
We employed the acoustic array method to thoroughly assess the noise properties of wind turbines with modified and unmodified blade tip structures. The experiment involved conducting tests at 35 specific locations along the test line, positioned at a 90° rotation angle from the wind turbine’s rotational plane. These tests were conducted in five different cross-sections. The coordinate axis of the test area is defined as the plane perpendicular to the wind turbine’s rotation axis. It passes through the point where the wind turbine’s leading edge of the blade tip airfoil is located. This plane is known as the rotation plane of the wind turbine. The rotation center of the wind turbine is the point where the rotation axis of the wind turbine intersects with this plane. Translate laterally along the wind turbine’s axis of rotation, extending outward in the direction perpendicular to the plane of rotation, by a distance of 30 cm to establish the origin of the coordinate system as point o. The x-axis, passing through the origin, is aligned with the axis parallel to the incoming flow. The positive direction of the x-axis is defined as the direction of the incoming flow. The y-axis is parallel to the ground, passes through the origin, and is perpendicular to the incoming flow. The positive direction of the y-axis is considered parallel to the ground and away from the origin. A test line is placed along the x-axis, starting at the origin (point o) in the positive direction. The test line is put every 10 cm, with five lines. The first test line is located at x = 20 cm. The distance between each test point on the test line is 10 cm, as seen in Fig. 7.
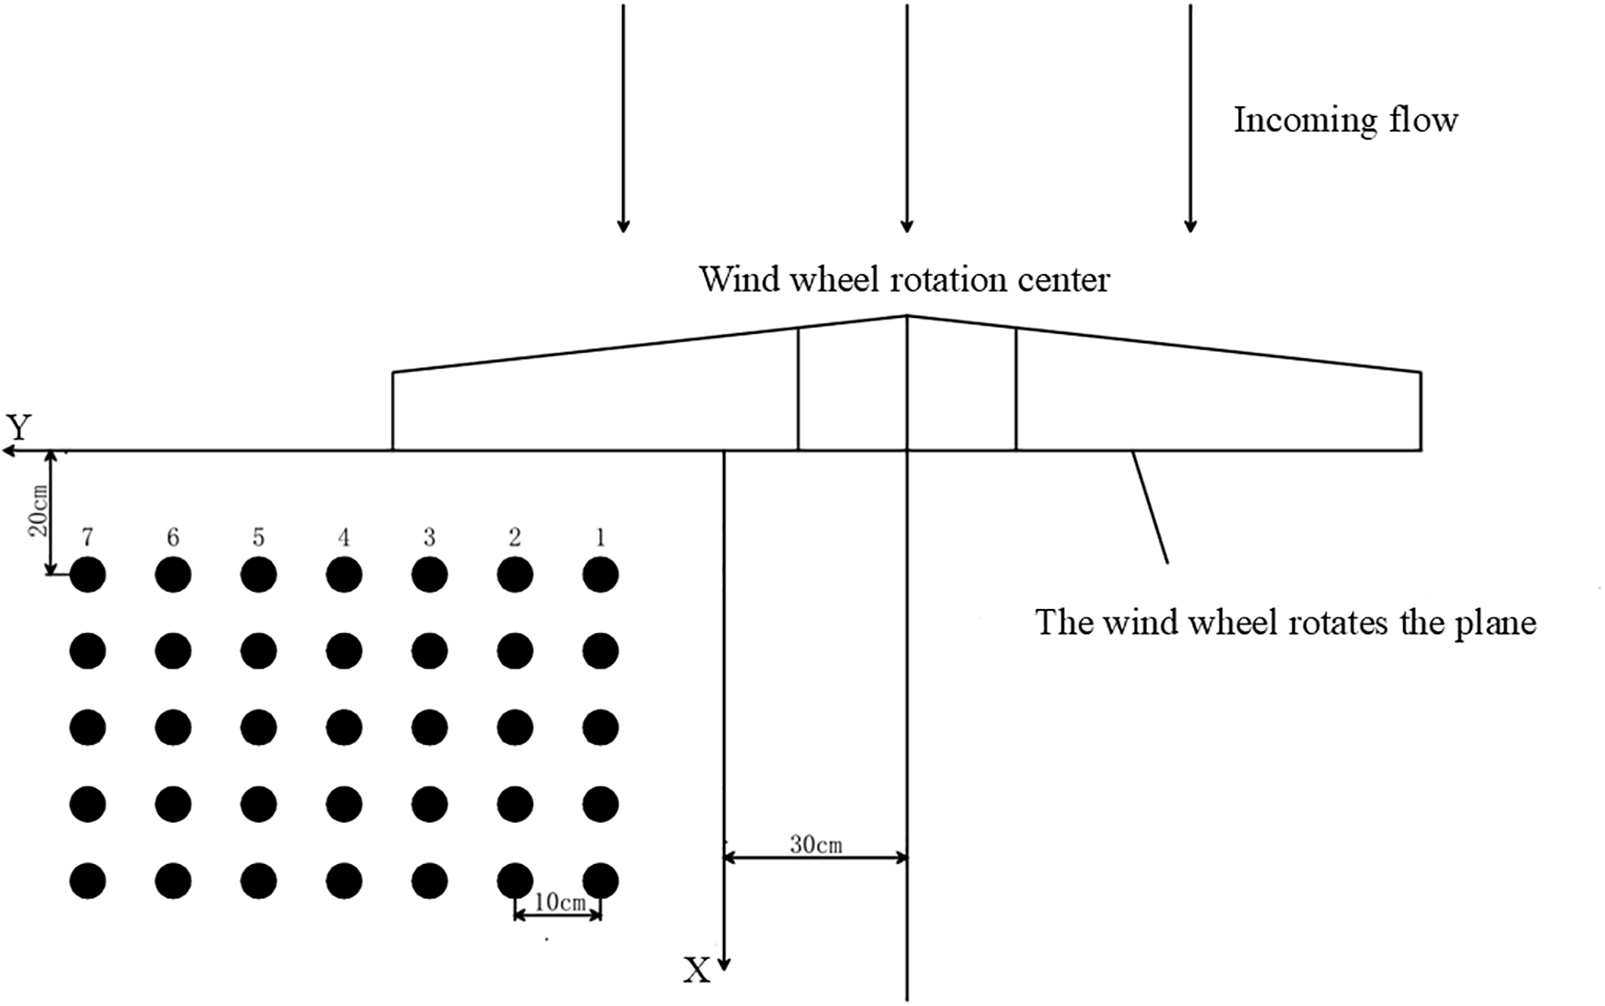
Figure 7: Schematic diagram of monitoring points
The data was gathered via the Time Data Recorder module within the PULSE platform, which B&K. Subsequently created, the obtained data was analyzed using the Reflex program.
5 Flow Field Characterization and Aerodynamic Noise Analysis of Wind Turbines with Different Linear Microporous Blade Tip Structures
This chapter utilizes numerical simulations to examine further the impact of various linear microporous blade tip constructions on wind turbines’ flow field characteristics and aerodynamic noise. The study initially analyzed the variations in physical quantities such as pressure, linear velocity, wake vorticity, and radial vorticity on the blade surface in the flow field of wind turbines with different linear microporous tip structures. This analysis was conducted under the rated working condition of wind speed 8 m/s and rotational speed 750 r/min. The study examines the changes in aerodynamic properties of wind turbines after modifying the tip structures by analyzing the radial and axial aerodynamic noise and spectrum features of wind turbines with various linear microporous tip designs.
5.1 Wind Turbine Blade Surface Pressure Analysis
5.1.1 Blade Pressure and Suction Surfaces
Fig. 8 depicts the cloud diagrams of wind turbines’ pressure and suction surfaces with varying linear microporous blade tip structures at rated operating circumstances. The cloud diagram of the blade pressure surface reveals that as the wind turbine wind wheel rotates, the blade’s leading edge initially encounters the incoming air, resulting in significant aerodynamic forces. Aerodynamic forces lead to a progressive rise in pressure on the blade’s surface, starting from the back end and moving towards the front end, ultimately reaching its highest point at the tip. The blade experiences higher aerodynamic loads at the leading edge and the most significant differential pressure in the tip region due to the varying pressure distributions on its pressure and suction surfaces. Thus, to ensure that the wind turbine blades possess adequate strength, the main objective is to modify the shape of the blade tips to enhance the airflow at the tips. Modifying the blade tips of wind turbines can reduce the aerodynamic noise generated during rotation without compromising the rated output power requirements. This improvement enhances the overall aerodynamic performance of the wind turbine.
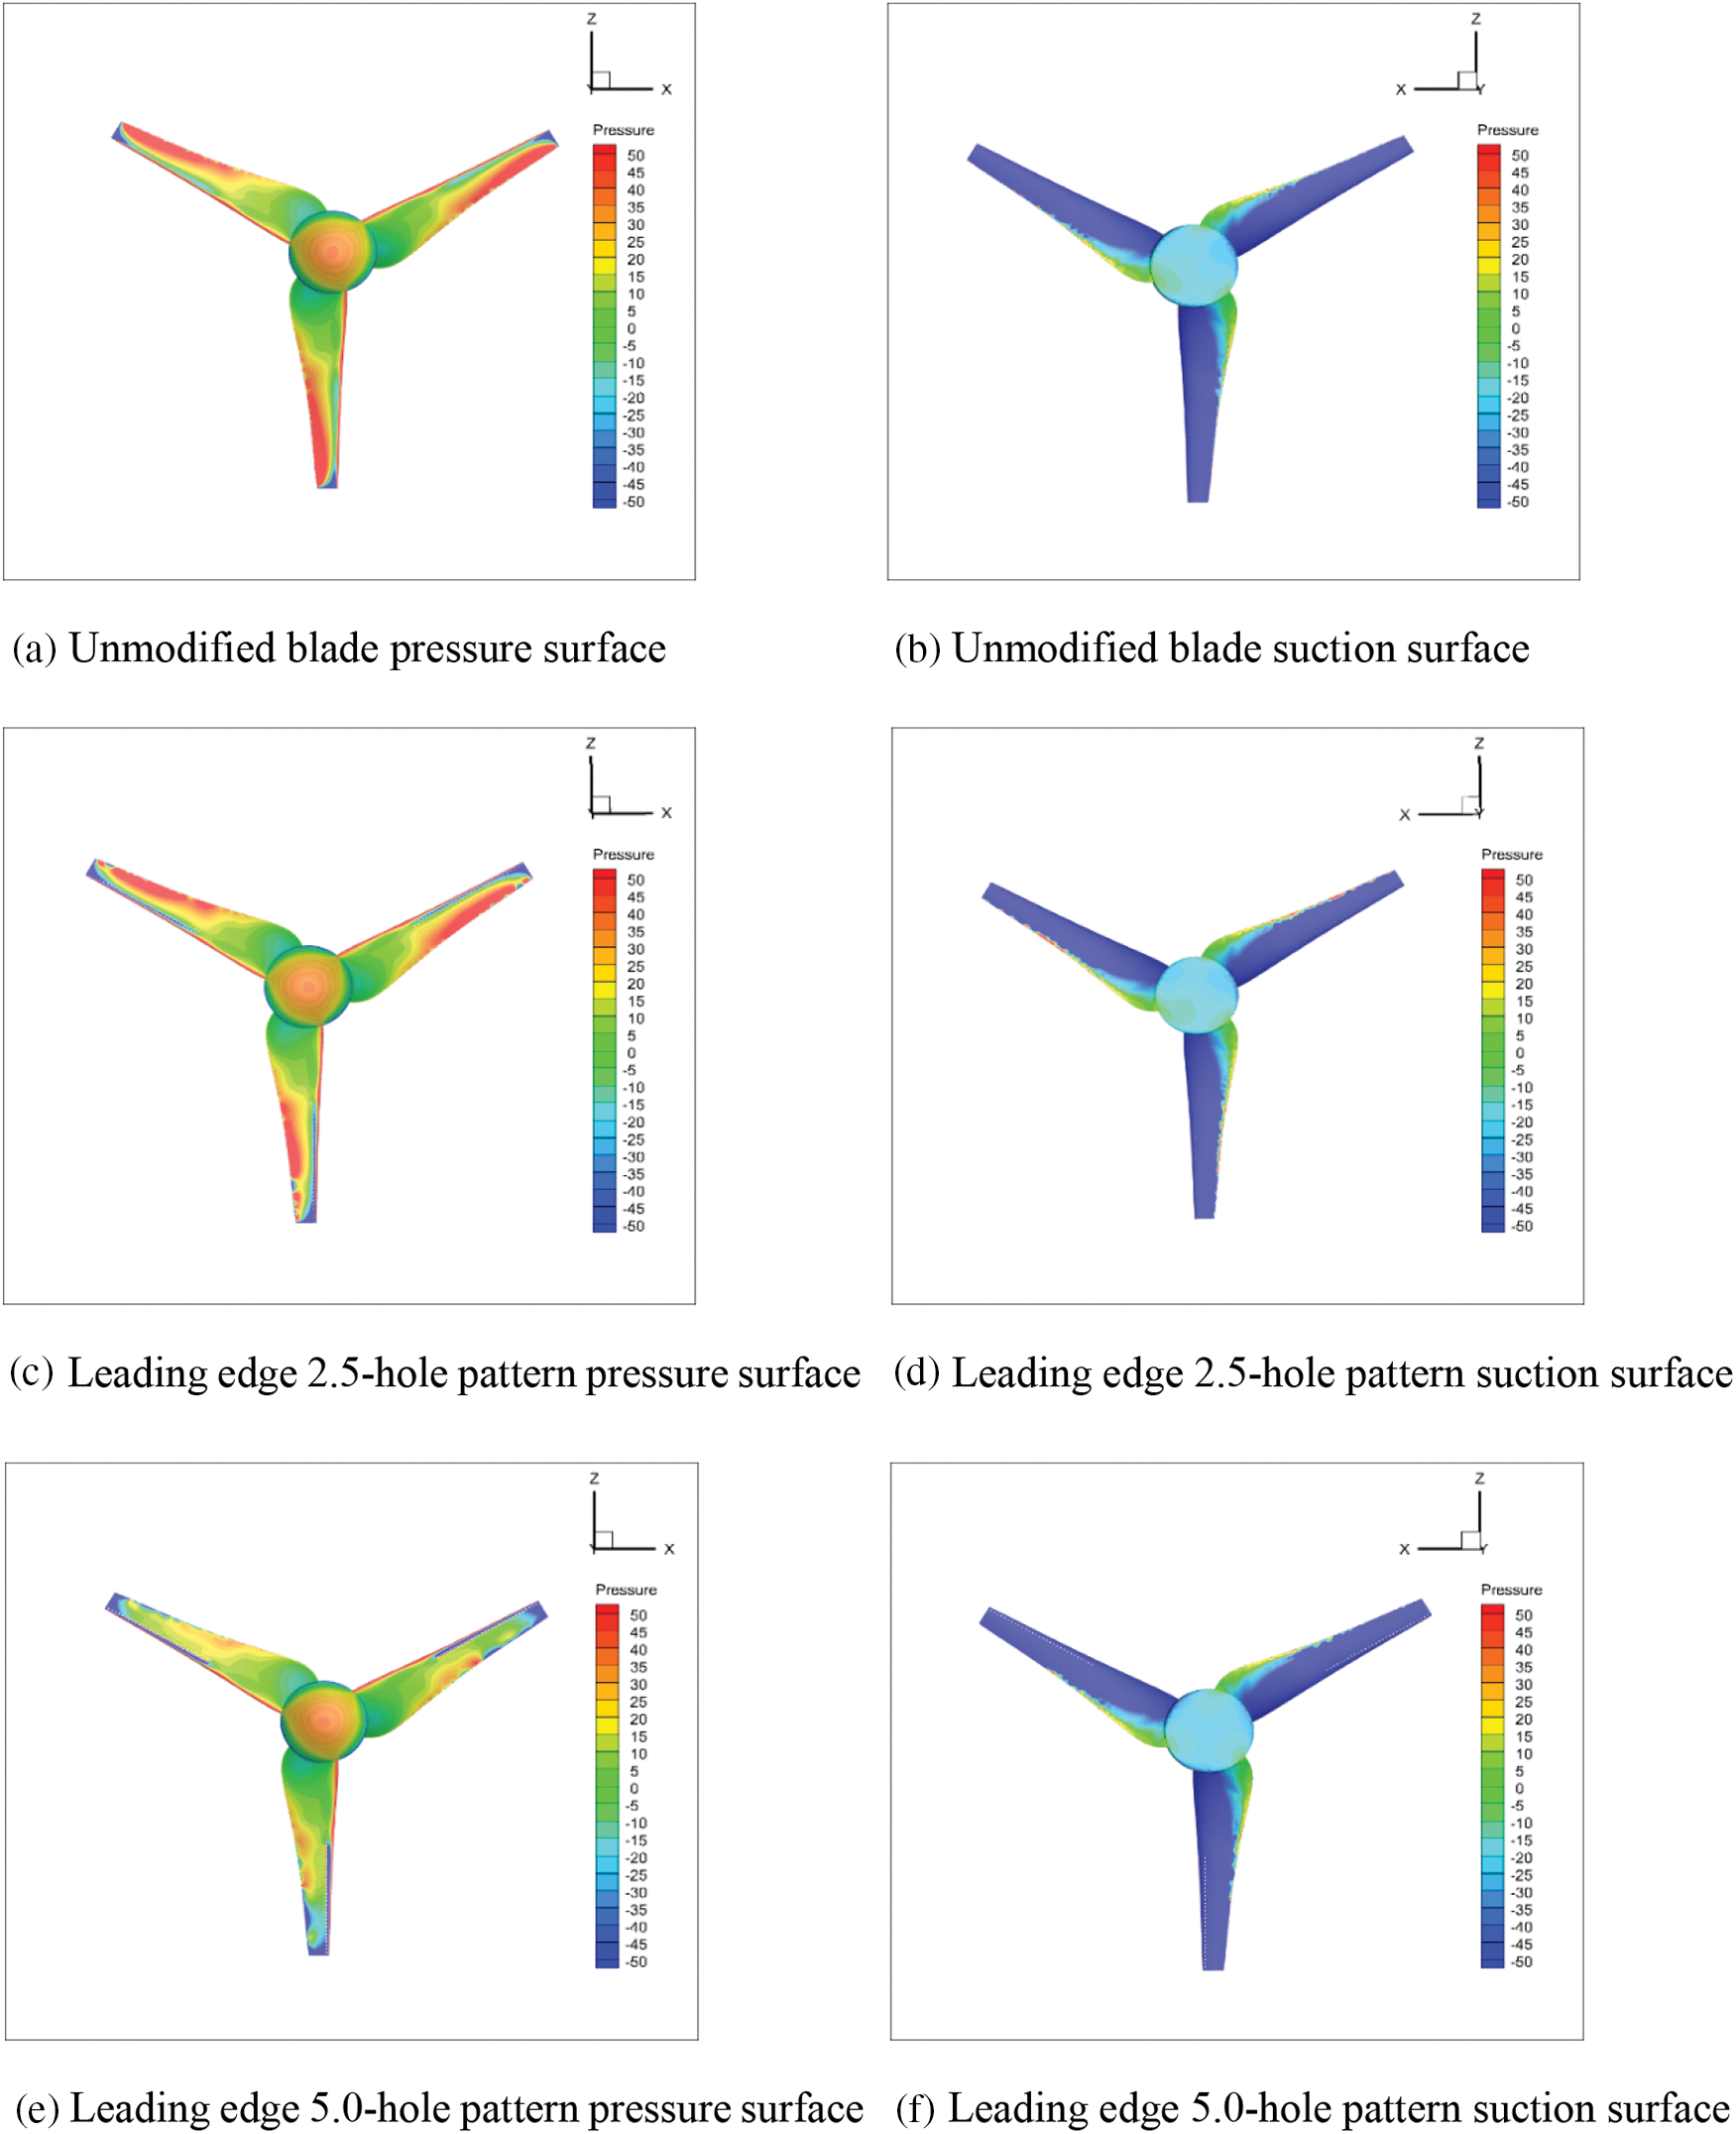
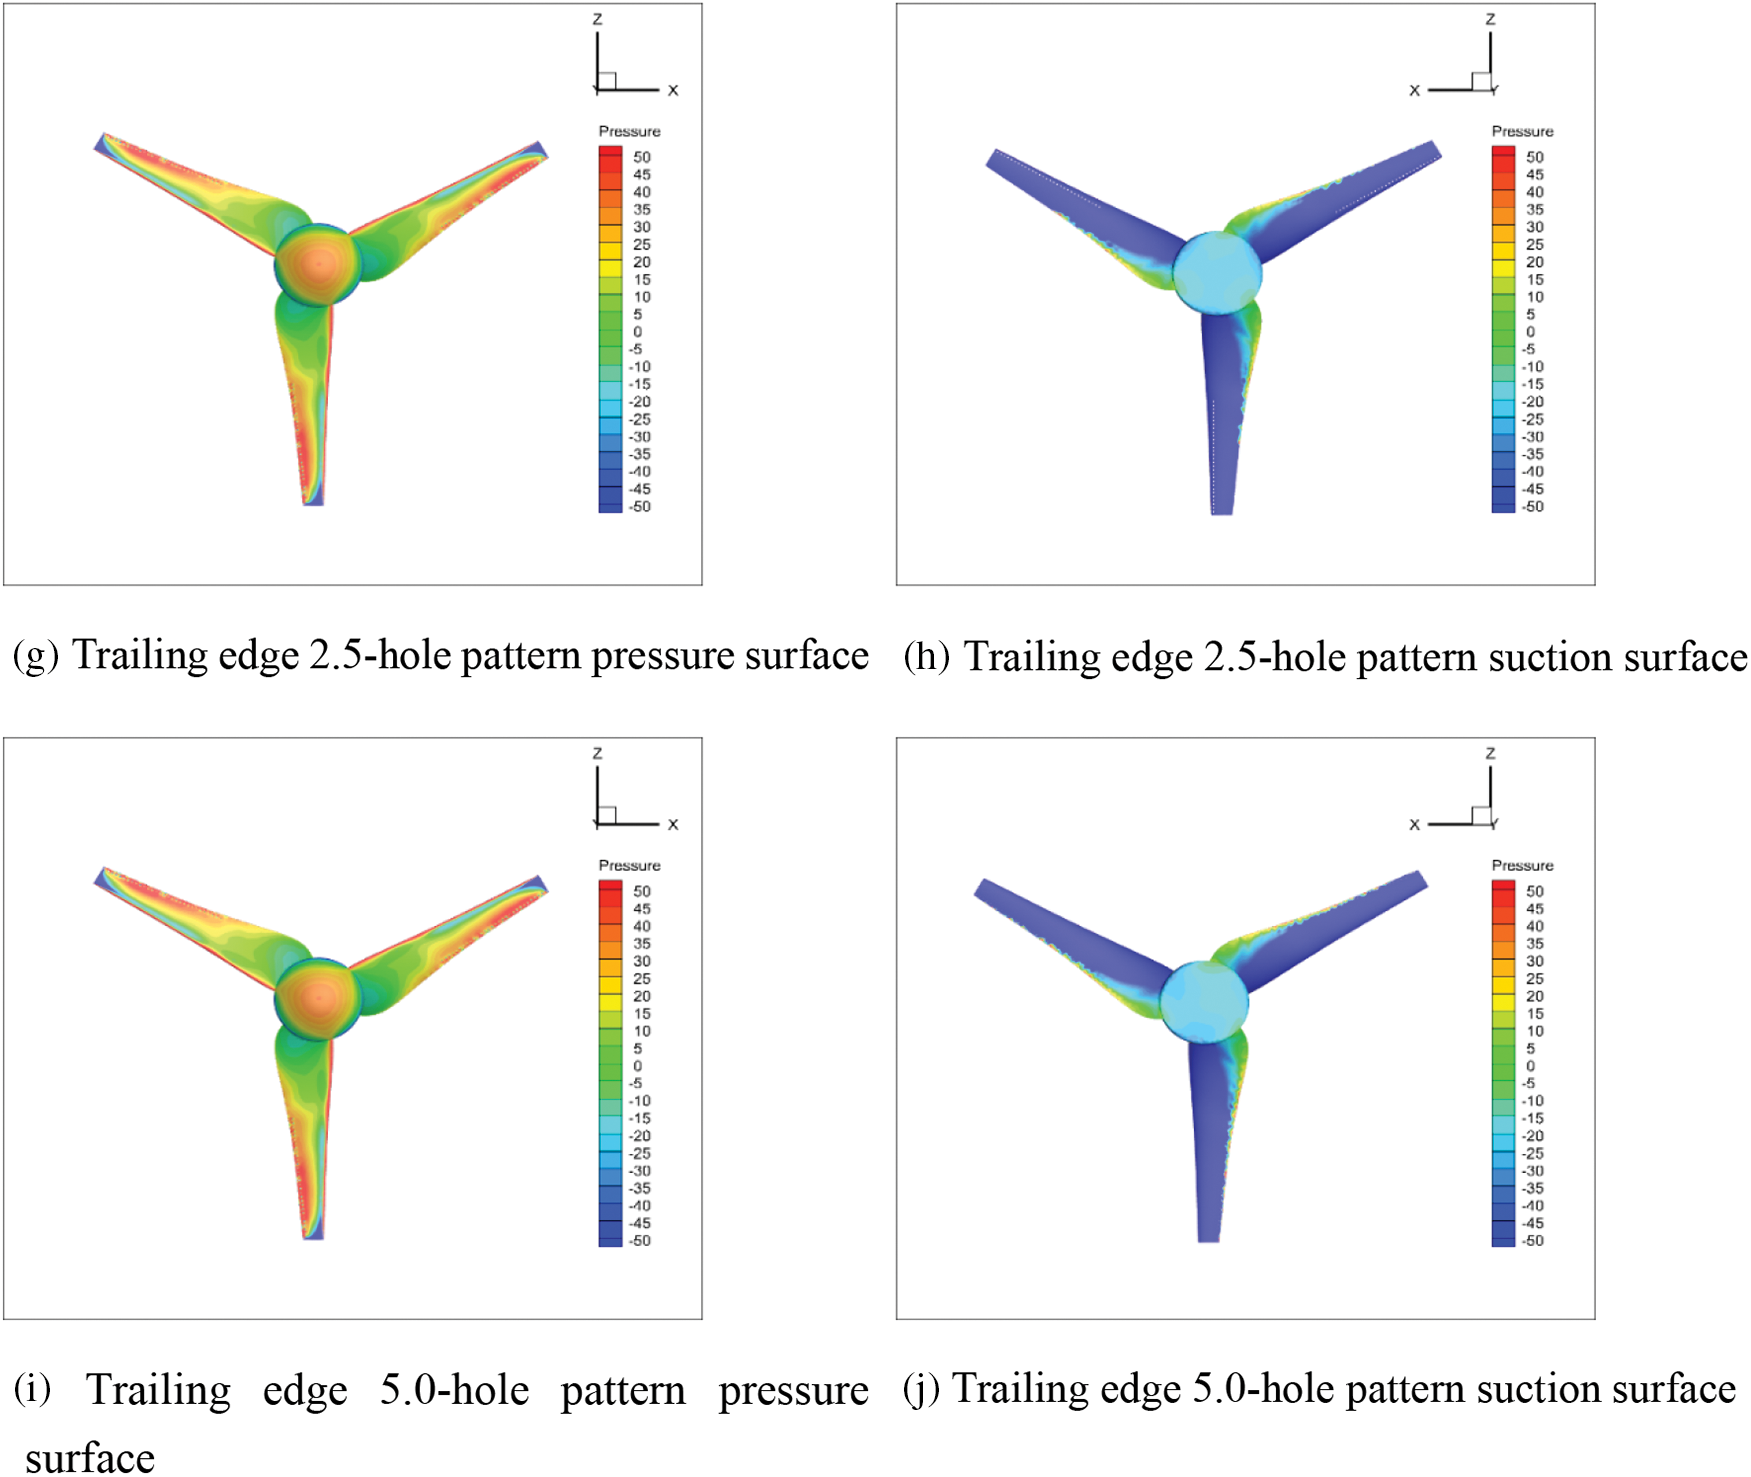
Figure 8: Cloud images of pressure surface and suction surface of wind turbines with different linear microporous tip structures
Table 4 displays the maximum pressure values acquired using the thermal probe feature of the post-processing program Tecplot. The values are for the tips of unmodified wind turbines and wind turbines with various linear microporous tip topologies. The pressure differential at the tip of a wind turbine is determined by subtracting the negative pressure on the suction side of the blade from the positive pressure on the pressure side. Upon analysis of the table, it is evident that the blade differential pressure of the unmodified tip structure is 4988 Pa. Comparatively, the blade differential pressure is reduced by 4.11%, 5.373%, 4.471%, and 8.621% for the tip structures with the leading edge 2.5-hole pattern, the leading edge 5.0-hole pattern, trailing edge 2.5-hole pattern, and trailing edge 5.0-hole pattern, respectively, when compared to the unmodified tip structure. Various linear microporous tip architectures can decrease the pressure difference at the tip. This reduction in pressure difference decreases the strength of the tip vortices created when the wind turbine interacts with the incoming flow.

Consequently, this reduction in tip vortices helps reduce the aerodynamic noise in the tip region. The table demonstrates that modifying the wind turbine structure into various linear microporous blade tip structures leads to an increase in negative pressure values at the leading edge 2.5-hole pattern, the leading edge 5.0-hole pattern, trailing edge 2.5-hole pattern, and trailing edge 5.0-hole pattern as the hole pattern increases. The positive pressure values at the blade tips decrease as the hole pattern increases. The diameter of the holes has a direct impact on the differential pressure at the tip of the wind turbine. Specifically, the diameter of the micro-holes plays a crucial role in determining the differential pressure at the wind turbine’s tip. The hole pattern located at the trailing edge significantly reduces the differential pressure value compared to the one at the leading edge.
5.2 Wind Turbine Y = 0.01 Cross-Section Linear Velocity Analysis
Fig. 9 displays the velocity contour plots at the Y = 0.01 cross-section for wind turbines with distinct linear microporous blade tip constructions. The velocity contour cloud maps of the five tip structures are distributed similarly. The highest linear velocity is found at the tip section of the wind turbine surface and in the area covered by the tip. The linear velocity falls gradually towards the root of the leaf due to energy loss and wind disruption. The unaltered blade at the tip of the leaf exhibits a noticeable vortex. A linear microporous structure at the tip of the leaf blade is not easily discernible. However, this structure performs a crucial function in preventing the formation of a vortex at the tip. The linear microporous blade tip structure significantly increased linear velocity at the tip compared to the unmodified blade. The maximum linear velocity at the tip of the unmodified blade was 70.797 m/s, while the maximum linear velocity at the tip of the leading-edge 2.5-hole pattern was 85.744 m/s.
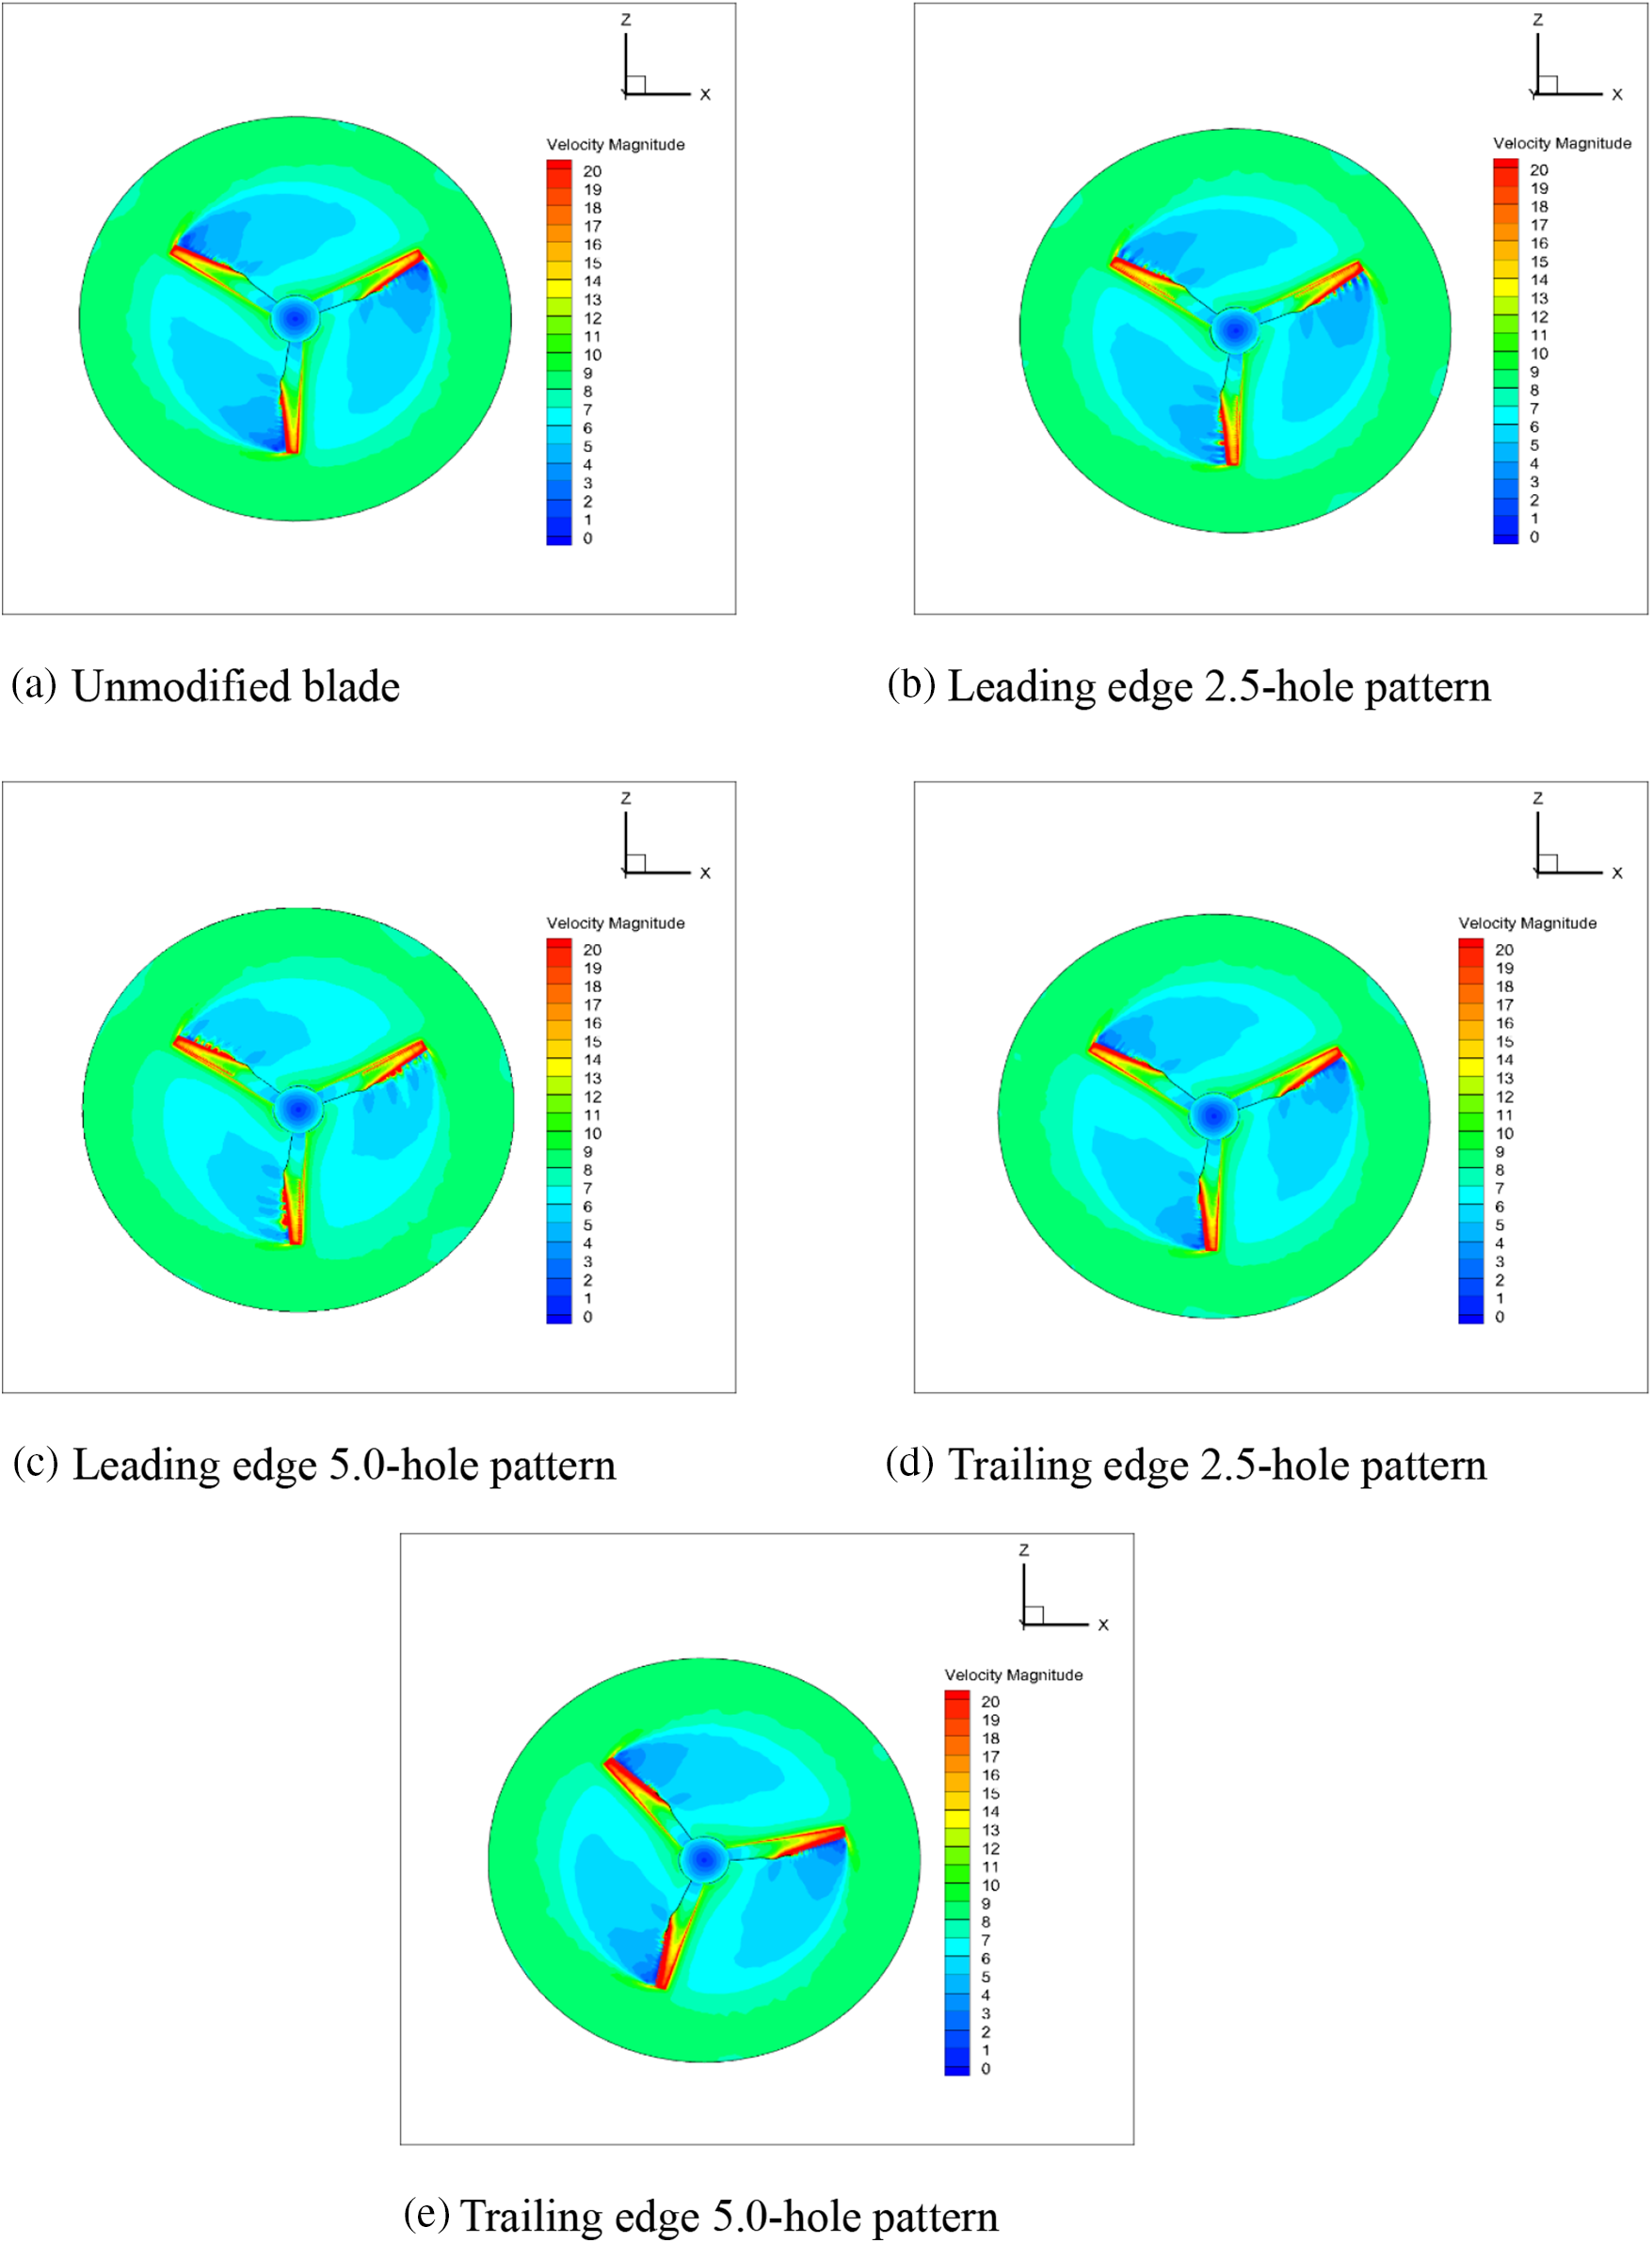
Figure 9: Linear velocity cloud image of wind turbines with different linear microporous tip structures Y = 0.01 cross-section
Similarly, the maximum linear velocity at the tip of the leading edge 5.0-hole pattern was 79.083 m/s, at the tip of the trailing edge 2.5-hole pattern was 78.037 m/s, and at the tip of the trailing edge 5.0-hole pattern was 86.928 m/s. The linear velocity of the unmodified leaf tip increased by 21.112%, 11.703%, 10.226%, and 22.784% in that specific order. The most significant increase in maximum linear velocity was seen at the tip of the blade’s trailing edge with a hole pattern of 5.0. The notable rise in linear velocity at the tip of the linear microporous tip structure, compared to the unmodified blade, can be attributed to the fact that the linear microporous tip structure functions as a diffuser. The diffuser functions as a wind concentrator, facilitating the passage of the incoming flow through the wind turbines. In turn, it enhances the flow through the turbine, increasing wind speed. Consequently, wind turbines’ linear microporous tip structure can capture a more significant amount of wind energy. The minimum velocities for all five leaf types were located near the leaf’s base.
5.3 Radial Vortex Analysis of Wind Turbine Y = 0.0035
The vorticity is produced by the current flowing through the blade, resulting in a disparity in velocity between the upper and lower surfaces of the blade. Vorticity refers to the rotational motion of fluid particles in a flow field. When a wind turbine rotates and functions, it produces a central vortex, an attached vortex, and a vortex at the blade’s tip. Both the formation and shedding of vortices can result in the production of aerodynamic noise by wind turbines. Fig. 10 displays the radial vortex cloud for wind turbines with various linear microporous blade tip designs.
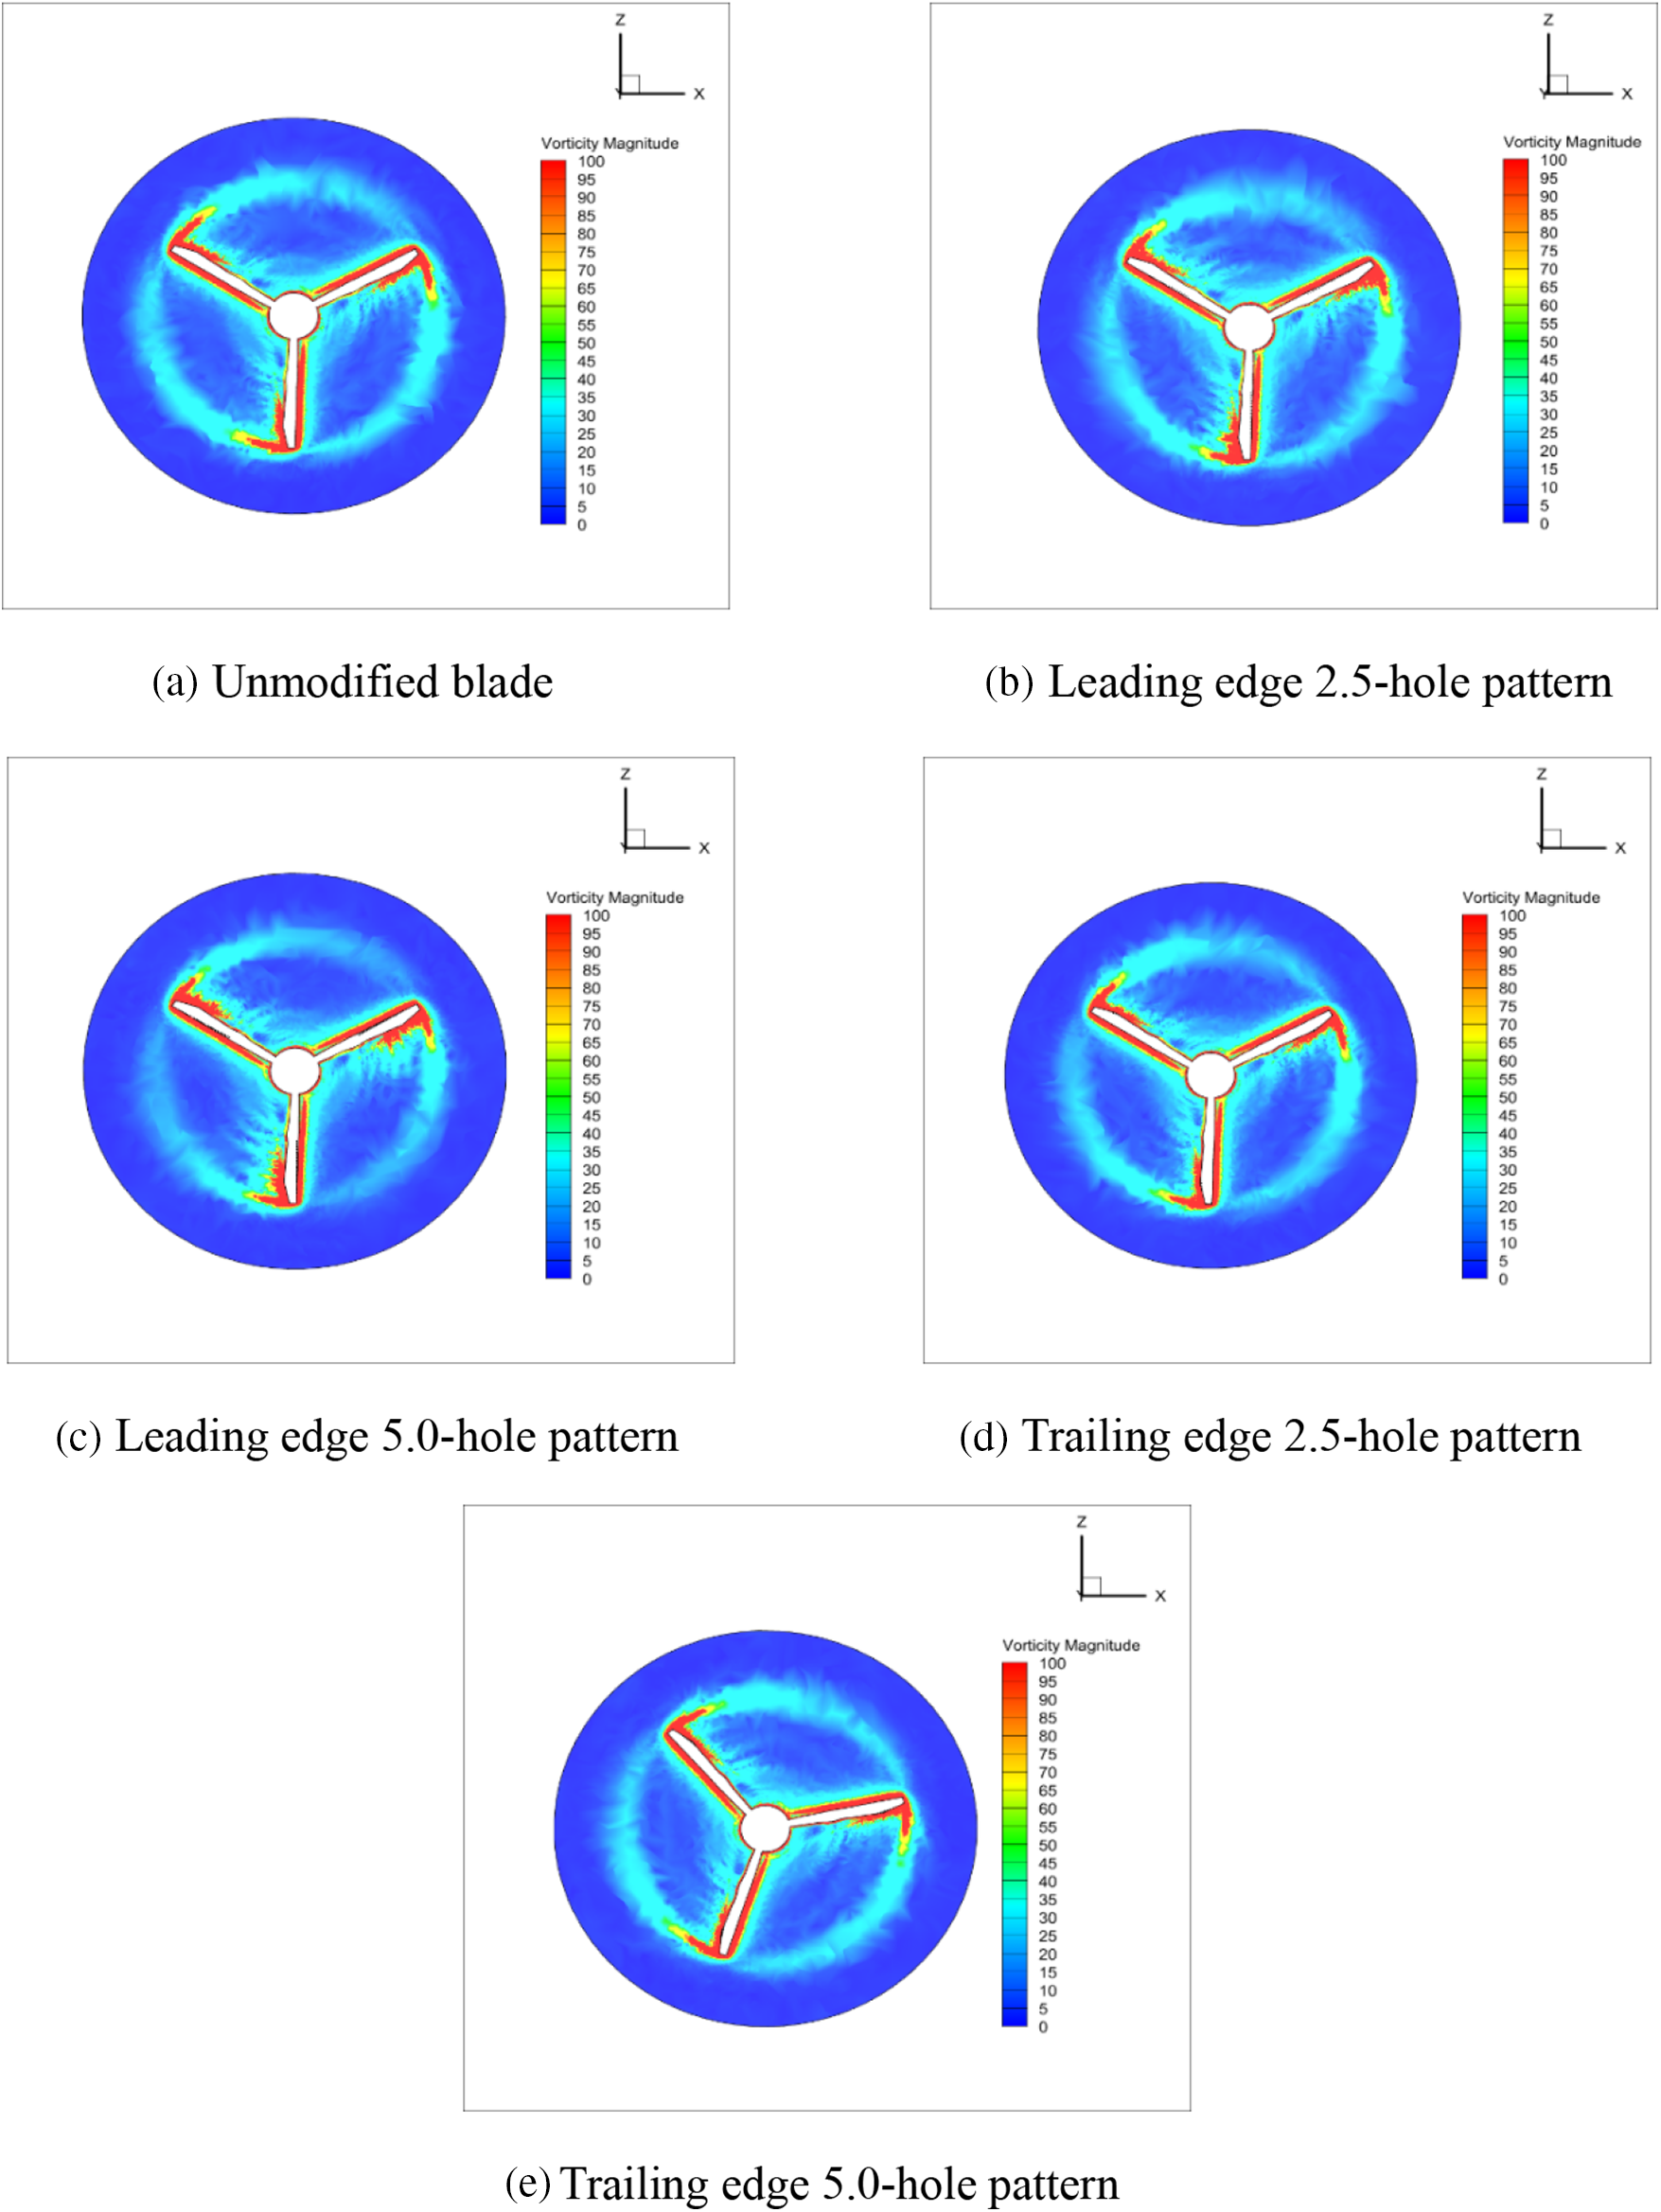
Figure 10: Radial vorticity cloud picture of wind turbines with different linear microhole tip structures Y = 0.0035
By examining cloud diagrams and incorporating the vortex theory, it has been determined that wind turbine vortices consist mainly of a center vortex, an attached vortex, and a tip vortex. As the solid incoming flow passes through the wind turbine, it creates a wrap-around flow and separates a boundary layer. Eventually, a vortex is formed due to the tangential force caused by the spinning of the wind turbine. Once the wind turbine speed surpasses a specific threshold, the vortex is detached from the blade’s end, forming a tip vortex. The shedding of vortices leads to the occurrence of sonic radiation. The vorticity values of wind turbines with various linear microporous tip architectures were quantified using the thermal probe function of the post-processing program Tecplot. The results are presented in Table 5.

Upon analyzing the data in the table, it is evident that the leaf tip vortex values of the various linear micropores exhibit a consistent decline as the hole size increases. The tip vortex value of the original tip structure wind turbine is 158.82 s−1. The tip vortex values of the leading edge 2.5-hole and 5.0-hole pattern wind turbines are 157.35 and 156.65 s−1, respectively. They experienced a reduction of 0.925% and 1.366%, respectively. Increasing the hole pattern at the leading edge reduces the strength of the tip vortex. The wind turbine with a leading edge hole pattern 5.0 is superior to the wind turbine with a 2.5-hole tip structure. The blade tip vorticity values for the trailing edge 2.5-hole pattern and 5.0-hole structure wind turbines are 156.86 and 155.49 s−1, respectively. The first value represents a decrease of 1.234%, whereas the second value represents a decrease of 2.096%. The increase in the diameter of the trailing edge hole pattern resulted in a significant reduction in the tip vortex strength. The wind turbine with a trailing edge hole pattern of 5.0 is superior to the wind turbine with a trailing edge hole pattern of 2.5 in tip structure. The diameter of the hole has a direct impact on the magnitude of blade tip vorticity.
Similarly, the diameter of the microporous structure is a significant parameter that influences the magnitude of blade tip vorticity. The presence of holes in the following edge affects the value of the leaf tip vortex more significantly than the presence of holes in the leading edge. To summarize, various wind turbines with linear microporous tip structures can successfully mitigate the aerodynamic noise generated by tip vortices.
5.4 Wind Turbine Wake Vortex Analysis
The wind turbine rotates continuously during operation, consistently generating vortices, and the trailing vortex remains in perpetual motion. Fig. 11 illustrates that wind turbine wake vortices consist primarily of tip and center vortices. The wake vorticity diffuses towards the trailing edge of the wind turbine’s rotational plane and progressively diverges from the wind turbine’s rotational plane. As it spreads in the opposite direction, the energy of the vortex gradually diminishes until the two systems of swirling motion collide and combine at the exact location, ultimately vanishing. The vorticity values of wind turbines with various linear microporous tip constructions in Leigh were quantified using the thermal probe feature of the post-processing software Tecplot. The need to be completed is indicated in Table 6.

The aerodynamic noise of a blade is intricately linked to the vortices it produces. The characteristics of these vortices, such as their structure, size, and distribution, directly impact the level of aerodynamic noise generated by the blade. The diagram illustrates the vorticity patterns in the wake of wind turbines with both unmodified and various linear microporous blade tip structures. Fig. 11 demonstrates that the vortex during the rotation of the wind turbine is focused on the tip region of the blade. In contrast to the unaltered model featuring a dissimilar linear microporous tip structure, the vortices shed at the tip are less powerful, with longer trailing vortices and greater distances between them. This arrangement of vortices decreases the interactions between the shed vortices. Table 6 shows that the unmodified tip structure has a trailing vortex value of 32.53 s−1. The leading edge 2.5-hole pattern and 5.0-hole structure wind turbines have trailing vortex values of 31.83 and 30.68 s−1, respectively. They experienced a reduction of 2.151% and 5.687%, respectively. The wind turbine wake vorticity value can significantly decrease by increasing the leading-edge hole pattern. The wind turbine with a leading-edge hole pattern 5.0 is superior to that with a leading-edge hole pattern 2.5 in reducing wake vorticity. The blade tip vorticity values for the 2.5-hole pattern and 5.0-hole pattern structure wind turbines are 31.63 and 30.63 s−1, respectively. These values represent a decrease of 2.766% and 5.841%, respectively. The vorticity value of the wind turbine wake may be significantly decreased by increasing the trailing edge hole pattern. Specifically, the wind turbine with a trailing edge hole pattern of 5.0 is superior to the wind turbine with a trailing edge hole pattern of 2.5. The diameter of the hole has a noticeable impact on the value of the wind turbine wake vortex, making it an essential element to consider.
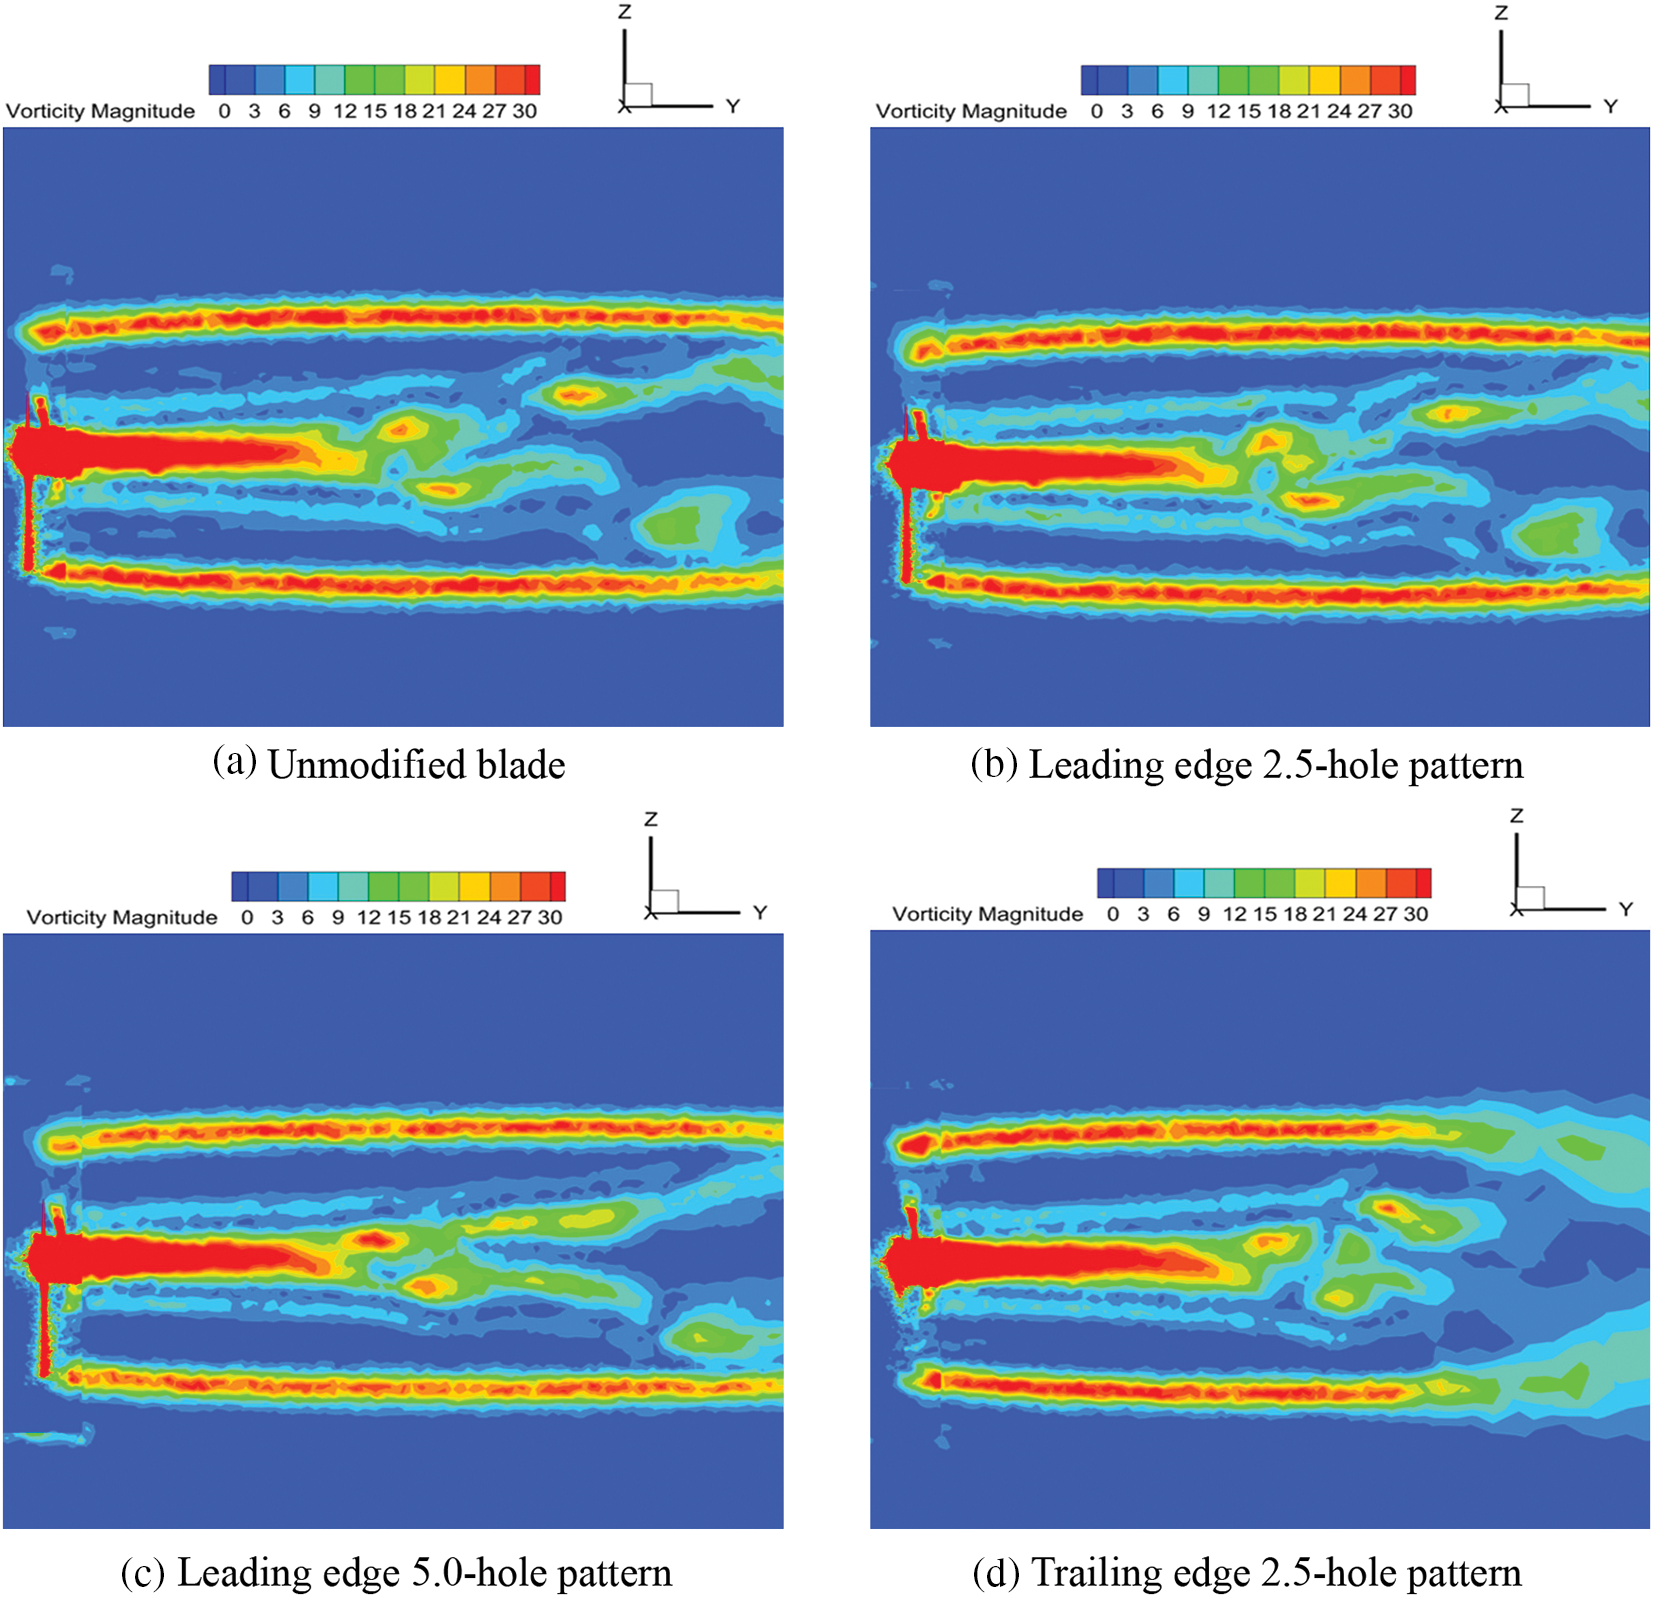
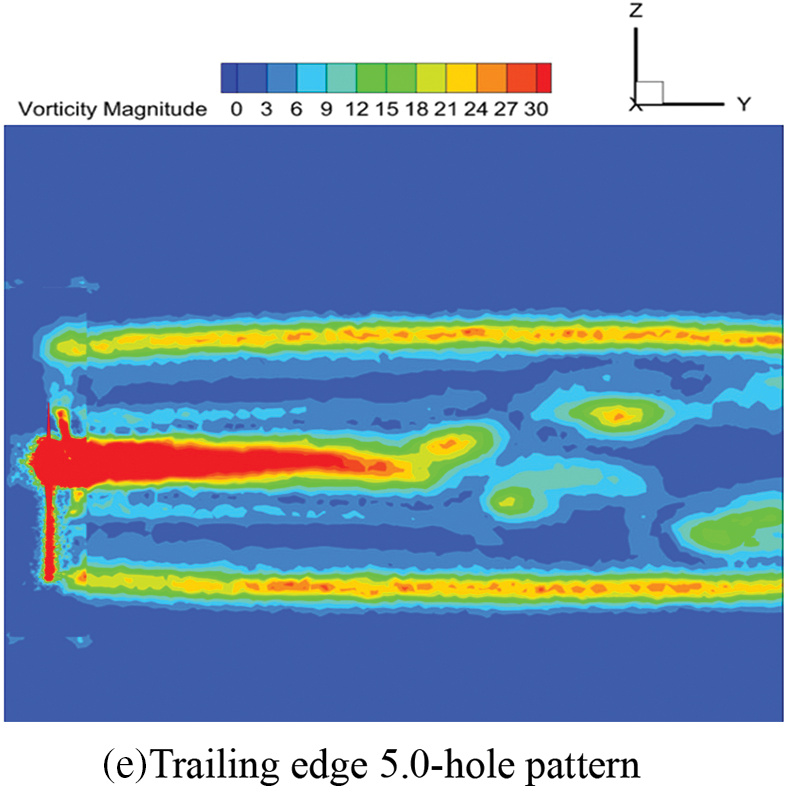
Figure 11: Wake vorticity cloud image of wind turbines with different linear microporous tip structures
Similarly, the diameter of the microporous also influences the wind turbine wake vortex value. The wind turbine wake vorticity value is reduced to a greater extent by the trailing-edge hole pattern than by the leading-edge hole pattern. Overall, wind turbines with various linear microporous tip structures can mitigate trailing vortices’ strength, significantly decreasing the aerodynamic noise generated by tip vortices.
5.5 Analysis of Wind Turbine Sound Radiation
The Fourier transform is employed to convert the obtained noise figure of a time domain signal into a frequency domain signal for analysis. A blade’s noise spectrogram depicts the correlation between frequency and sound strength. Monitoring stations are established near the wind turbine to measure noise levels. During the wind turbine’s rotational movement, the blades repeatedly collide with the air in their surroundings, resulting in pressure fluctuations and creating an uneven airflow that generates sound waves. The frequency of wind turbine rotational noise is obtained from Eq. (1):
where:
The spectrogram displays a fundamental frequency of 36.6 Hz, followed by harmonic frequencies of 75.3, 112, and 150.7 Hz in sequential order. As shown in Fig. 12. These frequencies align closely with the theoretical calculations. The unmodified, leading-edge 2.5-hole pattern, leading-edge 5.0-hole pattern, trailing edge 2.5-hole pattern, and trailing edge 5.0-hole pattern models have maximum sound pressure levels at their fundamental frequencies of 108.105, 107.83, 107.438, 107.56, and 107.21 dB, respectively. The relative drops are 0.275, 0.667, 0.545, and 0.895 decibels. Hence, various linear microporous impeller tip configurations can efficiently diminish the low-frequency aerodynamic noise the wind turbine produces while rotating. The trailing-edge hole pattern wind turbine exhibits superior noise reduction compared to the leading-edge hole pattern wind turbine. The 5.0-hole pattern is superior to the 2.5-hole pattern in reducing noise, as the size of the hole directly affects the level of noise reduction in wind turbines near wake noise. The primary noise source in the overall noise level is the distinct rotational noise produced by the blade. The aerodynamic noise energy generated by various linear microporous tip structures is primarily concentrated in the low-frequency range below 300 Hz. Beyond this frequency, the sound pressure level remains relatively constant.
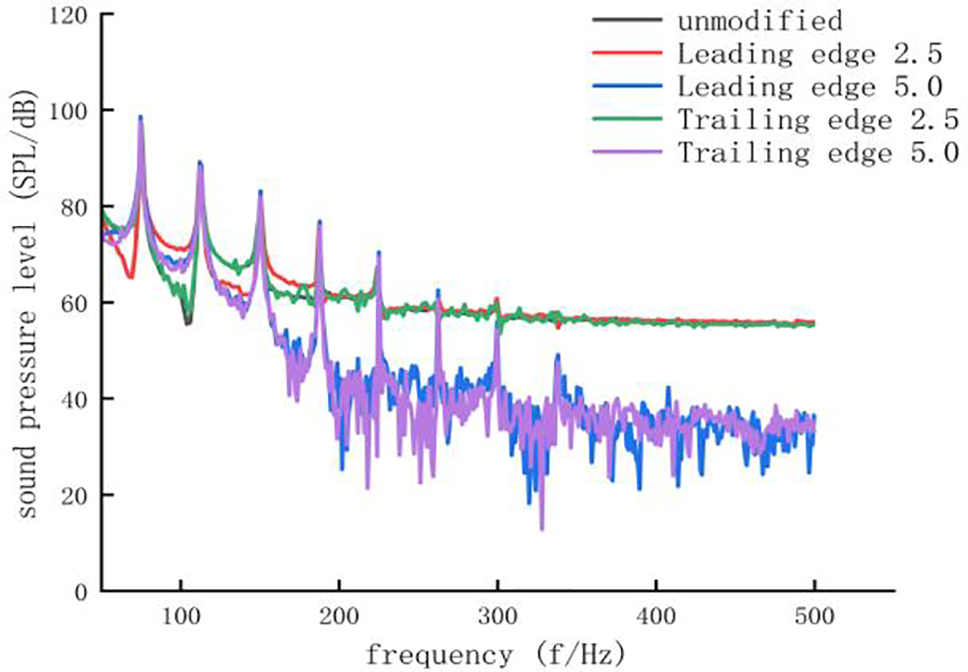
Figure 12: Noise spectrum at measuring points (700, 200, 0) with different linear micropore structures
5.6.1 Analysis of Wind Turbine Radial Aerodynamic Noise
To investigate the radial noise distribution pattern in the wake area of various linear microporous blade tip constructions, we evaluated the combined radial noise and vortex distribution at a distance of 300 mm from the rotating plane of the wind turbine. The layout of measurement sites was identical to that of the aerodynamic noise test, as depicted in Fig. 7. there were 35 measurement points. The sound pressure levels collected at the monitoring stations were plotted to determine the radial noise distribution in the wake zone of various linear microporous leaf tip constructions, as depicted in Fig. 13.
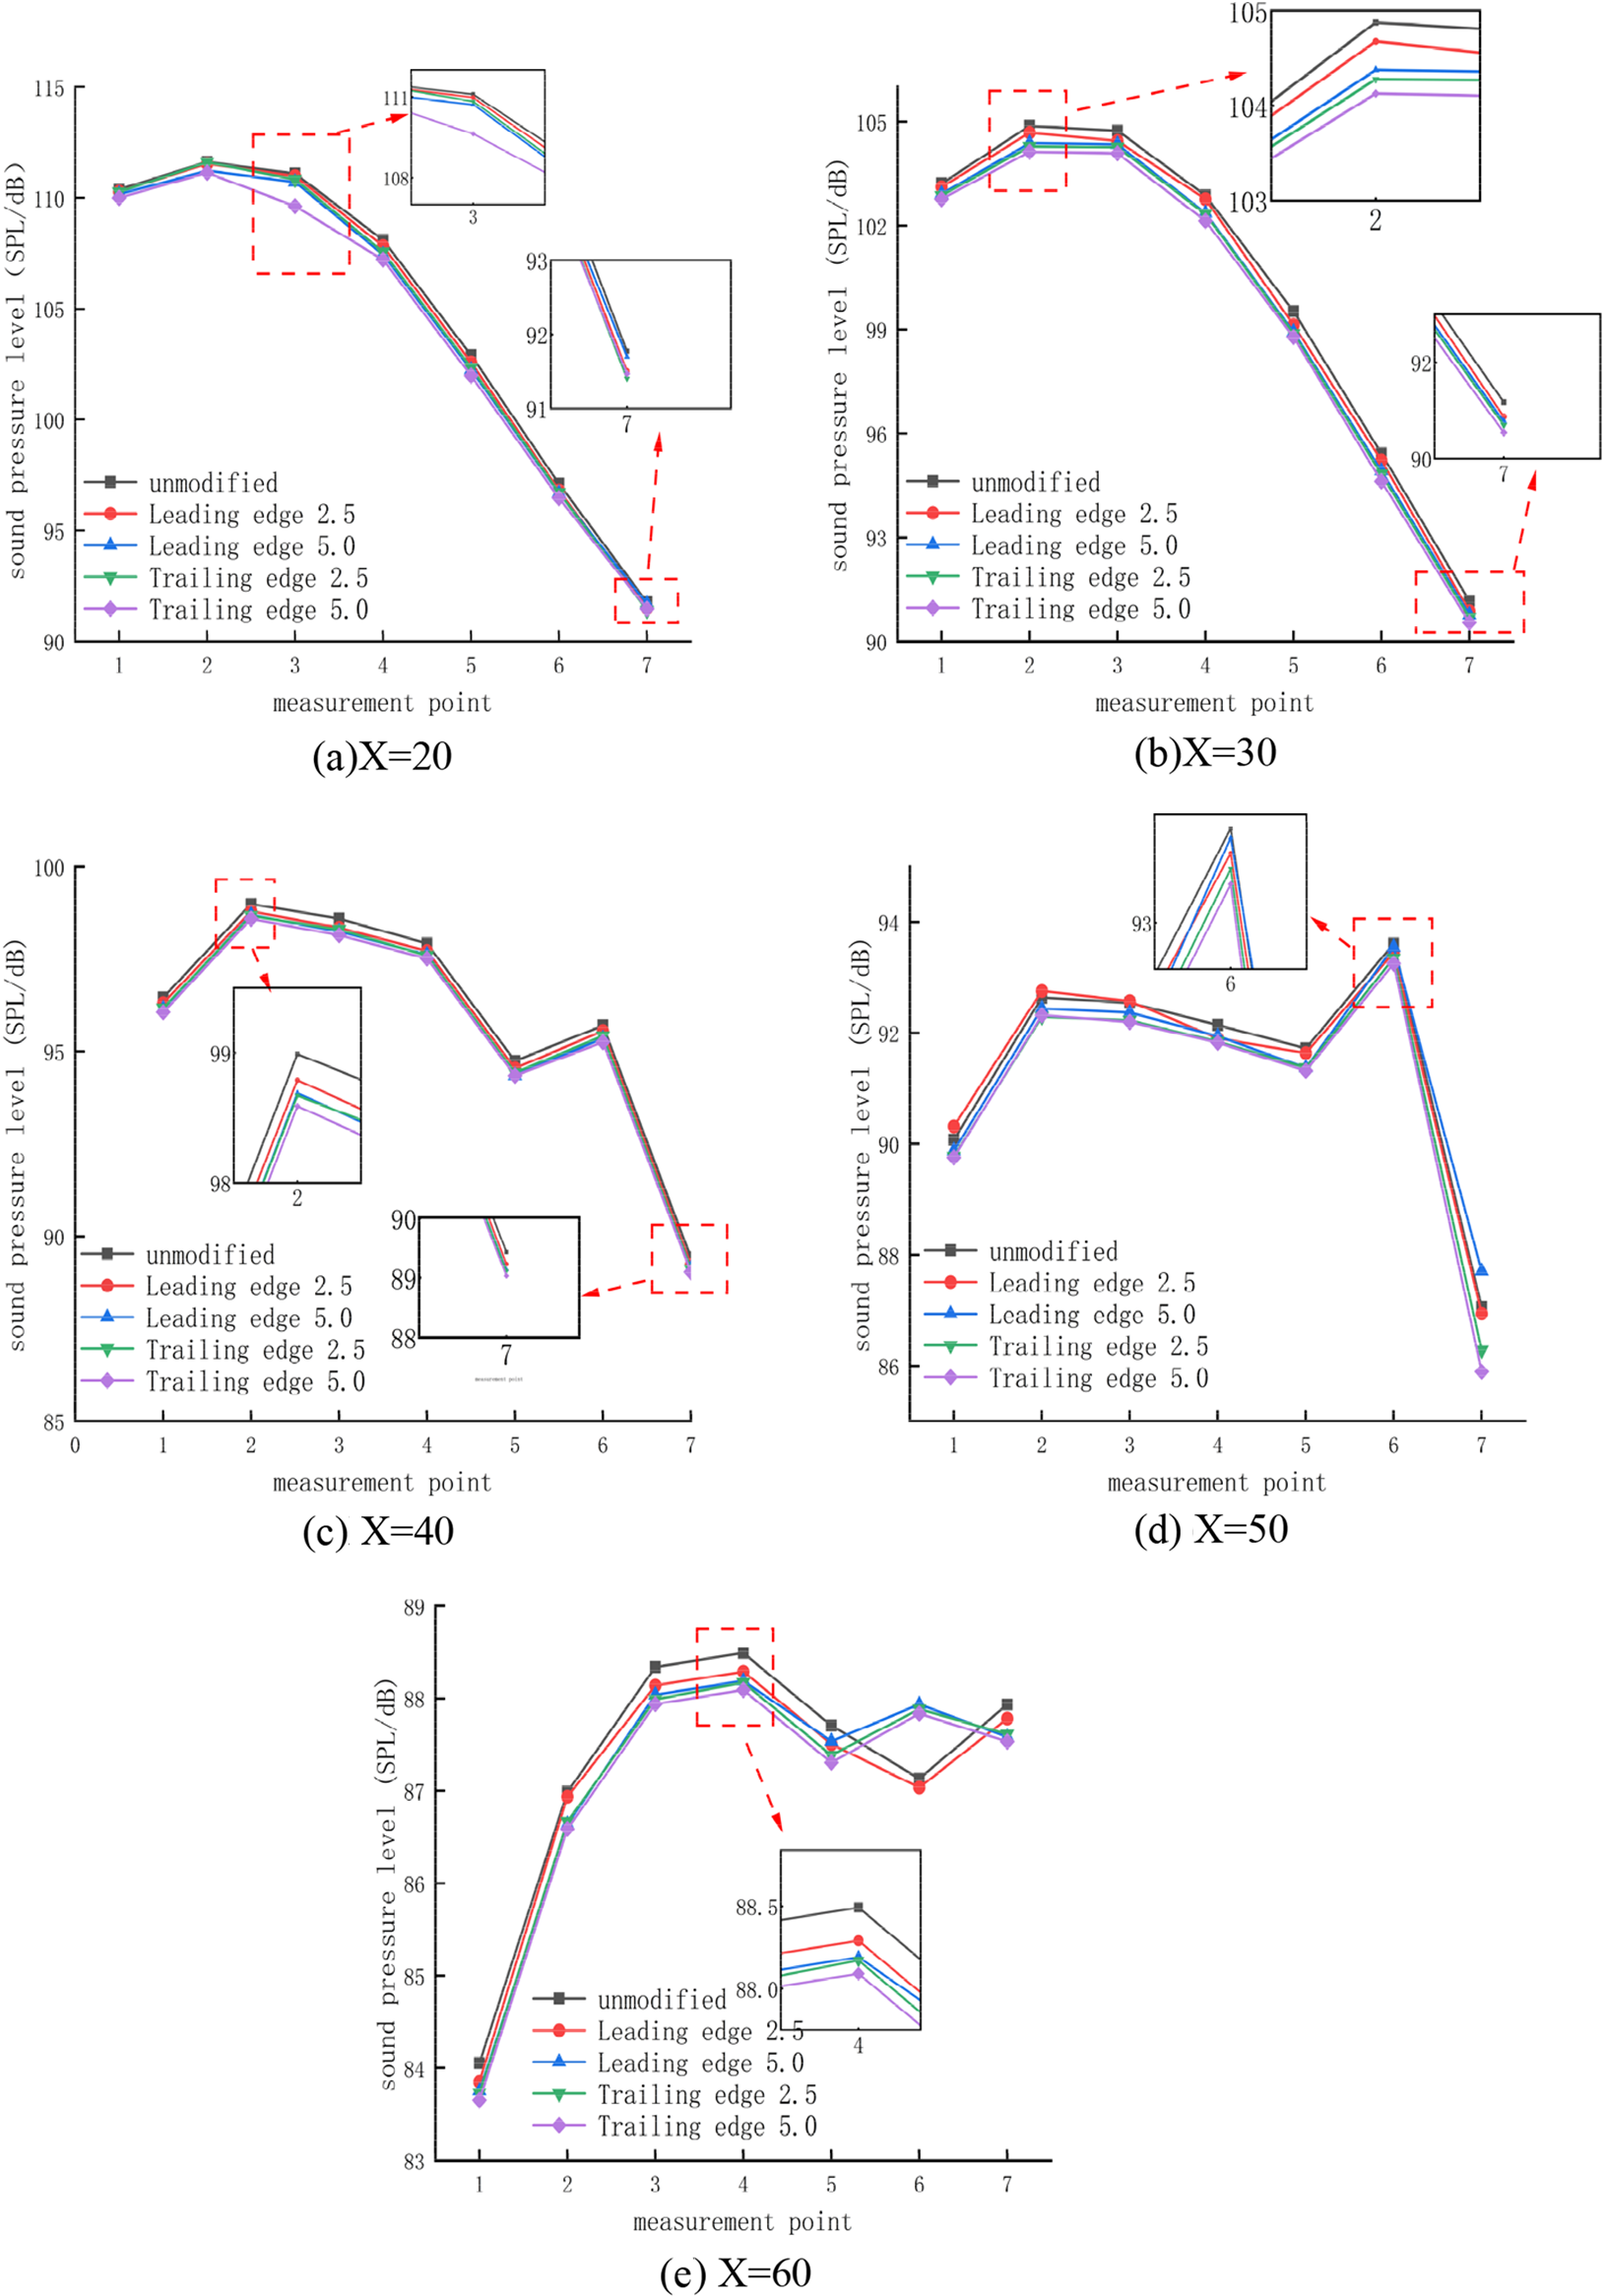
Figure 13: Radial aerodynamic noise diagram of wind turbine
The radial noise distribution graph demonstrates a considerable consistency in the changing pattern of the radial noise distribution of wind turbines with different linear microporous tip structures under the rated condition of incoming wind speed of 8 m/s and rotational speed of 750 r/min.
At the 20 cm cross-section, the radial sound pressure level increases between 400 and 500 mm using various linear microporous tip architectures, as shown in Fig. 13a; the highest value is observed at measurement point 2. Following that, the sound pressure levels at radial distances between 500 and 1000 mm exhibit a progressive decline. The minimum value was attained at measurement point 7. The unaltered leaf tip structure has a maximum value of 111.621 dB and a low value of 91.772 dB. The leading edge 2.5-hole pattern and 5.0-hole pattern tip structures had maximum values of 111.543 and 111.231 dB, respectively. These structures reduced the sound pressure level by 0.07% and 0.35%, respectively, compared to the unmodified type. The minimal values are 91.504 and 91.968 dB, with respective decreases of 0.29% and 0.08%. The highest values of the trailing edge 2.5-hole pattern and 5.0-hole pattern tip structures were 111.602 and 111.138 dB, respectively. The sound pressure levels decreased by 0.017% and 0.43%, respectively, compared to the original sound pressure levels. The minimum values are 91.403 and 91.468 dB, representing a reduction of 0.995% and 0.996%, respectively, compared to the original sound pressure level.
At the 30-cm cross-section, the radial sound pressure level initially increases within the 400–500 mm range, as shown in Fig. 13b; it reaches its maximum value at measurement point 2 while using various linear microporous tip architectures. Following that, the sound pressure levels measured at radial distances between 500 and 1000 mm exhibit a progressive decline. The minimum value was attained at measurement point 7. The unaltered leaf tip structure has a maximum value of 104.879 dB and a low value of 91.173 dB. The leading edge 2.5-hole pattern and 5.0-hole pattern tip structures achieved maximum values of 104.679 and 104.379 dB, respectively. These structures resulted in a drop in sound pressure level of 0.190% and 0.476%, respectively, compared to the unmodified type. The minimum values are 90.873 and 90.773 dB, representing a reduction of 0.329% and 0.438%, respectively, compared to the original sound pressure level. The highest values of the trailing edge 2.5-hole pattern and 5.0-hole pattern tip structures were 104.279 and 104.129 dB, respectively. These values represent a drop of 0.572% and 0.715%, respectively, compared to the original sound pressure level. The minimum values are 90.693 and 90.543 dB, respectively, representing a reduction of 0.526% and 0.690%, respectively, compared to the original sound pressure level.
At the 40 cm cross-section, the radial sound pressure levels of the various linear microporous tip constructions grew between 400 and 500 mm, reaching their highest value at measurement point 2, as shown in Fig. 13c; the radial sound pressure level between 500 and 800 mm gradually declined. However, in the 800 to 1000 mm range, the sound pressure level initially rose and then decreased to its lowest point. This phenomenon was caused by the leaf-tip vortex passing through measurement point 6, increasing the sound pressure level. The unaltered leaf tip structure has a maximum value of 98.991 dB and a low value of 89.432 dB. The highest sound pressure levels for the leading edge 2.5-hole pattern and 5.0-hole pattern tip structure were 98.791 and 98.691 dB, with a drop of 0.202% and 0.303%, respectively. The minimum values were 89.232 and 89.132 dB, respectively, exhibiting a reduction of 0.223% and 0.354% compared to the original sound pressure level. The highest values recorded for the trailing edge 2.5-hole pattern and 5.0-hole pattern tip structures were 98.671 and 98.591 dB, respectively. These values represent a drop of 0.323% and 0.404%, respectively, compared to the original sound pressure level. The minimum values are 89.112 and 89.032 dB, representing a reduction of 0.357% and 0.447%, respectively, compared to the original sound pressure level.
At 50 cm cross-section, the radial sound pressure level exhibits an increase within the range of 400–500 mm for various linear microporous tip architectures, followed by a subsequent drop within the region of 500–800 mm, as shown in Fig. 13d, The radial sound pressure level experiences a rise and subsequent drop throughout the range of 800–1000 mm. The most significant level is observed at measurement point 6, which can be attributed to the passage of the leaf-tip vortex at that location, increasing the sound pressure level. The value reaches its lowest point at measurement point 7. The unaltered leaf tip structure has a maximum value of 93.61 dB and a low value of 87.056 dB. The highest values of the leading edge 2.5-hole pattern and 5.0-hole pattern tip structures were 93.45 and 93.55 dB, respectively. These values represent a drop of 0.171% and 0.064%, respectively, compared to the original sound pressure level. The minimum values were 86.941 and 87.706 dB, respectively. The sound pressure level was reduced by 0.132% relative to the unmodified type by implementing the leading edge 2.5-hole leaf tip structure. The highest sound pressure levels recorded for the trailing edge 2.5-hole type and 5.0-hole type tip constructions were 93.35 and 93.25 dB, respectively. These values represent a drop of 0.278% and 0.384%, respectively, compared to the unmodified sound pressure level. The minimum values are 86.28 and 85.89 dB, representing a reduction of 0.891% and 1.34% respectively compared to the original sound pressure level.
At 60 cm cross-section, the radial sound pressure level initially rises within the range of 400–700 mm for various linear microporous leaf tip designs, as shown in Fig. 13e; the radial sound pressure level at the tip structure decreases initially with an increase in the leading edge 5.0-hole pattern and trailing edge 2.5-hole pattern within the range of 700–1000 mm. However, it then decreases with an increased trailing edge 5.0-hole pattern. Similarly, the radial sound pressure level at the tip structure decreases initially with an increase in the unmodified leading edge 2.5-hole pattern. The sound pressure levels at different radial distances are highest at measurement point 4. These levels vary between 700 and 1000 mm due to tip vortices. The unaltered tip structure has a maximum value of 88.491 dB and a minimum value of 84.052 dB. The leading edge 2.5-hole pattern and 5.0-hole pattern tip structure had a maximum value of 88.291 and 88.191 dB, respectively. Sound pressure levels decreased by 0.226% and 0.34% respectively compared to the unmodified model. The minimum values were 83.852 and 83.752 dB, exhibiting a reduction of 0.205% and 0.356% respectively compared to the original sound pressure level. The highest values of the trailing edge 2.5-hole pattern and 5.0-hole pattern tip structures were 88.171 and 88.091 dB, respectively. These values represent a drop of 0.361% and 0.452% compared to the original sound pressure levels. The minimum values are 83.732 and 83.625 dB, representing a reduction of 0.38% and 0.508% respectively compared to the original sound pressure level.
5.6.2 Wind Turbine Axial Aerodynamic Noise Analysis
To investigate the distribution pattern of axial noise in various linear microporous leaf tip architectures at different places. Points parallel to the x-axis are located at radial distances of 500, 600, and 700 mm from the wind turbine, as depicted in Fig. 7. The sound pressure levels measured at the monitoring stations were plotted to determine the axial noise distribution of various linear microporous leaf tip morphologies.
By examining the distribution of aerodynamic noise in the near-tail region of each wind turbine at a radial distance of 500 mm, as shown in Fig. 14a, it is evident that the aerodynamic noise in the near-tail region of the wind turbine reduces as the axial distance increases. The wind turbine’s sound pressure level is highest at 200 mm from the surface of the turbine wheel, both before and after modification. The sound pressure level without modification is 111.621 dB. After modification, the sound pressure level at the leading edge 2.5-hole pattern, the leading edge 5.0-hole pattern, the trailing edge 2.5-hole pattern, and the trailing edge 5.0-hole pattern has been reduced by 0.069%, 0.349%, 0.017%, and 0.432%, respectively. The most significant reduction in sound pressure level was seen at the position between 400 and 500 mm.
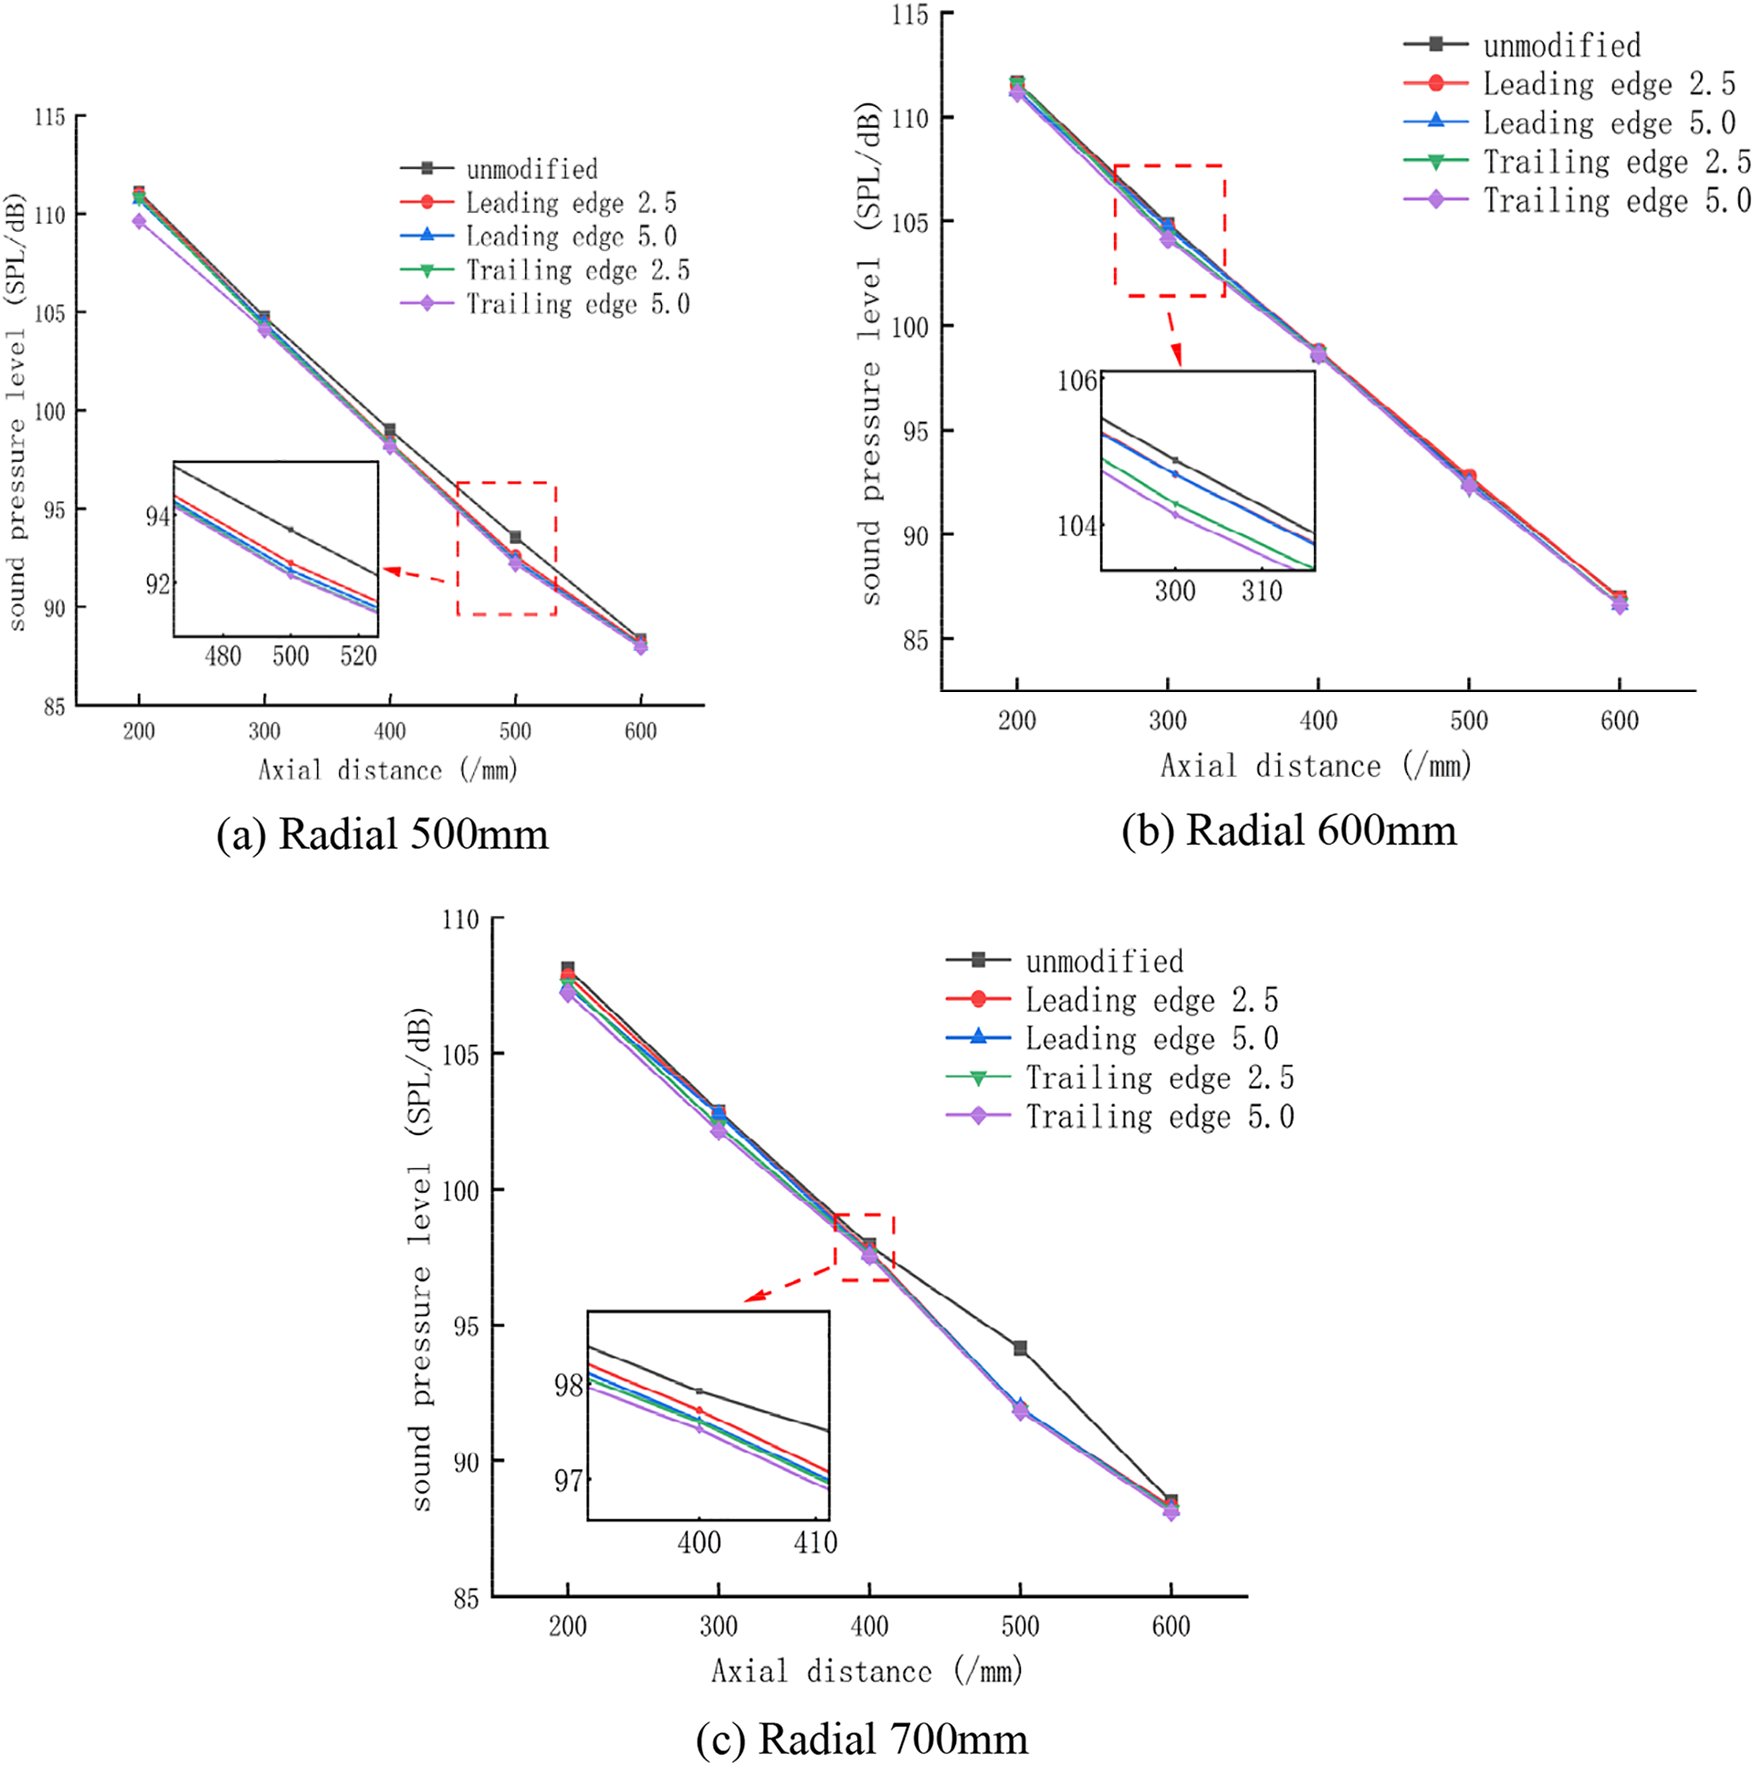
Figure 14: Radial aerodynamic noise diagram of wind turbine
By examining the distribution of aerodynamic noise in the near-tail region of each wind turbine at a radial distance of 600 mm, as shown in Fig. 14b, it is evident that the aerodynamic noise in the near-tail region reduces as the axial distance increases. The sound pressure level of the wind turbine near the surface of the wind wheel at the 200 mm position is highest before and after modification. The unmodified sound pressure level is 111.093 dB. After modification, the sound pressure levels for the leading edge 2.5-hole pattern, the leading edge 5.0-hole pattern, the trailing edge 2.5-hole pattern, and the trailing edge 5.0-hole pattern were reduced by 0.1%, 0.339%, 0.234%, and 1.32%, respectively. The position of the highest decrease in sound pressure level is between 200 and 300 mm.
By examining the distribution of aerodynamic noise in the near-tail region of each wind turbine at a radial distance of 700 mm, as shown in Fig. 14c, it is evident that the aerodynamic noise in the near-tail region reduces as the axial distance increases. The sound pressure level near the wind turbine’s surface was 200 mm before and after the modification. Without modification, the sound pressure level was 108.105 dB. After modifying the wind turbine, the sound pressure level was reduced by 0.254%, 0.616%, 0.504%, and 0.827% for the leading edge 2.5-hole pattern, the leading edge 5.0-hole pattern, the trailing edge 2.5-hole pattern, and the trailing edge 5.0-hole pattern, respectively. The position where the intensity of sound pressure decreases the most is between 400 and 500 mm.
Further examination of the graphs above provides additional evidence that the diameter and placement of the holes impact the wind turbine’s sound pressure level. Additionally, the size of the micropores is a significant factor in determining the sound pressure level of the wind turbine. The sound pressure level of the wind turbine can be reduced to a greater extent by using the trailing-edge hole pattern compared to the leading-edge hole pattern. Essentially, wind turbines with various linear microporous tip structures decrease the aerodynamic noise produced when the wind turbine is running.
We analyzed the radial distribution patterns of noise in the wake by conducting numerical simulations, explicitly focusing on distinct linear micropore tip architectures. We also compared the measuring point arrangement with the aerodynamic noise numerical simulation test. The radial noise distribution maps are acquired for wake zones with various linear micropore tip morphologies. The efficacy of the trailing edge pass and leading-edge pass in reducing the sound pressure level of the wind turbine was compared by analyzing the leading edge 2.5-hole pattern, the leading edge 5.0-hole pattern, the trailing edge 2.5-hole pattern, the trailing edge 5.0-hole pattern, and unmodified pass. As shown in Figs. 15, 16.
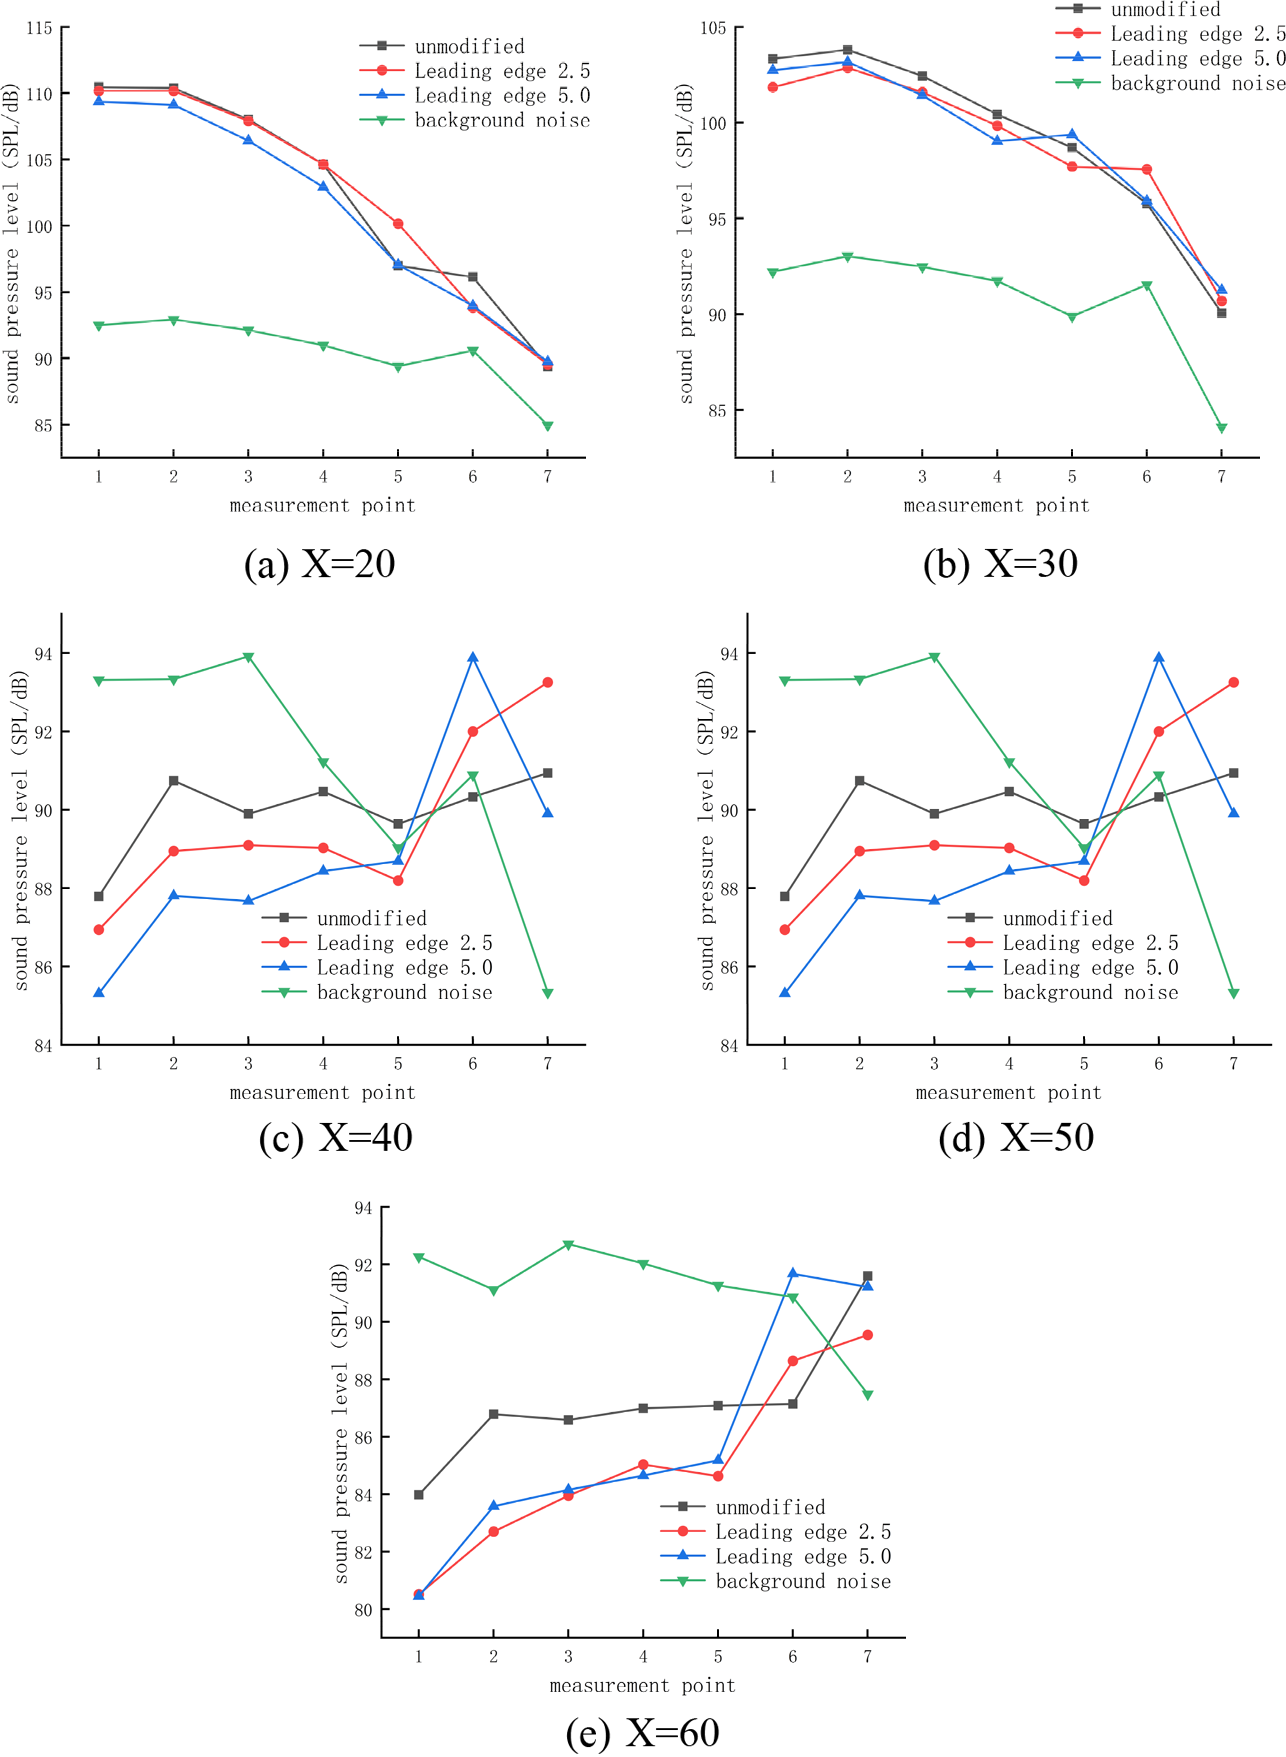
Figure 15: Radial aerodynamic noise map of wind turbine leading-edge microporous structure test
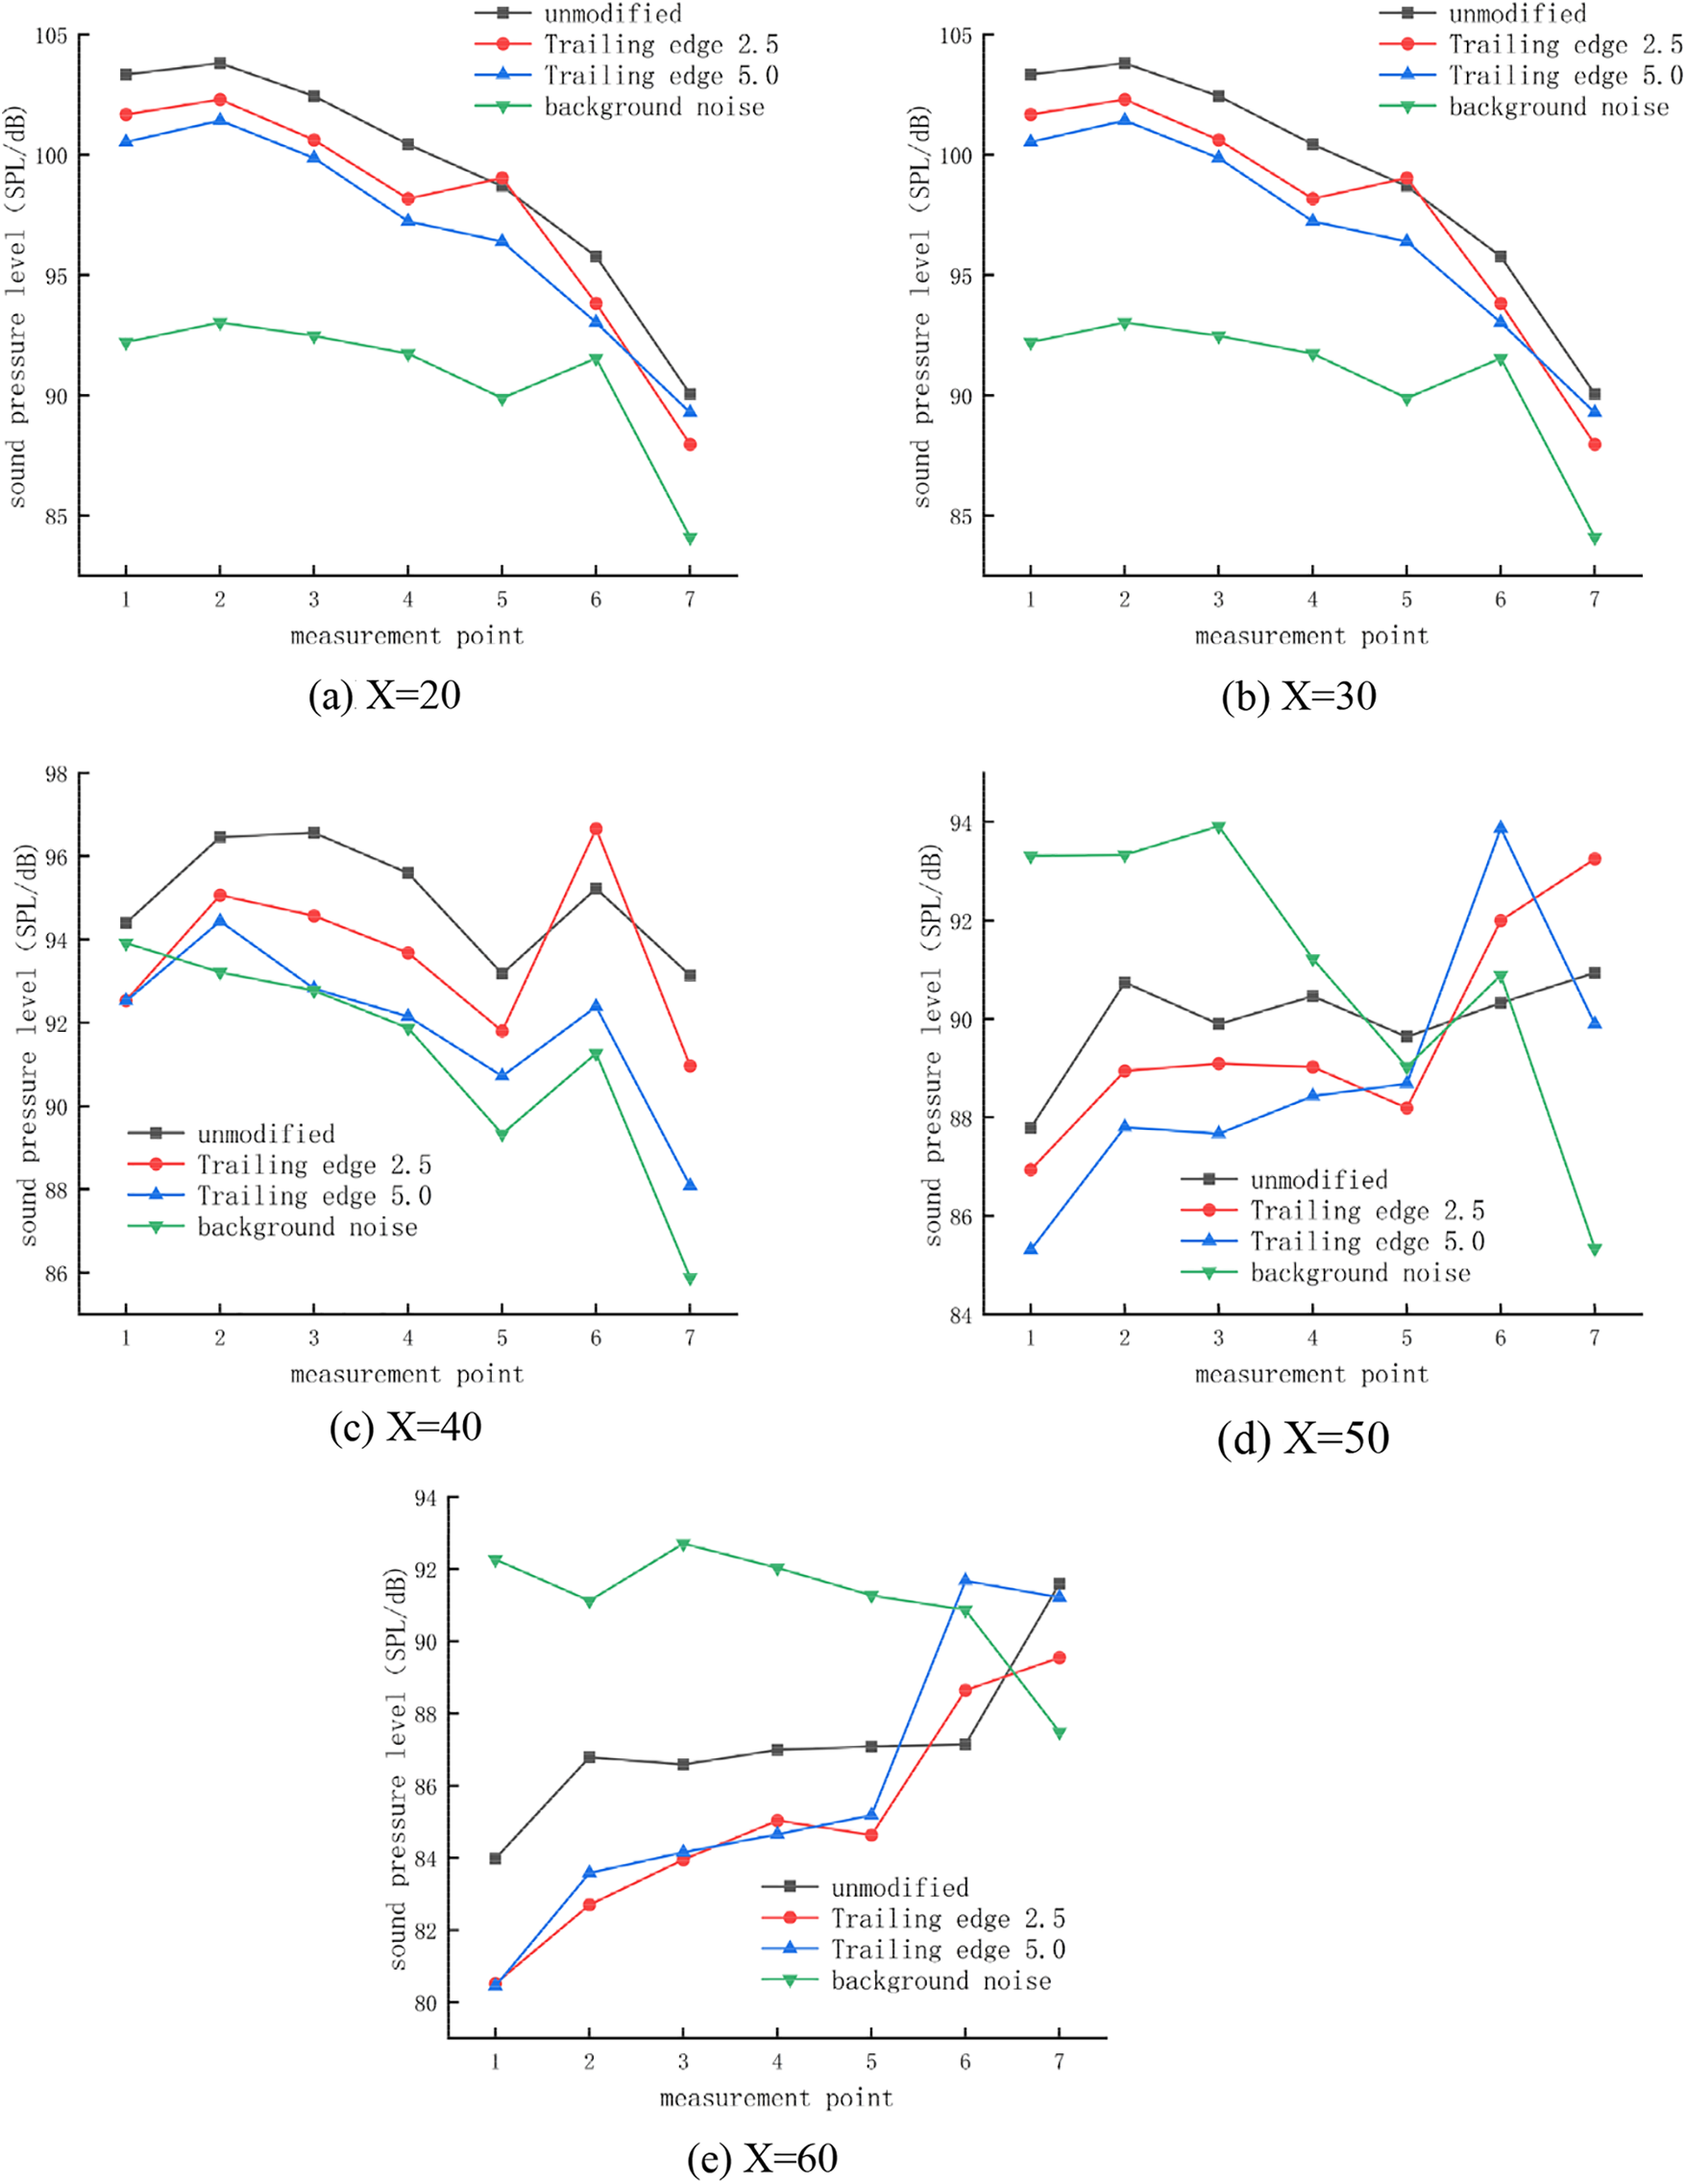
Figure 16: Radial aerodynamic noise map of wind turbine trailing edge microporous structure test
At the 20 cm cross-section, the most significant noise decrease after modifying the leading edge 2.5-hole pattern wind turbine was observed at measurement point 6, as shown in Fig. 15a. Maximum noise decreased by 2.41%, and rotating fundamental frequency noise increased by 0.07% on average. The most significant decrease in noise after the modification of the leading edge 5.0-hole pattern wind turbine was observed at measurement point 6, with a maximum noise decrease of 2.24% and an average decrease in rotating fundamental frequency noise of 0.99%.
At the 30 cm cross-section, the most significant noise reduction after modifying the leading edge 2.5-hole pattern wind turbine was observed at measurement point 1, as shown in Fig. 15b. The maximum noise decreased by 1.44%, and the rotating fundamental frequency noise decreased by 0.32% on average. The leading edge 5.0-hole pattern wind turbine modification resulted in the most significant noise reduction at measurement point 4, with a maximum noise reduction of 1.40% and an average reduction in rotating fundamental frequency noise of 0.21%.
At the 40 cm cross-section, the most significant noise decrease after modifying the leading edge 2.5-hole pattern wind turbine was observed at measurement point 7, as shown in Fig. 15c. The maximum noise decreased by 3.13%, and the rotating fundamental frequency noise increased by 0.81% on average. The leading edge 5.0-hole pattern wind turbine modification resulted in the most significant noise reduction at measurement point 3, with a maximum noise reduction of 2.22% and an average reduction in rotating fundamental frequency noise of 1.41%.
At the 50 cm cross-section, the most significant noise decrease after modifying the leading edge 2.5-hole pattern wind turbine was observed at measurement point 1, as shown in Fig. 15d. The maximum noise decreased by 1.74%, and the rotating fundamental frequency noise decreased by 0.21% on average. The leading edge 5.0-hole pattern wind turbine modification resulted in the most significant noise decrease at measurement point 4, with a maximum noise decrease of 0.61% and an average increase in rotating fundamental frequency noise of 0.32%.
At the 60 cm cross-section, the most significant noise decrease after modifying the leading edge 2.5-hole pattern wind turbine was observed at measurement point 1, as shown in Fig. 15e. The maximum noise decreased by 5.07%, and the rotating fundamental frequency noise decreased by 2.15% on average. The leading edge 5.0-hole pattern wind turbine modification showed the most significant noise reduction at measurement point 1, with a maximum noise reduction of 3.24% and an average reduction of 0.92% in rotating fundamental frequency noise.
Throughout the test duration, the maximum noise of the leading-edge 2.5-hole pattern wind turbine was decreased by an average of 1.92%, and the overall aerodynamic noise of the wind turbine was reduced by 0.36%. Modifying the leading-edge 5.0-hole blade wind turbine resulted in an average reduction of 2.76% in maximum noise. Additionally, the overall aerodynamic noise of the wind turbine decreased by 0.64%. The overall wind turbine aerodynamic noise exhibits a decreasing tendency as the diameter of the leading-edge hole increases. Hence, the size of the hole pattern on the leading edge directly influences the extent to which wind turbine rotating noise is reduced. Additionally, the diameter of the micropore plays a crucial role in determining the level of wind turbine rotating noise.
At the 20 cm cross-section, the most significant noise reduction after modifying the trailing edge 2.5-hole pattern wind turbine was observed at measurement point 6, as shown in Fig. 16a; maximum noise reduction of 2.15% and an average reduction of rotating fundamental frequency noise of 0.22%. The most significant decrease in noise after the modification of the trailing edge 5.0-hole pattern wind turbine was observed at measurement point 6, with a maximum noise decrease of 3.12% and an average decrease in rotating fundamental frequency noise of 1.11%.
At the 30 cm cross-section, the most significant noise reduction after modifying the trailing edge 2.5-hole pattern wind turbine was observed at measurement point 4, as shown in Fig. 16b. Maximum noise decreased by 2.26%, and rotating fundamental frequency noise decreased by 1.59% on average. The most significant decrease in noise after the modification of the trailing edge 5.0-hole pattern wind turbine was observed at measurement point 4, with a maximum noise decrease of 3.18% and an average decrease in rotating fundamental frequency noise of 2.39%.
At the 40 cm cross-section, the most significant noise reduction after modifying the trailing edge 2.5-hole pattern wind turbine was observed at measurement point 6, as shown in Fig. 16c. The maximum noise decreased by 2.33%, and the rotating fundamental frequency noise decreased by 1.40% on average. The most significant decrease in noise after the modification of the trailing edge 5.0-hole pattern wind turbine was observed at measurement point 6, with a maximum noise decrease of 5.42% and an average decrease in rotating fundamental frequency noise of 3.23%.
At the 50 cm cross-section, the most significant noise reduction after modifying the trailing edge 2.5-hole pattern wind turbine was observed at measurement point 4, as shown in Fig. 16d. The maximum noise decreased by 1.59%, and the rotating fundamental frequency noise decreased by 0.38% on average. The most significant decrease in noise after the modification of the trailing edge 5.0-hole pattern wind turbine was observed at measurement point 7, with a maximum noise decrease of 2.25% and an average decrease in rotating fundamental frequency noise of 1.29%.
At the 60 cm cross-section, the most significant noise reduction after modifying the trailing edge 2.5-hole pattern wind turbine was observed at measurement point 1, as shown in Fig. 16e. The maximum noise decreased by 4.13%, and the rotating fundamental frequency noise decreased by 2.49% on average. The most significant decrease in noise after the modification of the trailing edge 5.0-hole pattern wind turbine was observed at measurement point 1, with a maximum noise decrease of 4.20% and an average decrease in rotating fundamental frequency noise of 2.25%.
Over the whole test duration, the adjusted maximum noise of the wind turbine’s trailing edge 2.5-hole pattern was decreased by an average of 2.45%, and the overall aerodynamic noise of the wind turbine was lowered by 1.22%. The trailing edge modification of the wind turbine with a 5.0-hole design resulted in an average reduction of maximum noise by 3.63%. Additionally, the overall aerodynamic noise of the wind turbine dropped by 1.91%. The overall wind turbine aerodynamic noise decreases as the diameter of the trailing edge hole pattern increases. Hence, the size of the hole pattern at the trailing edge directly influences the extent to which wind turbine rotational noise is reduced. Similarly, the width of the micropore plays a crucial role in determining the rotational noise of the wind turbine.
Modified to examine the distribution patterns of axial noise at different locations using different linear microporous blade tip constructions, measurement stations were placed parallel to the X-axis at radial distances of 500, 600, and 700 mm from the wind turbine, as seen in Fig. 7. An experimental axial noise distribution graph was created for different linear microporous blade tip designs using the recorded sound pressure levels at the monitoring sites, As shown in Fig. 17.
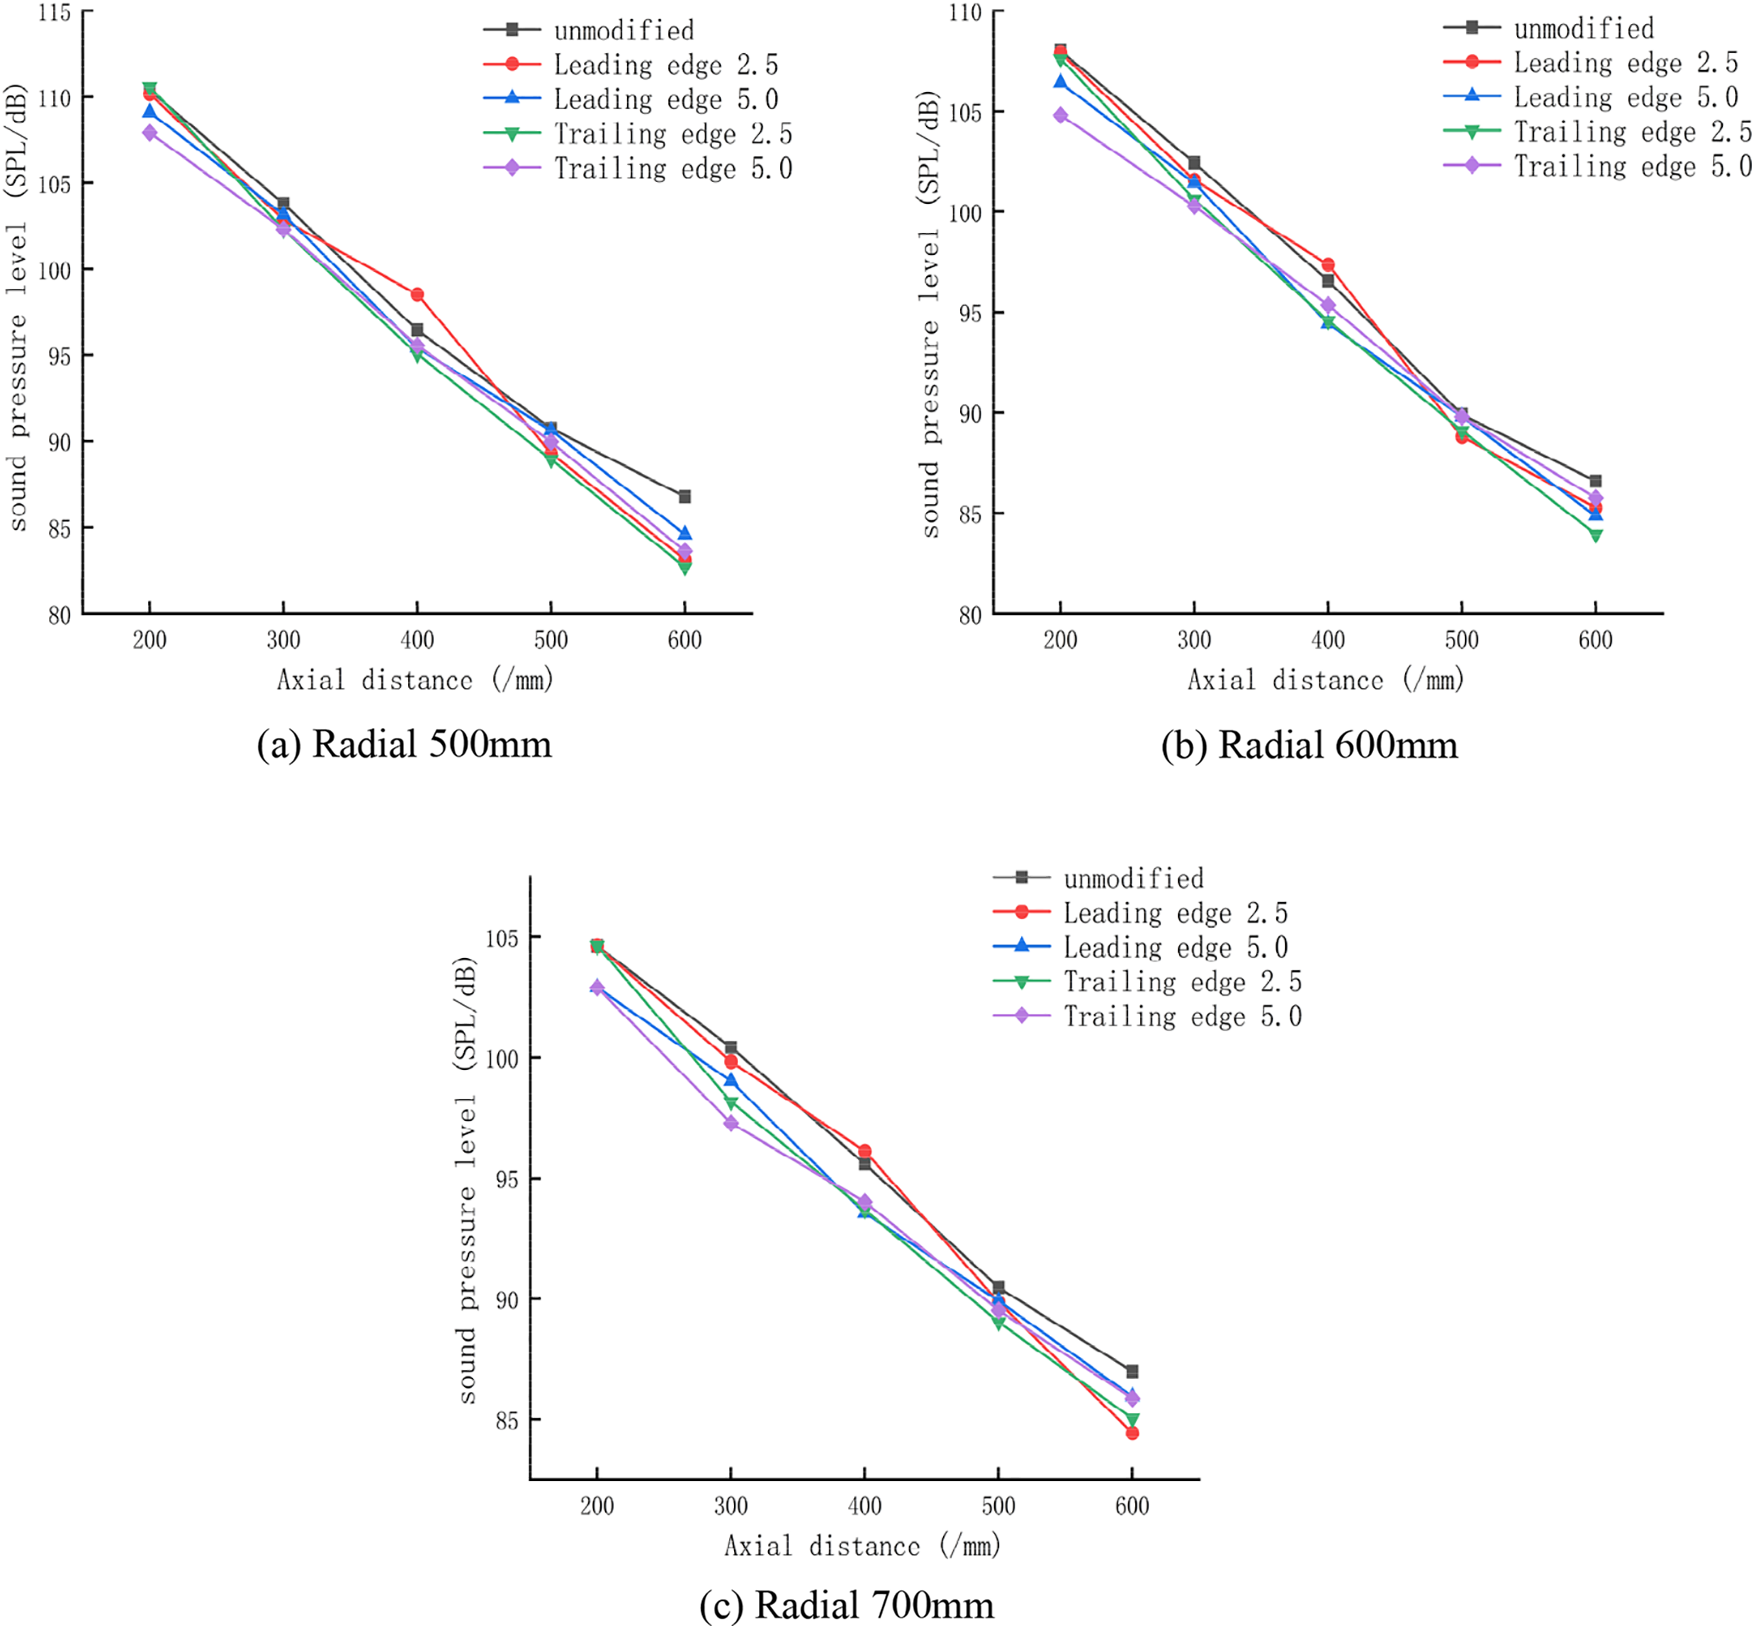
Figure 17: Axial aerodynamic noise diagram of wind turbine test
Upon analyzing the test distribution of aerodynamic noise in the near-tail region of each wind turbine at a radial distance of 500 mm, as shown in Fig. 17a, it is evident that the aerodynamic noise in the near-tail region decreases as the axial distance increases, similar to the simulated value. The wind turbine’s sound pressure level is highest at 200 mm from the surface of the turbine wheel, both before and after modification. The unmodified model has a sound pressure level of 110.374 dB. The sound pressure levels of the wind turbines with different hole patterns are reduced by 0.187%, 1.144%, and 2.226% for the leading-edge 2.5-hole pattern, leading-edge 5.0-hole pattern, and trailing edge 5.0-hole pattern, respectively. The sound pressure levels of the wind turbines with different hole patterns were lowered by 4.168, 5.243, 8.577, and 8.778 dB for the leading-edge 2.5-hole pattern, leading-edge 5.0-hole pattern, trailing edge 2.5-hole pattern, and trailing edge 5.0-hole pattern wind turbines, respectively.
Upon analyzing the test distribution of aerodynamic noise in the near-tail region of each wind turbine at a radial distance of 600 mm, as shown in Fig. 17b, it is evident that the aerodynamic noise in the near-tail region decreases as the axial distance increases, which is consistent with the simulated value. The wind turbine’s sound pressure level was highest at 200 mm near the surface of the turbine wheel, both before and after the modification. Without modification, the sound pressure level was 108.008 dB. After the modification, the sound pressure level at the leading edge of the 2.5-hole pattern wind turbine, the leading edge of the 5.0-hole pattern wind turbine, the trailing edge of the 2.5-hole pattern wind turbine, and the trailing edge of the 5.0-hole pattern wind turbine decreased by 0.101%, 1.478%, and 2.963%, respectively. The sound pressure levels of the wind turbines with different hole patterns were reduced by 2.569, 6.577, 7.649, and 7.789 dB, respectively. The wind turbines tested included those with a leading-edge 2.5-hole pattern, leading-edge 5.0-hole pattern, trailing edge 2.5-hole pattern, and trailing edge 5.0-hole pattern.
Upon analyzing the test distribution of aerodynamic noise in the near-tail region of each wind turbine at a radial distance of 700 mm, as shown in Fig. 17c, it is evident that the aerodynamic noise in the near-tail region decreases as the axial distance increases, consistent with the simulated value. The wind turbine’s sound pressure level was highest at 200 mm near the surface of the turbine wheel, both before and after the modification. The unmodified model had a sound pressure level of 104.625 dB. After the modification, the sound pressure level of the leading-edge 5.0-hole pattern decreased by 1.637%, and the trailing edge 5.0-hole pattern decreased by 1.644%. The sound pressure levels at the leading edge with a 2.5-hole pattern, the leading edge with a 5.0-hole pattern, the trailing edge with a 2.5-hole pattern, and the trailing edge with a 5.0-hole pattern were lowered by 3.225, 6.762, 7.563, and 8.515 dB, respectively.
Based on the analysis and numerical simulation calculation, it has been determined that the development trend and change rule of the two outcomes are consistent. Consistency confirms the reliability of the numerical calculation.
The findings from numerical calculations and experimental tests on wind turbines with various linear microporous blade tip constructions can be summarized as follows:
1. The pressure difference between wind turbine blades’ top and lower surfaces can be significantly reduced by retrofitting the leaf tips with various linear microporous tip designs. This reduction in pressure difference ranges from 4% to 9%. Various linear microporous impeller tip structures can decrease the pressure difference at the impeller tip, reducing the aerodynamic noise in that region. It is achieved by diminishing the impeller tip vortices’ strength when the wind turbine interacts with the incoming flow.
2. By retrofitting the leaf tip with various linear microporous tip structures, the creation of a tip vortex was inhibited, increasing linear velocity. Compared to the unmodified version, the increase in the magnitude of linear velocity was 21.112%, 11.703%, 10.226%, and 22.784%, respectively. The higher maximum linear velocity facilitates the passage of the incoming flow through the wind turbine, resulting in an enhanced flow rate of the impeller. It enables the wind turbine to absorb a more significant amount of wind energy. The tip of the trailing edge 5.0-hole type blade exhibited the most notable augmentation in maximum linear velocity.
3. Various linear microporous tip architectures can enhance the tip vortices in wind turbine operation, hence boosting the aerodynamic efficiency of the blades and substantially reducing the aerodynamic noise caused by tip vortices. By increasing the number of holes in the pattern, the intensity of the tip vortex can be significantly diminished. Additionally, the trailing-edge hole pattern is superior to the leading-edge hole pattern. Therefore, the blade’s aerodynamic performance is enhanced to decrease the aerodynamic noise from the tip vortex efficiently.
4. At the measurement points (700, 200, 0), the maximum sound pressure levels corresponding to the fundamental frequencies of the unmodified, leading-edge 2.5-hole hole pattern wind turbine, leading-edge 5.0-hole pattern wind turbine, trailing edge 2.5-hole pattern wind turbine, and trailing edge 5.0-hole pattern wind turbine are 108.105, 107.83, 107.438, 107.56, and 107.21 dB, The noise energy is mainly concentrated in the low-frequency band within 300 Hz, and the sound pressure level corresponding to the frequency after 300 Hz tends to stabilize.
5. The interaction between the incoming flow and the wind turbine generates aerodynamic noise during operation. The impeller structure’s tip is modified to have a linear microporous structure. This modification effectively reduces the radial and axial aerodynamic noise the wind turbine produces during operation. The primary variables influencing the degree of noise reduction are the dimensions of the aperture pattern and the placement of the front and back edges. Increasing the hole size can effectively decrease radial and axial aerodynamic noise. The experimental data reveals that the average decrease in maximum noise was 1.92% for the retrofit of wind turbines with a leading-edge 2.5-hole pattern, 2.76% for the retrofit of wind turbines with a leading-edge 5.0-hole pattern blade, 2.45% for the retrofit of wind turbines with a trailing edge 2.5-hole pattern, and 3.63% for the retrofit of wind turbines with a trailing edge 5.0-hole pattern. It is also determined that the aperture’s size dictates the extent of aerodynamic noise reduction in the wind turbine. Furthermore, the wind turbine with a hole pattern at the trailing edge exhibits a superior noise reduction impact compared to the wind turbine with a hole pattern at the leading edge.
6. The observed variations in flow velocity and noise SPL during the wind tunnel test align with the results obtained from numerical calculations, confirming the credibility of this numerical simulation study.
7. From an aerodynamic optimization standpoint, this work presents the design of a linear microporous tip structure for tiny wind turbine blades. The large eddy simulation turbulence model evaluates the flow field and aerodynamic noise characteristics before and after the retrofit. This analysis provides a valuable reference for future wind turbine retrofitting. This study presents research findings achieved by numerical simulation and wind tunnel testing. However, there are still certain limitations that require additional investigation. The flow field model used in this paper assumes a constant wind speed for the velocity inlet and does not represent the pulsing wind speed found in the natural environment. For analytical evaluations of aerodynamic performance, it is advisable to include velocity inlets to accurately imitate natural ambient wind speeds in the future. This paper does not consider the influence of towers and rudders on the wind turbine’s flow field characteristics. In the future, numerical calculations will be necessary to study the entire wind turbine to align the simulation conditions with the actual requirements.
Acknowledgement: None.
Funding Statement: This study was supported by the National Natural Science Foundation Projects (grant number 51966018) and the Key Research & Development Program of Xinjiang (grant number 2022B01003).
Author Contributions: The authors confirm contribution to the paper as follows: supervision, project administration, funding acquisition, and writing—review & editing: Yuanjun Dai, Yi Ye, Xiongfei Liu; study conception and design: Yuanjun Dai, Yi Ye; data collection: Yi Ye; analysis and interpretation of results: Yi Ye; draft manuscript preparation: Yi Ye. All authors reviewed the results and approved the final version of the manuscript.
Availability of Data and Materials: The authors confirm that the data supporting the findings of this study are available within the article.
Ethics Approval: Not applicable.
Conflicts of Interest: The authors declare no conflicts of interest to report regarding the present study.
References
1. Mittal P, Christopoulos G, Subramanian S. Energy enhancement through noise minimization using acoustic metamaterials in a wind farm. Renew Energy. 2024;224:120188. doi:10.1016/j.renene.2024.120188. [Google Scholar] [CrossRef]
2. Stępień B, Wszołek T, Mleczko D, Małecki P, Pawlik P, Kłaczyński M, et al. Suitability analysis of selected methods for modelling infrasound and low-frequency noise from wind turbines. Energies. 2024;17(12):2832. doi:10.3390/en17122832. [Google Scholar] [CrossRef]
3. Makarewicz R. Proposed methodology for the annoyance penalty of amplitude modulated wind turbine noise. Arch Acoust. 2023;47(1):125–8. [Google Scholar]
4. Li S, Chen Q, Li Y, Pröbsting S, Yang C, Zheng X, et al. Experimental investigation on noise characteristics of small scale vertical axis wind turbines in urban environments. Renew Energy. 2022;200(1):970–82. doi:10.1016/j.renene.2022.09.099. [Google Scholar] [CrossRef]
5. Radun J, Maula H, Saarinen P, Keränen J, Alakoivu R, Hongisto V. Health effects of wind turbine noise and road traffic noise on people living near wind turbines. Renew Sustain Energy Rev. 2022;157:112040. doi:10.1016/j.rser.2021.112040. [Google Scholar] [CrossRef]
6. Pourrajabian A, Rahgozar S, Dehghan M, Wood D. A comprehensive multi-objective optimization study for the aerodynamic noise mitigation of a small wind turbine. Eng Anal Bound Elem. 2023;155(3):553–64. doi:10.1016/j.enganabound.2023.06.035. [Google Scholar] [CrossRef]
7. Zhang Y, Cao H, Liu X, Qi L. Effect of the leading-edge protuberances on the aeroacoustic and aerodynamic performances of the wind turbine airfoil. Ocean Eng. 2022;266(9):113153. doi:10.1016/j.oceaneng.2022.113153. [Google Scholar] [CrossRef]
8. Aihara A, Bolin K, Goude A, Bernhoff H. Aeroacoustic noise prediction of a vertical axis wind turbine using large eddy simulation. Int J Aeroacoust. 2021;20(8):959–78. doi:10.1177/1475472X211055179. [Google Scholar] [CrossRef]
9. Su J, Lei H, Zhou D, Han Z, Bao Y, Zhu H, et al. Aerodynamic noise assessment for a vertical axis wind turbine using improved delayed detached Eddy simulation. Renew Energy. 2019;141:559–69. doi:10.1016/j.renene.2019.04.038. [Google Scholar] [CrossRef]
10. Botha JDM, Shahroki A, Rice H. An implementation of an aeroacoustic prediction model for broadband noise from a vertical axis wind turbine using a CFD informed methodology. J Sound Vib. 2017;410(3):389–415. doi:10.1016/j.jsv.2017.08.038. [Google Scholar] [CrossRef]
11. Hashem I, Mohamed MH, Hafiz AA. Aero-acoustics noise assessment for Wind-Lens turbine. Energy. 2017;118(5):345–68. doi:10.1016/j.energy.2016.12.049. [Google Scholar] [CrossRef]
12. Li X, Yang K, Hu H, Wang X, Kang S. Effect of tailing-edge thickness on aerodynamic noise for wind turbine airfoil. Energies. 2019;12(2):270. doi:10.3390/en12020270. [Google Scholar] [CrossRef]
13. Cao J, Zhu W, Wu X, Wang T, Xu H. An aero-acoustic noise distribution prediction methodology for offshore wind farms. Energies. 2018;12(1):18. doi:10.3390/en12010018. [Google Scholar] [CrossRef]
14. Cotté B. Coupling of an aeroacoustic model and a parabolic equation code for long range wind turbine noise propagation. J Sound Vib. 2018;422(8):343–57. doi:10.1016/j.jsv.2018.02.026. [Google Scholar] [CrossRef]
15. Dai Y, Li B. A numerical study of the acoustic radiation characteristics of the aerodynamic noise in the near-wake region of a wind turbine. Results Phys. 2019;15:102782. doi:10.1016/j.rinp.2019.102782. [Google Scholar] [CrossRef]
16. Ottermo F, Möllerström E, Nordborg A, Hylander J, Bernhoff H. Location of aerodynamic noise sources from a 200 kW vertical-axis wind turbine. J Sound Vib. 2017;400(2):154–66. doi:10.1016/j.jsv.2017.03.033. [Google Scholar] [CrossRef]
17. Wang H, Chen B. Investigation on aerodynamic noise for leading edge erosion of wind turbine blade. J Wind Eng Ind Aerod. 2023;240:105484. doi:10.1016/j.jweia.2023.105484. [Google Scholar] [CrossRef]
18. Ye X, Hu J, Zheng N, Li C. Numerical study on aerodynamic performance and noise of wind turbine airfoils with serrated gurney flap. Energy. 2023;262(2):125574. doi:10.1016/j.energy.2022.125574. [Google Scholar] [CrossRef]
19. Volkmer K, Kaufmann N, Carolus TH. Mitigation of the aerodynamic noise of small axial wind turbines-methods and experimental validation. J Sound Vib. 2021;500(4–5):116027. doi:10.1016/j.jsv.2021.116027. [Google Scholar] [CrossRef]
20. Lee S, Lee S. Numerical and experimental study of aerodynamic noise by a small wind turbine. Renew Energy. 2014;65:108–12. doi:10.1016/j.renene.2013.07.036. [Google Scholar] [CrossRef]
21. Yang H, Yuan W, Zhu W, Sun Z, Zhang Y, Zhou Y. Wind turbine airfoil noise prediction using dedicated airfoil database and deep learning technology. Appl Energy. 2024;364(8):123165. doi:10.1016/j.apenergy.2024.123165. [Google Scholar] [CrossRef]
22. Madrigal Avalos G, Rosado Hau N, Quintal-Palomo R, Ordóñez López EE, Gamboa-Marrufo M, Escalante Soberanis MA. Aerodynamic techniques to mitigate the 3D loss in the power coefficient of vertical axis wind turbines. Energ Convers Manage. 2024;311(5):118507. doi:10.1016/j.enconman.2024.118507. [Google Scholar] [CrossRef]
23. Dinh Le A, Nguyen Thi Thu P, Ha Doan V, The Tran H, Duc Banh M, Truong V-T. Enhancement of aerodynamic performance of Savonius wind turbine with airfoil-shaped blade for the urban application. Energ Convers Manage. 2024;310(5):118469. doi:10.1016/j.enconman.2024.118469. [Google Scholar] [CrossRef]
24. Nakhchi ME, Win Naung S, Rahmati M. Wake and power prediction of horizontal-axis wind farm under yaw-controlled conditions with machine learning. Energ Convers Manage. 2023;296:117708. doi:10.1016/j.enconman.2023.117708. [Google Scholar] [CrossRef]
25. Sun ZY, Zhu WJ, Shen WZ, Barlas E, Sorensen JN, Cao JF, et al. Development of an efficient numerical method for wind turbine flow, sound generation, and propagation under multi-wake conditions. Appl Sci-Basel. 2019;9(1):100. doi:10.3390/app9010100. [Google Scholar] [CrossRef]
26. Zhang CQ, Gao ZY, Chen YY, Lv WC, Chen JX, Liu YT. Experimental locating of rotor sound source using a compact microphone array. J Renew Sustain Ener. 2020;12(5):270. doi:10.1063/5.0003236. [Google Scholar] [CrossRef]
27. Liao LD, Huang B, Tan Q, Huang K, Ma M, Zhang K. Development of an improved LMD method for the low-frequency elements extraction from turbine noise background. Energies. 2020;13(4):805. doi:10.3390/en13040805. [Google Scholar] [CrossRef]
28. Li YJ, Wei KX, Yang WX, Wang Q. Improving wind turbine blade based on multi-objective particle swarm optimization. Renew Energy. 2020;161(3):525–42. doi:10.1016/j.renene.2020.07.067. [Google Scholar] [CrossRef]
29. Llorente E, Ragni D. Trailing-edge serrations effect on the performance of a wind turbine. Renew Energy. 2020;147(3):437–46. doi:10.1016/j.renene.2019.08.128. [Google Scholar] [CrossRef]
Cite This Article
 Copyright © 2024 The Author(s). Published by Tech Science Press.
This work is licensed under a Creative Commons Attribution 4.0 International License , which permits unrestricted use, distribution, and reproduction in any medium, provided the original work is properly cited.


 Submit a Paper
 Propose a Special lssue
 View Full Text
 Download PDF
 Downloads
 Citation Tools