 Open Access
ARTICLE
Far-Field Behavior of Supercritical CO2 Being Dispersed Due to Leakage from Pipelines
1 College of Pipeline and Civil Engineering, China University of Petroleum (East China), Qingdao, 266580, China
2 Design Management Center, PipeChina Engineering Technology Innovation Co., Ltd., Tianjin, 300450, China
3 School of Petroleum Engineering, Yangtze University, Wuhan, 430100, China
* Corresponding Authors: Xuewen Cao. Email: ; Jiang Bian. Email:
Fluid Dynamics & Materials Processing 2024, 20(12), 2867-2885. https://doi.org/10.32604/fdmp.2024.053774
Received 10 May 2024; Accepted 29 August 2024; Issue published 23 December 2024
Abstract
Transporting massive quantities of carbon dioxide through a pipeline in its supercritical state is extremely convenient. Because of the unique properties of supercritical carbon dioxide, however, leakage occurring in such conditions can be extremely intricate, resulting in the dispersion area following leakage being influenced by numerous factors. In this study, this problem is addressed in the frame of the so-called Unified Dispersion Model (UDM), and various influential parameters are considered, namely, leakage pressure, leakage temperature, leakage aperture, leakage angle, atmospheric stability, wind speed, and surface roughness. The results show that the supercritical carbon dioxide dispersion is primarily influenced by high air temperatures, low wind speeds, reduced surface roughness, and release temperatures slightly below the critical temperature. Additionally, leak apertures also contribute to the dispersion. The dispersion is maximized under atmospheric stable D conditions, and when the leakage angle is 0°, the farthest downwind distance is 10 times greater than that at a leakage angle of 90° under the same conditions.Keywords
The greenhouse effect, which is primarily responsible for global warming [1], has been a significant source of concern since the 1980s. The primary contributors to the greenhouse effect are the release of greenhouse gases, including CO2 and methane [2]. The advancement of carbon dioxide capture and storage (CCS) technologies [3] holds immense importance in tackling the issue of global climate change. Advancements in material innovation, process development, and integrated utilization technologies, together with the implementation of mineral sequestration [4] and carbon dioxide capture, EOR-utilization and storage (CCUS-EOR) technologies [5], are anticipated to boost the efficiency and cost-effectiveness of these technologies. Future research should prioritize enhancing CO2 separation and purification technologies [6], optimizing carbonization and sequestration processes, expediting mineral carbonization rates, reducing the cost of carbon capture and sequestration [7], and facilitating the widespread implementation of mineral sequestration technologies on a large scale. Simultaneously, it should enhance the development of research and demonstration projects for CCUS-EOR technology and establish a comprehensive theoretical and technical standard system for the entire industrial chain in order to facilitate and advance the widespread implementation of this technology on an industrial scale. The transportation aspect of CCS is crucial since it serves as both the starting and ending point of the process. Commercial-scale transportation mainly uses tanks, ships, trains, pipelines, etc. Transporting a substantial quantity of CO2 across a distance of more than 1000 kilometers [8] is an exceptionally efficient method for conveying high-pressure CO2 through pipelines at a reasonable cost. Leakage of a CO2 pipeline might result in significant damage. At high concentrations, CO2 has asphyxiating effects [9]. Furthermore, as a result of the potent throttling impact of CO2 [10], as CO2 transitions from supercritical pressure to atmospheric pressure, the temperature of the fluid also rapidly decreases, reaching as low as −80°C in the closest area. The dispersion of substantial quantities of cryogenic gases can induce a range of physiological alterations in different systems of the human body, potentially resulting in localized or systemic harm and, in extreme cases, death.
The exploration of numerical models for leakage dispersion began with studies of leaks involving oil and gas [11,12]. Many academics have worked hard in this field and produced many results between the 1980s and the present. Mathematical and physical models for various leakage conditions have been established based on a vast amount of experimental data derived from large-scale on-site experiments, laboratory experiments, etc., combined with theoretical analysis. With the rapid advancement of computer hardware and software technology, numerical simulations are becoming increasingly promising, and people have come to accept and value the results of such calculations.
Xing et al. [13] used a CFD program to simulate the standard k-ε, RNG k-ε, and SST k-ω models, which were then evaluated using statistical performance indicators such as MG, VG, and FAC2. The findings indicate that the SST k-ω model underestimates the concentration, while the k-ε model slightly overestimates it. Liu et al. [14] used a two-stage CFD simulation approach to model supercritical leakage. A two-dimensional fluid simulation is used in the first stage to estimate the leakage source strength, and the results of this calculation are applied to the diffusion simulation that follows. A three-dimensional fluid simulation is used in the second stage to shorten the computation time. Schleder et al. [15] conducted field research to examine how well CFD tools function while analyzing the cloud spread of dangerous materials. The goal of the experiment was to monitor the development and spread of a CO2 cloud over a 600 m2 emission region while a significant volume of CO2 was continuously released. The CFD simulation results were compared with the peak concentrations measured by 51 sensors distributed throughout the cloud route. Witlox et al. [16–18] used extensions of the dispersion model (UDM) and discharge model (DISC/TVDI) in Process Hazard Analysis Software Tool (PHAST) to study the emission of CO2 and its subsequent atmospheric dispersion. It was demonstrated that an excessively high liquid fraction and a too-low postexpansion temperature can result from the failure of the discharge model to take solid effects into account. Mcgillivray et al. [19] compared the analyses of CO2 and natural gas pipelines. PHAST software was utilized to model gaseous CO2 leaks, taking into account the diameters of the leak holes as well as the effects of the leak angle on the formation of craters. They concluded that at the same pressure levels, the risks associated with natural gas leaks and CO2 leaks are similar. Wareing et al. [20,21] simulated the near-field leak dispersion of an underground pure CO2 pipeline using COOLTRANS software. In particular, for side, bottom, and top cracks, a modified k-ε turbulence model including temperature, velocity, and concentration was applied, and the diffusion of CO2 from the top of a deep hole was simulated. To assess the risk, Koornneef et al. [22] simulated the spread of leakage from a high-pressure CO2 conduit. Nguyen et al. [23] investigated liquid CO2 jet or plume behavior at a depth of 800 m in the ocean by comparing numerical results with theoretical and experimental results. The EC FP7 CO2 PipeHaz project [24] aims to address hazards from pipelines transporting CO2 at high pressure in a dense-phase state. This study develops mathematical models for multiphase discharge and dispersion, demonstrating the integration of different models for pipeline outflow and dispersion. Hill et al. [25] presented computer-based analyses of CO2 dispersion from pipelines and containment vessels for power plants using carbon capture and storage, predicting source terms and investigating solid CO2 formation effects. Mazzoldi et al. [26] evaluated the Fluidyn-PANACHE atmospheric dispersion CFD tool for carbon capture and storage against field experiments. It finds PANACHE among the “fit-for-purpose” models, with average underprediction due to mean wind speed and direction.
However, the long-range dispersion of CO2 in the atmosphere occurs due to several atmospheric causes. The numerical simulation of the dispersion of CO2 covers a large geographical area. The present research primarily employs several models to simulate the impact of pipeline leakage parameters on leakage. However, it is challenging to accomplish this using CFD methods due to the complex influence of air stability, wind speed, and surface roughness on leakage. The novelty of this paper lies in its refinement of the effects of leakage pressure, leakage temperature, leakage aperture, leakage angle, atmospheric stability, wind speed, and surface roughness on the leakage-diffusion characteristics of supercritical CO2 pipelines using the UDM diffusion model of PHAST.
This paper uses PHAST software for simulation and chooses the UDM model to address this challenge. The UDM model can be used for any type of gas leakage, whether it is continuous or transient, regardless of whether the leaked gas is heavy, neutral, or floating. The PHAST software can describe the process of gas leakage diffusion and the resulting impacts. The UDM model is based on experimental data from the leakage diffusion of Kit Fox and BP DF1 CO2. The UDM model is derived from the empirical data obtained from the experiments conducted on Kit Fox and BP DF1 CO2 leakage and diffusion. Furthermore, the CO2 module has undergone significant modifications in future versions of PHAST. Due to the close resemblance of the simulation findings to actual events, its usage has become widespread.
Basic control equations
(1) Continuity equation [27]
where ρ is the density, kg/m3; u is the flow velocity, m/s; x is the horizontal length, m; and t is the time, s.
(2) Momentum conservation equation [28]
where p is the pressure, MPa.
(3) Energy conservation equation [28]
where E is the internal energy, k is the thermal conductivity, and μ is the viscosity coefficient.
(4) PR equation
The Peng–Robinson equation is obtained by optimizing the gravitational part of the RK equation, resulting in greatly enhanced accuracy in calculating the critical compression factor and liquid density [29]. The equation is mostly utilized in engineering phase equilibrium calculations, and the expression is as follows:
where
(5) UDM model
For the continuous leakage and diffusion of supercritical CO2, the UDM model can be used to modify the model in finite time and calculate the average leakage velocity. The expression for the leakage concentration is as follows:
where C(x,y,z,H) is the CO2 leakage concentration at a certain point, C0(x) is the concentration at the center of the vapor cloud, n(x) is the meteorological condition parameters, m(x) is the CO2 gas parameters, and σy and σz are the horizontal and vertical diffusion coefficients, respectively.
To determine the accuracy of the software numerical simulation calculation method, the model validation is required. The experimental validation data is derived from the gas leakage near-field jet experiment conducted by Li [30]. The experiment was conducted using a circular leak hole with an inner diameter of 1 mm. During the experiment, stable air pressure and flow were maintained, and the gas mole fraction on the centerline of the jet was measured for comparison and verification with simulation results.
Fig. 1 compares the simulated predicted values and experimental measurements of gas molar concentration on the centerline of the jet. The solid line represents the calculated results, and the triangle represents the experimental results. As shown in the figure, the numerical simulation results of the gas concentration distribution on the centerline of the jet are in good agreement with the experimental results, which verifies the accuracy and reliability of the simulation method proposed in this paper.
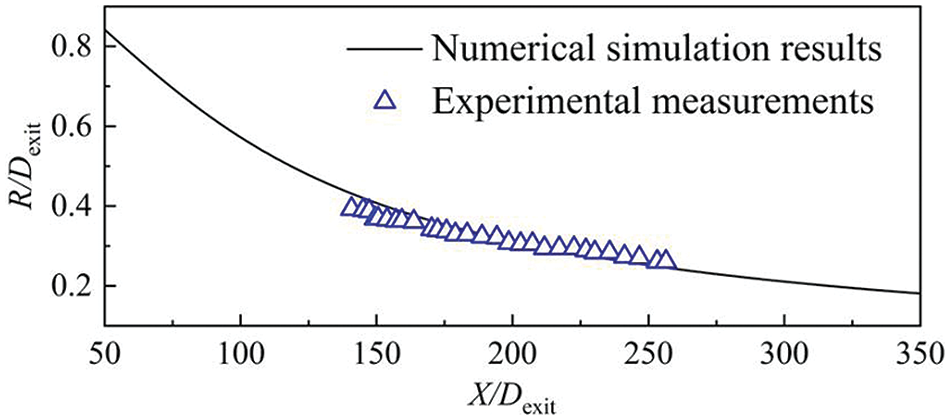
Figure 1: The simulated values and experimental measurements of gas molar concentration
The impact of elements such as pipeline leakage is examined by altering various sensitivity parameters, including leakage pressure, leakage temperature, leakage aperture, leakage angle, atmospheric stability, wind speed, and surface roughness. When the source strength of CO2 leakage was 0.0689 g/s, the discussion focused on several aspects such as dispersion distances, cloud heights, and ground coverage regions, using the time-weighted average (TWA) occupational exposure requirement of 5000 ppm as a boundary condition [31]. Table 1 shows the starting values for this simulation. One set of factors is changed at a time, keeping the other data unaltered.

3.1 Impacts on the Atmospheric Environment
The various aspects that affect the spread of leakage can be classified into two broad categories: the impact of the atmospheric environment and the impacts of leakage parameters. The primary factors of the atmospheric environment are atmospheric stability, air temperature, wind speed, and surface roughness.
(1) Atmospheric stability
The atmosphere can be vertically split into numerous strata based on different categorization criteria. Atmospheric stability is essentially defined by the ratio of the temperature decrease tilt rate to the dry adiabatic temperature decrease tilt rate. If the dry adiabatic temperature decrease tilt rate is less than the temperature decrease tilt rate, atmospheric air masses spreading vertically are free to move, and the surrounding air does not restrict their vertical movement, resulting in atmospheric instability. In contrast, when the dry adiabatic temperature decrease tilt rate exceeds the temperature decrease tilt rate, the air mass is inhibited by the surrounding air, resulting in atmospheric stability.
The categorization of atmospheric stability often relies on the Pasquill stability technique [32], which separates stability into six distinct categories: A, B, C, D, E, and F. A is highly unstable; B is unstable; C is moderately unstable; D is moderate; E is moderately stable; and F is stable. The Phast software provides the following heights for the mixed layers in A–F weather stability: 1300, 920, 840, 800, 400, and 100 m.
To determine the grade, we must first calculate the solar altitude angle and determine the solar radiation level. We then combined this information with the ground wind speed to determine the stability grade. In this study, atmospheric stability was classified into six grades (A–F) for sensitivity analysis. Based on this analysis, we obtained the laws governing the downwind diffusion distance, lateral diffusion distance, maximum coverage area, and farthest diffusion distance. These results are presented in Fig. 2.
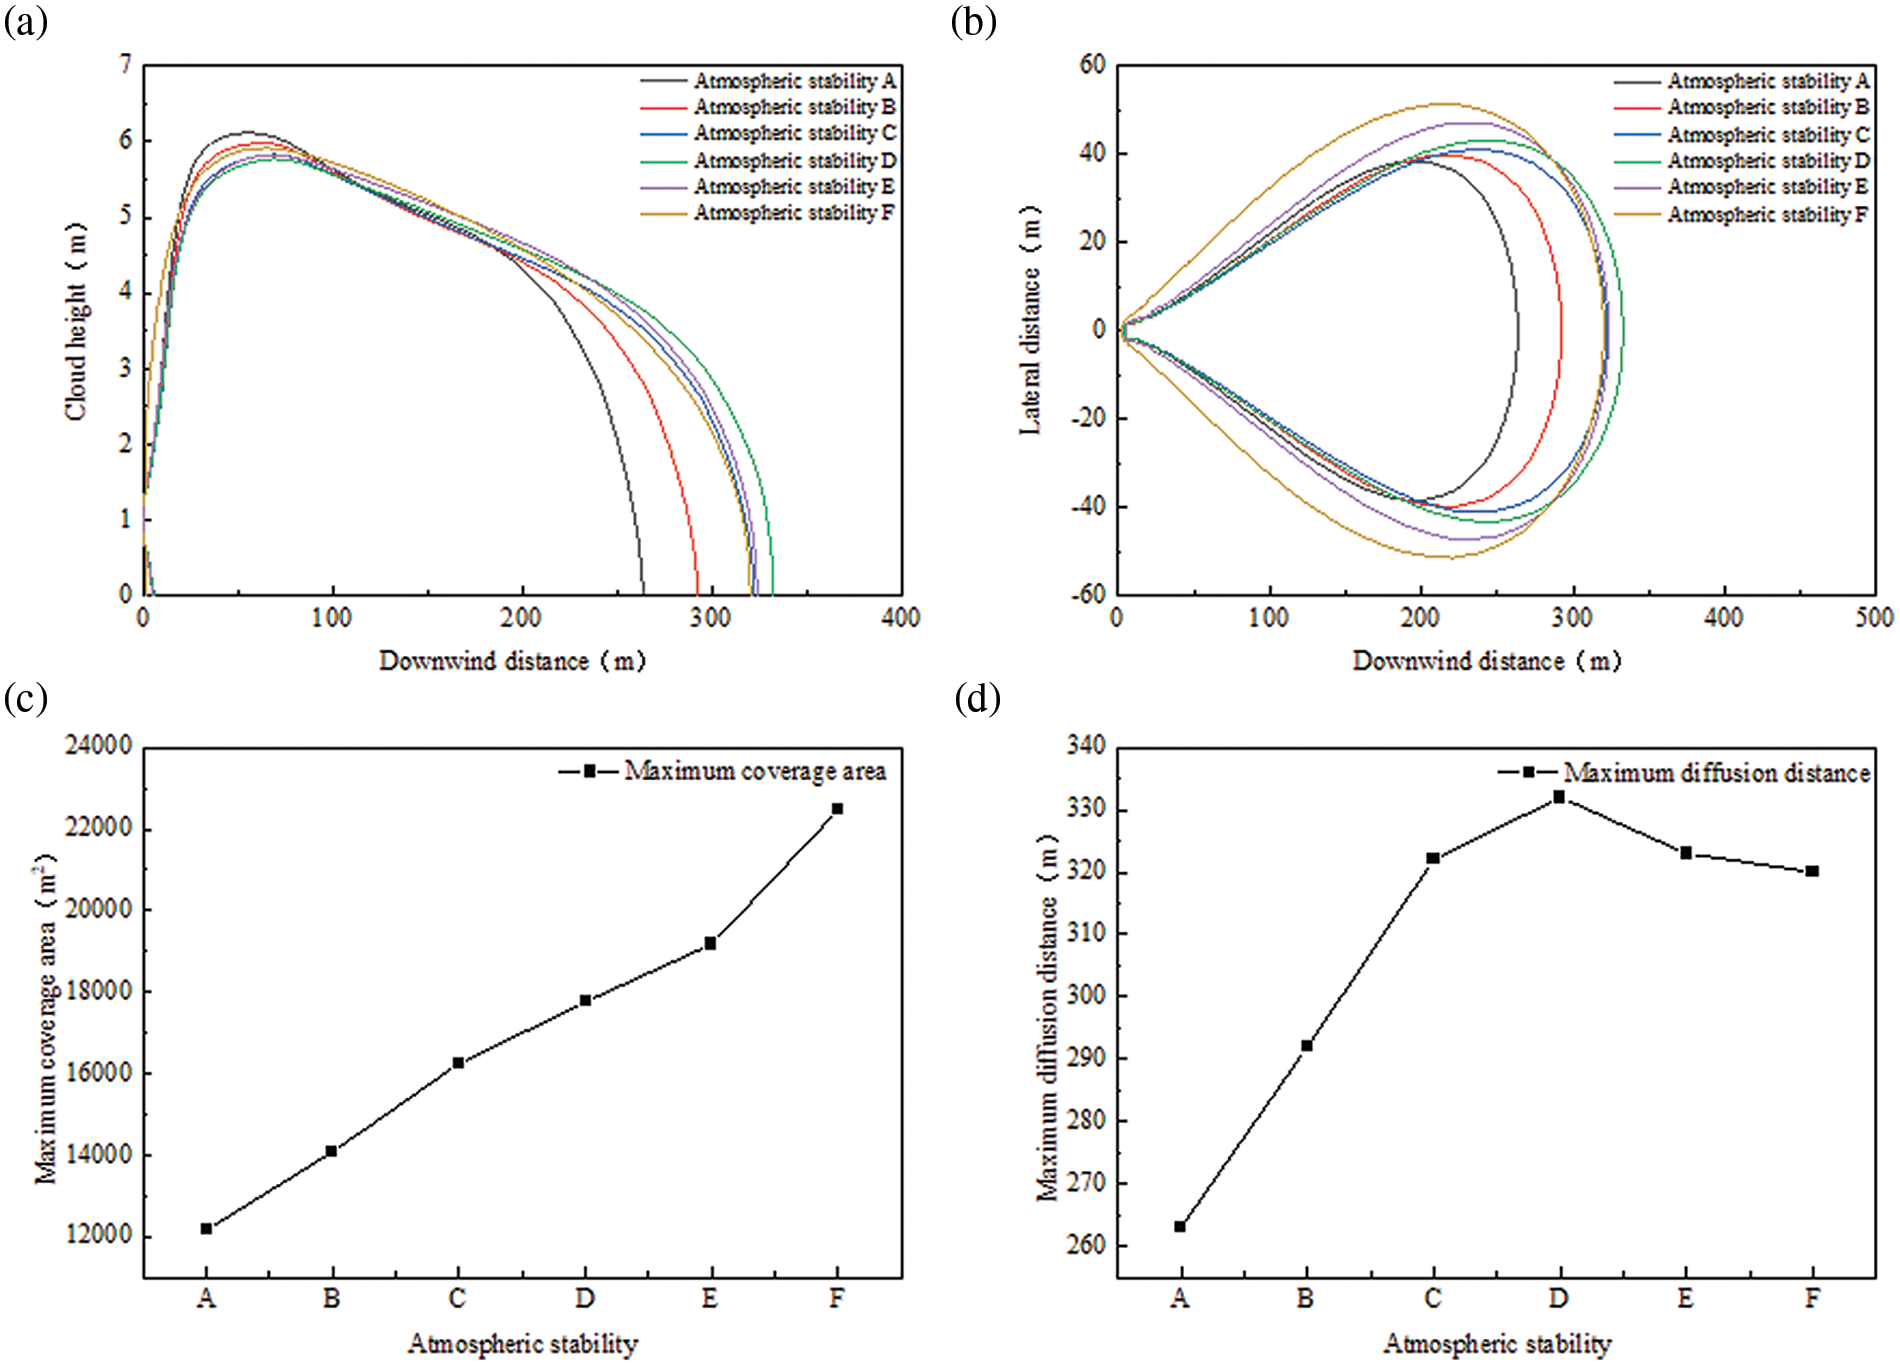
Figure 2: Diffusion patterns at different atmospheric stabilities: (a) downwind diffusion distance, (b) lateral diffusion distance, (c) maximum area covered, and (d) farthest diffusion distance
In class A weather, when the atmosphere is highly unstable, the temperature decrease rate in the vertical direction is greater than the dry adiabatic temperature decrease rate. This results in a rapid growth of turbulence caused by thermal conditions and intense convection of the diffusing mass of CO2 gas with the surrounding air. As a result, vertical diffusion is greater than at other stable weather gas-phase cloud heights in the vicinity of the diffusion initial leakage vent. However, in the horizontal direction, the diffusion of substances becomes easier. In contrast, during a period of atmospheric stability, vertical turbulent diffusion is suppressed, particularly when there is a vertical inversion, resulting in the accumulation of CO2 near the surface.
As shown in Fig. 2a, there is an inverse relationship between the atmospheric stability and the maximum cloud height. Fig. 2b illustrates that the width of the air mass on the ground progressively expands as the atmospheric stability increases. However, when close to the ground, the maximum distance over which diffusion occurs is determined by the weather conditions, specifically the D weather type. Under these weather conditions, when leakage occurs, the hazard distance increases as the gas diffusion distance increases.
(2) Wind speed
The wind speeds were set at 1.5, 3, 5, 7, 10, and 15 m/s. Sensitivity analyses were conducted to determine the correlation between downwind distance and cloud height at different wind speeds, as well as the relationship between various wind speeds and the maximum distance of spreading, as shown in Fig. 3.
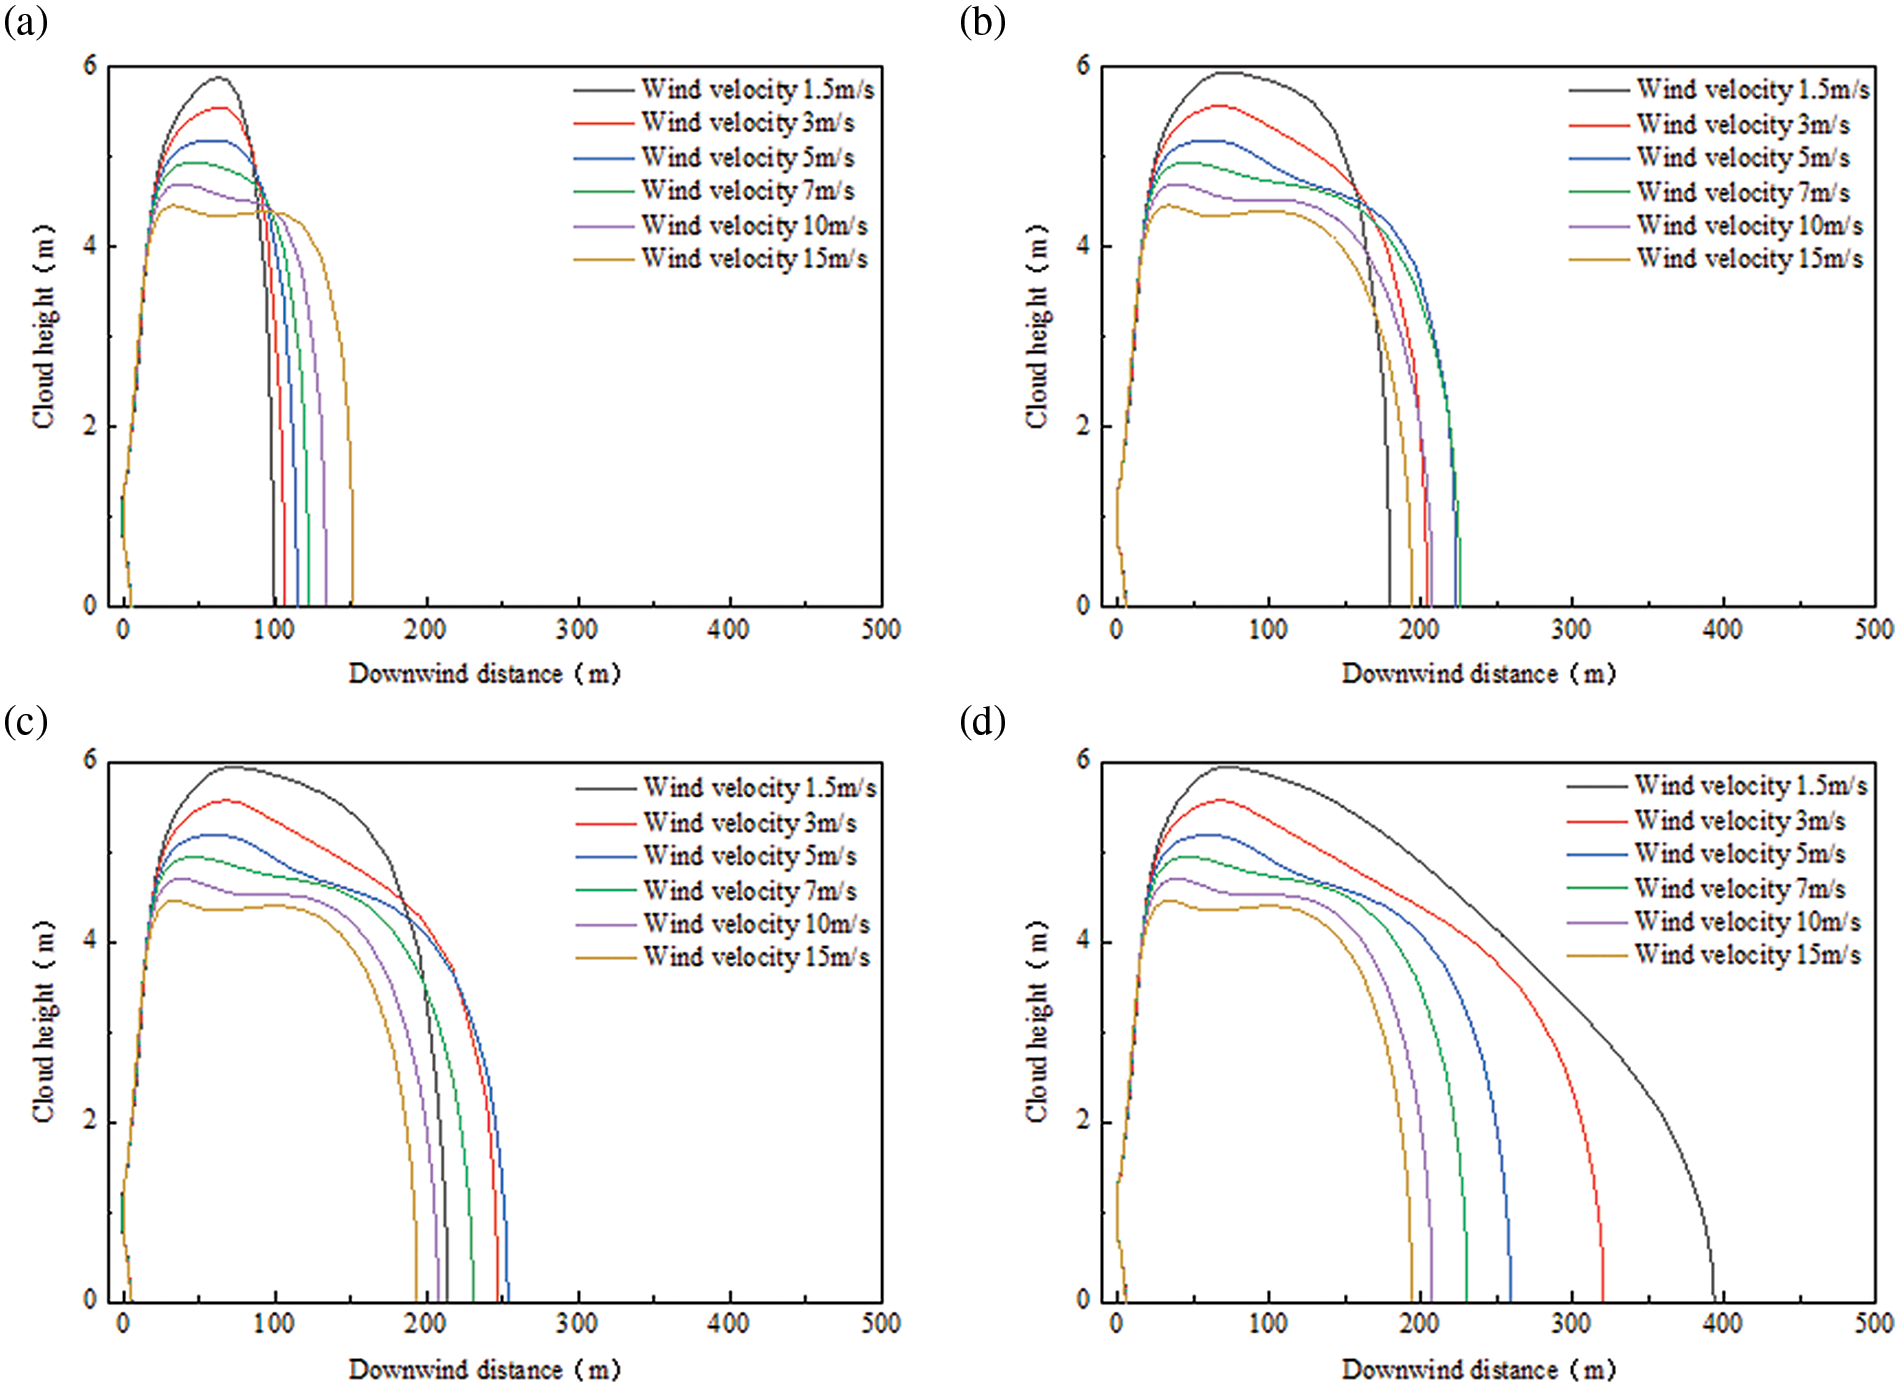
Figure 3: Downwind distance vs. cloud height for different wind speed moments: (a) 10 s, (b) 36 s, (c) 54 s, and (d) 326 s
In general, higher wind speeds result in stronger horizontal movement of atmospheric air masses. This leads to increased rates of mass and heat transfer between air masses and CO2 clouds, particularly in the downwind direction. Consequently, higher wind speeds promote the horizontal diffusion of CO2 clouds, resulting in larger diffusion distances. However, when the leakage intensity is low, the opposite pattern is observed in this case. When there is 20 mm of leakage, the downwind diffusion distance decreases as the wind speed increases. This is because when the leakage intensity is low, the diffusion concentration is easily influenced by turbulence. With higher wind speeds, CO2 clouds are more likely to experience turbulence during diffusion, which enhances the transfer of heat and mass to the surrounding atmosphere. This allows air to mix with CO2, accelerating the dilution of the CO2 concentration, as shown in Fig. 4.
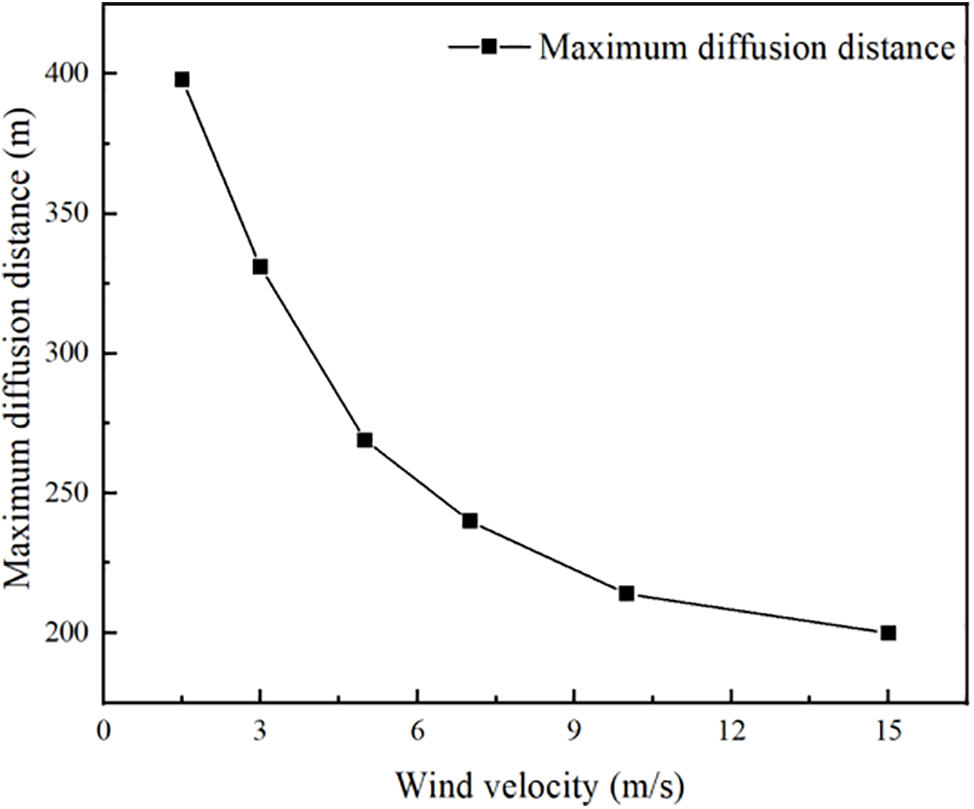
Figure 4: Different wind speeds and farthest spreading distances
(3) Surface roughness
The movement of air masses is primarily influenced by the air pressure gradient force and geostrophic bias force. The near-surface atmosphere is also affected by obstacles on the ground, and the near-surface layer is called the friction layer in meteorology. In the friction layer, the surface roughness causes the air mass to lose kinetic energy as it diffuses and collides with surface objects. As the air mass approaches the ground, the amount of kinetic energy lost increases, while it decreases as the air mass moves farther from the surface. This results in higher wind speeds. At heights a few hundred meters from the surface, this phenomenon can be well characterized by the exponential law.
The specified surface roughness values were as follows: land-183 mm, crops-25 cm, bushes-50 cm, forest-1 m, and urban-3 m. A sensitivity analysis was conducted to determine the regularity of the downwind diffusion distance, lateral diffusion distance, maximum coverage area, and farthest diffusion distance. The findings are presented in Fig. 5.
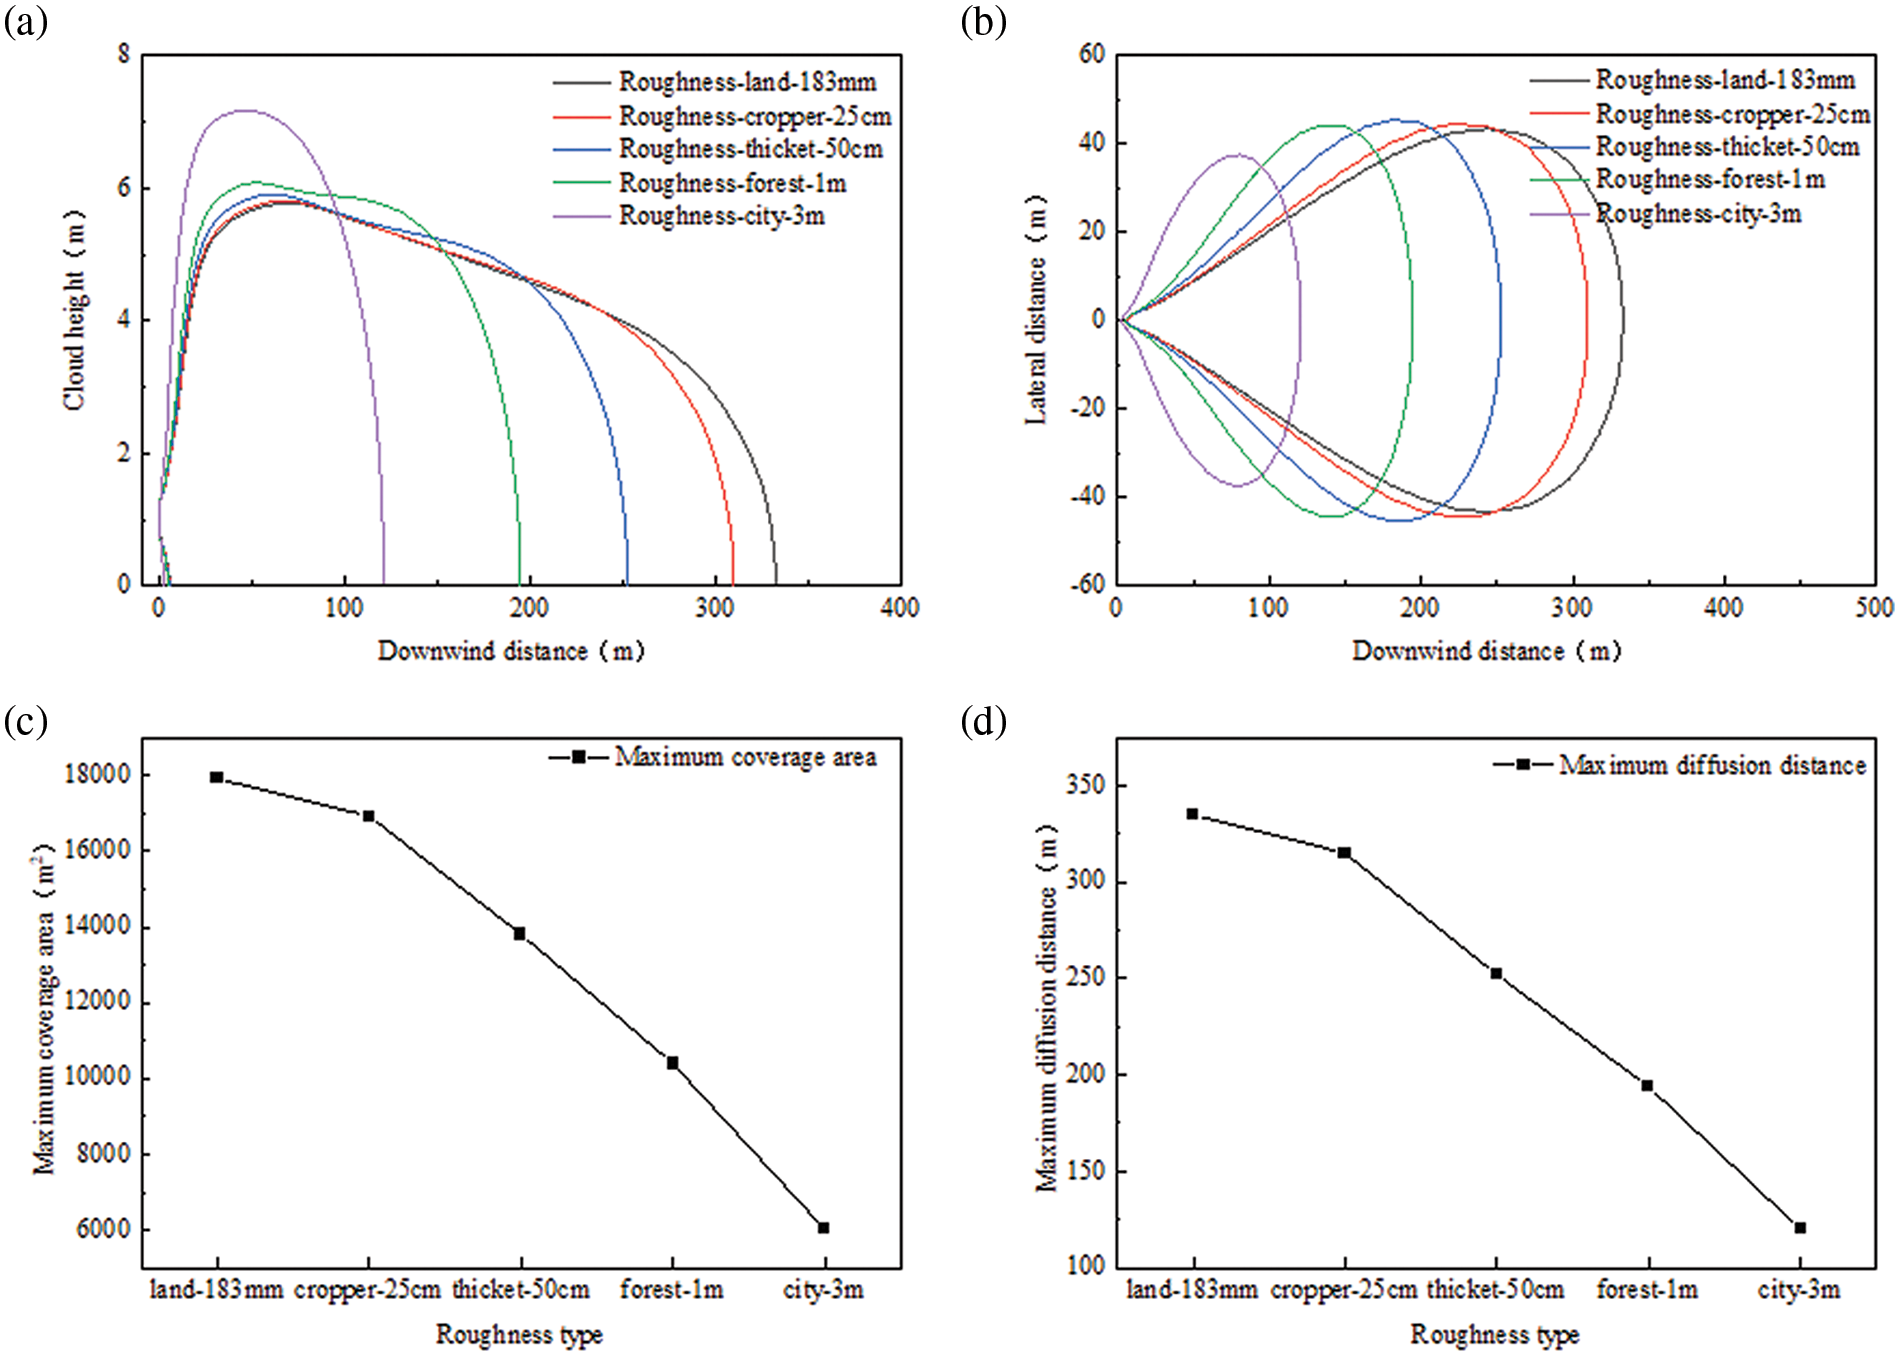
Figure 5: Diffusion patterns at different surface roughnesses: (a) downwind diffusion distance, (b) lateral diffusion distance, (c) maximum area covered, and (d) farthest diffusion distance
When gas clouds spread out, they lose kinetic energy due to colliding with barriers on the surface. This causes the gas clouds to disperse, which in turn impacts how CO2 spreads out. The downwind diffusion distance and the maximum area covered by dispersed clouds are greatly impacted, decreasing by approximately two-thirds as the roughness type changes from land (183 mm) to the city (3 m). However, the width and height of the clouds are only marginally affected. The distribution of diffusion in the vertical direction is influenced by surface roughness, perhaps because the motion direction of gas molecules changes when they clash with the rough surface. As the surface roughness decreases, the dilution effect in the lateral wind direction increases, resulting in a smaller minimum concentration, a wider maximum diffusion cloud width, and a longer diffusion distance.
(4) Atmospheric temperature
The atmospheric temperature was set at −10°C, 0°C, 10°C, 20°C, 30°C, 40°C, or 50°C to conduct a sensitivity analysis. The objective was to determine the regularity of the downwind diffusion distance, lateral diffusion distance, maximum coverage area, and farthest diffusion distance. The results of this analysis are presented in Fig. 6.
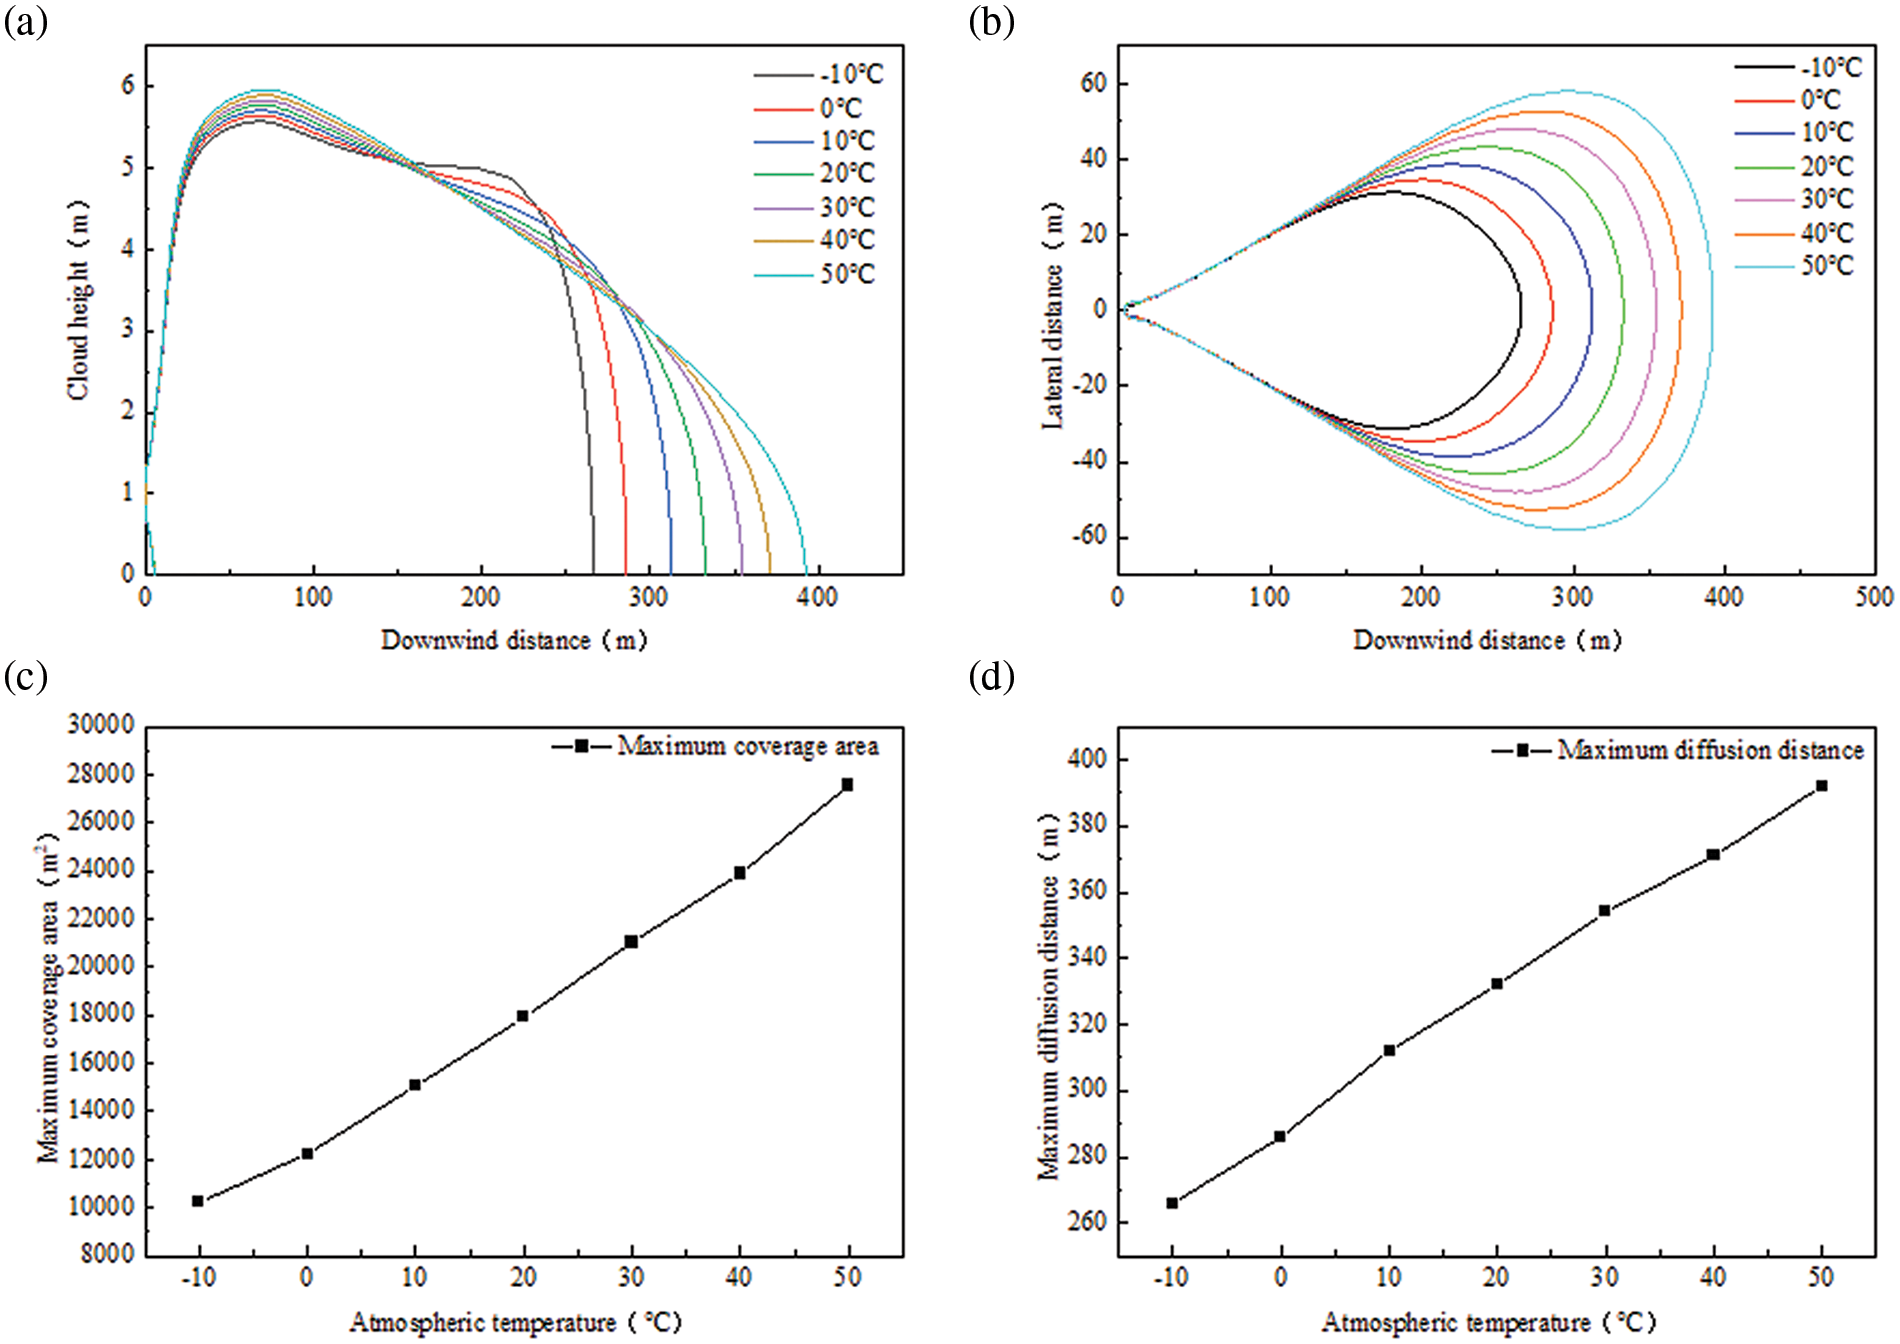
Figure 6: Diffusion patterns at different atmospheric temperatures: (a) downwind diffusion distance, (b) lateral diffusion distance, (c) maximum area covered, and (d) farthest diffusion distance
As the atmospheric temperature increases, the thermal motion between gas molecules becomes more intense. This leads to an increase in the distance between gas molecules, resulting in a decrease in density. In the case of CO2 gas molecules in a cloud, the horizontal direction is more affected than the vertical direction. This is because the atmospheric temperature does not vary significantly, making the effect of density in the vertical direction negligible. However, as a result of the erratic movement of the gas, the maximum distance for diffusion at 50°C is three times greater than that at −10°C. This is seen in the expansion of both the width and height of the diffusion cloud as the air temperature increases. The overall influence follows a linear growth pattern.
3.2 Influence of Leakage Parameters
The leakage parameters include leakage pressure, leakage temperature, leakage caliber, and leakage angle.
(1) Leakage pressure
Leakage pressure is a crucial indicator of the working conditions for leakage, and all other factors being equal primarily influence the spread of leakage by altering the intensity of the leakage source.
To calculate the intensity of the leakage source, the following assumptions are made: (1) The model represents flow in only one dimension. (2) The flow is isentropic when released and adiabatic when flowing through pipes. (3) The gas exhibits ideal gas behavior. The air compression factor is incorporated into the ideal gas equation of state to reduce the discrepancy between the theoretical and actual behavior of gases.
The energy and momentum equations are used to analyze the adiabatic flow through the pipe, resulting in the following equations:
where k is the gas adiabatic index; M is the molar mass of gas; G is the gas flow rate; λ is the coefficient of friction; R is a function of wall roughness and the Reynolds number; Xe is the effective length of the pipe; D is the pipe diameter.
Combining this with the continuity equation yields:
where C0 is the empirical flow coefficient, which is normally equal to 1 and only varies if there are special conditions at the leakage port. By simplification, it can be concluded that:
According to the equation, the source strength is directly correlated with the pressure in the pipe. Additionally, when the leakage pressure is elevated, a greater amount of CO2 gas escapes from the leaking port.
The leakage pressures were set at 10, 11, 12, 13, 14, and 15 MPa to conduct a sensitivity analysis. The objective was to determine the regularity of the downwind diffusion distance, lateral diffusion distance, maximum coverage area, and farthest diffusion distance. The results of this analysis are shown in Fig. 7.
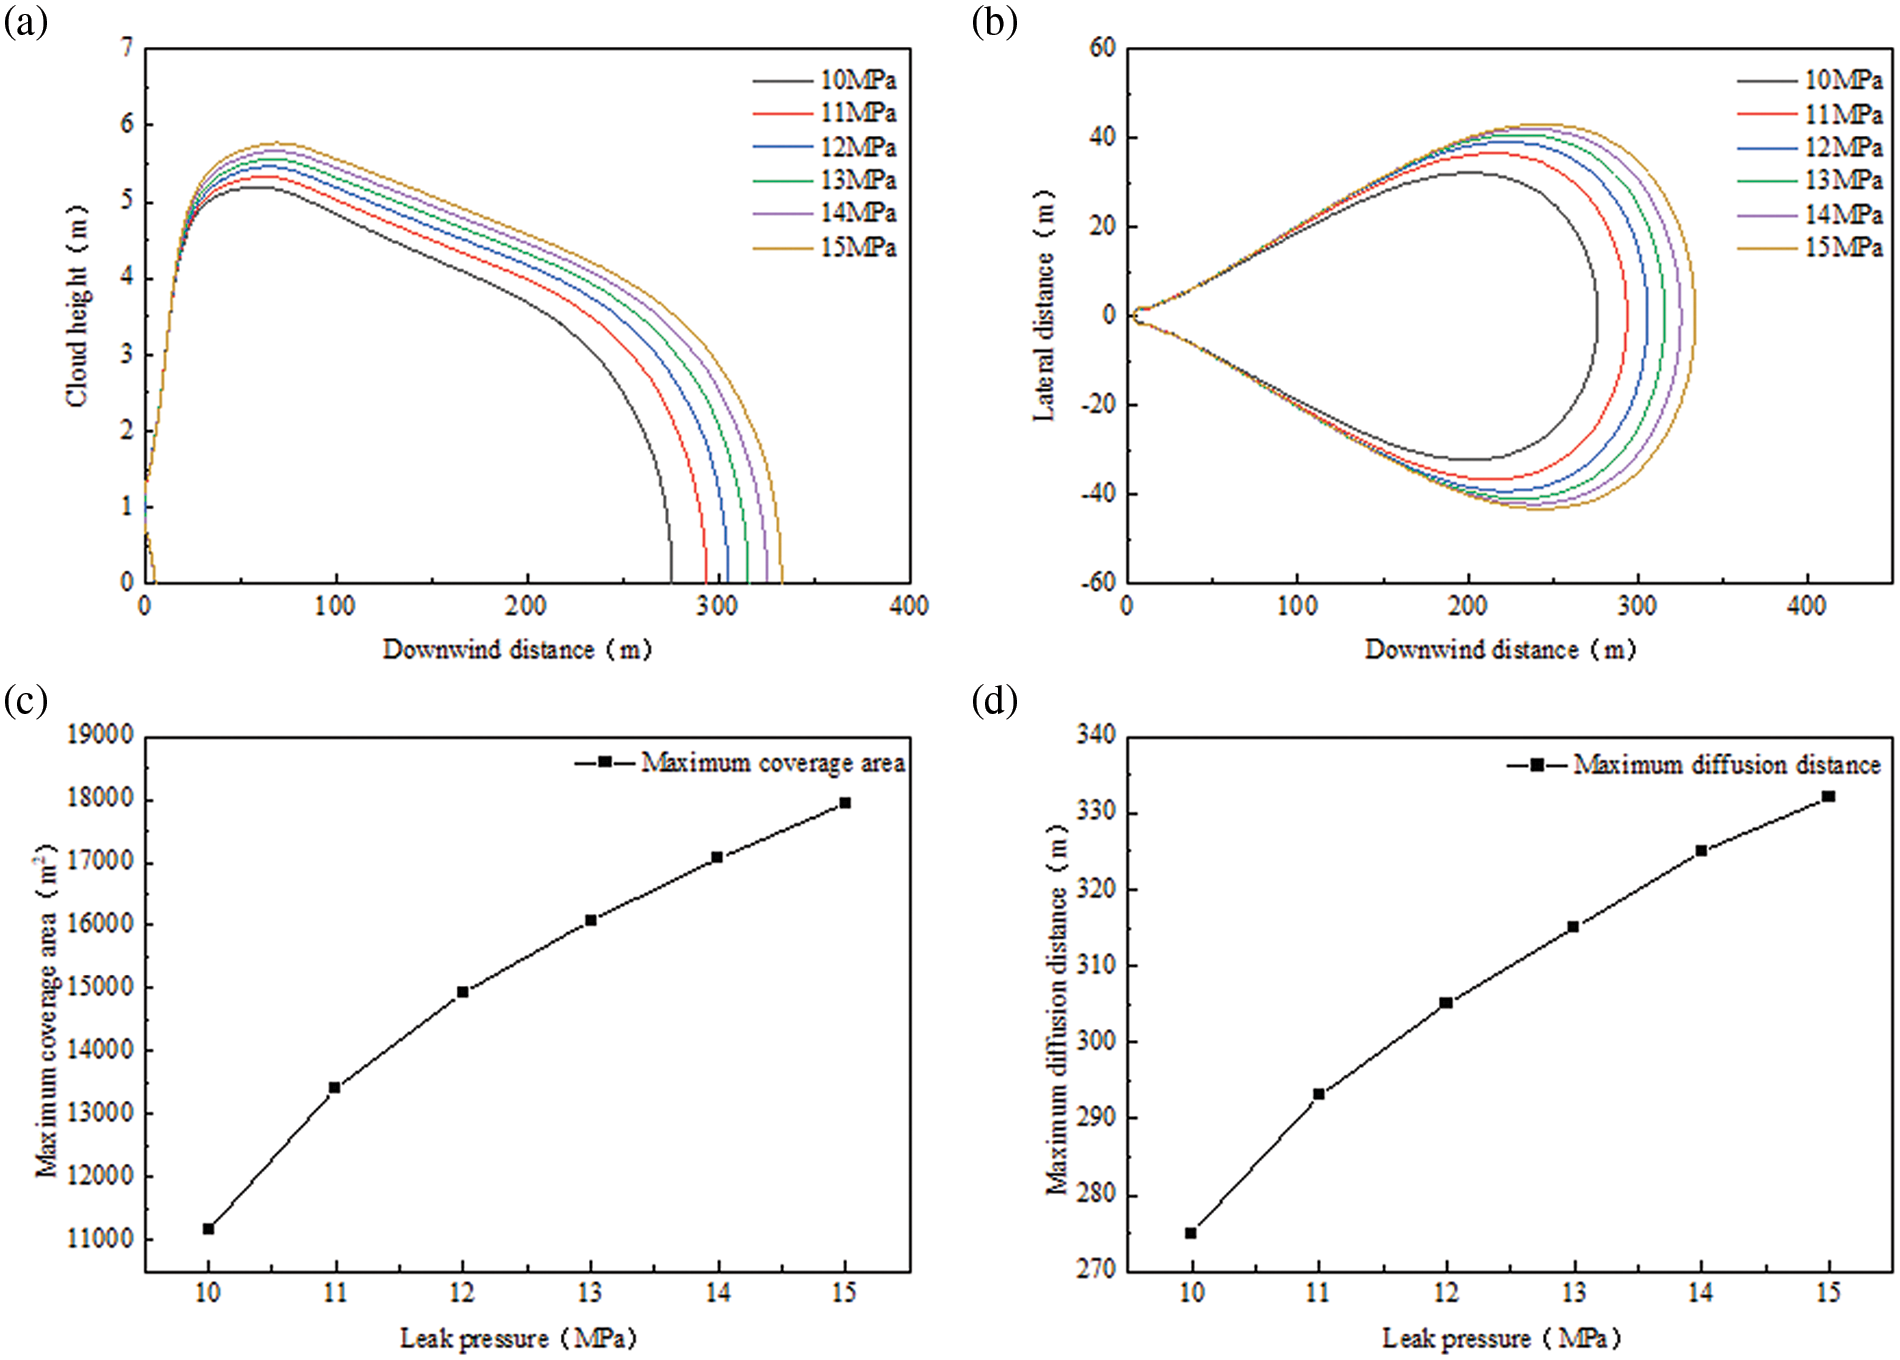
Figure 7: Diffusion patterns at different leakage pressures: (a) downwind diffusion distance, (b) lateral diffusion distance, (c) maximum coverage area, and (d) farthest diffusion distance
As the leakage pressure increases, so does the initial kinetic energy of the leakage port, resulting in a greater distance traveled by the CO2 gas cloud within the same time frame. As depicted in Fig. 7, the leakage pressure has a minimal impact on the height of the CO2 cloud. However, it has a substantial effect on the distance the cloud diffuses in the downwind direction, approximately 1.2 times. Additionally, the maximum area covered by clouds near the ground increases from 11,151 to 17,941 m2. The leakage pressure also significantly influences the lateral diffusion of CO2 clouds.
(2) Leakage temperature
The leakage temperatures were set at 10°C, 20°C, 30°C, 40°C, 50°C, and 60°C to conduct a sensitivity analysis. The objective was to determine the regularity of the downwind diffusion distance, lateral diffusion distance, maximum coverage area, and farthest diffusion distance. The results of this analysis are shown in Fig. 8.
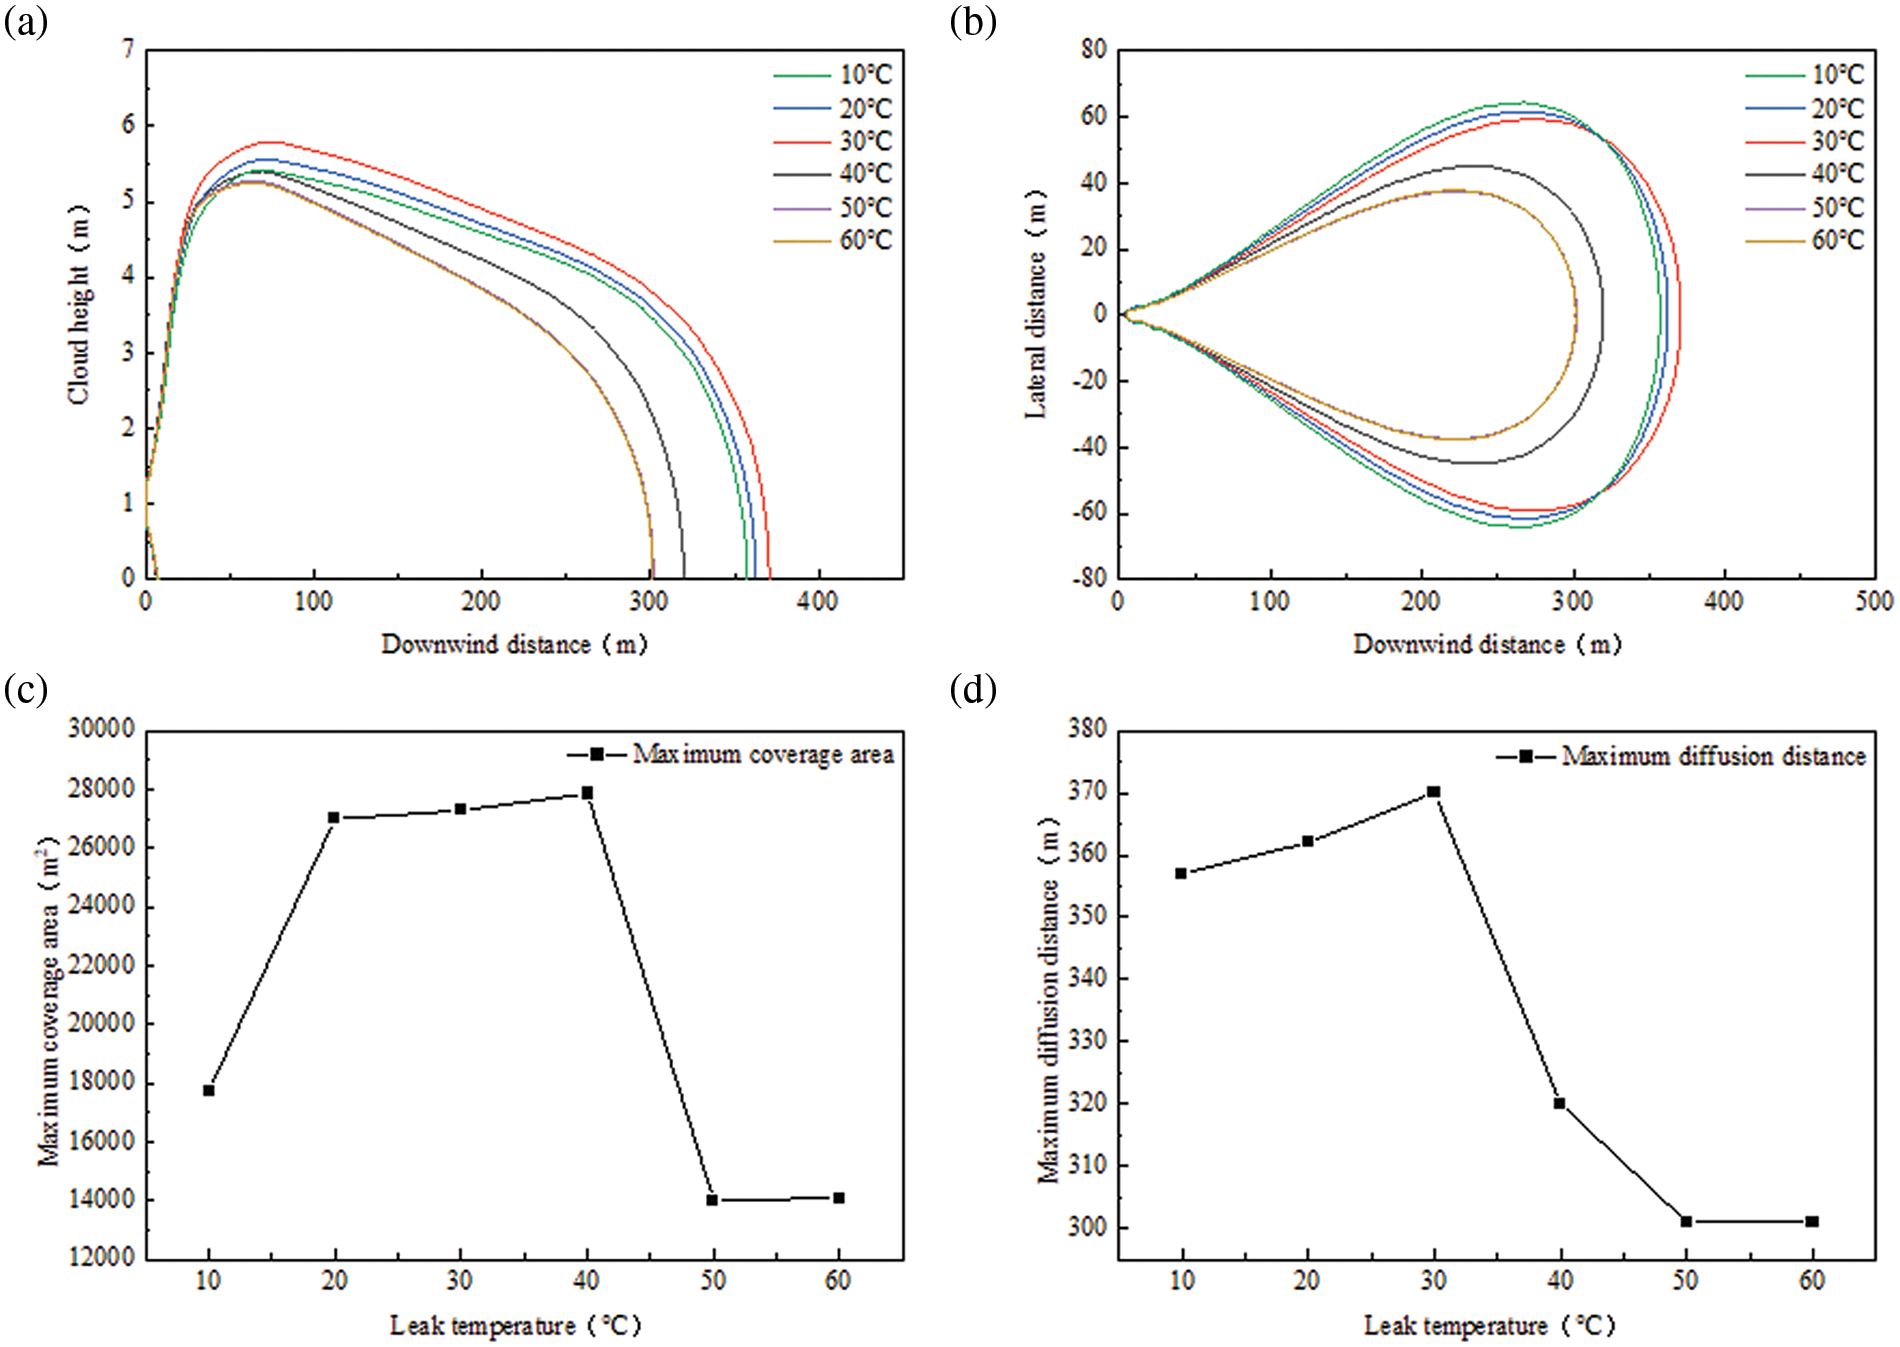
Figure 8: Diffusion patterns at different leakage temperatures: (a) downwind diffusion distance, (b) lateral diffusion distance, (c) maximum coverage area, and (d) farthest diffusion distance
Under different atmospheric temperature conditions, the irregular thermal movement between gas molecules becomes more intense as the temperature increases. However, when CO2 is subjected to a pressure of 15 MPa and a temperature below 31.1°C, it transitions from a supercritical state to a dense phase state. During this transformation process, the physical properties of carbon dioxide, such as density, viscosity, specific heat capacity and thermal conductivity, undergo significant changes, as shown in Fig. 9.
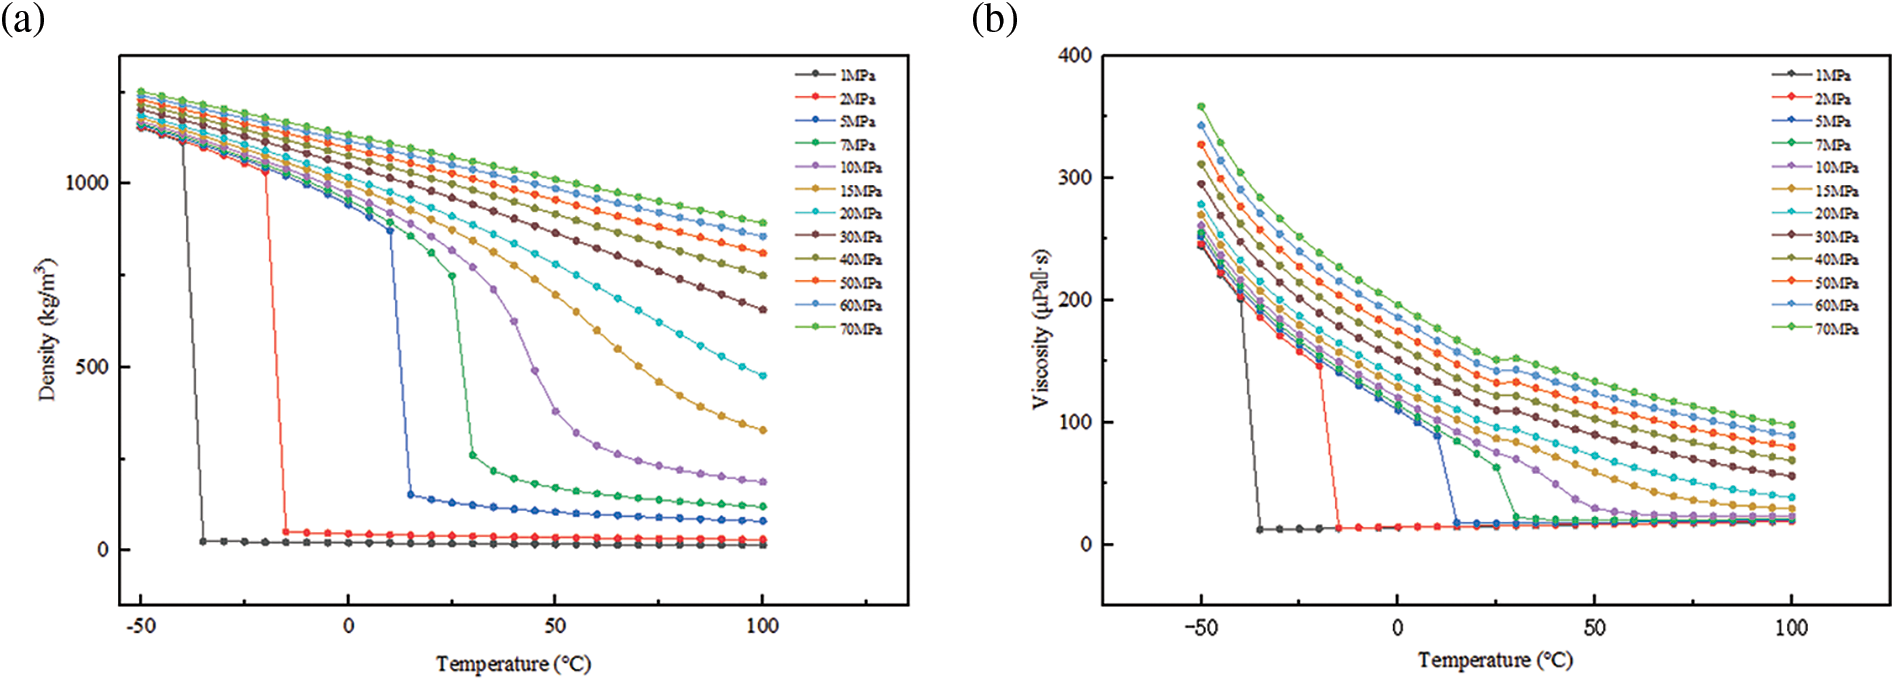
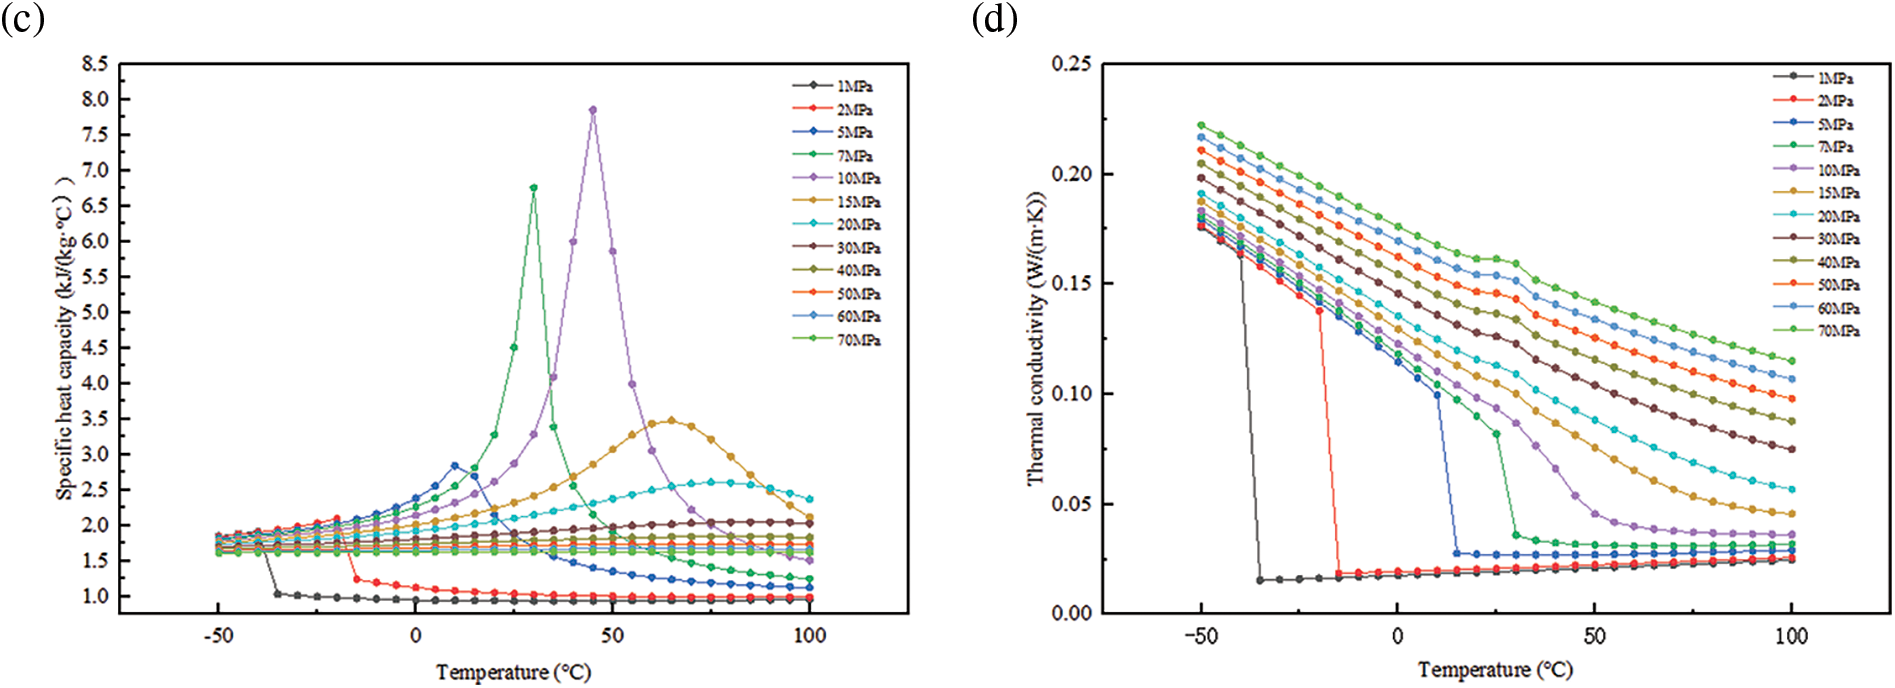
Figure 9: Physical properties of carbon dioxide at different temperature pressures: (a) density, (b) viscosity, (c) specific heat capacity, (d) thermal conductivity
When the temperature of CO2 is below its critical point, it exists in a dense phase with high density. Leakage can lead to a boiling liquid expanding vapor explosion (BLEVE). The small droplets expelled from the leak port disperse in the air and undergo a phase transition from liquid to gas, absorbing heat in the process. This leads to the formation of a large and wide cloud of droplets. When the temperature increases, the physical properties of CO2 undergo significant changes as it approaches its critical point. The viscosity decreases while the specific heat increases, which enhances the diffusion of clouds in the atmosphere.
(3) Leakage caliber
The leakage apertures were set at 5, 10, 15, 20, 25 and 30 mm to conduct a sensitivity analysis. The objective was to determine the regularity of the downwind diffusion distance, lateral diffusion distance, maximum coverage area, and farthest diffusion distance. The results of this analysis are shown in Fig. 10.
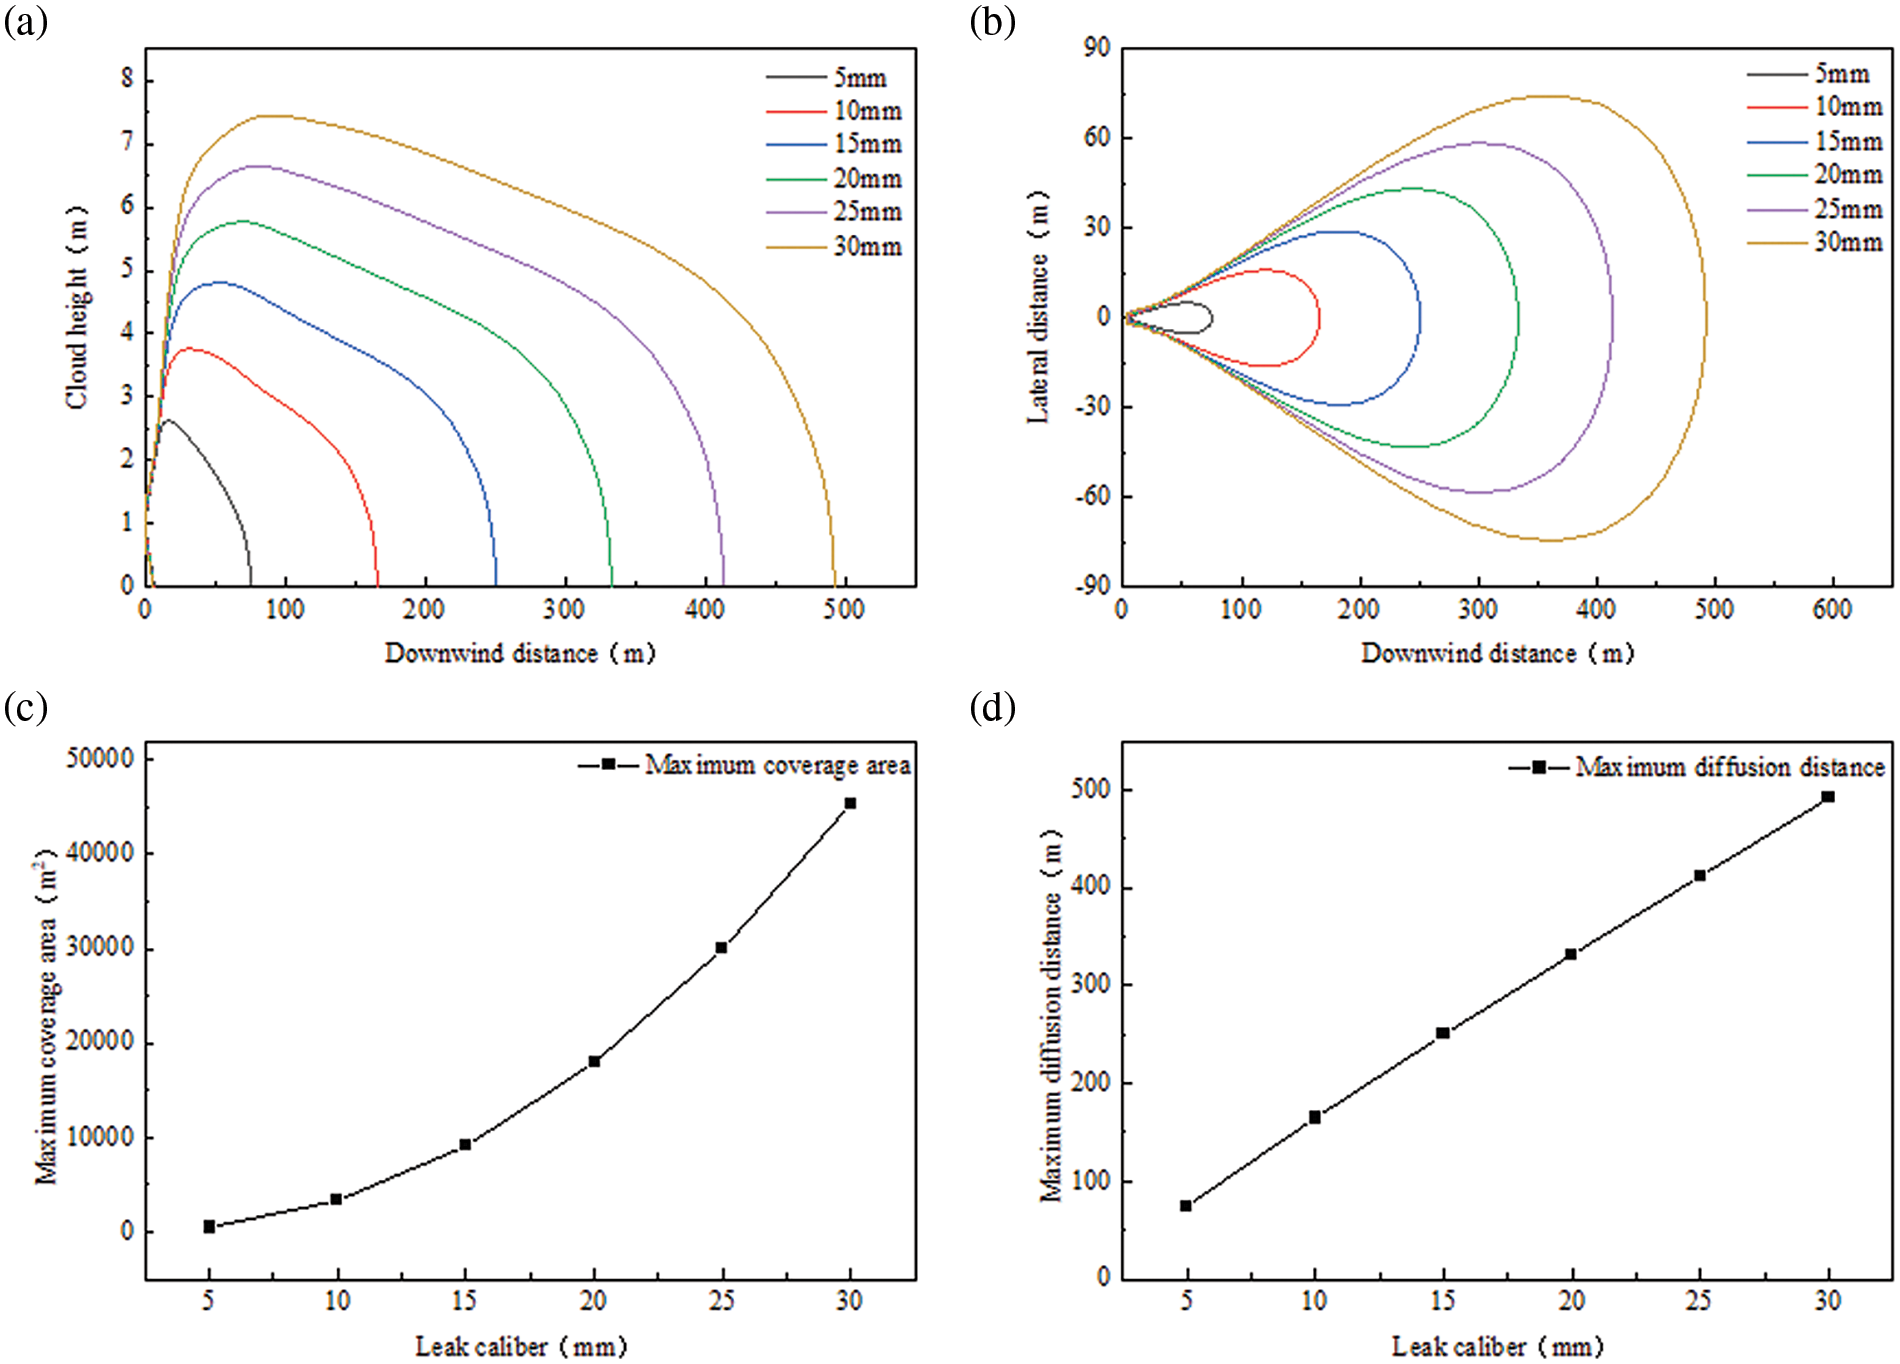
Figure 10: Dispersion patterns at different leakage apertures: (a) downwind dispersion distance, (b) lateral dispersion distance, (c) maximum coverage area, and (d) farthest dispersion distance
The primary impact of varying leakage apertures on diffusion depends on the leakage intensity. Assuming that all else remains constant, the size of the leak aperture directly affects the strength of the pipe leak source. A larger aperture results in more CO2 being released over the same time period, and the distance over which the gas diffuses downwind increases, as does the lateral spread of the diffusion. Furthermore, there is a linear increase in the area affected on the ground, and the farthest distance is downwind. The size and shape of the leak aperture vary in real-world situations. Under actual leakage conditions, the shape of the leakage aperture is mostly simplified to correct the leakage source strength estimate.
(4) Leakage angle
The leakage angle was set at 0°, 30°, 45°, 60°, and 90° to conduct a sensitivity analysis. The objective was to determine the regularity of the downwind diffusion distance, maximum coverage area, and farthest diffusion distance. The results of this analysis are shown in Fig. 11.
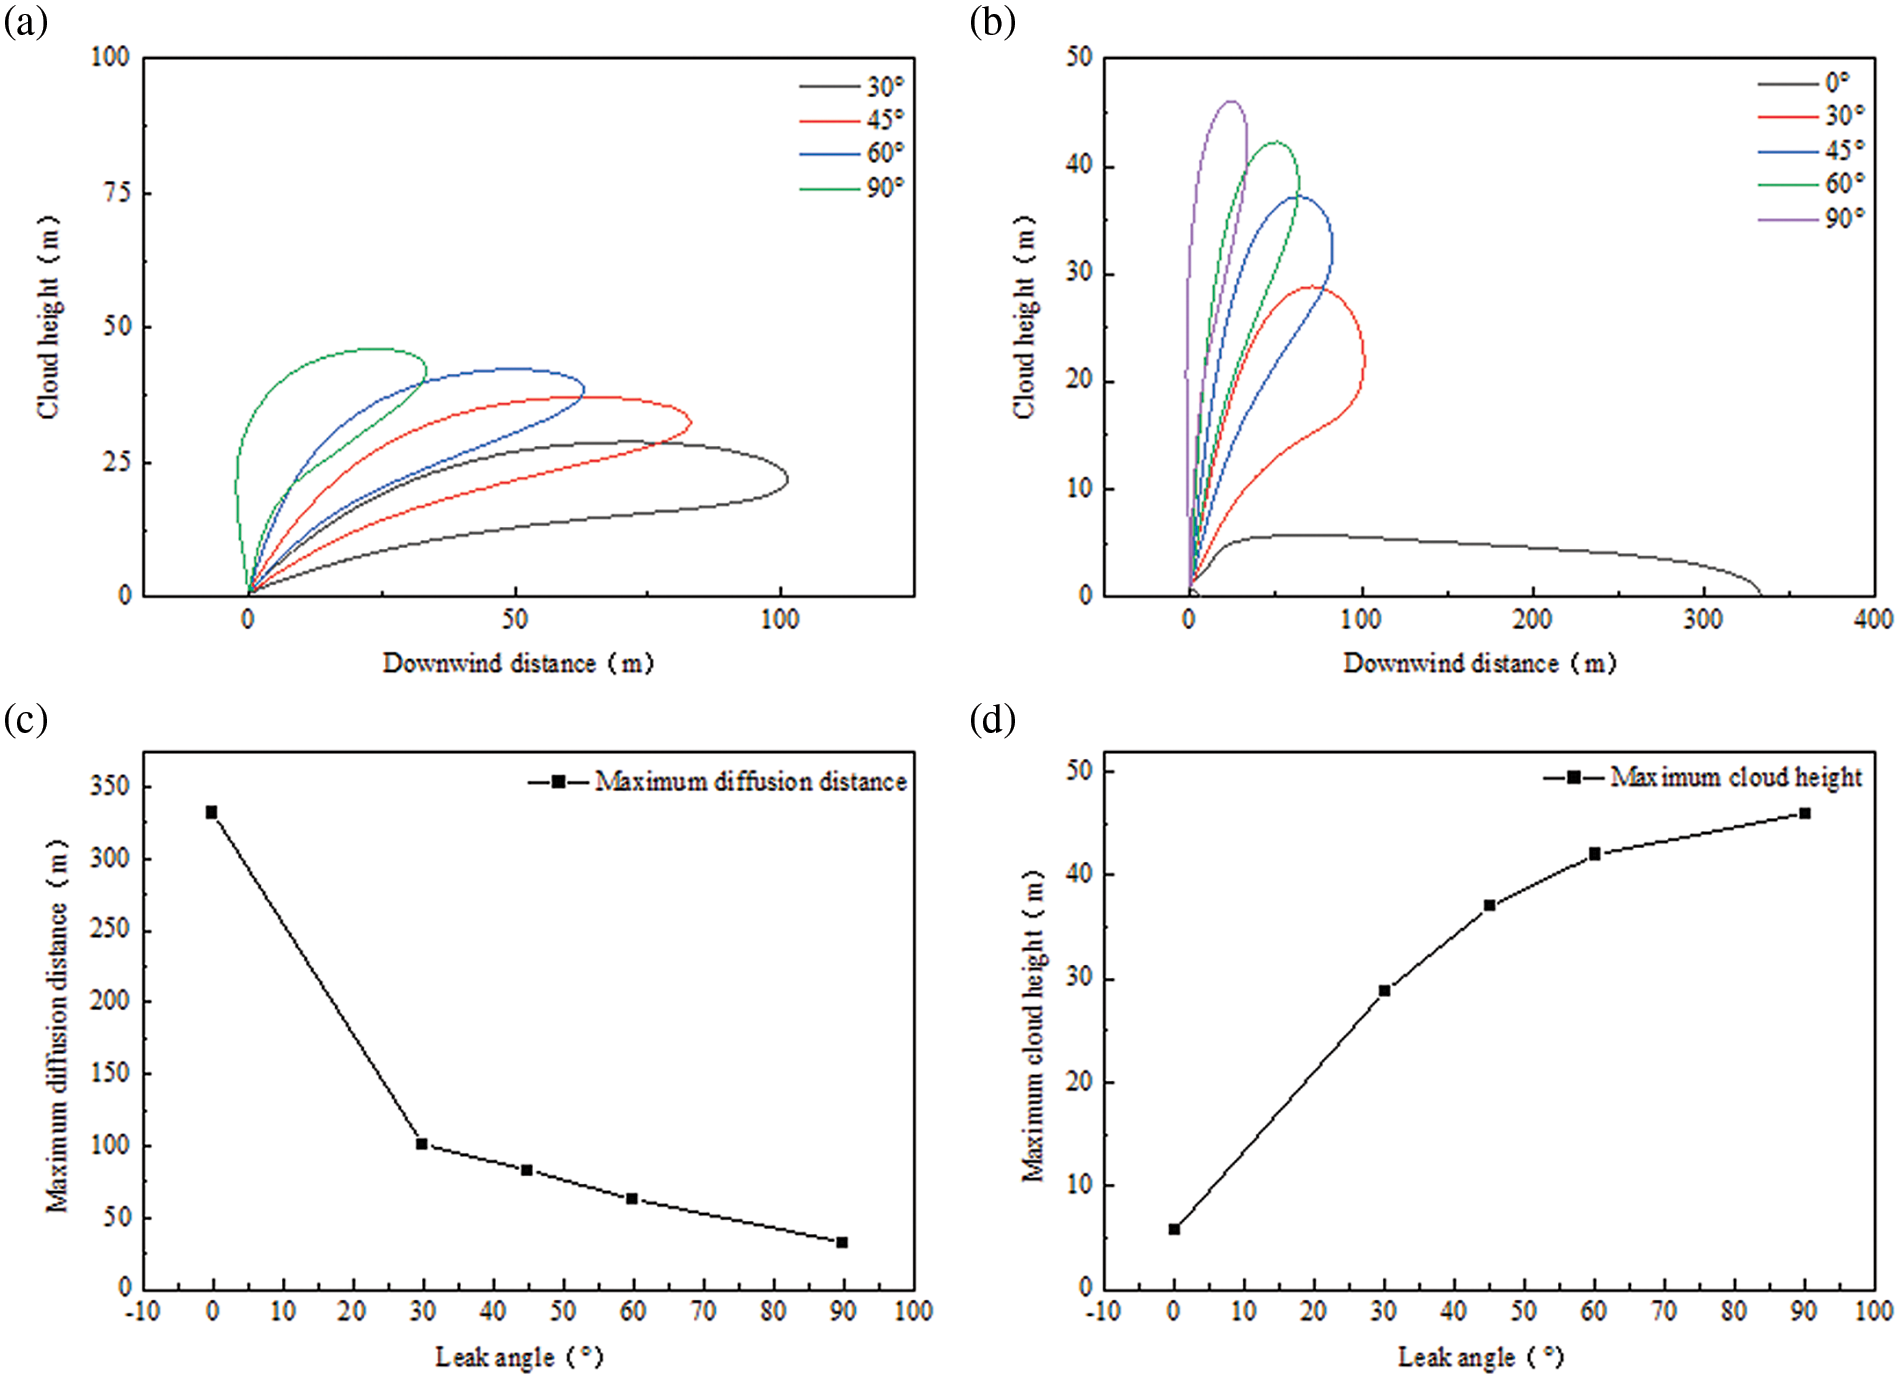
Figure 11: Diffusion patterns at different leakage angles: (a) downwind diffusion distance (orthogonal coordinate system), (b) downwind diffusion distance (right-angled coordinate system), (c) maximum coverage area, and (d) farthest diffusion distance
Perpendicular leakage to the ground is similar to leakage at an angle. However, due to differences in the angles, the initial jet possesses a velocity component in the horizontal direction. When the angle changes from 90° to 0°, the CO2’s velocity component in the horizontal direction reaches its maximum value. Consequently, it disperses in the downwind direction due to the influence of the wind. As the leakage angle increases, the cloud’s maximum height increases, but the distance it diffuses downwind decreases.
3.3 Influence of Impurities in the Gas Supply
Using HYSYS software, the CO2 phases at different CH4 contents were analyzed separately and the P-T diagrams were plotted as shown in Fig. 12.
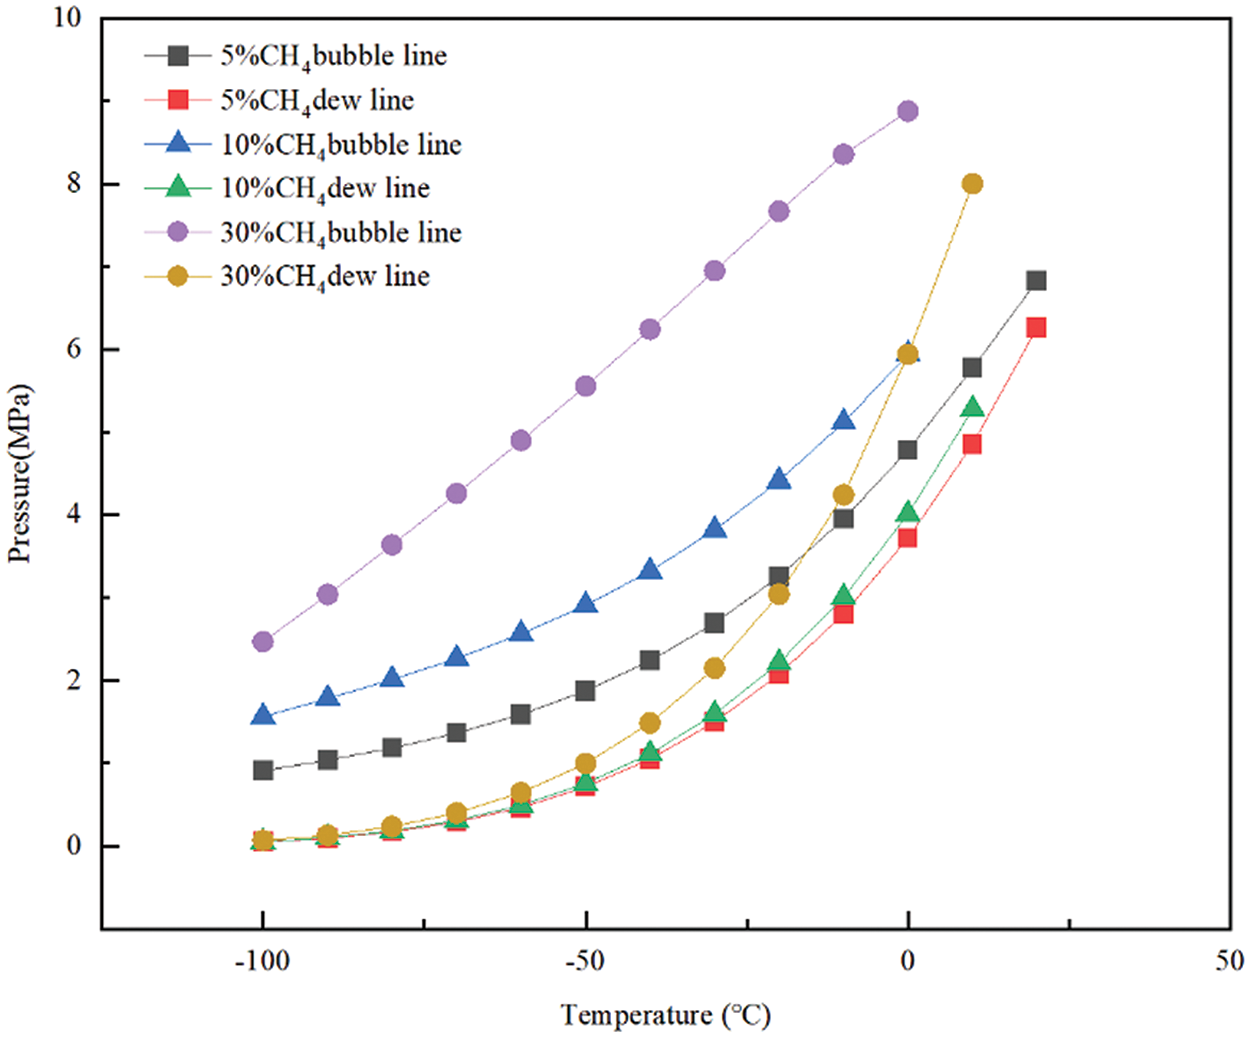
Figure 12: Phase states of CO2 with different CH4 content
Fig. 12 illustrates that as the CH4 impurity content increases, both the bubble point line and dew point line of the phase envelope shift upwards. However, the bubble point line exhibits a greater upward movement compared to the dew point line. Additionally, the critical pressure increases while the critical temperature decreases. These effects are more pronounced at higher impurity content, while they are relatively insignificant at lower content. Furthermore, the gas-liquid two-phase region expands.
The CO2 phase states at different N2 contents were analyzed separately and the P-T diagrams were plotted as Fig. 13.
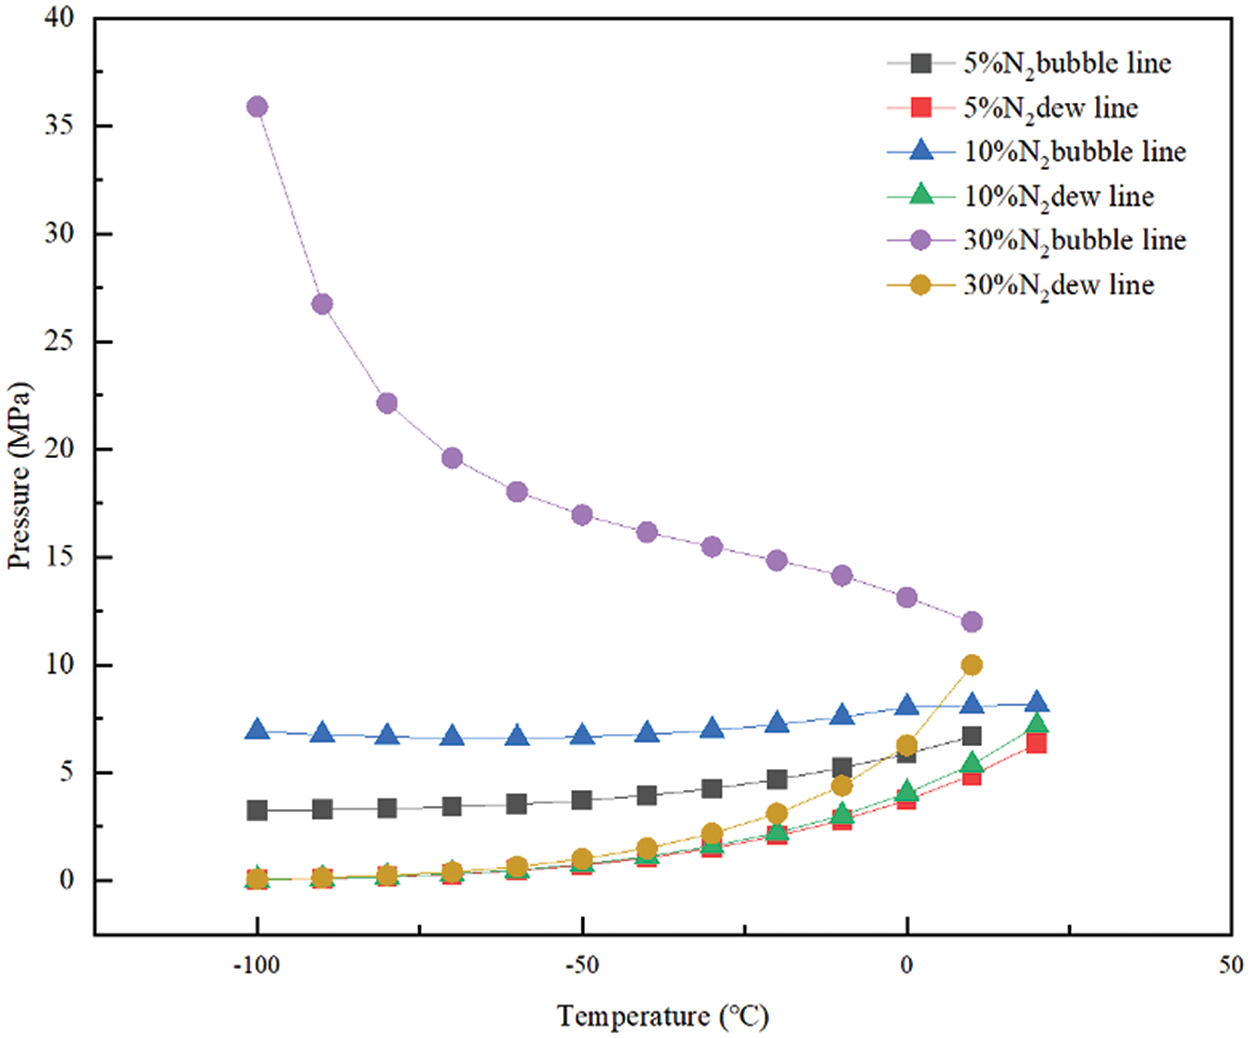
Figure 13: Phase states of CO2 with different N2 content
Fig. 13 illustrates that as the N2 impurity content increases, both the bubble point line and dew point line of the phase envelope shift upwards. Specifically, the bubble point line undergoes a significant change at a content of 30%, resulting in an increase in critical pressure and a decrease in critical temperature. This effect is more pronounced at higher impurity content and less significant at lower content. Additionally, the gas-liquid two-phase region expands.
The diffusion simulation study was conducted using the base parameters specified in Table 1. The selected impurities were CH4 and N2, ranging from 5% to 30%.
Fig. 14 illustrates that different contaminants have a diminished impact on the process of diffusion. CH4 diffuses farther from N2 in the furthest downwind diffusion range, which could be attributed to the distinct impurity types. CH4 has a lower molecular weight than N2, so when the starting kinetic energy is equal, substances with lower molecular weights diffuse over longer distances. In the top view, the cloud containing CH4 impurities appears to be elongated in comparison to the cloud containing N2 impurities.
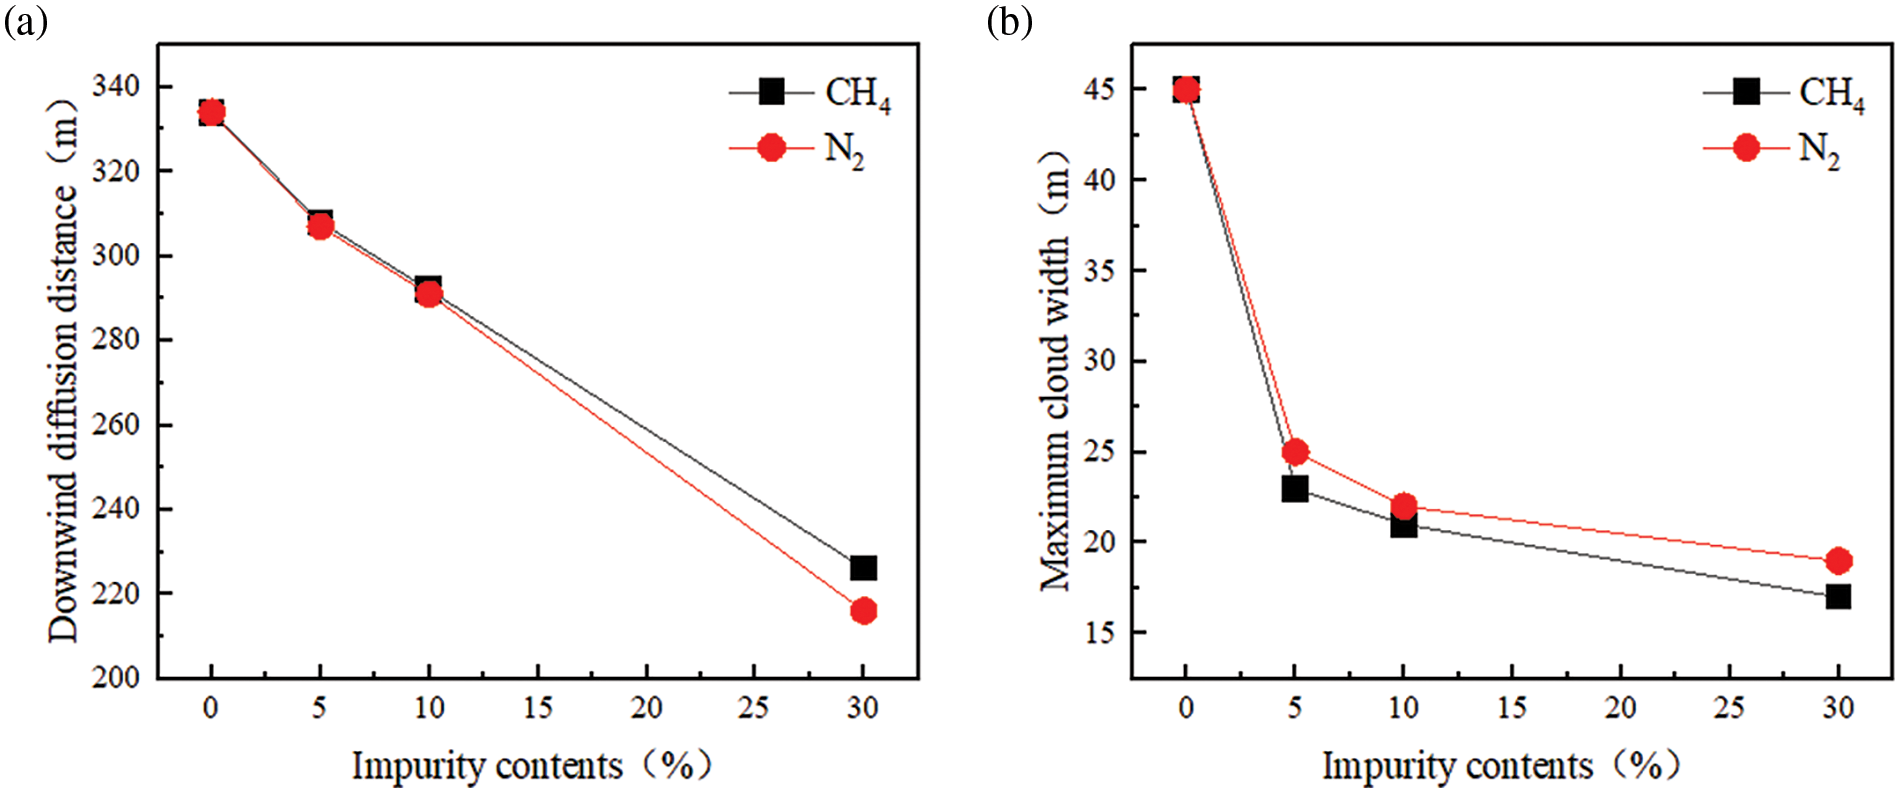
Figure 14: Diffusion patterns with different impurities: (a) downwind diffusion distance and (b) maximum cloud width
Fig. 15 illustrates that, regarding the maximum width and location of cloud occurrence, both impurities exhibit similar overall trends. As the impurity content increases, the maximum cloud width also increases. Specifically, the width of CH4 increases more significantly than that of N2. In addition, the occurrence location corresponding to the maximum cloud width moves closer to the leakage port as the impurity content increases.
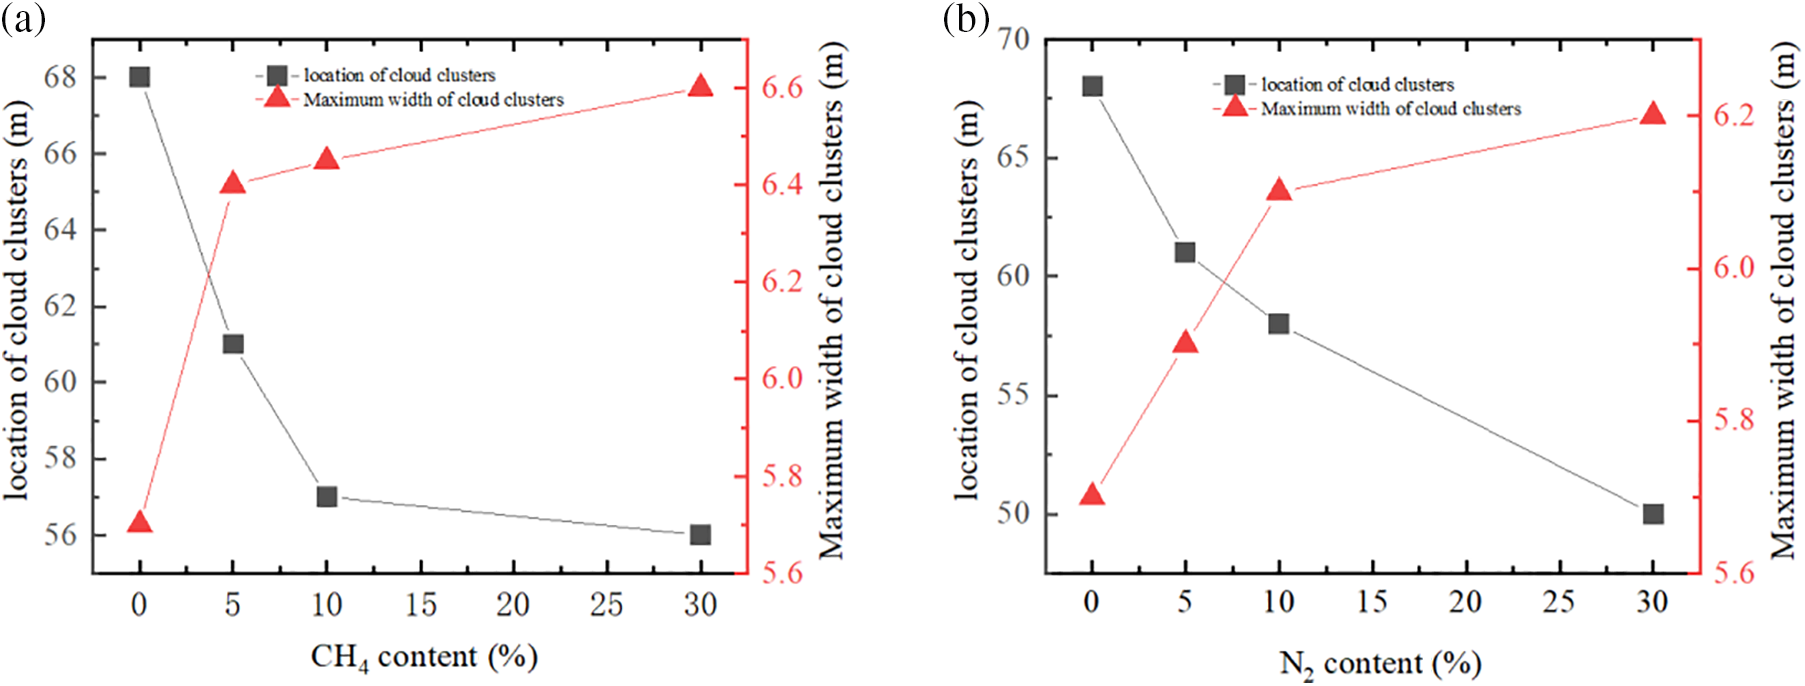
Figure 15: Maximum width of the cloud and position of occurrence for different impurities: (a) CH4, (b) N2
This study uses the UDM model in PHAST software to examine the leakage diffusion characteristics of a supercritical carbon dioxide pipeline. It focuses on analyzing two important aspects of the primary components that influence the atmospheric environment and leakage parameters. The factors considered in the atmospheric environment are atmospheric stability, atmospheric temperature, wind speed, and surface roughness. The characteristics that affect leakage include leakage pressure, leakage temperature, leakage aperture, and leakage angle. The primary conclusions are as follows:
(1) The leakage diffusion characteristics of supercritical carbon dioxide pipelines are influenced primarily by two primary factors: the ambient environment and leakage parameters. Additionally, various contaminants from different gas sources have similar impacts.
(2) Elevated air temperatures, reduced wind speeds, decreased surface roughness, release temperatures slightly below critical temperatures, and large leakage apertures greatly facilitate the diffusion of supercritical carbon dioxide.
(3) Under atmospheric stable D conditions, supercritical carbon dioxide diffusion is most pervasive and dangerous.
(4) The initial leak angle can have a serious impact on the downwind dispersion of CO2. Under the same conditions, the furthest downwind distance for a leak angle of 0° is ten times greater than that for a leak angle of 90°.
Acknowledgement: Thanks to the Shandong Provincial Key Laboratory of Oil and Gas Storage and Transportation Safety for supporting this work.
Funding Statement: This work was supported by the Postdoctoral Applied Research Project of Qingdao (Grant No. qdyy20210020).
Author Contributions: The authors confirm contribution to the paper as follows: study conception and design: Yanbo Shao, Shan Zhao; data collection: Wei You; analysis and interpretation of results: Yanbo Shao, Xuewen Cao; draft manuscript preparation: Zilong Nan, Jiang Bian. All authors reviewed the results and approved the final version of the manuscript.
Availability of Data and Materials: The datasets generated during and/or analyzed during the current study are available from the corresponding author on reasonable request.
Ethics Approval: Not applicable.
Conflicts of Interest: The authors declare no conflicts of interest to report regarding the present study.
References
1. Cao H, Wang Z, Shi Y, Cao X, Cai W, Bian J. Enhancing carbon capture: exploring droplet wetting and gas condensation of carbon dioxide on nanostructured surfaces. J Clean Prod. 2024;454:142343. doi:10.1016/j.jclepro.2024.142343. [Google Scholar] [CrossRef]
2. Turetsky MR, Abbott BW, Jones MC, Walter Anthony K, Olefeldt D, Schuur EAG, et al. Permafrost collapse is accelerating carbon release. Nature. 2019;569(7754):32–4. doi:10.1038/d41586-019-01313-4. [Google Scholar] [PubMed] [CrossRef]
3. Brown M, Irish M, Steinberg D, Moss T, Cherney DP, Shultz T, et al. Representing carbon dioxide transport and storage network investments within power system planning models. Energies. 2024;17(15):3780. doi:10.3390/en17153780. [Google Scholar] [CrossRef]
4. Assi A, Federici S, Bilo F, Zacco A, Depero LE, Bontempi E. Increased sustainability of carbon dioxide mineral sequestration by a technology involving fly ash stabilization. Materials. 2019;12(17):2714. doi:10.3390/ma12172714. [Google Scholar] [PubMed] [CrossRef]
5. Núñez-López V, Gil-Egui R, Hosseini SA. Environmental and operational performance of CO2-EOR as a CCUS technology: a cranfield example with dynamic LCA considerations. Energies. 2019;12(3):448. doi:10.3390/en12030448. [Google Scholar] [CrossRef]
6. Zhang XM, Yin SQ, He JJ, Liu QQ, Li JP, Wang YM. Research progress on the influencing factors and enhancement mechanism of CH4/CO2 mixture separation process by hydrate-based technology: a review. Environ Prog Sustain Energy. 2024;43(1):e14323. doi:10.1002/ep.v43.1. [Google Scholar] [CrossRef]
7. Davoodi S, Al-Shargabi M, Wood DA, Rukavishnikov VS, Minaev KM. Review of technological progress in carbon dioxide capture, storage, and utilization. Gas Sci Eng. 2023;117:205070. doi:10.1016/j.jgsce.2023.205070. [Google Scholar] [CrossRef]
8. Maddali V, Tularam GA, Glynn P. Economic and time-sensitive issues surrounding CCS: a policy analysis. Environ Sci Technol. 2015;49(15):8959–68. doi:10.1021/acs.est.5b00839. [Google Scholar] [PubMed] [CrossRef]
9. Segura D, Cerepi A, Loisy C, Guelard J, Noirez S, Patrigeon C, et al. Physicochemical behavior and impact of CO2 and CH4 plumes during gas-rich water leakage in a shallow carbonate freshwater aquifer. Appl Geochem. 2024;172:106122. doi:10.1016/j.apgeochem.2024.106122. [Google Scholar] [CrossRef]
10. Wang Z, Wang J, Sun B. Improved equation of CO2 Joule-Thomson coefficient. J CO2 Util. 2017;19:296–307. doi:10.1016/j.jcou.2017.04.007. [Google Scholar] [CrossRef]
11. Adegboye MA, Karnik A, Fung WK. Numerical study of pipeline leak detection for gas-liquid stratified flow. J Nat Gas Sci Eng. 2021;94(11):104054. [Google Scholar]
12. Zandi E, Zandi AA, Emami M, Hassanpour M. Numerical study of gas leakage from a pipeline and its concentration evaluation based on modern and practical leak detection methods. J Loss Prev Process Ind. 2022;80:104890. doi:10.1016/j.jlp.2022.104890. [Google Scholar] [CrossRef]
13. Xing J, Liu Z, Huang P, Feng C, Zhou Y, Sun R, et al. CFD validation of scaling rules for reduced-scale field releases of carbon dioxide. Appl Energy. 2014;115:525–30. doi:10.1016/j.apenergy.2013.10.049. [Google Scholar] [CrossRef]
14. Liu X, Godbole A, Cheng L. Source strength and dispersion of CO2, releases from high-pressure pipelines: CFD model using real gas equation of state. Appl Energy. 2014;126:56–68. doi:10.1016/j.apenergy.2014.03.073. [Google Scholar] [CrossRef]
15. Schleder AM, Martins MR. Experimental data and CFD performance for CO2 cloud dispersion analysis. J Loss Prev Proc Ind. 2016;43:688–99. doi:10.1016/j.jlp.2016.03.027. [Google Scholar] [CrossRef]
16. Witlox HWM, Harper M, Oke A. Modelling of discharge and atmospheric dispersion for carbon dioxide releases. J Loss Prev Proc Ind. 2009;22(6):795–802. doi:10.1016/j.jlp.2009.08.007. [Google Scholar] [CrossRef]
17. Witlox HWM, Harper M, Oke A, Stene J. Phast validation of discharge and atmospheric dispersion for pressurised carbon dioxide releases. J Loss Prev Proc Ind. 2014;30:243–55. doi:10.1016/j.jlp.2013.10.006. [Google Scholar] [CrossRef]
18. Witlox HWM, Harper M, Oke A, Stene J. Validation of discharge and atmospheric dispersion for unpressurised and pressurised carbon dioxide releases. Proc Safety Environ Prot. 2014;92(1):3–16. doi:10.1016/j.psep.2013.08.002. [Google Scholar] [CrossRef]
19. Mcgillivray A, Wilday J. Comparison of risks from carbon dioxide and natural gas pipelines. In: HSE books. New York: McGraw-Hill; 2009. p. 16–7. [Google Scholar]
20. Wareing CJ, Fairweather M, Falle SAEG. Modeling punctures of buried high-pressure dense phase CO2, pipelines in CCS applications. Int J Greenhouse Gas Control. 2014;29:231–47. doi:10.1016/j.ijggc.2014.08.012. [Google Scholar] [CrossRef]
21. Wareing CJ, Fairweather M, Peakall J. Numerical modeling of particle-laden sonic CO2 jets with experimental validation. AIP Conf Proc. 2013;1558(1):98–102. [Google Scholar]
22. Koornneef J, Spruijt M, Molag M. Quantitative risk assessment of CO2, transport by pipelines—a review of uncertainties and their impacts. J Hazard Mater. 2010;177(1–3):12–27. [Google Scholar] [PubMed]
23. Nguyen THT, Ku H, Hwang JH. The multiphase flow simulations of CO2 plume and jet under the background current. KSCE J Civil Eng. 2016;20:2569–77. doi:10.1007/s12205-015-1375-z. [Google Scholar] [CrossRef]
24. Woolley RM, Fairweather M, Wareing CJ, Proust C, Hebrard J, Jamois D, et al. An integrated, multi-scale modelling approach for the simulation of multiphase dispersion from accidental CO2 pipeline releases in realistic terrain. Int J Greenhouse Gas Control. 2014;27:221–38. doi:10.1016/j.ijggc.2014.06.001. [Google Scholar] [CrossRef]
25. Hill TA, Fackrell JE, Dubal MR, Stiff SM. Understanding the consequences of CO2 leakage downstream of the capture plant. Energy Proc. 2011;4:2230–7. doi:10.1016/j.egypro.2011.02.111. [Google Scholar] [CrossRef]
26. Mazzoldi A, Hill T, Colls JJ. CFD and Gaussian atmospheric dispersion models: a comparison for leak from carbon dioxide transportation and storage facilities. Atmos Environ. 2008;42(34):8046–54. doi:10.1016/j.atmosenv.2008.06.038. [Google Scholar] [CrossRef]
27. Novotny A, Pokorny M. Continuity equation and vacuum regions in compressible flows. J Evol Equ. 2021;21(3):2891–922. doi:10.1007/s00028-021-00704-3. [Google Scholar] [CrossRef]
28. Nilsson B, Rozanova OS, Shelkovich VM. Mass, momentum and energy conservation laws in zero-pressure gas dynamics and δ-shocks: II. Appl Anal. 2011;90(5):831–42. doi:10.1080/00036811.2010.524156. [Google Scholar] [CrossRef]
29. Peng DY, Robinson DB. New two-constant equation of state. Ind Eng Chem Fundam. 1976;15(1):3069–78. [Google Scholar]
30. Li XF. Dispersion of unintended subsonic and supersonic hydrogen releases from hydrogen storage systems (Ph.D. Thesis). Tsinghua University: China; 2015. [Google Scholar]
31. Hill RJ, Smith PA. Exposure assessment for carbon dioxide gas: full shift average and short-term measurement approaches. J Occup Environ Hyg. 2015;12(12):819–28. doi:10.1080/15459624.2015.1053894. [Google Scholar] [PubMed] [CrossRef]
32. Nakajima K, Yamanaka T, Ooka R, Kikumoto H, Sugawara H. Observational assessment of applicability of Pasquill stability class in urban areas for detection of neutrally stratified wind profiles. J Wind Eng Ind Aerodyn. 2020;206:104337. doi:10.1016/j.jweia.2020.104337. [Google Scholar] [CrossRef]
Cite This Article
 Copyright © 2024 The Author(s). Published by Tech Science Press.
This work is licensed under a Creative Commons Attribution 4.0 International License , which permits unrestricted use, distribution, and reproduction in any medium, provided the original work is properly cited.


 Submit a Paper
 Propose a Special lssue
 View Full Text
 Download PDF
 Downloads
 Citation Tools