 Open Access
ARTICLE
Numerical Study of the Efficiency of Multi-Layer Membrane Filtration in Desalination Processes
1 Bio-Geosciences and Materials Engineering Laboratory, Higher Normal School, Hassan II University, Casablanca, 50069, Morocco
2 Regional Center for Education and Training Professions, Settat, 26002, Morocco
3 Engineering Sciences for Energy Laboratory, ENSA, Chouaib Doukkali University, El Jadida, 24000, Morocco
* Corresponding Author: Salma Moushi. Email:
(This article belongs to the Special Issue: Materials and Energy an Updated Image for 2023)
Fluid Dynamics & Materials Processing 2024, 20(11), 2509-2521. https://doi.org/10.32604/fdmp.2024.053501
Received 01 May 2024; Accepted 17 July 2024; Issue published 28 October 2024
Abstract
Multi-layer membrane filtration is a widely used technology for separating and purifying different components of a liquid mixture. This technique involves passing the liquid mixture through a series of membranes with decreasing pore sizes, which allows for the separation of different components according to their molecular size. This study investigates the filtration process of a fluid through a two-dimensional porous medium designed for seawater desalination. The focus is on understanding the impact of various parameters such as the coefficient of friction, velocity, and the number of layers on filtration efficiency. The results reveal that the number of layers plays a crucial role in desalination, with an increase in layers leading to enhanced filtration quality, following a power law relationship. The study explores the influence of the coefficient of friction on filtration performance, emphasizing its significant effect on the number of particles filtered over time. Additionally, the role of the initial velocity in filtration efficiency is examined, showing distinct effects at both high and low velocities. Biofouling is identified as a factor influencing filtration, with an initial increase in filtered particles followed by a decline due to particle accumulation in pores.Keywords
The inability to acquire sufficient water for drinking is one of the biggest pressing issues of the 21st century. This serious problem worries people all over the world and attracts public attention. Water covers three-quarters of the Earth’s surface, but 98% of it is salt water, which cannot be directly used for domestic and industrial purposes [1]. The scarcity of clean water resources is becoming a severe issue in many countries as a consequence of the increase in worldwide populations and the growth of the industry. About 2 billion people live in a world with a limited supply of fresh water, based to statistics [2,3]. Millions of people die each year from diseases spread through contaminated water. Water problems are projected to get worse in the coming decades. Eliminating this looming problem will require extensive research to identify new and powerful water treatment methods with less cost and energy [4].
Desalination, an emerging technology to offset weakening freshwater resources, appears to be an economical source for meeting future freshwater demands. The technology offers a way to convert seawater into potable water, mitigating the impact of freshwater shortages. Seawater desalination technologies fall into two broad categories: thermal technologies like multi-effect distillation (MED), and vapor compression distillation (VCD), and membrane technologies like electrodialysis (ED) and reverse osmosis (RO) [5]. Membrane desalination uses pressure from an electric pump to separate membrane-based permeate from sterile water or surface water, whereas thermal desalination evaporates the permeate using heat [6]. Given the huge energy demand for seawater desalination, the thermal and electrical energy needed for a seawater desalination process vary according to the technique used [7,8].
Thermal desalination necessarily requires both heat energy and electricity, whereas membrane desalination mainly consumes electricity [9]. RO software, commonly used in membrane desalination, consumes between 3.5 and 5 kWh/m3 of energy.
Despite the potential of desalination, challenges persist, including high costs, environmental concerns, and energy dependence. However, ongoing developments in membrane technology show promise in addressing some of these challenges [10]. According to 2013 data, the global installed capacity for reverse osmosis (RO) was 65%, 21% for multi-stage flash distillation (MSF), and only 9% for multi-effect distillation (MED) [11]. Four membrane separation processes are popularly used in wastewater and water treatment, particularly microfiltration (MF), ultrafiltration (UF), nanofiltration (NF), reverse osmosis (RO), and direct osmosis (FO) [12]. Recent advancements have also explored the use of Janus graphene oxide (GO) channels with polarized surface charges as nanofiltration membranes. For instance, a study demonstrated that symmetric Janus GO channels, with their tunable geometry and charge polarity, significantly enhance water permeability and ion rejection, highlighting their potential for optimized desalination performance [13].
The membrane serves primarily as a filter that divides two distinct phases and restricts the selective transit of certain substances. A membrane can be homogeneous or heterogeneous, symmetric or asymmetric, liquid or solid; it can be negatively charged, positively charged, or neutral. Transmembrane transport can be affected by the diffusion or convection of individual molecules and by electrical or chemical gradients [14].
Reverse osmosis (RO) membrane separation can remove particles as small as a few Angstroms [15]. External pressure is used in an RO process to overcome natural osmotic pressure so that water can pass across an impermeable membrane from a seawater reservoir to a freshwater reservoir, leaving salts in the feed reservoir. As a result, this technique has been widely accepted as a viable and promising solution for supplying sustainable freshwater and addressing the water scarcity challenge [16,17]. Despite the fact that membranes for water treatment technologies are constantly being developed, there is still a need for improved membrane materials. To maximize the separation performance of the RO membrane, scientists and engineers must look for new, efficient materials.
Moreover, due to the high costs of experimenting and the disordered and complicated microstructures of porous media, fluid transport in porous media, particularly in membranes, is difficult to describe. Researchers have turned to digital simulation. Modeling saves a great deal of time and cash, and it allows you to do things that were previously unthinkable. It is used in all scientific disciplines, ranging from basic science to behavioral science, biology, and engineering science. Modeling the phenomenon of seawater desalination is an important method for investigating and comprehending the diffusion and nanofiltration of dirty water in porous media.
Yang et al. [18] has been hired as a monolayer (g-
In order to determine the effectiveness of the number of membrane layers on the amount of filtered particles, especially cations and anions of salts, we have used the stochastic Langevin method to investigate the desalination phenomenon. In this investigation, we propose to study the tangential fluid flow in a multilayer membrane filtration under external pressure and evaluate the behavior of the filtered particles as a function of many physical parameters, including the coefficient of friction, initial velocity, and number of layers. Thus, every result will be compared to the results obtained using the other model.
In this work, we investigated the filtration process of a fluid through a two-dimensional porous medium with a square shape of L × L (see Fig. 1) with L = 30 m. The porous medium consists of horizontally arranged membrane layers designed to capture salt particles, the distance between the layers is approximately 3 m and equidistant. The salt particles are considered to have a spherical geometry with a size smaller than that of the membrane pores. Each membrane layer is characterized by a random porosity ф and the same thickness e parameters. The fluid flow through the membrane is characterized by a tangential motion, emphasizing the significance of forces acting parallel to the membrane surface. The primary pressure force driving the flow is directed along the x-axis, contributing to the overall dynamics of the fluid and particle transport through the membrane layers.

Figure 1: (a) The multilayer membrane filtration system; (b) the filtered particles go through the membrane because of the external pressure
To accurately capture the complex interactions between the fluid and salt particles during the desalination process,we employed the Langevin dynamics Eq. (1), based on the fundamental principle of dynamics and Darcy’s law [21]. Applicable in several scientific and technical disciplines [22–26]. Instead of addressing each specific interaction between a Brownian particle and the surrounding bath particles, the model adopts a statistical approach to describe these interactions collectively. The force exerted by the bath on the Brownian particle is considered to consist of two components: a frictional force directly proportional to the velocity of the Brownian particle and a randomly fluctuating force that can only be discussed in terms of statistical probabilities. This model offers a more realistic simulation by treating the forces statistically. These forces are then incorporated into Newton’s equation of motion to derive the Langevin equation [27]. Generally, the flow of fluid in this medium is governed by a set of parameters, such as dynamic pressure and viscosity. In addition, there are other parameters that characterize the medium, such as permeability, flow form, etc.
In this study, the motion of particles within the fluid is random under the action of three forces (a frictional force, a pressure force, and a random force called the Langevin force). In the context of Newton’s second law, the Langevin equation is given by:
Here, m represents the mass of the diffusing particle, and v(t) denotes its velocity.
γ: the friction coefficient of fluid and
A relationship based on the fluctuation-dissipation theorem connects the frictional force and the stochastic effect, which is expressed by determining the variation of the fluid flow’s velocity in thermal equilibrium, like:
In which
To characterize the behavior of the fluid particles during the flow, we define the diffusion coefficient developed by Einstein’s relation [28]:
According to Darcy’s law, the particle velocity can be expressed as follows:
In a more general way, Darcy’s law can be written in vector form, taking gravity into account:
We have the following results from the projection of Darcy’s law for a two-dimensional system:
where
The resulting external force expression is:
Finally, the stochastic differential equation of Langevin is:
The solution to the differential equation is expressed in a general form as follows:
where A is a real constant a determined by the initial conditions
The expression of the distance function is obtained by integrating the expression of the velocity function:
After detailing the Langevin equation governing the dynamics of particles in our system, we turn our focus to the calculation of Nf, the number of particles filtered or captured by the interlayer, start by initializing Nf = 0. At each moment or time step, track the particle’s position relative to the interlayer. If a particle is close enough to the interlayer to be considered captured, increment Nf using the formula Nf = Nf + 1. This involves defining a capture condition, such as a distance threshold from the interlayer. Continuously check each particle’s position at every time step, updating Nf accordingly whenever a particle meets the capture condition. This ensures Nf reflects the total number of particles captured by the interlayer over time.
The interest in membrane filtration has evolved in recent years because of its ability to separate salt particles. Our system is an equidistant porous layer placed in a square channel. The porous medium is thus represented by a series of independent parallel layers with an arbitrary distribution of pores in each layer, as shown in the representative image of the filtration system Fig. 1.
The numerical simulation is designed to analyze the behavior of the system under conditions of periodic boundary. We model a total of 7000 particles existing inside the membrane, focusing specifically on those that need to be filtered from water. To highlight these particles, we used a single color (blue), as our primary interest lies in their behavior and interactions within the filtration process. We do not simulate individual water particles; instead, we represent the fluid medium abstractly to streamline our simulations and directly study the filtration efficiency, the simulation is designed to explore how the properties of a membrane influence the effectiveness of desalination in seawater. Parameters such as the coefficient of friction
In this paragraph, we discuss the numerical results using the Langevin dynamics model based on Newton’s second law according to Eq. (1). To describe this filtration through parallel multilayers, we will have to adopt the basic approach of membrane filtration modeling and address elements such as the porous medium, the random deposition of salt particles in the pores, which will depend on the particle size, and the biofouling phenomenon.
The theoretical results obtained by working with the conditions mentioned describe the desalination process based on membrane filtration.
The curve in Fig. 2 illustrates the number of salt particles filtered as a function of time. The feed pressure P, the coefficient of friction
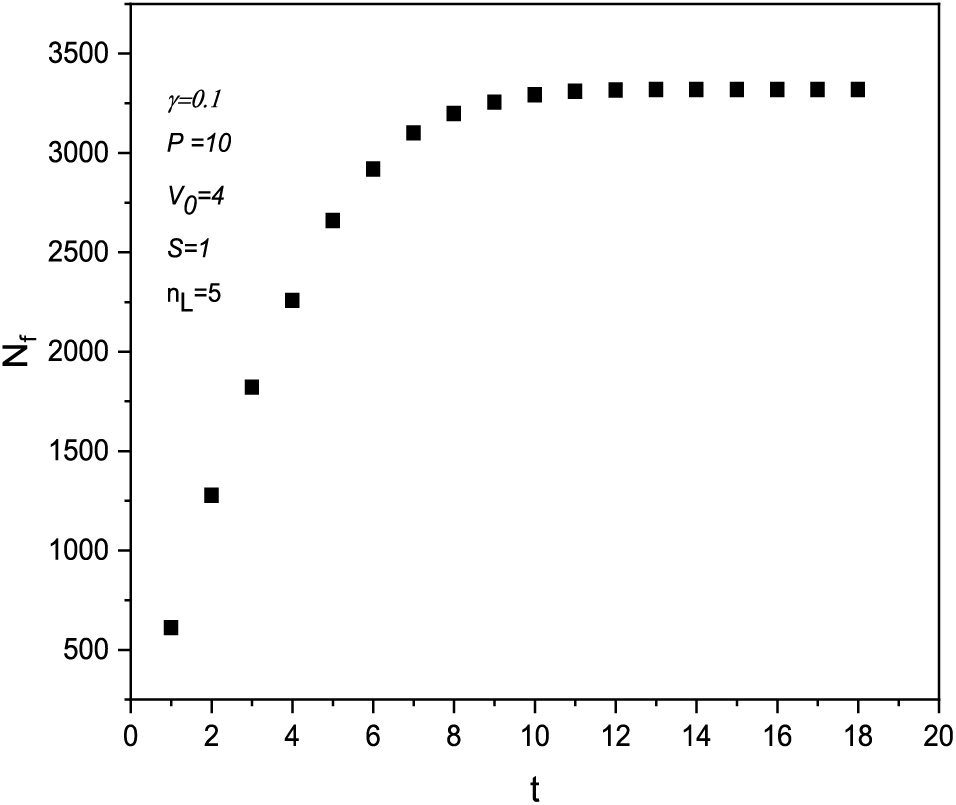
Figure 2: The time evolution of the filtered particles number using 5 parallel layers
To describe the flow physics in the layers, we consider that the particle flow occurs simultaneously in all the multilayers of the membrane. To explain the impact of the number of layers, the time evolution of the number of filtered particles, which depends on the number of layers used in the filtration process, is plotted in Fig. 3, which shows that when the number of layers is high, the number of retained salt particles is significant. The pores of the different layers have arbitrary sizes as well as being randomly distributed. As the salt particle passes through the first layer encountered, the probability that the particle will enter one of the pores of this first layer depends on the size of these pores [29]. If the pore is larger than the penetrating particle, as soon as the particle approaches a layer, it will be accounted for and eliminated as a pathway for subsequent particles.
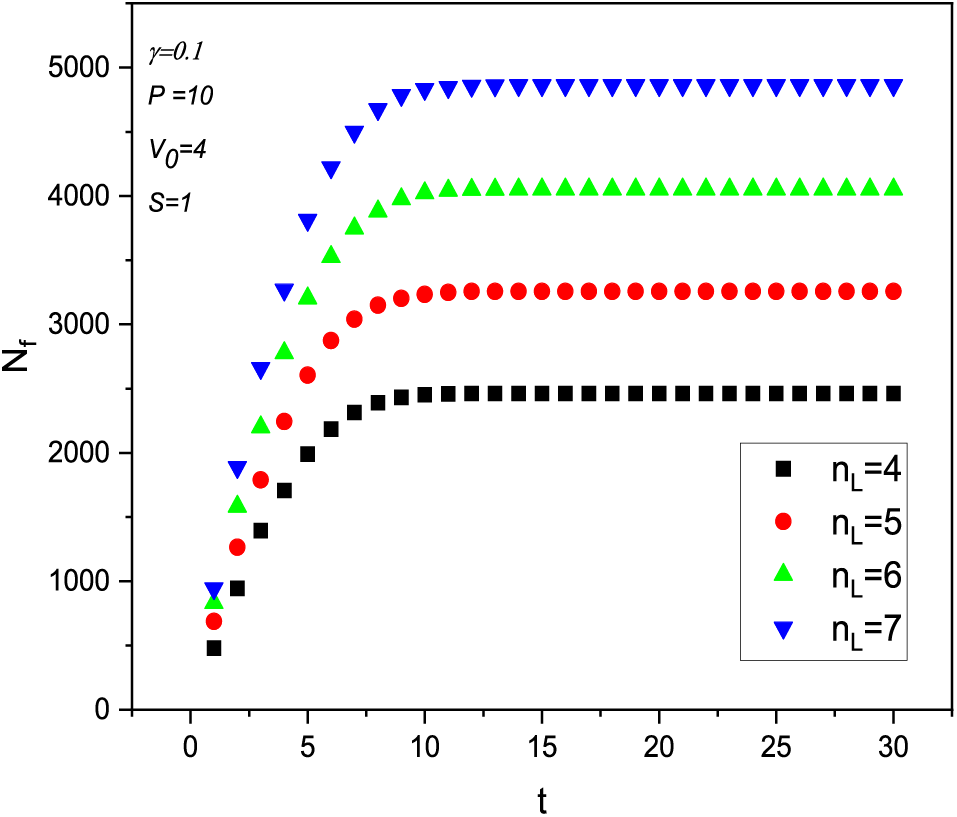
Figure 3: The time evolution of the filtered particles as the number of layers function
These curves show that the performance of the filtration system increases according to a power law with the number of layers (Fig. 4), so the multilayers offered a high quality of filtration and a remarkable rate of retention and absorption of salty particles. When the number of layers is minimized, the desalination rate decreases, which can be explained by pore fouling or by the small thickness of the layers used [30]. The confinement of the salt particles in the pores of the layers slows the filtration process. Thus, the resistance caused by membrane fouling increases [31]. However, multi-layer technology is a very effective method to minimize the accumulation of particles inside the pores and facilitate the filtration process [32]. It is imperative to point out that the number of salt particles filtered can be a remarkable factor in the filtration rate through multilayers.
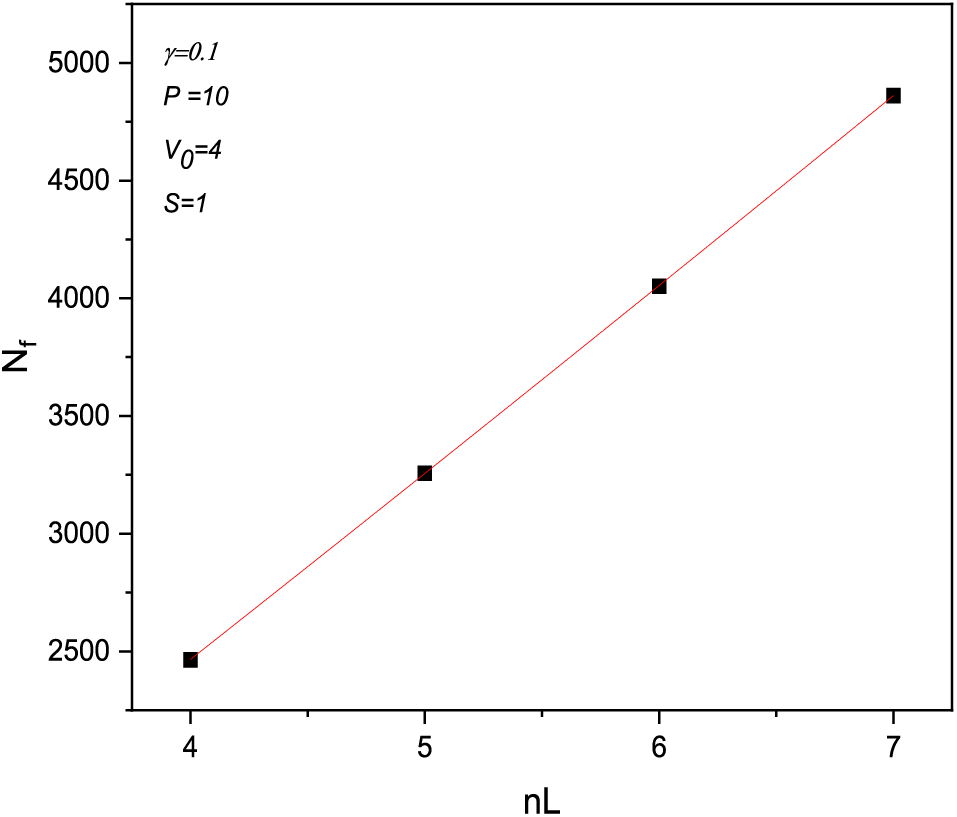
Figure 4: The connection between both the number of filtered particles and the number of layers
Numerical simulations reveal that the desalination rate of the salt particles in the porous medium of the filter increases significantly at the start of the process and then declines over time. As the number of filtered particles increases, the filtration performance of the multilayers decreases over time. The curve in Fig. 5 shows the variation in the number of filtered particles decreasing along with the flow of the particles, which causes the phenomenon of biofouling of the pores.
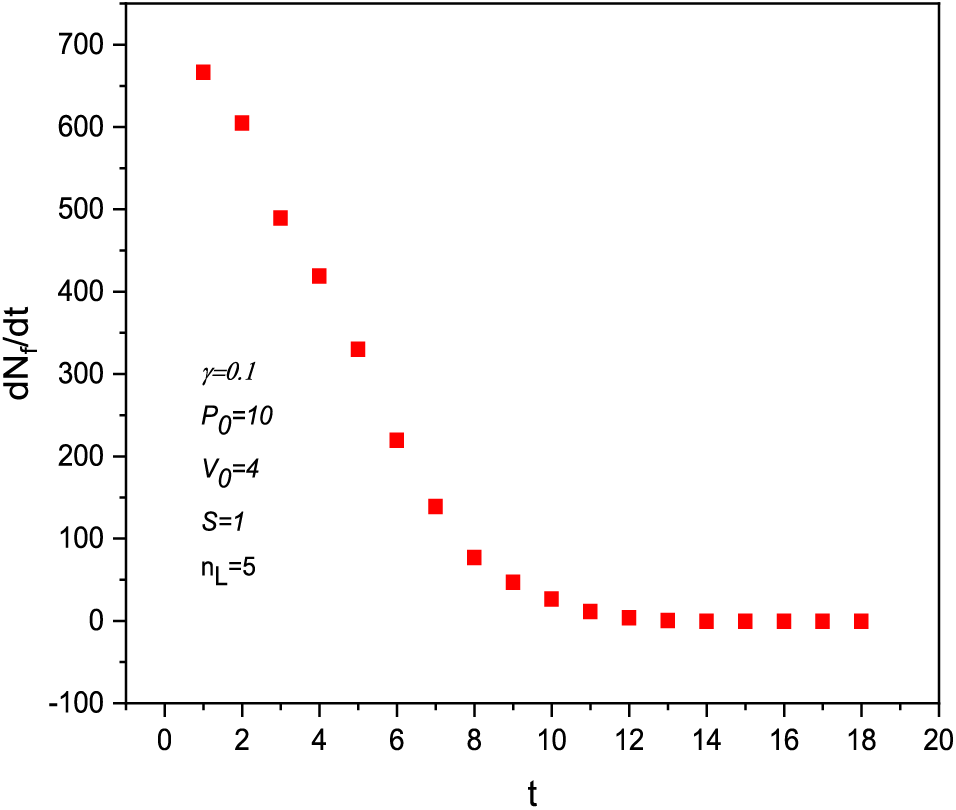
Figure 5: The variation of the number of filtered particles over time
In order to simulate the effect of the multi-layers on the desalination process and the behavior of the particles in the pores, the curves plotted in Fig. 6 represent the effect of the friction coefficient due to the mechanical interaction between the pores of the layers and the salty particles.
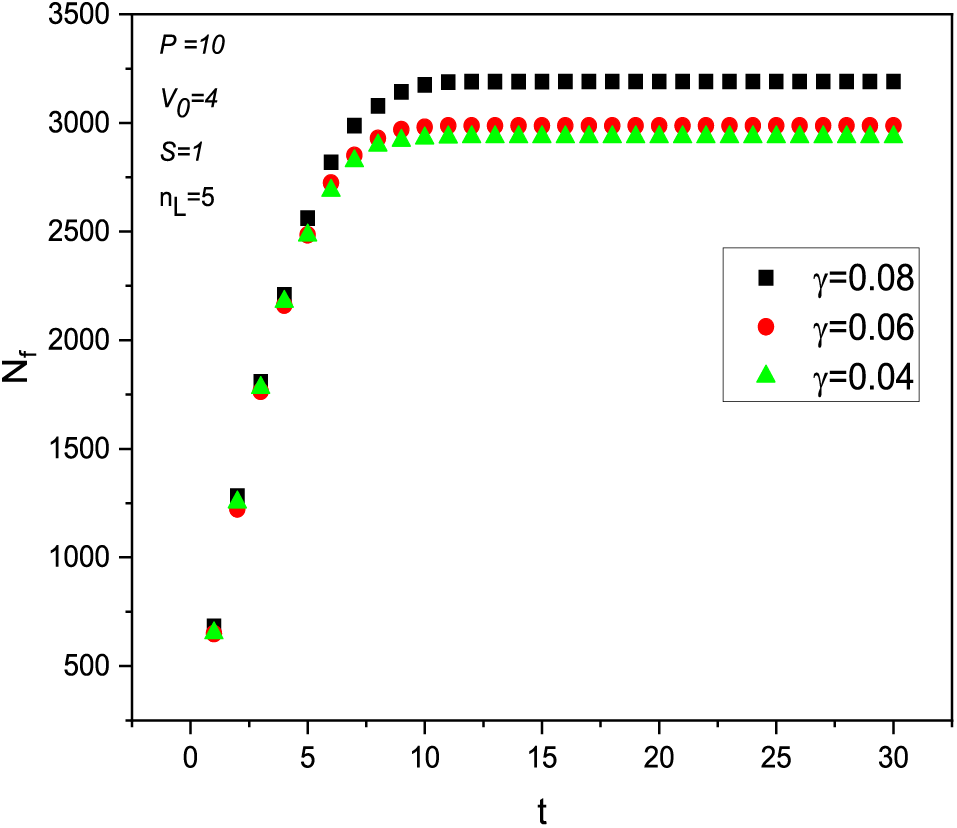
Figure 6: The number of filtered particles over time for various friction coefficient value
At first, when the large salt particles have been absorbed and intercepted by the first layer and pigmented on the surface of the layer, other small particles will penetrate the pores of the layer and pass through filtration through the second layer, and so on. With the accumulation inside the pores, a secondary layer in the form of a small film is formed, the pore diameter of the film is reduced, and the filtration flow drops sharply. The coefficient of friction will depend on the shape of the particles, the fluid’s viscosity, and the membrane layers’ porosity. These curves show that the number of particles filtered increases exponentially with time, with different characteristic times. Yu et al. [33] prepared nanofiber multilayers, and they found experimentally that when the number of layers is high, the filtration quality increases.
To examine the behavior of filtered particles over time for various coefficient of friction values, we plotted the curve in Fig. 7, which describes the increase in the number of salty particles as the coefficient of friction increases and thus the friction force. The relation between the stochastic force and the friction force is governed by the theorem of fluctuation-dissipation. However, there is a growing need to examine how the initial velocity affects the layer filter’s saturation during the filtration system.
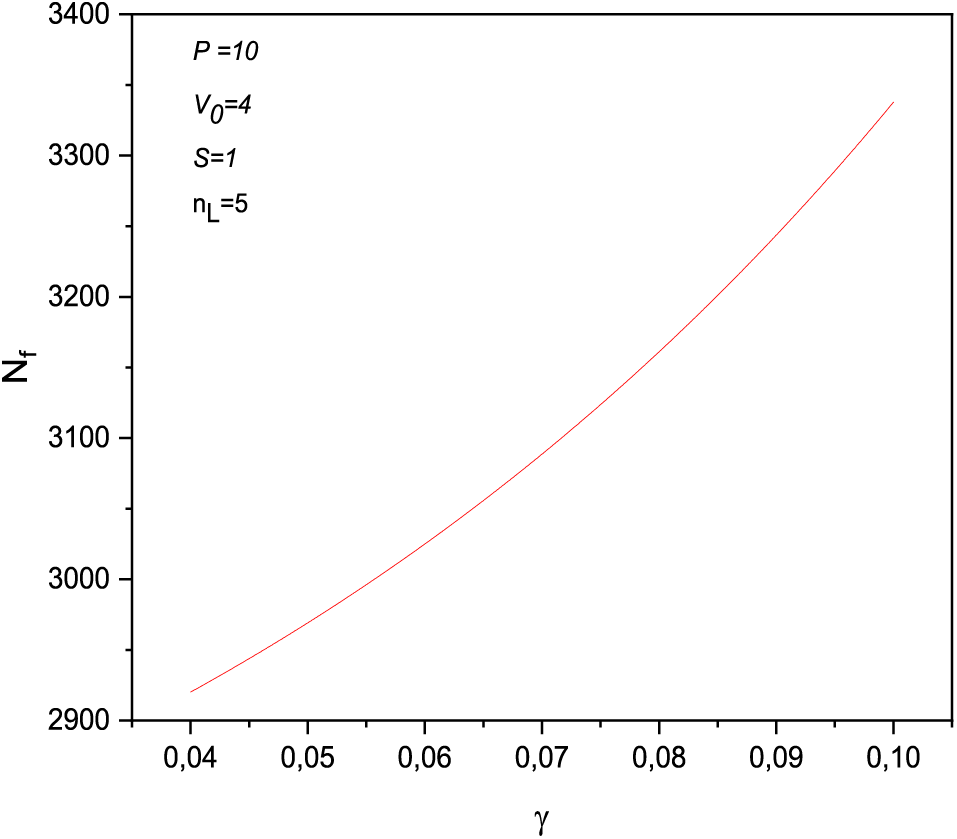
Figure 7: The variation of the number of filtered particles with the friction coefficient values
Moreover, the curves plotted in Fig. 8 represent the behavior of the particles injected in a square channel with different initial velocities. As shown in the curves, the layer filtration performance is affected by the initial velocity. The high velocity flow shows that the particles pass through the layers without being restricted by the pores of the multi-layers, resulting in a decrease in the number of particles filtered at high feed rates, which proves that the flow rate of the particles in the channel must be controlled. However, when the flow is generated at low velocities, the particles penetrate into the pores and are filtered with a shifted characteristic time.
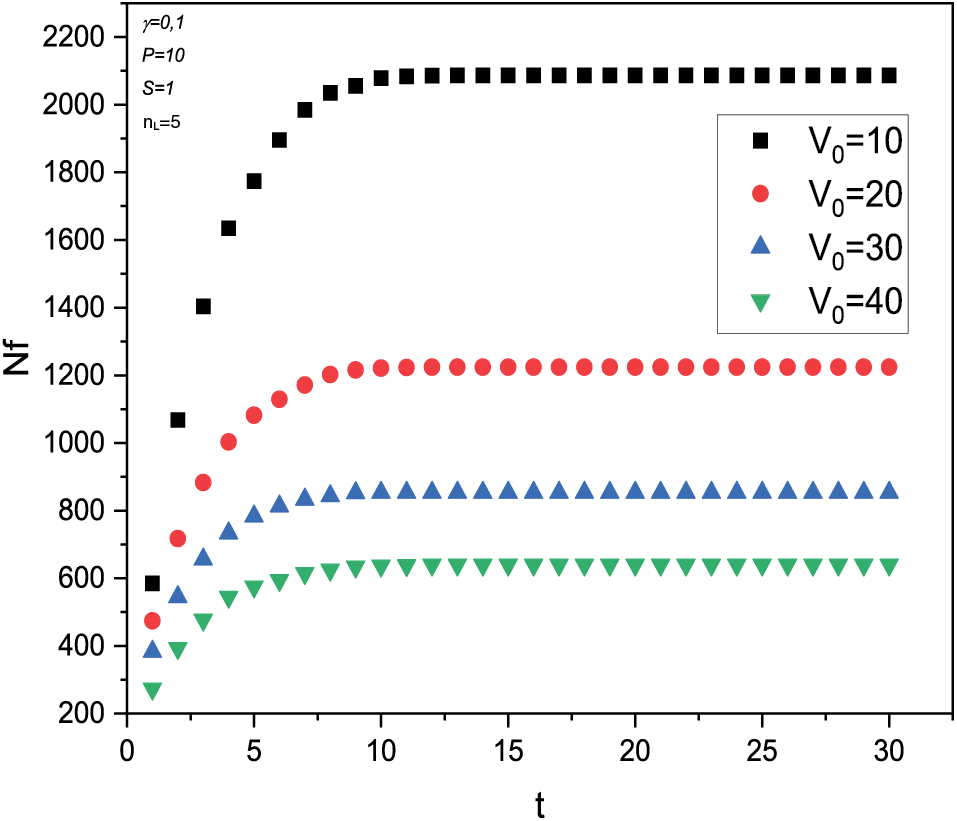
Figure 8: The time evolution of the number of filtered particles with different initial velocity values
To understand the behavior of the particles and the relationship between filtered particles and velocity, the result in Fig. 9, shows that if we have fixed the control parameters, the number of filtered particles decreases exponentially with velocity. In this process, the particles have to overcome the intermolecular attraction in the liquid channel and the capillary force, resulting in an increase in the resistance to draining out the particles from the channels. More particles remain inside the filter channel [34].
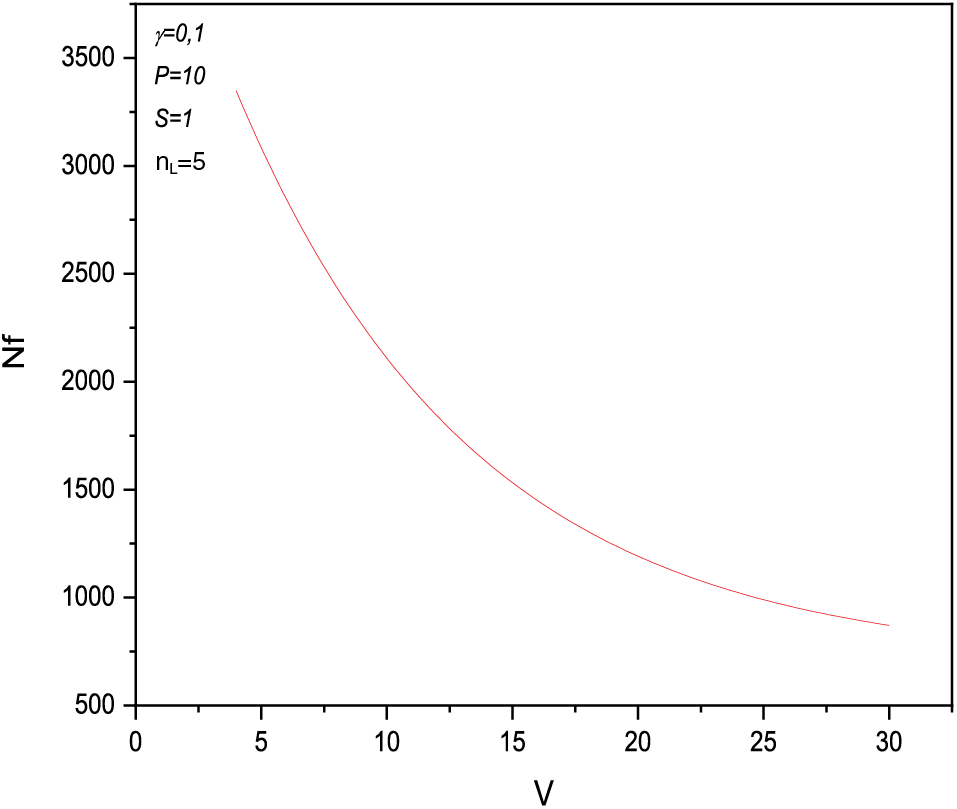
Figure 9: The relationship between the number of filtered particles and the feed velocity
We compared the results of our multi-layer membrane filtration system for seawater desalination with the findings from previous studies on wastewater treatment using hybrid multi-soil-layer (MSL) systems. While our focus was on desalination, both studies share a common goal of enhancing filtration efficiency and understanding the impact of various parameters on performance. The previous research demonstrated high removal efficiencies for pollutants such as TSS (Total Suspended Solid), COD (Chemical Oxygen Demand), TN (Total Nitrogen), and TP (Total Phosphorus), achieving removal rates of up to 97%, 88.57%, 88.49%, and 79.93%, respectively [35]. Similarly, our study reveals that increasing the number of filtration layers significantly improves the quality of desalination, following a power law relationship, and highlights the influence of friction coefficient and initial velocity on filtration performance. Although our system is designed for a different application, the critical role of multi-layer technology and the importance of controlling flow parameters are consistent with the findings of the hybrid MSL system. Both studies emphasize the necessity of addressing long-term effects such as biofouling to maintain filtration efficiency. These comparisons not only validate our approach but also underline the broader applicability and effectiveness of multi-layer filtration technologies across different domains.
In conclusion, the presented numerical simulations offer valuable insights into the behavior of a membrane filtration system designed for seawater desalination. The study focuses on a square channel with equidistant porous layers, examining various parameters such as the coefficient of friction γ, velocity V0, and the number of layers
Acknowledgement: None.
Funding Statement: The authors received no specific funding for this study.
Author Contributions: Salma Moushi: Conceptualization, Methodology, Software, Writing—review & editing, Visualization, Data curation, Investigation. Jaouad Ait lahcen: Conceptualization, Methodology, Software, Writing—review & editing, Visualization, Data curation, Investigation. Ahmed El Hana: Conceptualization, Methodology, Software, Writing—review & editing, Visualization, Data curation, Investigation. Yassine Ezaier: Conceptualization, Methodology, Software, Writing—review & editing, Visualization, Data curation, Investigation. Ahmed Hader: Supervision, Validation, Conceptualization, Methodology, Software, Writing—review & editing, Visualization, Data curation, Investigation. Imane Bakassi: Conceptualization, Methodology, Software, Writing—review & editing, Visualization, Data curation, Investigation. Iliass Tarras: Conceptualization, Methodology, Software, Writing—review & editing, Visualization, Data curation, Investigation. Yahia Boughaleb: Supervision, Validation, Conceptualization, Methodology, Software, Writing—review & editing, Visualization, Data curation, Investigation. All authors reviewed the results and approved the final version of the manuscript.
Availability of Data and Materials: The data used for this study are available upon request from the authors. Sensitive data or data protected by confidentiality agreements cannot be shared due to legal restrictions.
Ethics Approval: Not applicable.
Conflicts of Interest: The authors declare that they have no conflicts of interest to report regarding the present study.
References
1. Glenn EP, Jed Brown J, O’Leary JW. Irrigating crops with seawater. Sci American. 1998;279(2):76–81. doi:10.1038/scientificamerican0898-76. [Google Scholar] [CrossRef]
2. Shannon MA, Bohn PW, Elimelech M, Georgiadis JG, Mariñas BJ, Mayes AM. Science and technology for water purification in the coming decades. Nature. 2008;452:301–10. doi:10.1038/nature06599. [Google Scholar] [PubMed] [CrossRef]
3. Elimelech M, Phillip WA. The future of seawater desalination: energy, technology, and the environment. Science. 2011;333(6043):712–7. doi:10.1126/science.1200488. [Google Scholar] [PubMed] [CrossRef]
4. Cosgrove WJ, Loucks DP. Water management: current and future challenges and research directions. Water Res Research. 2015;51(6):4823–39. doi:10.1002/2014wr016869. [Google Scholar] [CrossRef]
5. Moushi S, Hader A, Ait Lahcen J, Tarras I, Et Touizi R, Ezaier Y, et al. Modeling of the pressure drop effect using membrane distillation in the desalination process. Mod Phys Lett B. 2023;37(22):2350083. doi:10.1142/s0217984923500835. [Google Scholar] [CrossRef]
6. Ait lahcen J, Ezaier Y, Hader A, Moushi S, Et Touizi R, Hariti Y, et al. Numerical study of the nanoparticles effect on the desalination process. Int J Mod Phys B. 2024;38(9):2450136. doi:10.1142/s0217979224501364. [Google Scholar] [CrossRef]
7. González D, Amigo J, Suárez F. Membrane distillation: perspectives for sustainable and improved desalination. Renew and Sustain Energ Rev. 2017;80:238–59. doi:10.1016/j.rser.2017.05.078. [Google Scholar] [CrossRef]
8. Zhou D, Zhu L, Fu Y, Zhu M, Xue L. Development of lower cost seawater desalination processes using nanofiltration technologies—a review. Desalination. 2015;376:109–16. doi:10.1016/j.desal.2015.08.020. [Google Scholar] [CrossRef]
9. Cherif H, Belhadj J. Environmental life cycle analysis of water desalination processes. In: Sustainable desalination handbook. Elsevier; 2018. pp. 527–59. doi:10.1016/b978-0-12-809240-8.00015-0. [Google Scholar] [CrossRef]
10. Ellouze F, Amar NB, Deratani A. Comparative study of two characterization methods of ultrafiltration and nanofiltration membranes. CR Chim. 2015;18(5):482–91 (In French). doi:10.1016/j.crci.2014.10.009. [Google Scholar] [CrossRef]
11. Balfaqih H, Al-Nory MT, Nopiah ZM, Saibani N. Environmental and economic performance assessment of desalination supply chain. Desalination. 2017;406:2–9. doi:10.1016/j.desal.2016.08.004. [Google Scholar] [CrossRef]
12. Wu B, Wang R, Fane AG. The roles of bacteriophages in membrane-based water and wastewater treatment processes: a review. Water Res. 2017;110:120–32. doi:10.1016/j.watres.2016.12.004. [Google Scholar] [PubMed] [CrossRef]
13. Li S, Zhang X, Su J. Desalination performance in janus graphene oxide channels: geometric asymmetry vs charge polarity. ACS Appl Mat & Inter. 2024;16(2):2659–71. doi:10.1021/acsami.3c16592. [Google Scholar] [PubMed] [CrossRef]
14. Ait lahcen J, Hajji Y, Hader A, Moushi S, Hariti YET, Touizi R, et al. Nanofiltration process in desalination phenomenon: Langevin dynamic model. Mater Today: Proc. 2022;66:217–22. doi:10.1016/j.matpr.2022.03.728. [Google Scholar] [CrossRef]
15. Liu Y, Xie D, Song M, Jiang L, Fu G, Liu L, et al. Water desalination across multilayer graphitic carbon nitride membrane: Insights from non-equilibrium molecular dynamics simulations. Carbon. 2018;140:131–8. doi:10.1016/j.carbon.2018.08.043. [Google Scholar] [CrossRef]
16. Lee KP, Arnot TC, Mattia D. A review of reverse osmosis membrane materialsfor desalination Development to date and future potential. J Mem Sci. 2011;370(1–2):1–22. doi:10.1016/j.memsci.2010.12.036. [Google Scholar] [CrossRef]
17. Giwa A, Akther N, Dufour V, Hasan SW. A critical review on recent polymeric and nano-enhanced membranes for reverse osmosis. RSC Adv. 2016;6(10):8134–63. doi:10.1039/C5RA17221G. [Google Scholar] [CrossRef]
18. Yang Y, Li W, Zhou H, Zhang X, Zhao M. Tunable C2N membrane for high efficient water desalination. Sci Rep. 2016;6(1):29218. doi:10.1038/srep29218. [Google Scholar] [PubMed] [CrossRef]
19. Karimzadeh N, Azamat J, Erfan-Niya H. Efficient water desalination through mono and bilayer carbon nitride nanosheet membranes: Insights from molecular dynamics simulation. J Molecul Graphics and Model. 2022;110:108059. doi:10.1016/j.jmgm.2021.108059. [Google Scholar] [PubMed] [CrossRef]
20. Zhu L, Xue Q, Li X, Wu T, Jin Y, Xing W. C2N: an excellent two-dimensional monolayer membrane for He separation. J Mat Chem A. 2015;3:21351–6. doi:10.1039/c5ta05700k. [Google Scholar] [CrossRef]
21. Latif A, Ezaier Y, Hader A, Moushi S, Amallah L, Bakassi I, et al. Numerical study of the effect friction coefficient particles on morphological properties of separation membrane surface. Modern Phy Lett B. 2023;37(2):2250200. doi:10.1142/s0217984922502001. [Google Scholar] [CrossRef]
22. Lü J-T, Hu B-Z, Hedegård P, Brandbyge M. Semi-classical generalized Langevin equation for equilibrium and nonequilibrium molecular dynamics simulation. Progress in Surf Sci. 2019;94(1):21–40. doi:10.1016/j.progsurf.2018.07.002. [Google Scholar] [CrossRef]
23. EL Hana A, Hader A, Ait Lahcen J, Moushi S, Hariti Y, Tarras I, et al. Numerical study of the volume fraction and thermophysical properties of nanofluids in a porous medium. Multidiscipline Model in Mat and Struct. 2024;20(3):437–47. doi:10.1108/mmms-12-2023-0391. [Google Scholar] [CrossRef]
24. Calif R. PDF models and synthetic model for the wind speed fluctuations based on the resolution of Langevin equation. Appl Energ. 2012;99:173–82. doi:10.1016/j.apenergy.2012.05.007. [Google Scholar] [CrossRef]
25. Contreras-Vergara O, Lucero-Azuara N, Sánchez-Salas N, Jiménez-Aquino JI. Langevin original approach and Ornstein–Uhlenbeck-type processes. Physica A: Stat Mech and its Appl. 2021;584:126349. doi:10.1016/j.physa.2021.126349. [Google Scholar] [CrossRef]
26. Suresh V, Gopalakrishnan R. Tutorial: Langevin Dynamics methods for aerosol particle trajectory simulations and collision rate constant modeling. J Aerosol Sci. 2021;155:105746. doi:10.1016/j.jaerosci.2021.105746. [Google Scholar] [CrossRef]
27. Mazroui M, Asaklil A, Boughaleb Y. Conductivity of two-dimensional systems of interacting Brownian particles within the effective potential description. Surface Sci. 1998;409(3):528–40. doi:10.1016/s0039-6028(98)00270-2. [Google Scholar] [CrossRef]
28. Mohammad AW, Teow YH, Ang WL, Chung YT, Oatley-Radcliffe DL, Hilal N. Nanofiltration membranes review: recent advances and future prospects. Desalination. 2015;356:226–54. doi:10.1016/j.desal.2014.10.043. [Google Scholar] [CrossRef]
29. Beuscher U. Modeling sieving filtration using multiple layers of parallel pores. Chem Eng Technol. 2010;33(8):1377–81. doi:10.1002/ceat.201000123. [Google Scholar] [CrossRef]
30. Onur A, Ng A, Batchelor W, Garnier G. Multi-layer filters: adsorption and filtration mechanisms for improved separation. Frontiers in Chem. 2018;6:417. doi:10.3389/fchem.2018.00417. [Google Scholar] [PubMed] [CrossRef]
31. Wang X-M, Waite TD. Impact of gel layer formation on colloid retention in membrane filtration processes. J Mem Sci. 2008;325:486–94. doi:10.1016/j.memsci.2008.08.016. [Google Scholar] [CrossRef]
32. Meng Z, Fang J, Pu Y, Yan Y, Wu Y, Wang Y, et al. Experimental study on the influence of DPF micropore structure and particle property on its filtration process. J of Combust. 2016;2016:1–12. doi:10.1155/2016/9612856. [Google Scholar] [CrossRef]
33. Yu Y, Ma R, Yan S, Fang J. Preparation of multi-layer nylon-6 nanofibrous membranes by electrospinning and hot pressing methods for dye filtration. RSC Advances. 2018;8(22):12173–8. doi:10.1039/c8ra01442f. [Google Scholar] [PubMed] [CrossRef]
34. Chang C, Ji Z, Liu J. The effect of a drainage layer on the saturation of coalescing filters in the filtration process. Chem Eng Sci. 2017;160:354–61. doi:10.1016/j.ces.2016.10.047. [Google Scholar] [CrossRef]
35. Kammoun A, Ouazzani N, El Fels AEA, Hejjaj A, Mandi L. Enhancing pollutant removal efficiency in urban domestic wastewater treatment through the hybrid multi-soil-layering (MSL) system: a case study in Morocco. Water Sci Technol. 2024;89:2685–702. doi:10.2166/wst.2024.124. [Google Scholar] [PubMed] [CrossRef]
Cite This Article
 Copyright © 2024 The Author(s). Published by Tech Science Press.
This work is licensed under a Creative Commons Attribution 4.0 International License , which permits unrestricted use, distribution, and reproduction in any medium, provided the original work is properly cited.


 Submit a Paper
 Propose a Special lssue
 View Full Text
 Download PDF
 Downloads
 Citation Tools