 Open Access
ARTICLE
Numerical Simulation and Optimization of the Gas-Solid Coupled Flow Field and Discharging Performance of Straw Crushers
1 College of Mechanical Engineering, Inner Mongolia University of Technology, Hohhot, 010051, China
2 College of Mechanical & Electrical Engineering, Qiqihar University, Qiqihar, 161000, China
* Corresponding Author: Yu Zhao. Email:
Fluid Dynamics & Materials Processing 2024, 20(11), 2565-2583. https://doi.org/10.32604/fdmp.2024.053362
Received 29 April 2024; Accepted 16 July 2024; Issue published 28 October 2024
Abstract
The quality of crushing, power consumption, and discharging performance of a straw crusher are greatly influenced by the characteristics of its internal flow field. To enhance the straw crusher’s flow field properties and improve the efficiency with which crushed material is discharged, first, the main structural parameters influencing the air flow in the crusher are discussed. Then, the coupled gas-solid flow field in the straw crusher is numerically calculated through solution of the Navier-Stokes equations and application of the discrete element method (DEM). Finally, the discharge performance index of the crusher is examined through detailed analysis of the crushed material dynamics. Additionally, a multi-island genetic algorithm is used to optimize the structure and operational factors that have significant effects on the discharge performance. With optimization, the accumulation rate of crushed materials in the bottom region of the straw crusher decreases by 20.08%, and the mass flow rate at the discharge outlet increases by 11.63%.Keywords
Straw crushers can process unsuitable straw into soft filamentous segments that can be utilized as livestock feed while preserving its nutritional value. Moreover, these machines can facilitate subsequent physical, chemical, and biological processing treatments. The primary components of straw crushers include a feeding trough, cutting knives, racks, hammer frame boards, hammers, throwing blades, casing, and discharge tube (Fig. 1). During the operation of straw crushers, the straw and other materials are fed into the crushers through the feeding trough and cut into segments by the cutting knives. Afterward, due to the impact of the knives and the suction of the airflow, the material passes into the crushing chamber. In this chamber, the segmented materials are kneaded into filamentous fragments by high-speed rotating hammers and teeth. Ultimately, as a consequence of the combined influence of the airflow and the throwing blade, the crushed materials are expelled from the machine through the discharge tube. However, this kind of machinery frequently has problems such as inefficiency, easy plugging, and excessive energy consumption, all of which are related to the internal flow field’s characteristics.
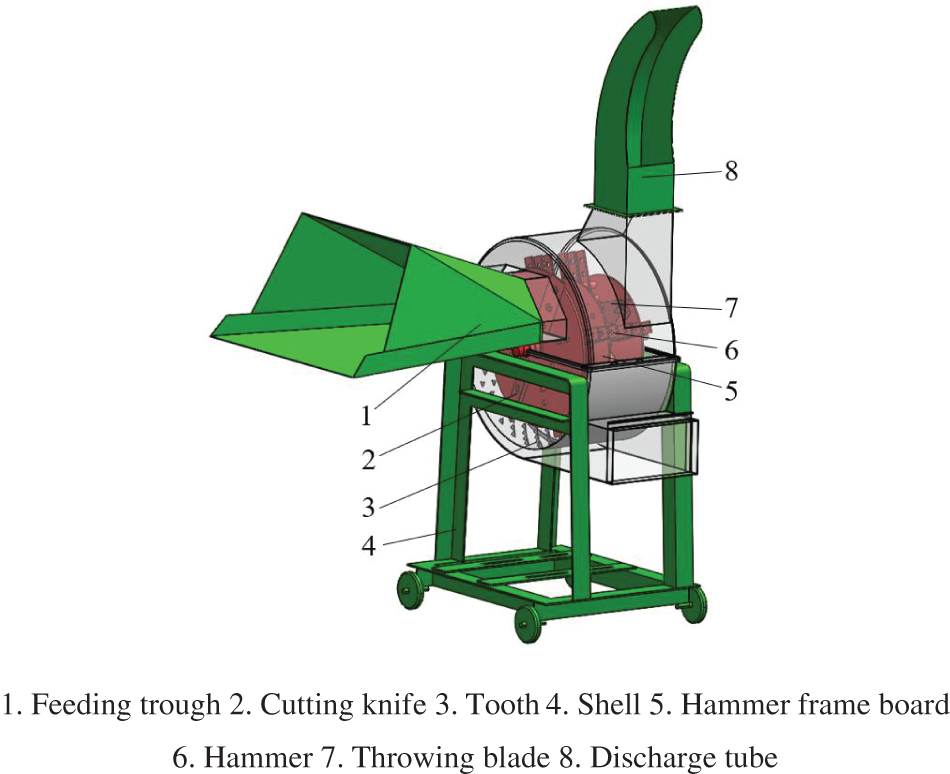
Figure 1: Schematic of the straw crusher structure
The flow in straw crushers is characterized by complicated gas–solid two-phase unsteady behavior. Scholars generally utilize CFD (a numerical method for solving fluid mechanics equations to simulate and analyze fluid dynamics problems and analyze flow characteristics) and the method of coupling CFD with DEM (a method for studying the motion and mechanical properties of bulk materials) to analyze it. For instance, Liu et al. [1] indicated that during the process of material crushing, a circulating layer (a phenomenon wherein the materials and airflow create a gas–solid two-phase circulating motion with suspension transportation characteristics within the crushing chamber) was formed on the inner wall of the crusher casing. Silvester et al. [2] used the CFD numerical computation approach to examine and improve the crushing equipment’s capacity to remove dust. Delaney et al. [3] investigated the crusher’s material flow using DEM simulation technology. Based on CFD and CFD–DEM methods, Liu et al. [4] studied the air flow distribution within a crusher chamber and explored the effect of the circulation layer on the material. Ma et al. [5] and Pei et al. [6] simulated the airflow velocity and pressure distributions in a crusher chamber and analyzed the motion trajectory of the materials and its influencing factors.
In the related domain, Lisowski et al. [7] used CFD simulation to reveal the air flow characteristics and material motion state in the discharge port of a feed harvester. Liu et al. [8] used the coupling method of a discrete phase model (DPM) and CFD to analyze the flow field characteristics of a vertical roller mill and improved the efficiency of the roller mill by optimizing the blade shape. Jeong et al. [9] used CFD simulation to determine the size of the rotor perpendicular plate hole that can minimize accumulation of the crushed fuel in the roller type sewage sludge solid fuel crusher to be used in the co-firing method.
The above research mainly used CFD and DEM to elucidate the motion characteristics of gas flow within the machine and its impact on the materials. However, the discharge performance of straw crushers has been neglected in these studies. If the crushed materials are not immediately removed, they will accumulate at the bottom of the straw crusher during operation. If the accumulation amount exceeds the height of the rack, the rack will fail, leading to a significant reduction in the crushing efficiency of the straw crusher. The discharge performance of the straw crusher is directly linked to the dimensions of its structure and the crusher’s internal flow field characteristics. Consequently, it is of utmost importance to conduct research on the characteristics of the coupled flow field within straw crushers and enhance their discharge capabilities.
This study focused on exploring the complex flow field characteristics within a straw crusher, reducing the accumulation of material in its chamber, and improving its discharge performance. In this research, the 9R-50A model straw crusher was chosen as the subject of investigation. The gas–solid coupling flow field in the crusher was numerically simulated using CFD–DEM coupling technology. The distribution law of the coupling flow field and the movement law of the crushed straw material were obtained, as well as the mechanism of the circulation layer on the material in the crusher. On this basis, the structural parameters that affect the discharge performance of the crusher were analyzed. The discharge performance index of the straw crusher was determined by evaluating the ratio of the volume of material at the bottom of the crusher to the mass flow rate of the crusher outlet. The multi-island genetic algorithm was employed to optimize the internal flow field of the straw crusher, resulting in the identification of the optimal combination of rotor speed, tooth plate inclination angle, and the gap between the hammer and rack. After optimization, the accumulation of crushed materials at the bottom of the crusher decreased by 20.08%, and the mass flow rate of the discharge port increased by 11.63%. As a result, the discharge performance of the straw crusher was significantly enhanced.
2 Numerical Simulation and Analysis of the Gas–Solid Coupled Flow Field within the Straw Crusher
2.1 Gas–Solid Coupling Computational Process
The CFD–DEM coupling method is a two-way coupling technique that utilizes the Euler–Lagrange approach. In this approach, the fluid phase is regarded as a continuous phase, with its continuity and momentum conservation equations defined as follows:
In Eqs. (1) and (2), εf represents the fluid volume fraction, ρf denotes the fluid density in kg/m3, ∇ denotes the nabla operator,
The realizable k–ε model is used to solve the Navier–Stokes equations in an Eulerian coordinate system [10]. After the flow field converges through a series of iterations over x1 time steps, the DEM is used for the computation over x2 time steps, where x1 = i·x2, i ∈ [1, 100] [11]. The particle motion can be calculated by solving the mechanical equilibrium equation and tracking the particle trajectory in the Lagrangian coordinate system to calculate the discrete phase.
In Eqs. (3) and (4), mp denotes the particle mass in kg, vp signifies the particle velocity in m/s, t denotes time in s, FD denotes the drag force in N, FG represents the gravitational force in N, FSa represents the Saffman lift force in N, FMa denotes the Magnus lift force in N, Ip represents the moment of inertia of particles in kg/m2, ωp indicates the angular velocity of particles in rad/s, and Tp denotes the torque experienced by the particles in N·m.
Following the iterative convergence of the x2 time steps in the DEM, the force, instantaneous velocity, and position of the particles are calculated based on the fluid conditions in the grid unit where the particles are located. Subsequently, the updated particle coordinates and particle force are transmitted to the CFD. The CFD program continues constant modifications and iterations, consistently repeating the above process until the entire solution cycle is finished.
2.2 CFD Simulation Setup and Accuracy Verification
2.2.1 CFD Model Construction and Grid Division
In practical applications, the straw crushing machine typically utilizes the upper discharge tube for discharging, while the bottom discharge opening is sealed (Fig. 1). Therefore, this paper simplified the structure of the lower discharge tube and other irrelevant structures, such as the shell bracket and discharge tube connection flange, in the calculation of the coupling flow field, which has no effect on the calculation results of the flow field. Table 1 lists the primary structural characteristics of the straw crusher.

Polyhedral grids were used to divide the flow field of the model. To achieve a balance between computational accuracy and workload reduction, the maximum mesh size was set at 20, 18, 16, 14, 12, 10, and 8 mm. The effect of this parameter on the calculation results was subsequently tested. The airflow velocity at the center of the discharge port was selected as the evaluation index. The computed results are displayed in Fig. 2.
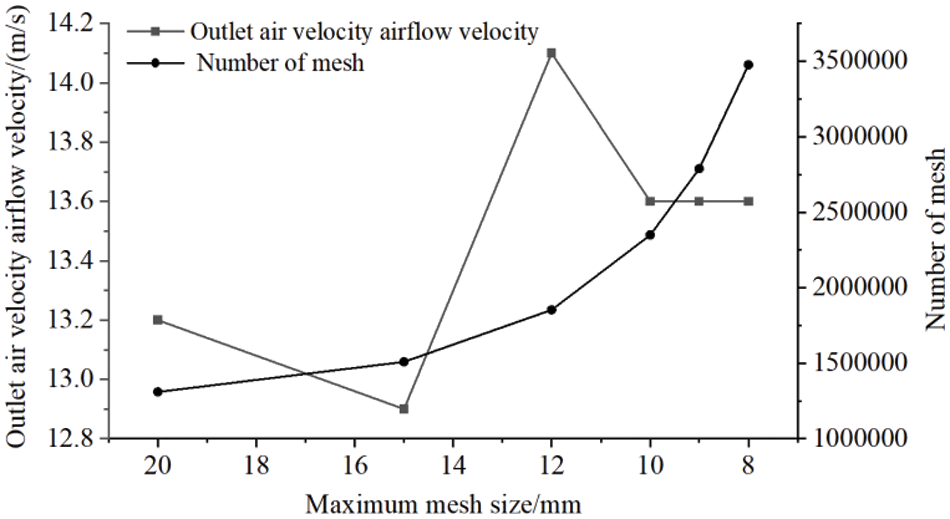
Figure 2: Grid independence verification
As illustrated in Fig. 2, when the largest size of the grid within the internal flow field of the straw crusher was 10 mm or smaller, there were few changes in the airflow velocity at the central point of the outlet. Thus, when the maximum mesh size was less than 10 mm, the simulation results exhibited no dependence on the mesh size. This paper sets the maximum grid size to 10 mm through grid independence detection, considering the comprehensive calculation efficiency and the accuracy of the calculation results. The final number of grids was determined to be 2,348,332. Fig. 3 displays the comprehensive division results.
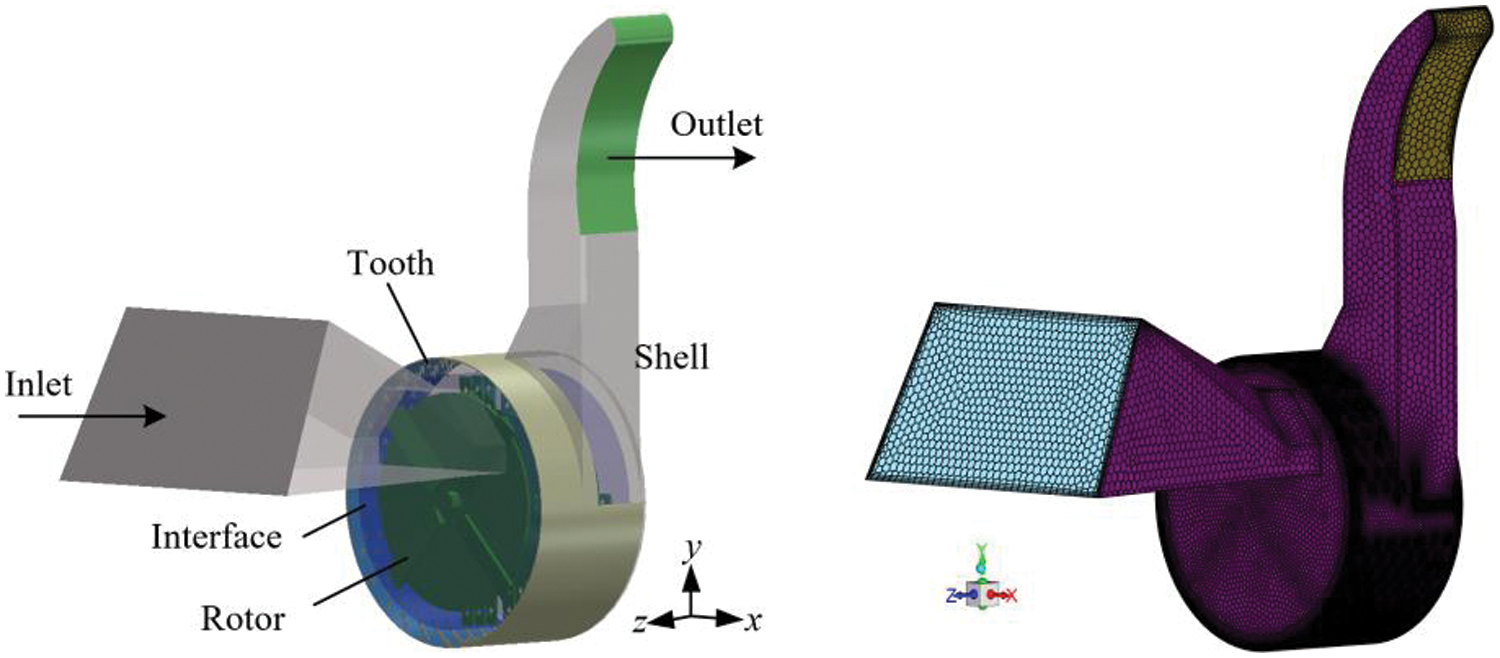
Figure 3: Mesh structure of the flow field within the straw crusher
The flow field within the straw crusher exhibits complex turbulent motion, and the computational model used for modeling the flow field is the realizable k–ε model. The inlet was initially defined as a velocity inlet with a magnitude of 1.57 m/s (the average velocity of the inlet airflow). When the flow field converges, the inlet type shifts to a pressure inlet. The outlet boundary condition was consistently defined as a pressure outlet with a magnitude of one standard atmosphere. During the idle operation of the crusher, the internal medium of the crusher was filled with air. The shell was fixed in location, while the rotor functioned as a moving wall and rotated in relation to the calculation area. The rotor was set to rotate at a speed of 2400 r/min, and an interface was implement between the rotor and the casing walls to allow for data exchange between the fluid and rotating areas. The airflow inside the straw crusher demonstrated turbulent flow. Therefore, the SIMPLE algorithm was chosen as the solver, and the PRESTO! algorithm was chosen as the pressure separation algorithm format. Additionally, a second-order upwind scheme with high accuracy was selected for the momentum, turbulent kinetic energy, and turbulent loss rate. The time step for the computation was set to 2.1e−5 s, and the total computation time was set to 1 s.
2.2.3 Airflow Velocity Experiment at the Straw Crusher Outlet
To verify the precision of the flow field simulation, the airflow velocity at the outlet of the straw crusher was evaluated by experimental methods (Fig. 4). A Testo 405i anemometer, which has a measurement range of 0–30 m·s−1 and a precision of 5% of the measured value, was used for this purpose. After the machine ran smoothly, multiple readings were recorded at the center point of the outlet. From these, five sets of valid data points were selected, and their average was calculated. Table 2 compares the results of the experiment with the findings obtained from the simulation.
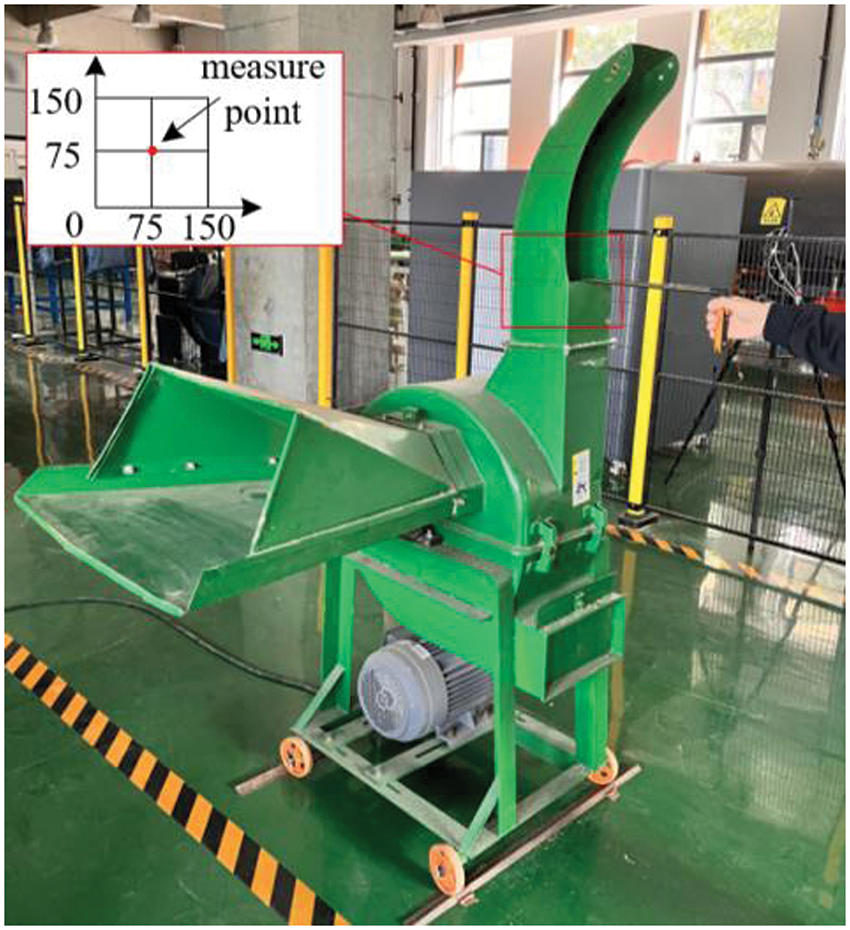
Figure 4: Airflow velocity testing

Table 2 shows that the relative error between the simulated and measured values of the airflow velocity monitoring points at the outlet of the straw crusher is 7.1%, indicating a small discrepancy. The simulation results accurately depict the flow field in the straw crusher. Hence, the simulation results accurately depict the flow field of the straw crusher.
2.3 DEM Model Construction and Simulation Setting
The accuracy of the discrete element method (DEM) is significantly affected by the shape of the particles [12]. A DEM material model was constructed based on the actual material model within the crusher chamber to simulate the discharge performance of the straw crusher accurately. Hence, in this study, initial experiments were carried out prior to the simulations. The experiment used corn straw at a moisture content of 12.6%. The straw crusher was set up to operate at a rotational speed of 2400 r/min. The material size and size distribution after crushing were measured following the sampling method described in the GB/T 20788-2006 standard titled “Forage Chopper” [13]. The crushed materials can be divided into three main categories: powder materials, filamentous materials, and fragmentary materials. Powder materials with an average length of 4 mm and a cross-sectional area of 2 mm2 made up 48.7% of the total. Filamentous materials with an average length of 15 mm and a cross-sectional area of 3 mm2 made up 36.8% of the total. Fragmentary materials with an average length of 30 mm and a cross-sectional area of 4.5 mm2 made up 14.5% of the total. The DEM material model is depicted in Fig. 5.
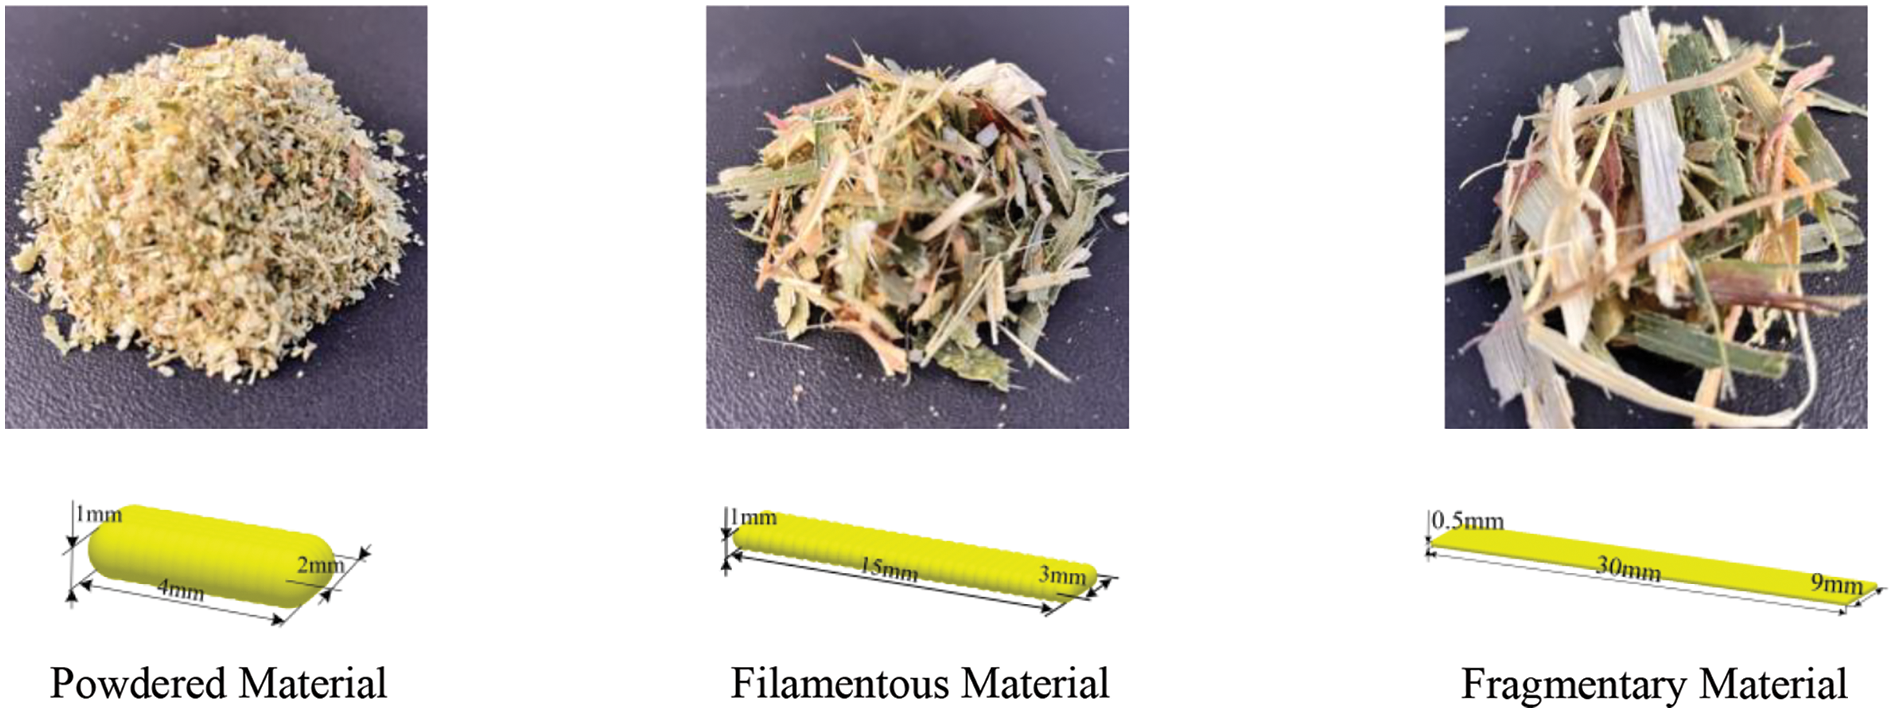
Figure 5: Comparison of crushed material and DEM model
The inherent parameters of straw are the main variables that affect its mechanical properties. The density of the crushed straw was determined through drainage experiments, and the shear modulus of the straw was measured via tensile and compression experiments. The experimental process was consistent with that in [14,15]. The intrinsic parameters of the crushed material were determined and are presented in Table 3.

The Poisson’s ratio for agricultural materials typically ranges from 0.2 to 0.5 [16]. In this study, the Poisson’s ratio of crushed straw was uniformly set to 0.3 according to comprehensive measurements. Table 4 provides the contact parameters of the crushed straw [17,18].

The flow characteristics of a material are significantly affected by its contact parameters [12]. To verify the accuracy of the simulation, the DEM model was validated by heap angle tests. The bottomless cylinder lifting method was used to obtain the heap angle of the crushed straw [19]. During the testing experiments, a customized cylindrical cylinder without a bottom (with dimensions of Φ50 mm × 50 mm) was placed on a flat surface. Next, in accordance with the method of sampling specified in the GB/T 20788-2006 standard titled “Forage Chopper”, the crushed material was filled into the cylinder. After that, the cylinder was lifted at a gradual, stable, and uniform pace to form a pile of material on the table surface. The angle of the crushed straw was measured using ImageJ software. The experiment was repeated a minimum of ten times, data that differed significantly from the average value (with an error of less than 5%) were removed, and the average value was calculated as the final test result.
During the simulation, the same boundary conditions were set in EDEM. Initially, three DEM models of crushed straw were created by multiball particles, and their intrinsic parameters were in accordance with the values specified in Table 3. Furthermore, a cylinder that is equal in size and shape to the cylinder used in the experiment for generating and storing crushed straw was created. The percentages of the three kinds of crushed straw generated were 48.7%, 36.8%, and 14.5%, respectively. The Hertz–Mindlin nonslip contact model was chosen to describe the contact between two materials and between a material and a structure [19]. After the cylinder was filled with crushed straw, a constant upward speed of 0.1 m/min was applied to the cylinder. Ultimately, the material stacking angle was compared between the simulation and experiment, as depicted in Fig. 6. A smaller difference in the stacking angle indicates a greater degree of simulation [20].

Figure 6: Comparison between crushed material and simulated heap angle tests
The experimental measures showed an average accumulation angle of 39.78° for the crushed straw, while the simulation resulted in an average accumulation angle of 38.11°. The simulation and experiment had a relative error of 4.20%, which indicates a small discrepancy between the simulation and experiment. The discrete element model was precise.
The DEM model of the straw crusher was built based on the CFD model, with the exception of the closed surfaces at the inlet and outlet, as well as the mesh interface, as depicted in Fig. 7.
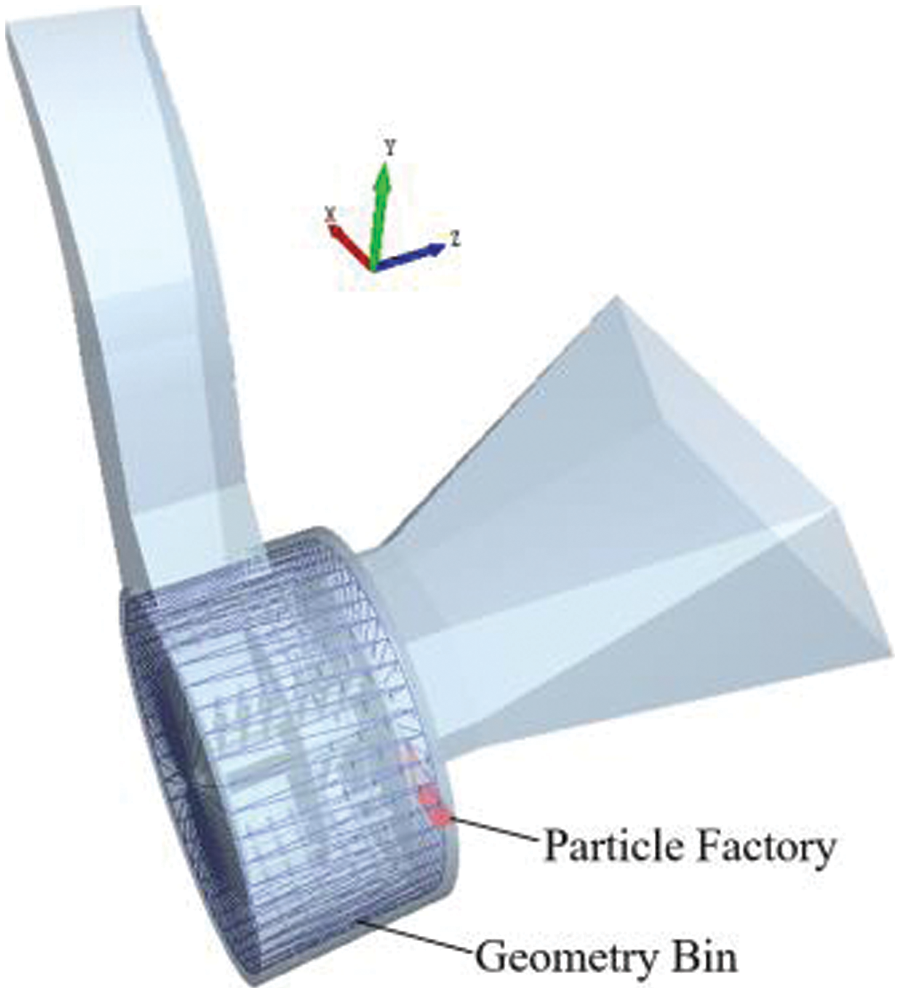
Figure 7: DEM model of the straw crusher
To calculate the discrete phase, the rotor was set to rotate linearly around the primary axis. The rotor was set up to undergo linear rotation along the main axis (linear rotation kinematic), following the set boundary condition of CFD. The velocity was set to 2400 r/min. The plastic deformation and contact residence time resulting from collisions between materials and the structure of the straw crusher were ignored. Consequently, contact collisions were considered to be nonviscous contacts, while material contacts were simulated using the Hertz–Mindlin (no slip) nonsliding contact model. This paper mainly investigates the flow characteristics of the internal airflow-crushing straw coupling flow field in a straw crusher. Consequently, the act of cutting the straw by knives was ignored, and instead, the particle factory plane was set in close proximity to the knives, specifically in the direction of the +z axis. In Fig. 7, the particle generation rate was set at 0.5 kg/s. The newly generated particles were given a speed of 5 m/s along the −y axis to replace the cutting force applied to the straw section after the knives cut off the straw during machine operation. The time step of Fluent is typically synchronized with the time step of EDEM when the two software programs are used together. The time step and data storage time must be whole numbers that are divisible by 1 to 100. The time step settings are displayed in Table 5.

2.4 Numerical Simulation Results and Analysis of the Gas–Solid Coupled Flow Field within the Straw Crusher
2.4.1 Analysis of the Velocity Field in the Crushing Chamber
To facilitate observation, three specific cross-sections of the crushing chamber were selected to analyze the velocity field within it. The cross-sections are shown in Fig. 8. There are three sections: Section A is in the xOy plane at a z-coordinate of 75 mm, Section B is also in the xOy plane but at a z-coordinate of 200 mm, and Section C is in the yOz plane at an x-coordinate of 0 mm.
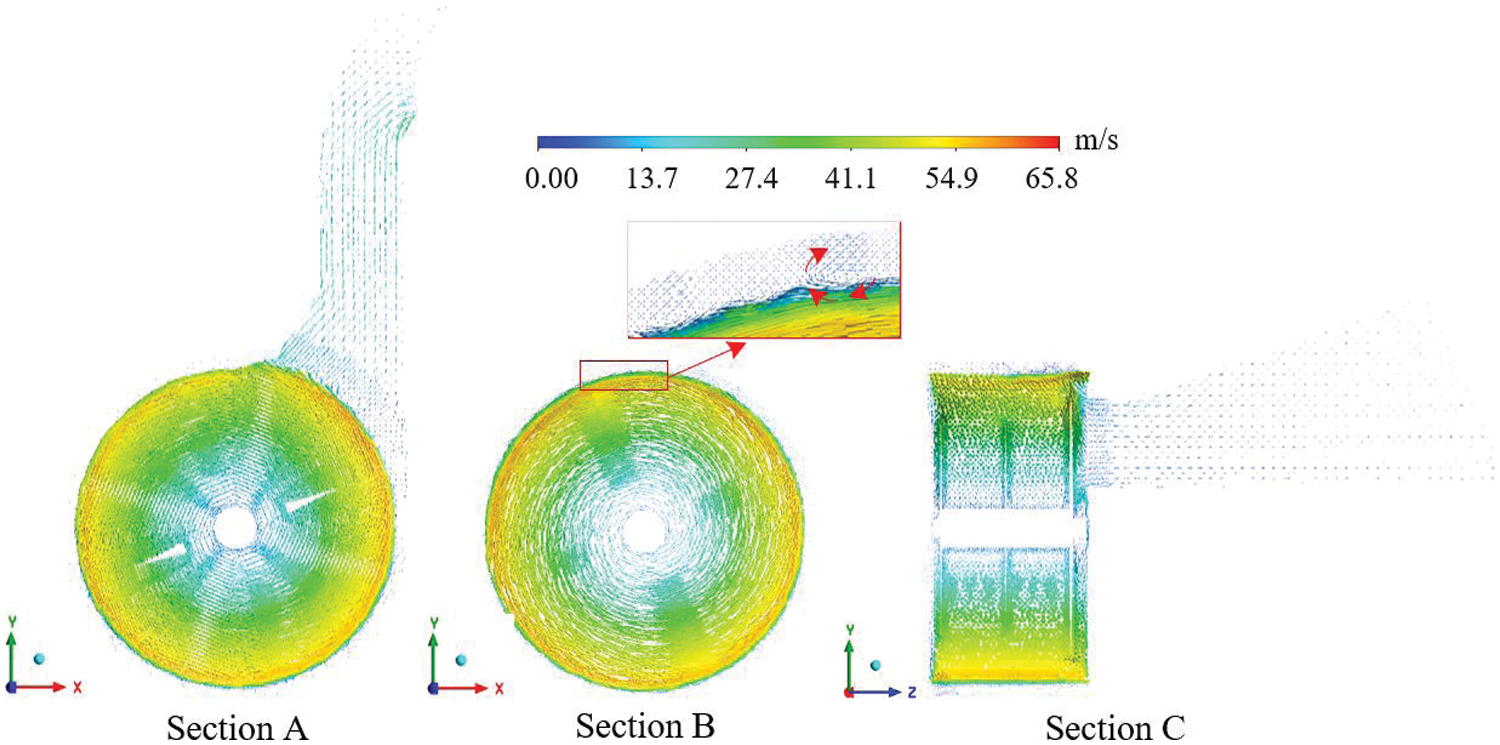
Figure 8: Cross-sectional velocity vector diagram inside the straw tearing chopper
Fig. 8 demonstrates that the greatest airflow velocity, measuring 65.8 m/s, occurred near the tip of the hammer blade close to the discharge tube. Additionally, the internal airflow velocity of the straw crusher decreased toward the center of the rotor along the radial direction of the main shaft. The decrease in airflow velocity occurs due to the high-speed rotation of the crusher rotor, which causes the hammer blade frame to repeatedly strike and propel the air medium.
After entering the crushing chamber, the airflow is propelled by the rotor’s fan effect and negative pressure suction, leading to its circulation along the inner wall of the casing [21]. The presence of the circulation layer prevents the timely removal of crushed material. Larger particles of material tend to accumulate near the inner wall of the casing, while smaller particles remain suspended above the larger particles due to negative pressure suction. The interference of the tooth plate additionally leads to the accumulation of crushed material layer by layer on the inner wall of the casing until it is completely blocked [22]. As depicted in Section B of Fig. 8, the circulation layer contains numerous turbulences that contribute to the increased accumulation of crushed materials at the bottom of the casing.
2.4.2 Analysis of Trajectory Lines within the Crushing Chamber
Fig. 9 illustrates the internal path of airflow within the straw crusher. The airflow velocity in section A exceeds the linear velocity at the tip of the hammer. Additionally, the circulation layer is thinnest in the second 90° region along the rotation direction, which is consistent with the results in reference [23]. In addition, the airflow in the circulation layer of Section B and Section C was influenced by the tooth plate, leading to air flowing in the direction of the discharge tube at an inclined angle. The inclination angle of the tooth plate affects the airflow direction, which subsequently affects the axial passing performance of the crushed material. In Section C, the airflow trajectory exhibited an obvious trend toward the left, with a notable clustering of trajectory lines toward the position of the throwing blade. This is because the throwing blade plate created a localized area of negative air pressure in the crushing chamber when it rotated at high speed. The airflow was then directed into the throwing area due to the combined effect of the tooth plate. Therefore, the discharge performance of the crusher was influenced by the size of the throwing blade plate.
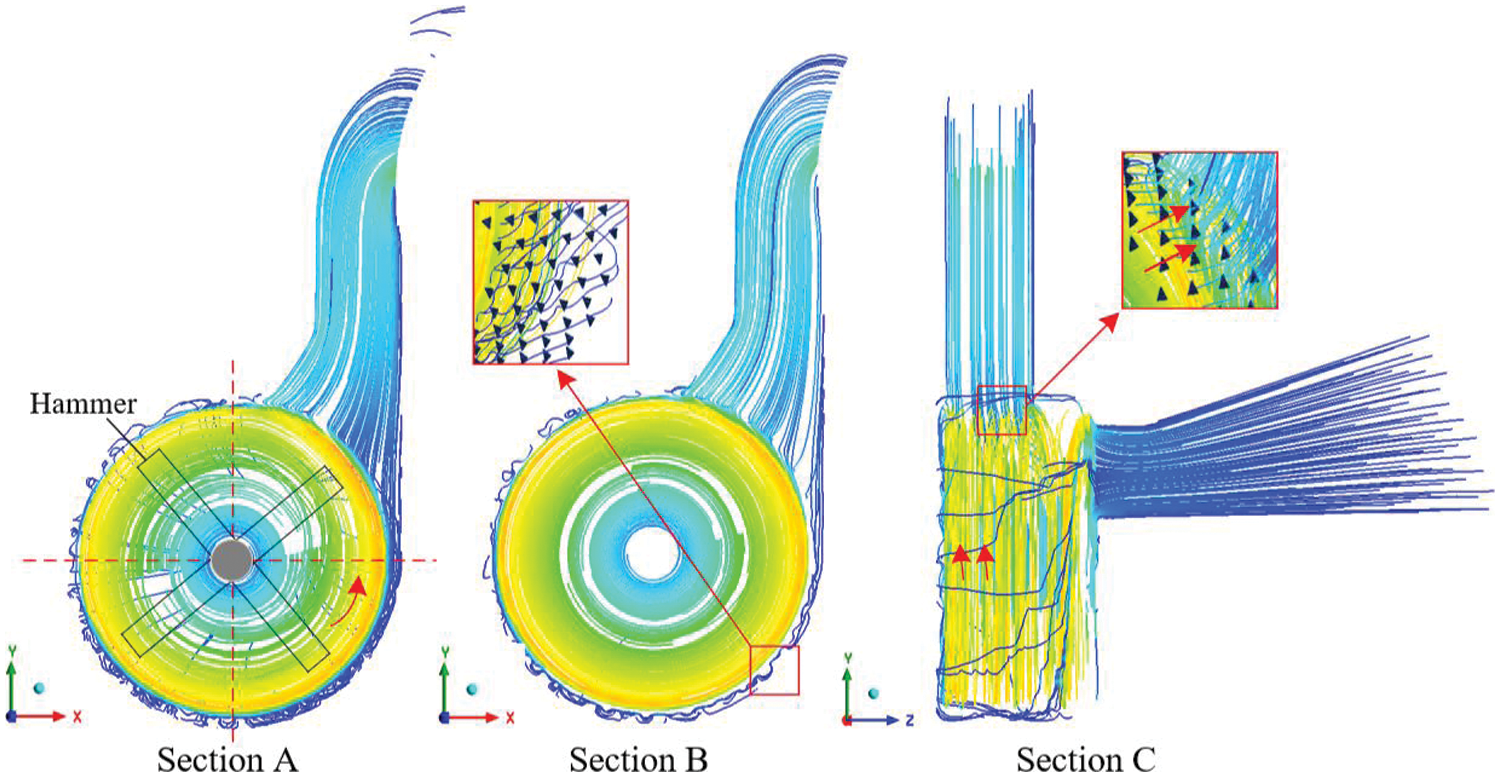
Figure 9: Cross-sectional velocity trace chart inside the straw tearing chopper
The average airflow velocity in the circulation layer was chosen as the analysis index to quantitatively examine the effects of different factors on airflow velocity. Fig. 10 illustrates the various factors affecting the airflow velocity in the circulation layer.
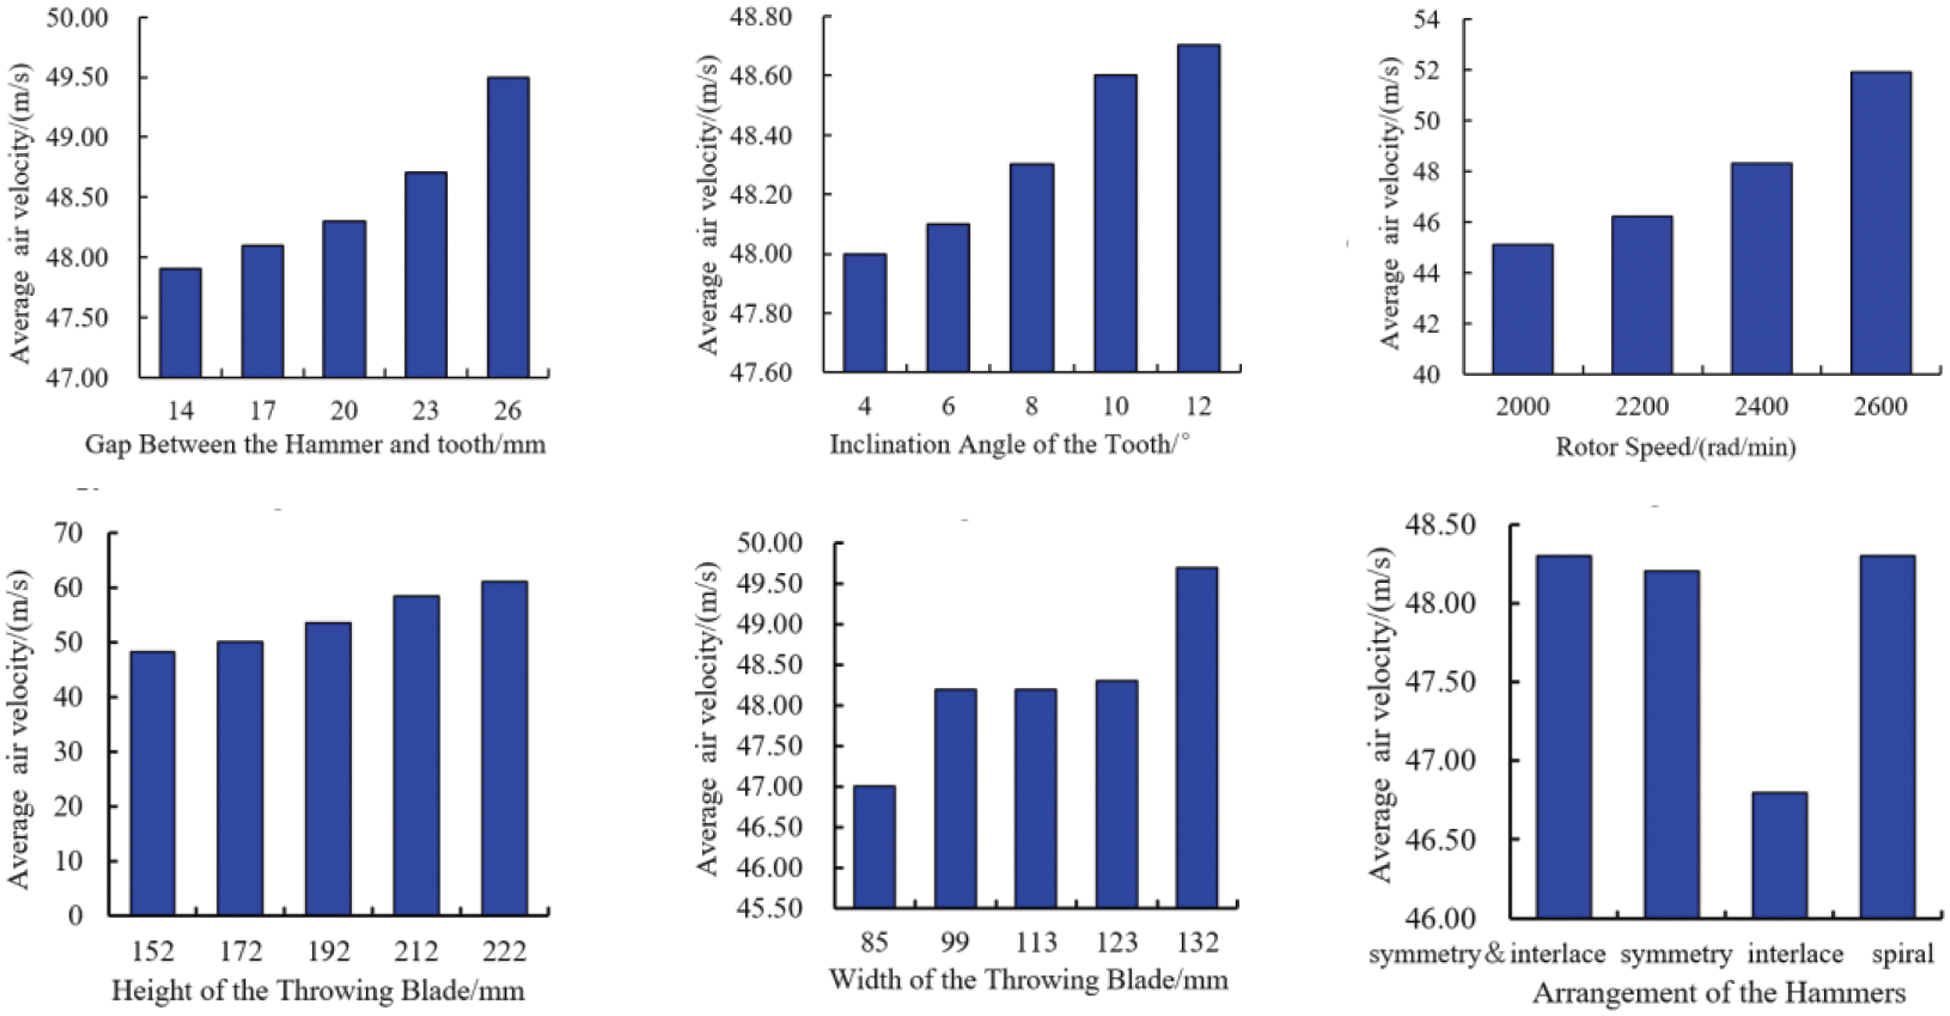
Figure 10: Influence of various factors on the airflow velocity within the circulating layer
Fig. 10 shows that the average airflow velocity within the circulation layer was significantly influenced by the gap between the hammer and rack, the inclined angle of the toothed plate, the rotor speed, and the height and width of the throwing blade, with each factor exhibiting a positive correlation. Additionally, the lowest airflow velocity of 46.8 m/s within the circulation layer was obtained with a staggered hammer arrangement. With the exception of this arrangement, the hammer arrangement appears to have little effect on the airflow velocity of the circulation layer. Consequently, the height and width of the throwing blade, the rotor speed, the inclined angle of the toothed plate, and the distance between the hammer and rack could all be used to control the airflow velocity within the circulation layer. Determining the most suitable combination of these variables can help to improve the discharge performance of crushers.
2.4.3 Analysis of Particle Motion Trajectories in the Crushing Chamber
The movement of the crushed material within the crusher was determined by the structural parameters and the distribution of airflow within the crusher. To depict the movement state of crushed straw, we modified the transparency of the DEM model of the machine, as shown in Fig. 11.
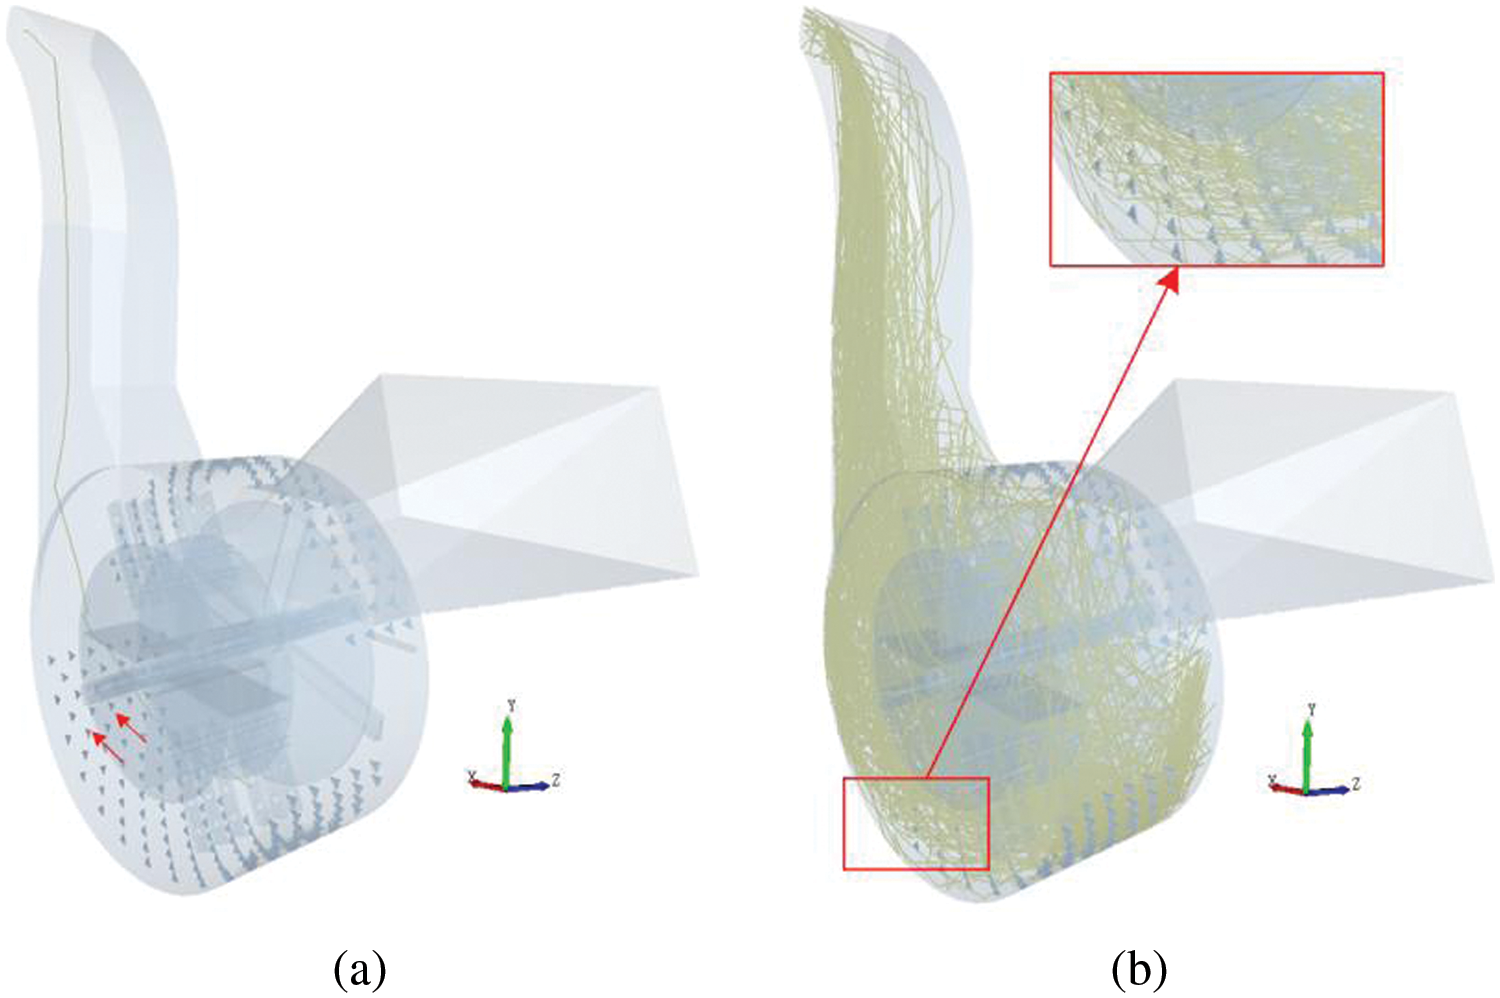
Figure 11: Movement trajectories of crushed materials. (a) Single particle movement trajectory. (b) Multiple particle movement trajectories
As shown in Fig. 11, the trajectories of multiple particles were remarkably consistent with those of single particles. After being generated by the particle factory, the particles followed the guide teeth plate and completed an entire rotation cycle inside the straw crusher until being discharged through the discharge tube. Because of the lack of initial velocity in the axial direction, the crushed straw was propelled along the −z axis direction exclusively by airflow and guided by the guide teeth plate. Owing to the structural parameters, such as the dimensions of the tooth plate and the effect of the intricate airflow within the straw crusher, crushed straw frequently accumulates at the crusher’s bottom. To measure the amount of material that accumulated in the circulation layer, the EDEM postprocessing module Geometry Bin (Fig. 7) was utilized. The simulation results indicate that there was a material accumulation of 0.57 × 10⁻³ m2 above the circulation layer, with a spatial occupancy rate of 20.17%. Once the space occupancy rate reaches 100%, the guide plate will fail, leading to a significant decrease in the crushing performance of the crusher. Hence, it is necessary to optimize the structures of straw crushers and reduce material accumulation to enhance their crushing efficiency.
2.4.4 Analysis of the Mass Flow Rate at the Straw-Tearing Chopper Outlet
To precisely assess the discharge performance of the straw crusher, we obtained the time–mass throughput curve of the material that leaves from the outlet, as shown in Fig. 12.
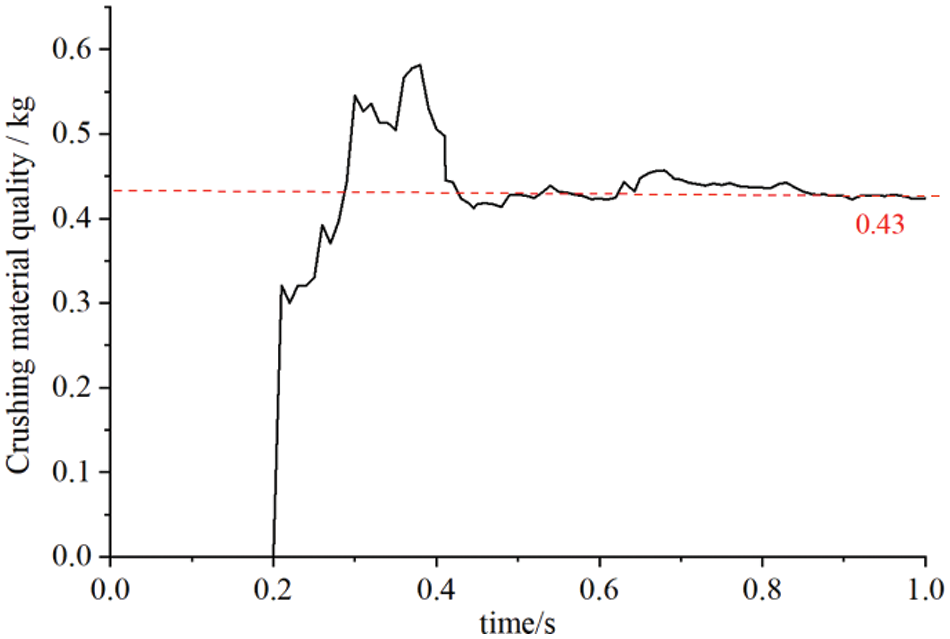
Figure 12: Average mass flow rate at the outlet
According to Fig. 12, the discharge of crushed material from the outlet starts at 0.2 s. During the time range from 0.2 to 0.3 s, there was a significant increase in the mass flow rate of the crushed material at the outlet. The mass flow rate remained below 0.43 kg/s. This is because during the initial phase of the crushing machine, the lighter inner pulp and straw leaves were susceptible to the influence of the airflow and were consequently discharged from the machine first. During the time period from 0.3 to 0.4 s, the rate at which crushed material flows out of the outlet increases significantly, briefly exceeding the rate at which material is being fed in (0.5 kg/s). This is because the heavier straw skin was held in the crusher chamber for less than 0.3 s. Subsequently, the inner pulp and straw leaves were discharged from the machine due to the combined effect of the air flow and rotor. During the time interval from 0.4 to 1.0 s, the mass flow rate of the crushed material at the outlet remains relatively stable at approximately 0.43 kg/s. However, it consistently remains lower than the feeding speed of 0.5 kg/s. This suggests that there is always a buildup of crushed material in the crusher chamber, indicating a retention phenomenon.
3 Structural Optimization of the Straw Crusher
At present, straw crushers are plagued by issues such as frequent blockages and insufficient crushing efficacy. Analyses suggest that the combination of the circulating layer and the structure of the straw crusher causes crushed materials to accumulate at the machine’s bottom. It is evident that an increased accumulation of crushed materials leads to a decrease in the effectiveness of the tooth, resulting in reduced crushing efficiency. Increasing the velocity at which the circulating layer moves along the axis can improve the trajectory of crushed materials in accordance with the principles of circulating layer formation. This measure can reduce the obstructive effect of the circulation layer on the discharge, thus decreasing the accumulation of materials at the bottom of the crusher. The Isight software was chosen in this study to enhance the axial velocity of the circulation layer. The parameters associated with the axial velocity of the circulation layer were subsequently chosen to optimize the discharge performance while preserving the efficiency of operation.
To obtain an initial kriging model, this study used the Latin hypercube sampling method to select 15 design points from the available design space. After checking the accuracy of the model, the multi-island genetic algorithm (MIGA) was applied to find the set of Pareto optimal solutions and the Pareto front in the prediction results of this surrogate model. Ultimately, the Pareto front yielded one or more models that were found to be optimal. The optimal solution was then confirmed through numerical simulation using the CFD–DEM method. Fig. 13 illustrates the optimization process.
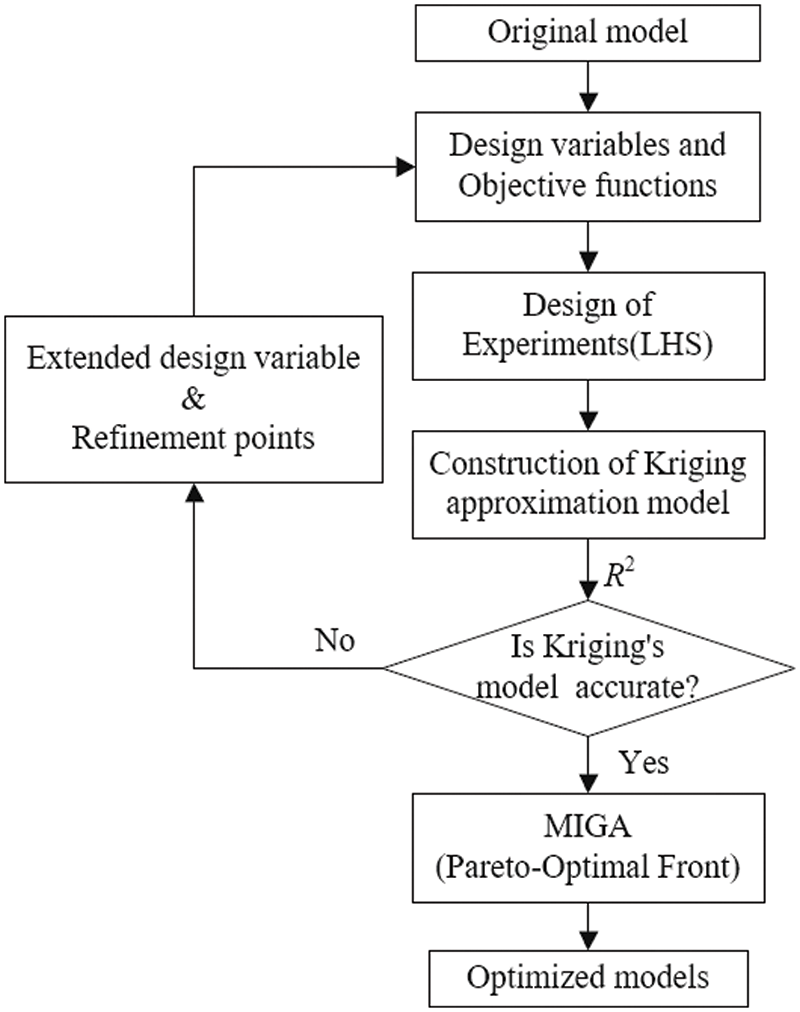
Figure 13: Process optimization
3.2 Objective Function, Design Variables and Constraints
The discrete distribution of the coupled flow field at the central cross-section of the circulating layer was denoted as N1, representing the axial velocity of the circulating layer. To facilitate the discharge of the material, the objective of optimization is to maximize N1. The optimization objective function can be precisely defined in the following manner:
The speed of the rotor has a direct impact on the performance of the straw crusher. To optimize the crushing efficiency and straw quality, it is advisable to set the rotational speed of the rotor within the range of 2000–2600 r/min. The dimensions of the throwing blade affect the velocity of airflow within the crushing chamber [24]. Increasing the width of the throwing blade leads to a higher axial velocity of the airflow in the crushing chamber, which in turn causes inadequate material crushing. Conversely, it will result in an excessive amount of crushing. The same inference can be made for the height of the throwing blade. To ensure that the width of the throwing blade (BB) does not interfere with the installation of the hammers or their throwing abilities, the allowable range for optimizing the BB was set to 85–132 mm. Additionally, to avoid any structural interference, the maximum height (BH) of the throwing blade must not exceed the maximum working diameter of the hammer blades, while the minimum height should be lower than the current value. The previous simulation results indicate a positive correlation between the rack inclination angle and the airflow velocity in the crushing chamber. However, excessively large rack inclination angles obstruct material flow. The optimization range for this parameter was chosen as 30% of the original structural parameter. The distance between the hammer and the rack was the crucial parameter that determined the impact of the crushing process. The optimization variables were set within the range of 4°–12°, as specified by the design criteria [25].
The air velocity of the crusher is significantly influenced by the rotation speed (R) of the rotor, inclination angle of the tooth (AN), width of the throwing blade (BB), height of the throwing blade (H), and gap between the hammer and tooth (I). Therefore, these factors were chosen as the optimization design variables. The optimization parameters X are represented by Eq. (6), while the constraint function, represented by Eq. (7), defines the range within which the optimization was performed.
To determine the mathematical correlation between the airflow velocity and the structural parameters of the crusher, a Kriging approximation model was obtained based on the influencing factors. The response values were obtained through simulation calculations, and a sample database was built. Typically, when creating experiments using the optimized Latin Hypercube method, the quantity of sample points required to generate initial surrogate models and perform error analysis should be at least double the number of design variables [26]. Therefore, taking into account both the computational efficiency and model accuracy, this study chose 15 sample points. Table 6 displays the main points of the results from the experimental design, which were obtained using the optimized Latin Hypercube method.

This study utilized the coefficient of determination, R2, to evaluate the accuracy of the constructed Kriging surrogate model. Typically, the R2 value varies between 0 and 1. Values above 0.85 suggest that the surrogate model has a reliable level of accuracy in fitting. A higher R2 value indicates greater model precision. The formula for calculating the coefficient of determination (R2) is provided below:
In Eq. (8),
The calculation shows that the fitting accuracy R2 for N1 is 0.99949, which is greater than 0.9. It indicates that the adopted Kriging surrogate model meets the required precision standards.
3.3 Analysis of the Structural Optimization Results of the Straw Crusher
The multi-island genetic algorithm was used to optimize the global optimization in the optimization region. Considering the balance between the optimal solution and the number of calculations, the settings are shown in Table 7.

After 1001 iterations, a set of optimal results was obtained, as summarized in Table 8.

Based on the optimization results, the three-dimensional model of the straw crusher was reconstructed, and the simulation calculation of the coupled flow field was performed again. The results before and after optimization are compared in Fig. 14.
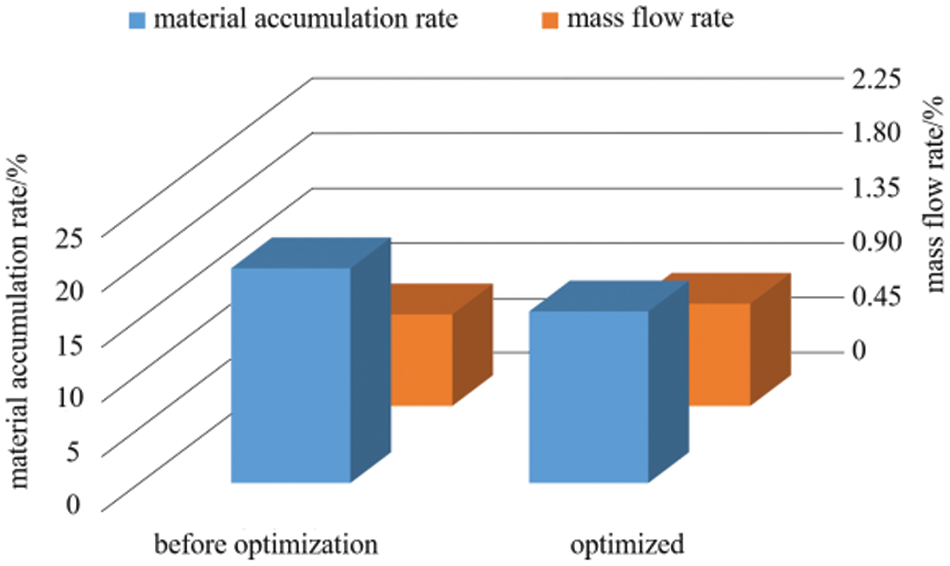
Figure 14: Comparison of the results before and after optimization
Fig. 14 shows that the accumulation of crushed materials at the bottom of the kneader was 16.12%, which was 20.08% lower than the value before optimization (20.17%). Additionally, the mass flow rate of the outlet after optimization was 0.48 kg/s, which was 11.63% higher than the value before optimization (0.43 kg/s). Optimization significantly enhanced the ability of the crusher to remove crushed material.
This study used the CFD–DEM coupling method to computationally model the gas–solid coupled flow field in a straw crusher. The simulation results allowed for the optimization of the crushed material removal performance of the straw crusher, resulting in the following conclusions:
1. The results of the experiment showed that the crushed materials consisted mainly of powdered material, filamentous material, and fragmentary material, accounting for 48.7%, 36.8%, and 14.5%, respectively, of the total materials. Filamentous materials are the main component of the material in the chamber of the crusher.
2. The coupling flow field in the crusher was numerically calculated using the accurate DEM model of straw and the numerical model of the flow field in the chamber of the crusher. The findings indicate the presence of a layer circulating between the rotor and the crusher rack, which had an effect on the discharge performance of the crusher. The gap between the hammer and the rack, the inclination angle of the rack, the rotor speed, and the height and width of the blade all had significant impacts on the average airflow velocity in the circulation layer. Furthermore, there is a positive correlation between each of these factors and the airflow velocity. The trajectory of the crushed straw material in the crusher was related to the angle of inclination of the rack. A larger inclination angle of the rack hindered the continuous discharge of the crushed material, leading to the accumulation of crushed material at the bottom of the crusher.
3. The discharge performance of the crusher was determined through calculation and analysis of the structural and working parameters. The MIGA method was used to improve the flow characteristics of the coupled flow field in the straw crusher. The optimal parameter combination for the straw crushing machine was identified under the premise of guaranteeing the crushing quality. The following are the recommended parameters: rotational velocity of 2600 r/min, vertical spacing between teeth of 18.5 mm, inclination angle of the rack of 6°, and width and height of the throwing leaf plate of 120 and 150 mm, respectively. Following the optimization process, the rate at which tearing materials accumulate at the bottom of the crusher decreased by 20.08%, while the mass flow rate at the discharge outlet increased by 11.63%.
4. The optimization results indicate that increasing the rotor speed appropriately was a viable method for enhancing the discharge capacity of the crusher. Furthermore, the inclination angle of the rack and excessive height of the rack have significant effects on the discharge capacity of the crusher. The analysis demonstrated that the conclusion is equally applicable to hammer-crushing machinery of different sizes within the same category.
Ultimately, the discharge performance of the optimized straw crusher was effectively improved. This research can provide a reference for the design and optimization of feed processing machinery.
Acknowledgement: None.
Funding Statement: This study was supported by Basic scientific research funding project of universities directly under the Inner Mongolia Autonomous Region (Grant No. JY20230077); the Natural Science Foundation of Inner Mongolia Funded Project (Grant No. 2022FX01); Inner Mongolia Nature Joint Science Fund (Grant No. 2023LHMS05023); Qiqihar University Educational Science Research Project (Grant No. GJQTYB202320).
Author Contributions: The authors confirm contribution to the paper as follows: study conception and design: Yuezheng Lan; analysis and interpretation of results: Yu Zhao, Zhiping Zhai; draft manuscript preparation: Yu Zhao, Fushun Li; data collection: Meihua Fan. All authors reviewed the results and approved the final version of the manuscript.
Availability of Data and Materials: The authors confirm that the data supporting the findings of this study are available within the article.
Ethics Approval: Not applicable.
Conflicts of Interest: The authors declare that they have no conflicts of interest to report regarding the present study.
References
1. Liu CJ, Zhao X. Characteristics of gas-solid two-phase circulation layer in hammer mill and its influence on grinding and screening process. Trans Chin Soc Agric Mach. 1991;3(3):36–43 (In Chinese). [Google Scholar]
2. Silvester SA, Lowndes IS, Kingman SW, Arroussi A. Improved dust capture methods for crushing plant. Appl Math Model. 2007;31(2):311–31. doi:10.1016/j.apm.2005.11.005. [Google Scholar] [CrossRef]
3. Delaney GW, Morrison RD, Sinnott MD, Cummins S, Cleary PW. DEM modelling of non-spherical particle breakage and flow in an industrial scale cone crusher. Miner Eng. 2015;74(3):112–22. doi:10.1016/j.mineng.2015.01.013. [Google Scholar] [CrossRef]
4. Liu F, Wang W, Zhang T, Ma Q, Zhao MQ. Numerical simulation and experiment of flow field in hammer crusher. Trans Chin Soc Agric Mach. 2018;49(S1):227–32 (In Chinese). [Google Scholar]
5. Ma Q, Liu F, Zhao MQ. Research on flow field in crusher based on sliding mesh technology. Agric Mech Res. 2016;38(12):1–6+11 (In Chinese). [Google Scholar]
6. Pei G, Zhai ZP, Lan YZ, Shi SC. Analysis of material-air coupling motion characteristics in multi-function forage kneading machine. Trans Chin Soc Agric Mach. 2023;54(S2):156–63 (In Chinese). [Google Scholar]
7. Lisowski A, Swiatek K, Klonowski J, Sypula M, Chlebowski J, Nowakowski T, et al. Movement of chopped material in the discharge spout of forage harvester with a flywheel chopping unit: measurements using maize and numerical simulation. Biosyst Eng. 2012;111(4):381–91. doi:10.1016/j.biosystemseng.2012.01.003. [Google Scholar] [CrossRef]
8. Liu C, Chen ZB, Zhang WL, Yang CG, Mao Y, Yu YJ, et al. Effects of blade parameters on the flow field and classification performance of the vertical roller mill via numerical investigations. Math Probl Eng. 2020;2020:1–15. [Google Scholar]
9. Jeong IK, Lee DM, Lim JT, Seo HY, Kang CG. Study on flow pattern according to rotor design parameter of sewage sludge solid fuel crusher. J Electr Eng Technol. 2020;15(3):1471–9. doi:10.1007/s42835-020-00404-x. [Google Scholar] [CrossRef]
10. Delacroix B, Rastoueix J, Fradette L, Bertrand F, Blais B. CFD-DEM simulations of solid-liquid flow in stirred tanks using a non-inertial frame of reference. Chem Eng Sci. 2021;230(3):116137. doi:10.1016/j.ces.2020.116137. [Google Scholar] [CrossRef]
11. Wang M, Liu JB, Wang XF, Sun DD, Yue QH. Verification and analysis of hard sphere strengthening model in CFD-DEM coupling calculation. Chin J Comput Mech. 2023;40(2):198–207 (In Chinese). [Google Scholar]
12. Coetzee CJ. Calibration of the discrete element method and the effect of particle shape. Powder Technol. 2016;297:50–70. doi:10.1016/j.powtec.2016.04.003. [Google Scholar] [CrossRef]
13. General Administration of Quality Supervision, Inspection and Quarantine of the People’s Republic of China, Standardization Administration of China. Chinese national standard: forage crusher. Forage Crusher (GB/T 20788–2006); 2006. Available from: https://openstd.samr.gov.cn/bzgk/gb/newGbInfo?hcno=2EDF64A04854F225C64F5147D50F6646. [Accessed 2024]. [Google Scholar]
14. Mousaviraad M, Tekeste MZ. Systematic calibration and validation approach for discrete element method (DEM) modeling of corn under varying moisture contents (MC). J Asabe. 2024;67(2):259–74. doi:10.13031/ja.14763. [Google Scholar] [CrossRef]
15. Chiaravalle AG, Cotabarren IM, Pina J. DEM breakage calibration for single particle fracture of maize kernels under a particle replacement approach. Chem Eng Res Design. 2023;195:151–65. doi:10.1016/j.cherd.2023.05.015. [Google Scholar] [CrossRef]
16. Zhou Z. Science of agricultural materials. Beijing: China Agriculture Press; 1994. [Google Scholar]
17. Cui T, Jing MS, Zhang DX, Yang L, He XT, Wang ZD. Construction of corn ear discrete element model and simulation verification of threshing. Trans Chin Soc Agric Eng. 2022;194:1–14. [Google Scholar]
18. Zhang RY. Research on compression mechanism and optimization of process parameters of shredded corn stalk based on discrete element method (Master Thesis). Jilin University: China; 2023. [Google Scholar]
19. Mousaviraad M, Tekeste M, Rosentrater KA. Calibration and validation of a discrete element model of corn using grain flow simulation in a commercial screw grain auger. Trans ASABE. 2017;60(4):1403–16. doi:10.13031/trans.12200. [Google Scholar] [CrossRef]
20. Madrid MA, Fuentes JM, Ayuga F, Gallego E. Determination of the angle of repose and coefficient of rolling friction for wood pellets. Agronomy. 2022;12(2):424–4. doi:10.3390/agronomy12020424. [Google Scholar] [CrossRef]
21. Wang DF, Wang M, Li LQ. Mechanism analysis and parameter optimization of hammer mill crushing corn stalk. Trans Chin Soc Agric Mach. 2017;48(11):165–71 (In Chinese). [Google Scholar]
22. Wang D. Study on the influence of screen shape change on the flow field characteristics of hammer mill (Master Thesis). Inner Mongolia Agricultural University: China; 2019. [Google Scholar]
23. Takeuchi H, Nakamura H, Iwasaki T, Watano S. Numerical modeling of fluid and particle behaviors in impact pulverizer. Powder Technol. 2012;217:148–56. doi:10.1016/j.powtec.2011.10.021. [Google Scholar] [CrossRef]
24. Adebayo B, Ajaka EO, Afeni TB, Taiwo BO, Okewale IA, Lawal AI, et al. Enhancing downstream operation through run-of-mine crusher selection model: an application of edge detection software and soft computing algorithms. Arab J Geosci. 2024;17(4):1–12. doi:10.1007/s12517-024-11933-4. [Google Scholar] [CrossRef]
25. China Agricultural Machinery Research Institute. Agricultural product processing machinery. Beijing: China Agricultural Science and Technology Press; 2007. [Google Scholar]
26. Sanjit KM. Digital signal processing. New York: McGraw-Hill Companies; 2004. [Google Scholar]
Cite This Article
 Copyright © 2024 The Author(s). Published by Tech Science Press.
This work is licensed under a Creative Commons Attribution 4.0 International License , which permits unrestricted use, distribution, and reproduction in any medium, provided the original work is properly cited.


 Submit a Paper
 Propose a Special lssue
 View Full Text
 Download PDF
 Downloads
 Citation Tools