 Open Access
ARTICLE
The Wellbore Temperature and Pressure Behavior during the Flow Testing of Ultra-Deepwater Gas Wells
1 Exploration Department, CNOOC China Limited Shanghai Branch Company, Shanghai, 200335, China
2 Petroleum Engineering School, Southwest Petroleum University, Chengdu, 610500, China
3 Exploration and Development Department, CNOOC China Limited Hainan Branch Company, Haikou, 570300, China
* Corresponding Author: Mingqiang Wei. Email:
(This article belongs to the Special Issue: Fluid and Thermal Dynamics in the Development of Unconventional Resources II)
Fluid Dynamics & Materials Processing 2024, 20(11), 2523-2540. https://doi.org/10.32604/fdmp.2024.052766
Received 14 April 2024; Accepted 17 July 2024; Issue published 28 October 2024
Abstract
The transient flow testing of ultra-deepwater gas wells is greatly impacted by the low temperatures of seawater encountered over extended distances. This leads to a redistribution of temperature within the wellbore, which in turn influences the flow behavior. To accurately predict such a temperature distribution, in this study a comprehensive model of the flowing temperature and pressure fields is developed. This model is based on principles of fluid mechanics, heat transfer, mass conservation, and energy conservation and relies on the Runge-Kutta method for accurate integration in time of the resulting equations. The analysis includes the examination of the influence of various factors, such as gas flow production rate, thermal diffusivity of the formation, and thermal diffusivity of seawater, on the temperature and pressure profiles of the wellbore. The key findings can be summarized as follows: 1. Higher production rates during testing lead to increased flowing temperatures and decreased pressures within the wellbore. However, in the presence of a seawater thermocline, a crossover in flowing temperature is observed. 2. An increase in wellbore pressure is associated with larger pipe diameters. 3. Greater thermal diffusivity of the formation results in more rapid heat transfer from the wellbore to the formation, which causes lower flowing temperatures within the wellbore. 4. In an isothermal layer, higher thermal diffusivity of seawater leads to increased wellbore flowing temperatures. Conversely, in thermocline and mixed layer segments, lower temperatures are noted. 5. Production test data from a representative deep-water gas well in the South China Sea, used to calculate the bottom-seafloor-wellhead temperature and pressure fields across three operating modes, indicate that the average error in temperature prediction is 2.18%, while the average error in pressure prediction is 5.26%, thereby confirming the reliability of the theoretical model.Keywords
Nomenclature

Currently, offshore oil and gas exploration and development is developing from deep water to ultra-deep water (water depth exceeding 1500 m) [1,2]. During the flow testing of ultra-deepwater gas wells, the heat in the gas dissipates from the wellbore to the formations and cold seawater. This leads to changes in the wellbore flowing temperature and pressure profile, as well as natural gas hydrate formation in the wellbore. These changes have the potential to cause blockage of the pipe string [3,4]. Accurately predicting wellbore temperature and pressure distribution is crucial for preventing hydrate formation during production flow testing and optimizing production testing procedures. Since the 1960s, based on the principle of energy balance, Raymond [5] first proposed a numerical model for heat transfer of fluid flowing between the wellbore and formation. Considering heat transfer between wellbore fluid and formation, Ramey [6] derived an analytical solution for the temperature field of flowing wellbore fluid when it is injected or produced. Subsequently, researchers such as Alves et al., Hasan et al., Sagar et al., and Kabir et al. [7–10] improved upon Ramey’s model and expanded its applicability. Based on this foundation, Xiao et al. [11–14] conducted studies on the temperature and pressure profiles of high-temperature and high-pressure gas wells, horizontal wells, CO2 injection wells, and multi-zone combination vertical wells.
In general, there are three main approaches or methods for calculating wellbore pressure-temperature distributions of the fluid flowing: (1) Separate the pressure appropriately and calculate the flowing temperature distribution of wellbore fluids approximately based on the steady-state heat transfer principle. (2) Calculate the bottom hole pressure by averaging the wellbore temperature either overall or discretely in sections. (3) The calculation involves the coupling of pressure and temperature. Unlike the production flow in onshore oil and gas wells, the temperature gradient in the seawater section of offshore gas wells is opposite to that of the formation. This leads to significant differences in the characteristics of wellbore flowing temperature and pressure profiles. Taking into account the temperature characteristics of the seawater section. Song et al. [15] established a coupling model for calculating the wellbore temperature distribution of gas-liquid flow in deep Wells. Lin et al. [16] proposed an offshore wellbore heat transfer model using the coupling calculation method. Gao et al. [17] established a mathematical model for wellbore temperature prediction during deepwater drilling based on the comprehensive heat transfer of the wellbore in the formation section and the convective heat transfer between the wellbore and seawater in the seawater section. Wang et al. [18] established a prediction model for the deposition of deepwater gas Wells under shut-in conditions to analyze the effects of shut-in time and temperature on the amount of hydrate deposition. Liu et al. [19] developed an improved thermal model for predicting wellbore temperature in deepwater gas wells to analyze the effects of annular parameters on wellbore temperature.
In summary, although numerous scholars have conducted research on prediction models and variations of wellbore flowing temperature fields in onshore gas wells and deepwater gas wells, there is limited research on the prediction and patterns of wellbore flowing temperature fields in ultra-deepwater test wells. This lack of research results in an unclear understanding of the characteristics and patterns of wellbore flowing temperature-pressure field variations during ultra-deepwater gas well production flowing testing processes. Therefore, considering the temperature characteristics of ultra-deepwater environments, a coupled model of wellbore flowing temperature-pressure in ultra-deepwater gas well tests was established based on fluid mechanics theory, heat transfer theory, mass conservation, and energy conservation laws. The model accounts for non-steady-state heat transfer and nonlinear changes in gas high-pressure properties. The fourth-order Runge-Kutta method was used to calculate the temperature and pressure distributions to reveal the influence patterns of relevant parameters on the flowing temperature and pressure profiles. The research findings have significant theoretical implications for the safe and efficient production flowing testing of ultra-deepwater gas fields as well as for ensuring wellbore flow assurance.
2 Ultra-Deepwater Gas Well Test Wellbore Temperature-Pressure Field Prediction Model
Based on the characteristics of temperature variations during ultra-deepwater gas well testing, the entire ultra-deepwater testing system can be divided into two parts: the ultra-deepwater segment and the formation segment. The deepwater segment primarily involves heat transfer issues among seawater, casing, fluid inside the casing, test string, and fluid inside the string; while the second part is the wellbore section below the mudline, namely the formation segment. This mainly deals with heat transfer among the formation, cement sheath, casing, annular fluid, test string, and fluid inside the string. As shown in Fig. 1 (see below), this is a physical model of the wellbore temperature field for ultra-deepwater testing. Due to opposite trends in temperature gradients between seawater and the formation as well as different heat transfer conditions in both casing and wellbore string segments; therefore, the temperature field model is divided into two segments: namely-the formation segment and-the seawater segment.
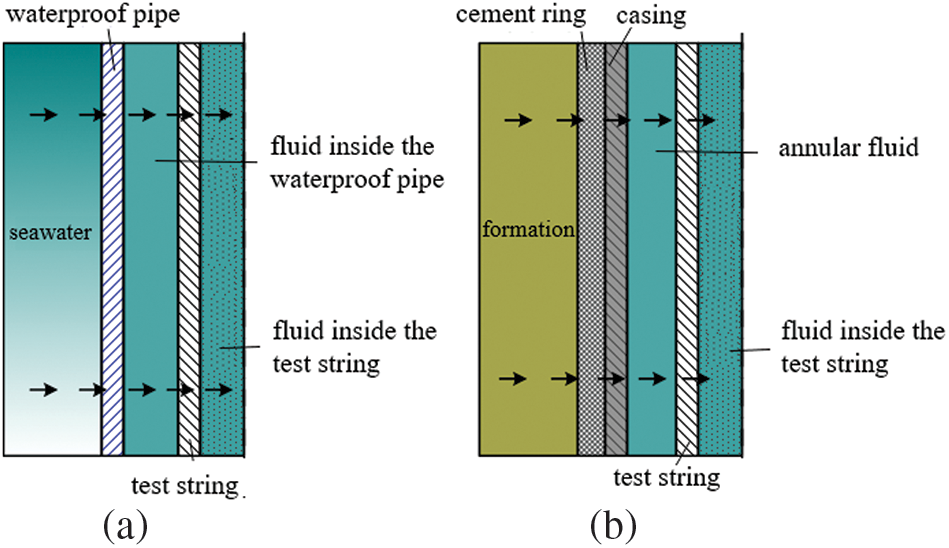
Figure 1: Physical model of wellbore temperature field for deepwater testing, (a) deepwater section, (b) formation section
2.1 The Calculation Model of Wellbore Temperature Field
2.1.1 Establishment of the Mathematical Model for the Temperature Field in the Formation Section
Model assumptions:
1). The gas flow inside the test string is assumed to be steady one-way flow.
2). Heat transfer in the wellbore of ultra-deepwater wells is considered to be steady heat transfer.
3). Heat transfer in the formation is assumed to be unsteady heat transfer, following the dimensionless time function recommended by Remay.
4). Oil and casing (casing string) are assumed to be concentric.
Taking the mud line wellhead as the coordinate origin, with the coordinate z positive downwards along the test string, an elemental body as shown in Fig. 2 is established.
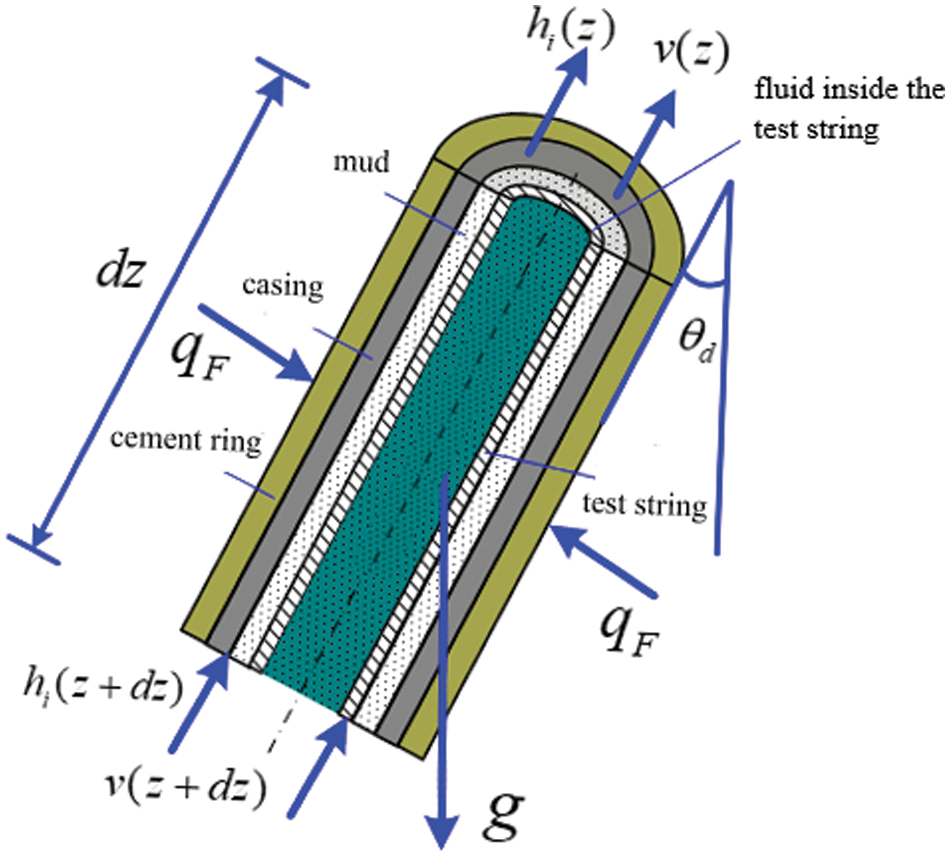
Figure 2: Heat transfer analysis of the formation section test string elemental body
The gas flow inside the test string satisfies the conservation of momentum and energy, as shown in Eqs. (1) and (2):
The equation of state for a gas:
By combining Eqs. (1) and (3), we have:
For the energy conservation Eq. (2) [4]:
The temperature at the well-formation interface and the energy in the wellbore satisfy:
Overall heat transfer coefficient Ua [20]:
By combining Eqs. (6) and (7), we can obtain:
The energy Eq. (5) can be transformed into [21]:
In the fluid energy Eq. (10) within the wellbore, the specific enthalpy of the gas is a function of temperature and pressure, given by the following equation:
Since the gas flows within the test column and the pipe diameter variation is generally small, the Joule-Thomson coefficient is very small and can be neglected. Therefore, we can consider:
Therefore, we have:
The temperature gradient in the wellbore is [7]:
2.1.2 Establishment of Mathematical Model for Seawater Segment
Similarly, based on the formation temperature model, the mathematical model for the seawater segment is established from an energy perspective as follows:
The overall heat transfer coefficient of the seawater segment [7] is:
Boundary conditions:
According to the literature, the temperature distribution of the seawater segment can be expressed as [22]:
In Eq. (18) a0 = 130.1, a1 = 39.4, a2 = 37.1, a3 = 402.7.
2.2 Establishment of Wellbore Pressure Field Calculation Model
The physical interpretation expression of the pressure gradient in the fluid flow process in the wellbore [4]:
The gravitational potential energy in Eq. (19) is:
In Eq. (20), the frictional pressure drop includes:
In Eq. (21), the frictional stress in the mixed fluid is proportional to the kinetic energy possessed by the fluid elements in the small unit volume. Introducing the friction coefficient, the frictional stress in the mixed fluid is given by:
The mixed flow velocity vm is expressed as:
The expression for the acceleration pressure drop in Eq. (19) is:
For the liquid phase, the compressibility is much smaller compared to the compressibility of the gas phase, which can be neglected, leading to:
Substituting Eqs. (20), (21), (24), and (25) into (19) yields [6]:
2.3 Solution of Coupled Model of Test Wellbore-Temperature Field in Ultra-Deepwater Gas Wells
The Eq. (27) is formed by the wellbore flow temperature gradient and pressure drop model. Given the fluid temperature T0 and pressure p0 at the interface x0 at the well bottom, discretize the equation system and solve it using the fourth-order Runge-Kutta method.
The general form of the fourth-order Runge-Kutta method can be written as Eq. (28):
By substituting Eq. (28) into the temperature and pressure gradient equations in Eq. (27), we can solve to obtain temperature and pressure solutions at different depths.
If the expected depth is not reached, the calculated value of the node is used as the starting value for the next step, and the above steps are repeated so that the continuous forward calculation is until the expected depth. The solution steps for ultra-deepwater wellbore temperature and pressure field testing are as follows:
(1) Firstly, the temperature and pressure field of the formation section is solved. Taking the mud line wellhead as the starting point, the step size is selected, and the four-order Runge-Kutta method is used to solve the problem point by point to the bottom of the well.
(2) Substituting the boundary conditions at the bottom of the hole and reversely calculating to the wellhead of the mud line, the temperature and pressure field distribution of the formation section is obtained.
(3) The temperature and pressure field of the seawater segment is then solved. Taking the platform wellhead as the starting point, the step size is selected and the four-order Runge-Kutta method is applied to solve the problem point by point to the mud line wellhead.
(4) Substitute the boundary conditions of the mud line wellhead obtained in Step (2), inversely calculate the platform wellhead, and find the distribution of temperature and pressure field in the seawater section;
(5) Draw the temperature and pressure field distribution of the deepwater wellbore according to the results obtained from Steps (2) and (4).
The detailed flow chart is shown below (Fig. 3).
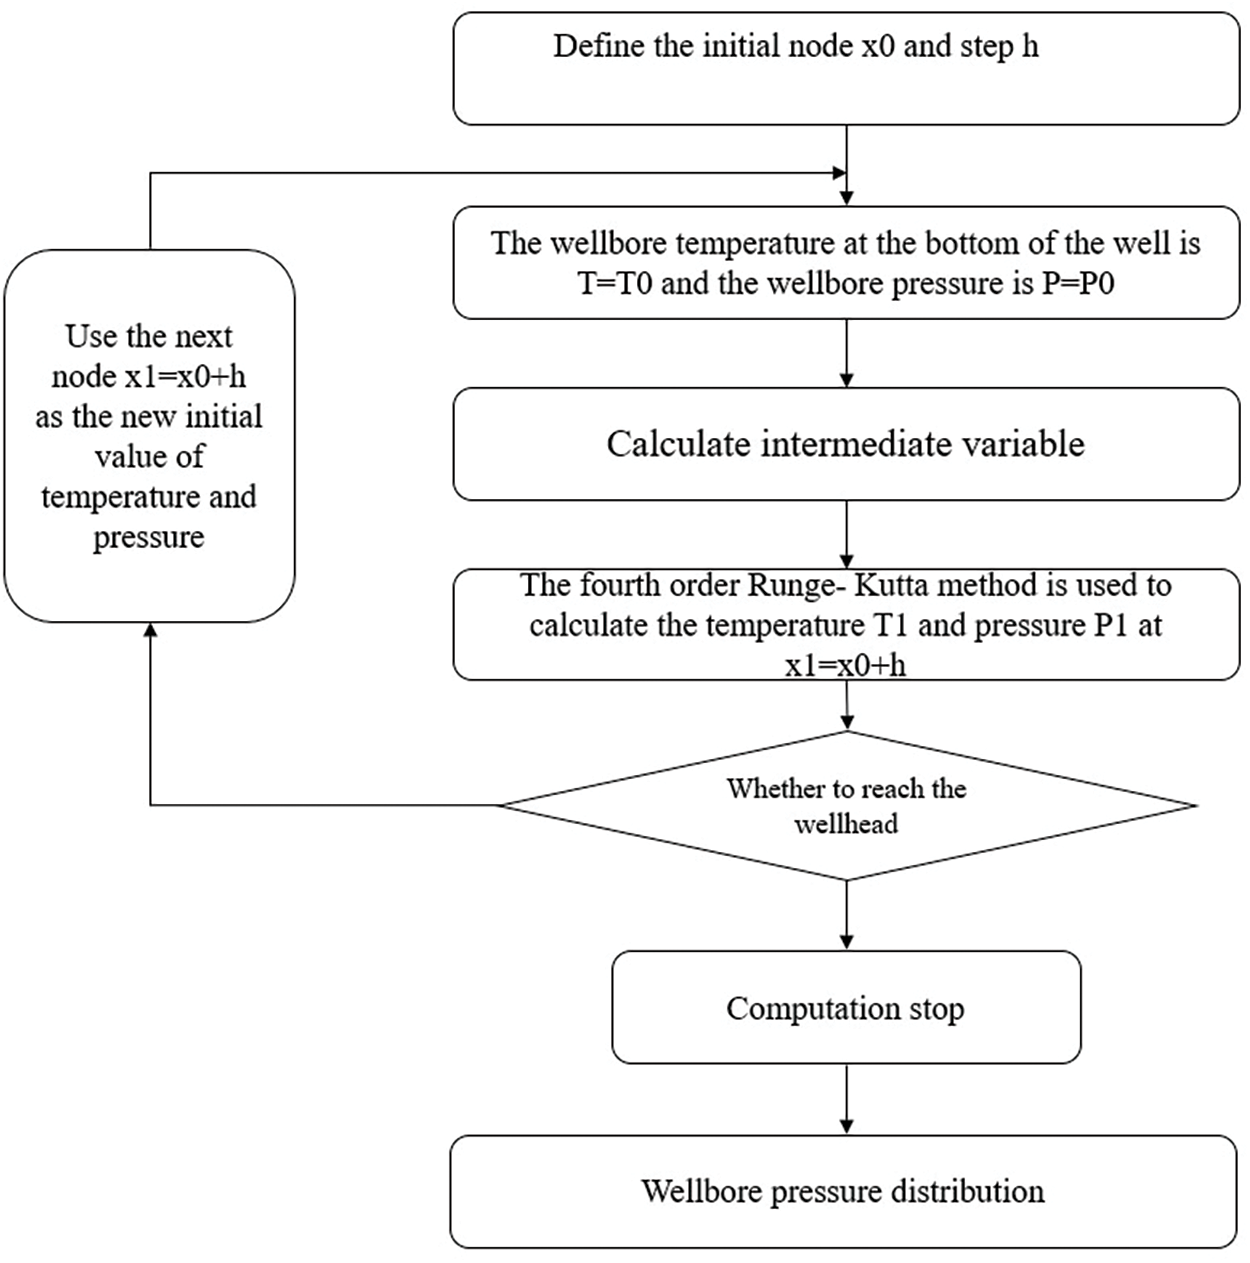
Figure 3: Solution flow chart
3 Prediction and Analysis of the Temperature Field in Ultra-Deepwater Gas Well Test Wellbore
3.1 Analysis of Factors Influencing the Temperature Field in the Wellbore
Based on the temperature field prediction model and solution method [23], the basic parameters (Table 1) are set, and calculations are programmed to discuss the effects of sensitivity parameters such as gas production rate, seawater thermal diffusivity, annulus convective heat transfer coefficient, and formation thermal conductivity on the temperature profile in the wellbore.

3.1.1 The Impact of Test Production on Temperature and Pressure
Fig. 4 illustrates the impact of gas well production on temperature and pressure. As shown in Fig. 4a, an increase in gas well production leads to a rise in the overall temperature within the wellbore. However, a crossover in the wellbore temperature occurs at the thermocline in the seawater section due to the thermal conductivity parameters of the seawater section. It is worth noting that anomalous crossovers in wellbore temperature with increasing test production are rare in deepwater gas well testing and production processes. Additionally, as depicted in Fig. 4b, there is a decrease in pressure with an increase in gas production rate. Furthermore, it can be observed that a greater increase in gas well production results in a greater decrease in wellbore pressure. In cases of low gas production, such as Q = 46 × 104m3/d, the pressure of the gas well increases almost linearly with the depth of the well (Fig. 4b).
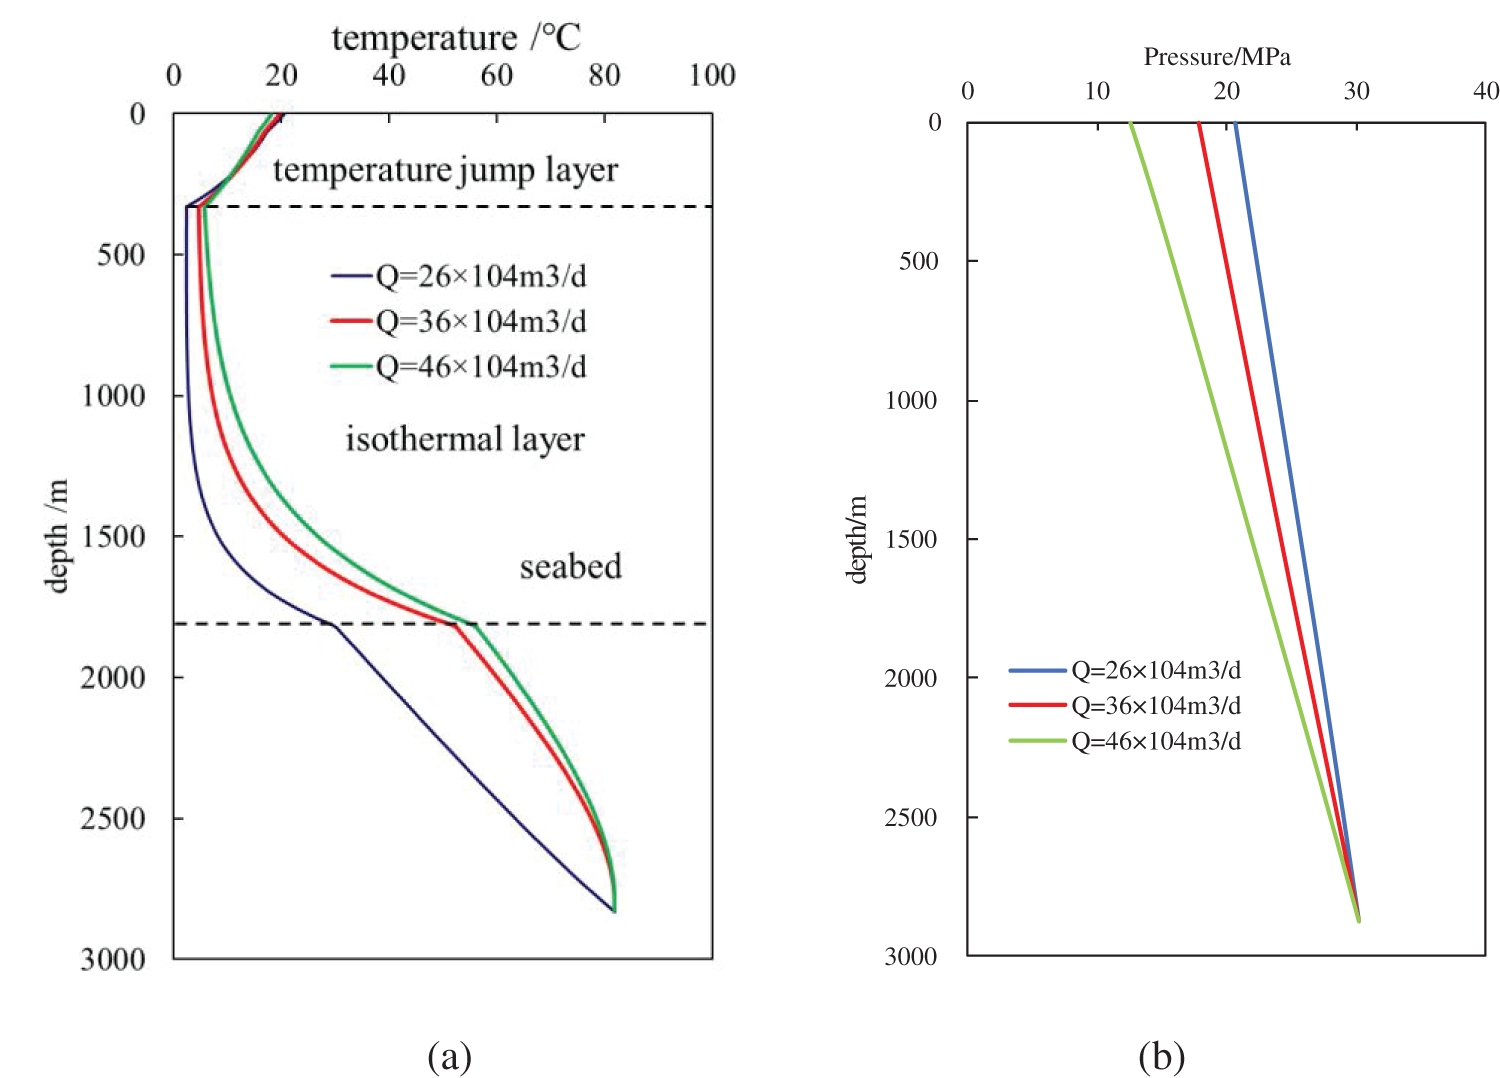
Figure 4: (a) Influence of gas well production on wellbore temperature; (b) Influence of gas well production on wellbore pressure
Fig. 5 presents the effect of inner diameter of tube on temperature and pressure. From Fig. 5, we can see that the inner diameter of tube affects the wellbore pressure significantly (Fig. 5b), but it nearly has no impact on the wellbore temperature (Fig. 5a). With the increase of the inner diameter of tube, the value of the wellbore pressure become larger. The main reason is that the flow friction and pressure loss of gas in small pipe diameter are greater with the same production rate.
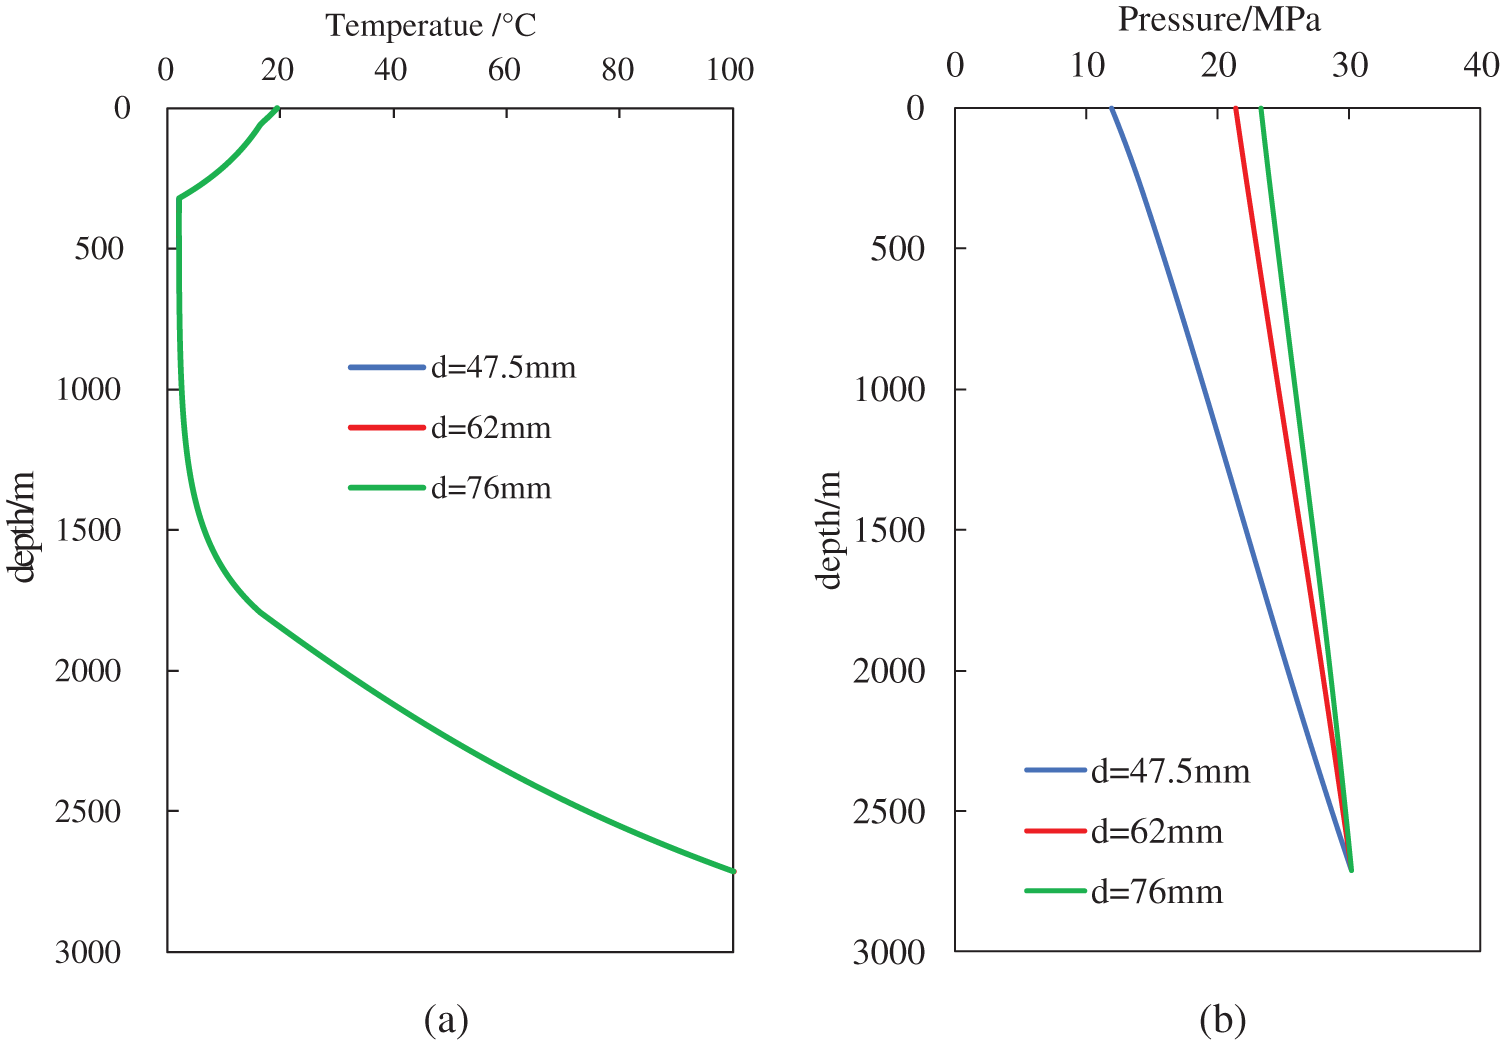
Figure 5: (a) Influence of inner diameter of tube on wellbore temperature; (b) Influence of inner diameter of tube on wellbore pressure
Fig. 6 illustrates the influence of the thermal diffusivity of the formation on wellbore temperature and pressure. It can be seen from the graph that the thermal diffusivity of the formation has a certain impact on the temperature field within the wellbore, but it has almost no effect on the wellbore pressure. A larger formation thermal diffusivity leads to faster heat transfer from the wellbore to the formation, resulting in lower wellbore temperatures.

Figure 6: (a) Influence of formation thermal diffusivity on wellbore temperature; (b) Influence of formation thermal diffusivity on wellbore pressure
Similarly, the following relevant parameters (e.g., formation thermal diffusivity, annular test fluid thermal conductivity, annular fluid heat radiation coefficient) also nearly have no impact on the wellbore pressure. To avoid redundancy, they will not be elaborated in the following text.
Fig. 7 illustrates the influence of formation thermal diffusivity on wellbore temperature in the aquifer section. The graph demonstrates that the thermal diffusivity of the aquifer section has a significant impact on wellbore temperature, compared to the formation thermal diffusivity. A larger thermal diffusivity of the aquifer results in higher wellbore temperatures in the isothermal aquifer section, while lower temperatures are observed in the thermocline and mixing zone sections.
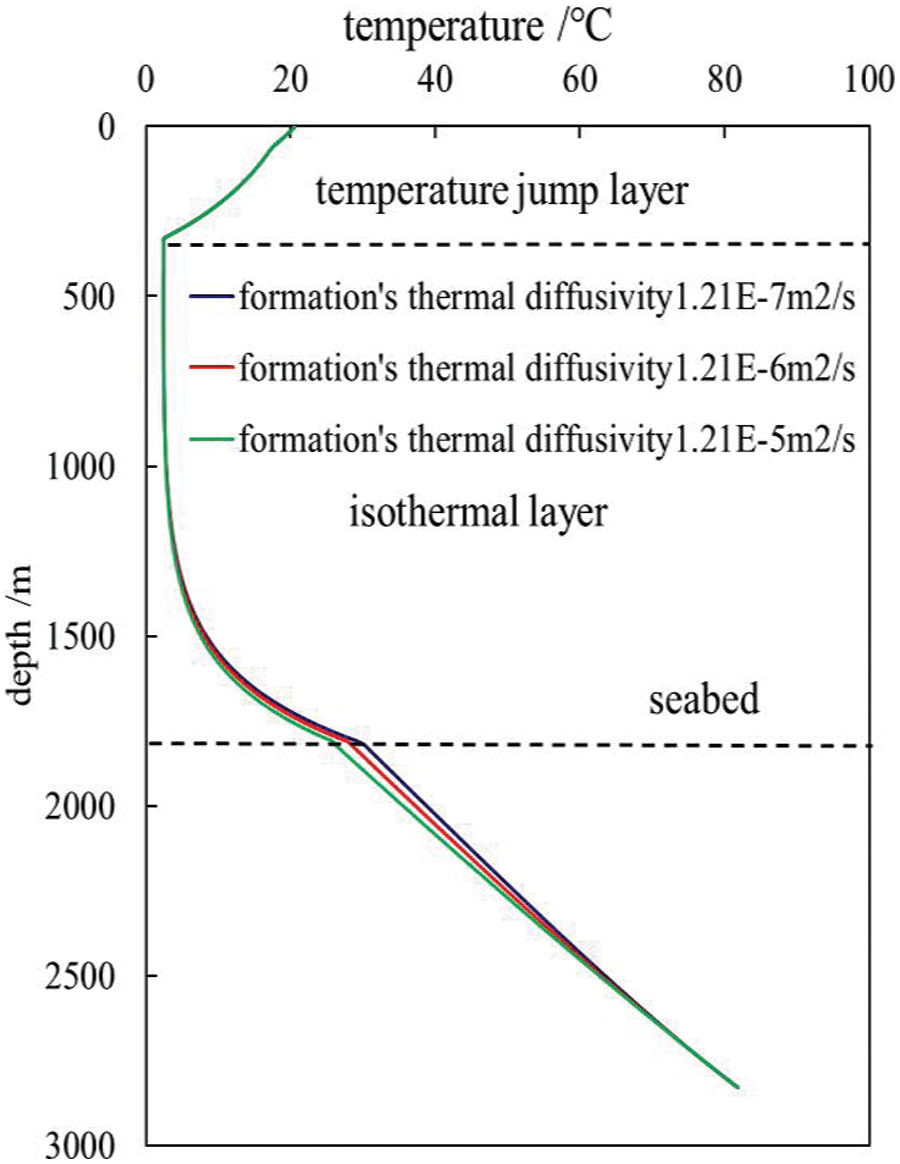
Figure 7: Influence of seawater thermal diffusivity on wellbore temperature
Fig. 8 shows that the impact of annular test fluid thermal conductivity on wellbore temperature is relatively minor. A higher thermal conductivity of the annular test fluid leads to higher overall thermal conductivity of the test fluid, resulting in lower wellbore temperatures in the isothermal aquifer section and higher temperatures in the mixing zone and thermocline sections.

Figure 8: Influence of test fluid thermal conductivity on wellbore temperature
Fig. 9 illustrates the influence of annular fluid heat radiation coefficient on wellbore temperature. Overall, the impact of the annular fluid heat radiation coefficient on wellbore temperature can be neglected.
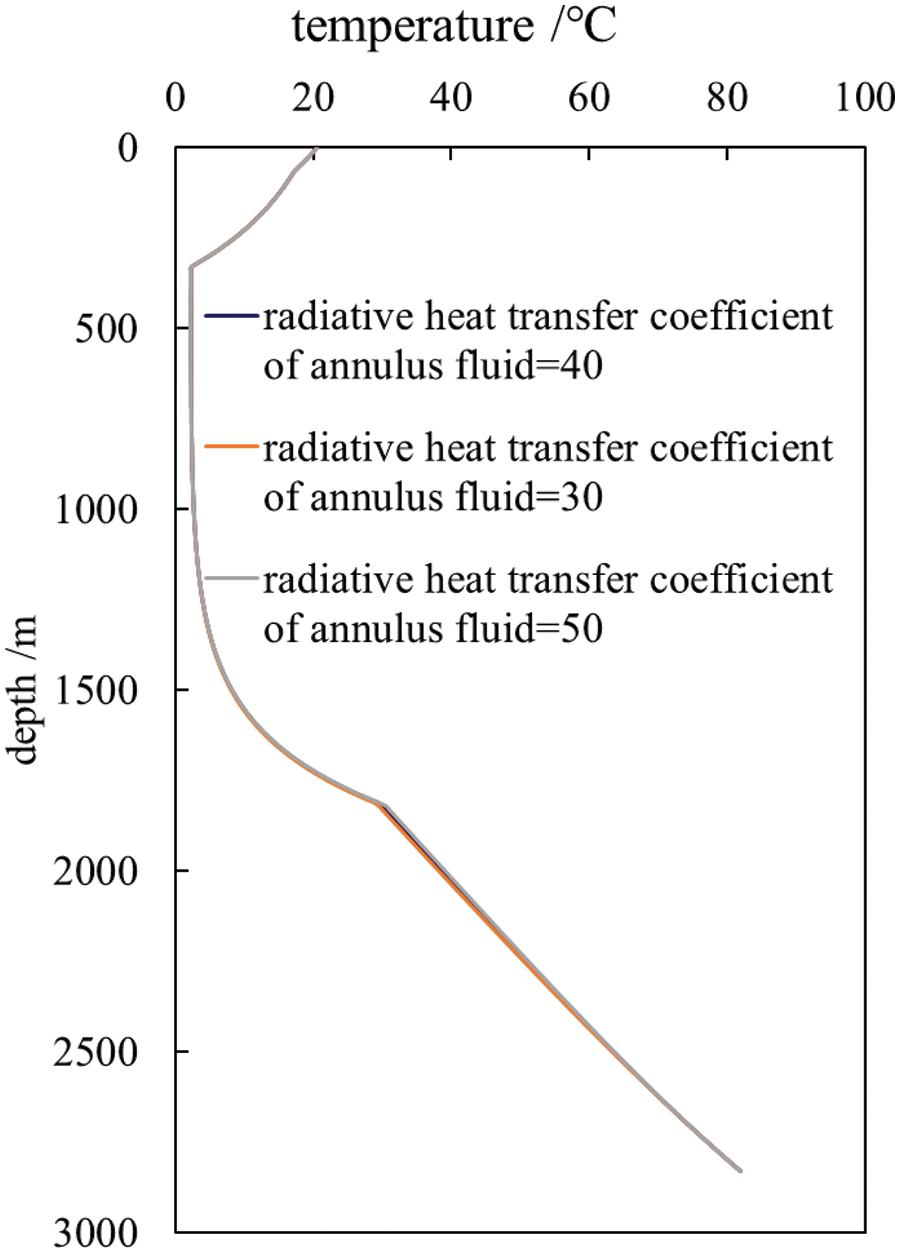
Figure 9: Influence of annular fluid heat radiation coefficient on wellbore temperature
3.2 Temperature and Pressure Field Prediction Case Study
X1 well is a typical ultra-deepwater gas well in the South China Sea, with a seawater depth of 1816.6 m. The well underwent a DST productivity test in the interval from 2828.80 to 2936.0 m. Pressure and temperature measurement devices were installed at the well bottom, seabed mudline, and wellhead, providing temperature and pressure data under different operating conditions during the test (Table 2).

Utilizing the established wellbore temperature-pressure field model, a fitting of the temperature-pressure profile from the well bottom to the seabed to the wellhead was performed. Specific results can be found in Figs. 10 to 11. Upon comparing the measured and fitted temperature and pressure values, it was observed that there is an average temperature error of 2.18% and an average pressure error of 5.26%. This confirms the reliability and accuracy of the theoretical model, rendering it suitable for theoretical analysis of flow assurance in ultra-deepwater gas well testing.
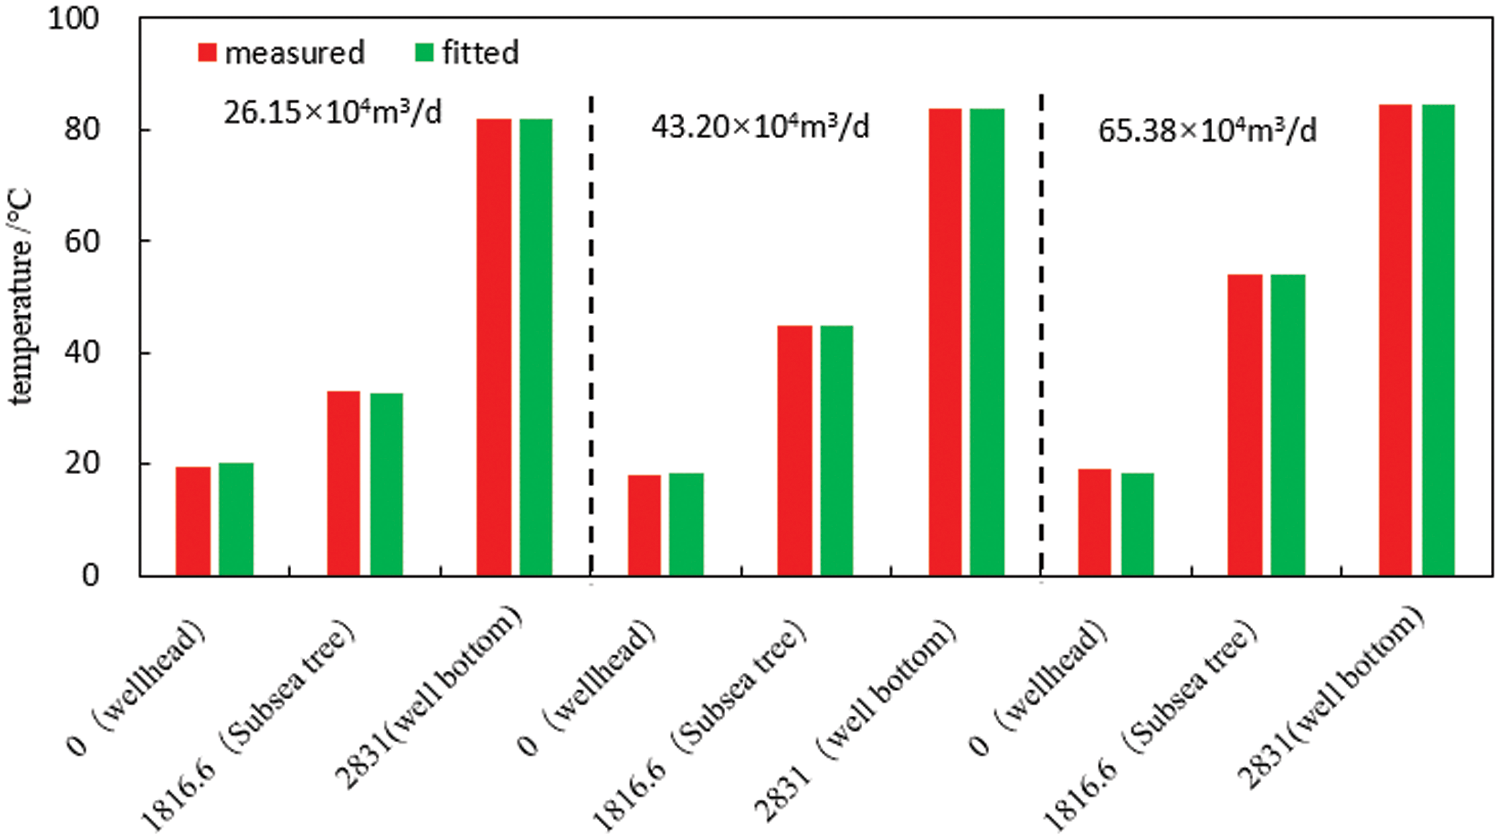
Figure 10: Bar chart comparing temperatures at different locations for the three systems
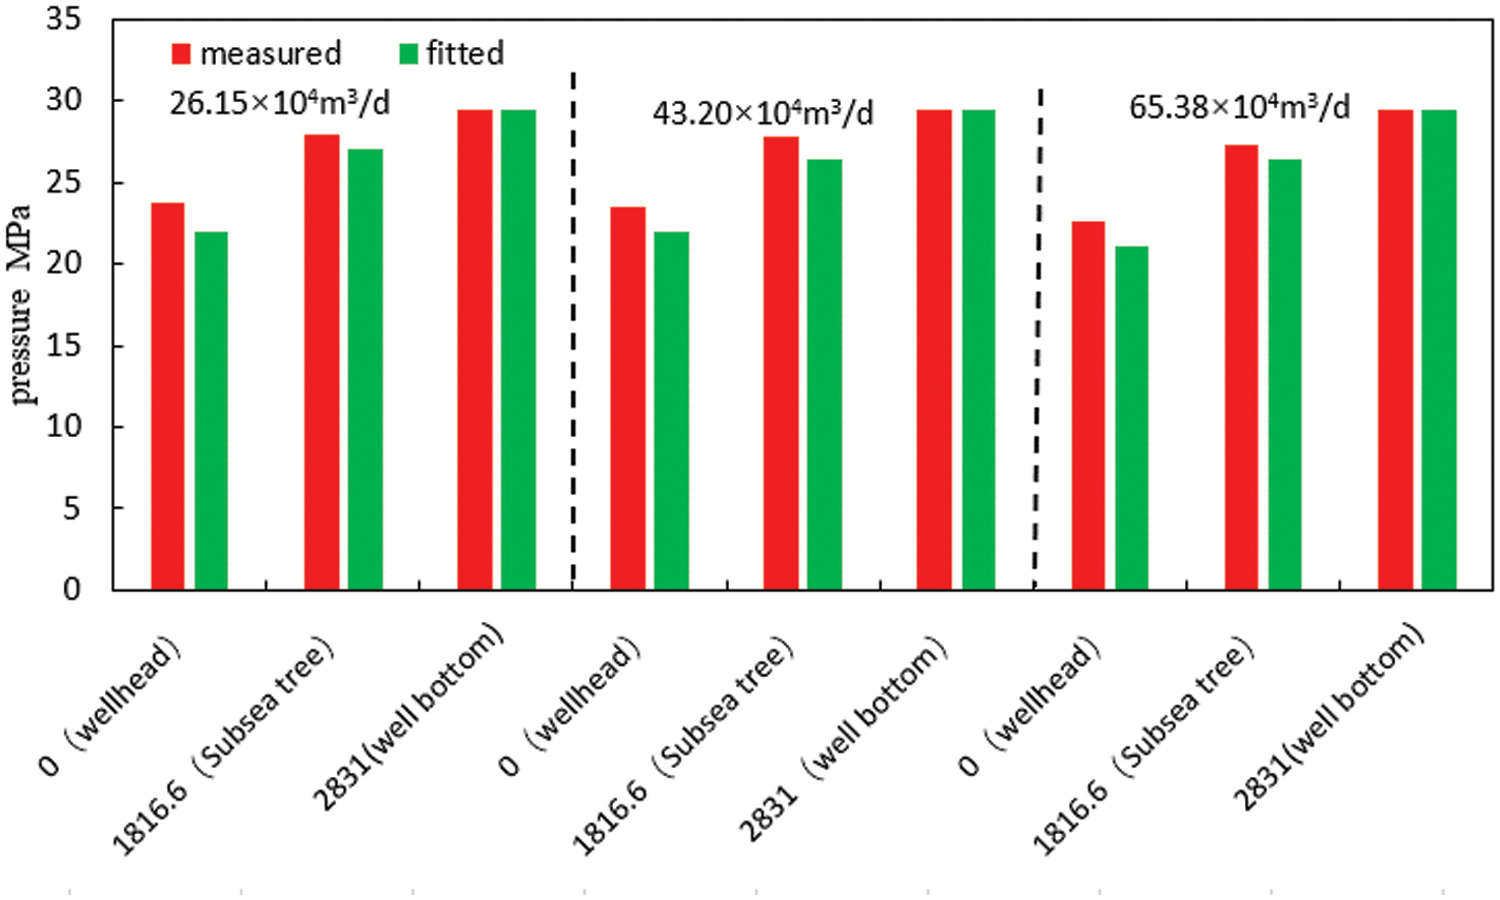
Figure 11: Bar chart comparing pressures at different locations for the three systems
The basic parameters obtained through fitting for different operating systems are shown in Table 3. From the table, it can be observed that with increasing test production, the thermal diffusivity of seawater and reservoir decreases, while the corresponding thermal conductivity increases.

(1) By considering non-steady-state heat transfer in the formation and steady-state heat transfer in the seawater section, and combining energy conservation and fluid mechanics theory, a coupled flowing model of wellbore temperature-pressure field during ultra-deepwater gas well testing was established. The model was solved using the Runge-Kutta method to obtain the flowing temperature and pressure distribution in the wellbore.
(2) The analysis of key parameters of wellbore profile shows that: ➀ The higher the gas well production, the higher the wellbore temperature, but the wellbore temperature will cross in the thermocline interval; ➁ The higher the thermal diffusion coefficient, the faster the heat transfer from the wellbore to the formation, the lower the wellbore temperature; ➂ The higher the thermal diffusion coefficient of seawater in the constant temperature zone, the higher the wellbore temperature, while the opposite is true in the thermocline and mixed zone.
(3) Based on the production flow test data of X1 well in the South China Sea, the flow temperature and pressure fields of X1 under three working conditions are fitted. The fitting errors of temperature and pressure are 2.18% and 5.26%, which verify the reliability of the theoretical model. It is confirmed that with the increase of gas well flow test production, the thermal diffusivity of the seawater section decreases and the radiative heat transfer coefficient of annulus fluid increases.
Acknowledgement: The authors would like to thank the reviewers and editors for their useful suggestions for improving the quality of our manuscript.
Funding Statement: The authors received no specific funding for this study.
Author Contributions: The authors confirm contribution to the paper as follows: Study conception and design: Xingbin Zhao and Neng Yang; data collection: Dongling Qiu and Neng Yang; analysis and interpretation of results: Benteng Ma, Dongling Qiu and Mingqiang Wei; draft manuscript preparation: Hao Liang and Xingbin Zhao. All authors reviewed the results and approved the final version of the manuscript.
Availability of Data and Materials: Data will be made available on request.
Ethics Approval: Not applicable.
Conflicts of Interest: The authors declare that they have no conflicts of interest to report regarding the present study.
References
1. Wen ZH, Wang JJ, Wang ZM, He ZJ, Song CP, Liu XB, et al. Analysis of the world deepwater oil and gas exploration situation. Petrol Explor Dev. 2023;50(5):1060–76. doi:10.1016/S1876-3804(23)60449-5. [Google Scholar] [CrossRef]
2. Da Silva EB, Ribeiro HJPS, De Souza ES. Exploration plays of the Potiguar Basin in deep and ultra-deep water, Brazilian equatorial margin. J S Am Earth Sci. 2021;111:103454. doi:10.1016/j.jsames.2021.103454. [Google Scholar] [CrossRef]
3. Liu WY, Hu JQ, Sun Z, Chu HY, Li XF, Sun FR. Research on evaluation and prevention of hydrate formation and blockage risk in wellbore during deepwater gas wells drilling. J Petrol Sci Eng. 2019;180:668–80. doi:10.1016/j.petrol.2019.06.004. [Google Scholar] [CrossRef]
4. Li XF, Liu WY, Liu SJ, Hu JQ, Nan YF, Tian T, et al. A prevention and control method for natural gas hydrate in pipe strings during deepwater gas well production tests. Nat Gas Ind B. 2020;7(1):82–92. doi:10.1016/j.ngib.2019.07.004. [Google Scholar] [CrossRef]
5. Raymond LR. Temperature distribution in a circulating drilling fluid. J Pet Technol. 1969;21(3):333–41. doi:10.2118/2320-PA. [Google Scholar] [PubMed] [CrossRef]
6. Ramey HJJr. Wellbore heat transmission. J Pet Technol. 1962;14(4):427–35. doi:10.2118/96-PA. [Google Scholar] [CrossRef]
7. Alves IN, Alhanati FJS, Shoham O. A unified model for predicting flowing temperature distribution in wellbores and pipelines. SPE Prod Eng. 1992;7(4):363–7. doi:10.2118/20632-PA. [Google Scholar] [PubMed] [CrossRef]
8. Hasan AR, Kabir CS. Aspects of wellbore heat transfer during two-phase flow. SPE Pro Fac. 1994;9(3):211–6. doi:10.2118/22948-PA. [Google Scholar] [PubMed] [CrossRef]
9. Sagar R, Doty DR, Schmldt Z. Predicting temperature profiles in a flowing well. SPE Prod Eng. 1991;6(4):441–8. doi:10.2118/19702-PA. [Google Scholar] [PubMed] [CrossRef]
10. Kabir CS, Hasan AR, Jordan DL, Wang XW. A wellbore/reservoir simulator for testing gas wells in high-temperature reservoirs. SPE Form Eval. 1996;11(2):128–34. [Google Scholar]
11. Xiao D, Hu YF, Meng YF, Li G, Wang TDY, Chen WX. Research on wellbore temperature control and heat extraction methods while drilling in high-temperature wells. J Petrol Sci Eng. 2022;209:109814. doi:10.1016/j.petrol.2021.109814. [Google Scholar] [CrossRef]
12. Zhang Z, Xiong YM, Guo F. Analysis of wellbore temperature distribution and influencing factors during drilling horizontal wells. J Energy Resour Technol. 2018;140(9):92901. doi:10.1115/1.4039744. [Google Scholar] [CrossRef]
13. Liu XQ. Study on the distribution of CO2 wellbore and reservoir temperature field in the Honghe Oilfield. Corros Prot Petrochem Ind. 2017;34(4):10–4. [Google Scholar]
14. Wei M, Zhou J, Duan Y, Long T, Duan X, Zhao L, et al. Prediction of pressure and temperature profiles for two-phase flow in multilayered gas wells by DTS data. Geoenergy Sci Eng. 2024;234:212615. doi:10.1016/j.geoen.2023.212615. [Google Scholar] [CrossRef]
15. Song X, Guan Z. Coupled modeling circulating temperature and pressure of gas-liquid two phase flow in deep water wells. J Petrol Sci Eng. 2012;92:124–31. [Google Scholar]
16. Lin RY, Shao CB, Li J. Study on two-phase flow and heat transfer in offshore wells. J Petrol Sci Eng. 2013;111:42–9. doi:10.1016/j.petrol.2013.09.012. [Google Scholar] [CrossRef]
17. Gao Y, Sun B, Xu B, Wu X, Chen Y, Zhao X, et al. A wellbore/formation-coupled heat-transfer model in deepwater drilling and its application in the prediction of hydrate-reservoir dissociation. SPE J. 2017;22(3):756–66. doi:10.2118/184398-PA. [Google Scholar] [PubMed] [CrossRef]
18. Wang ZY, Tong SK, Wang C, Zhang JB, Fu WQ, Sun BJ. Hydrate deposition prediction model for deep-water gas wells under shut-in conditions. Fuel. 2020;275:117944. doi:10.1016/j.fuel.2020.117944. [Google Scholar] [CrossRef]
19. Liu H, Wang ZY, Sun Q, Sun XH, Liao YQ, Sun BJ. An improved thermal model for predicting wellbore temperature distribution in deep-water gas well. Appl Therm Eng. 2022;205:118029. doi:10.1016/j.applthermaleng.2021.118029. [Google Scholar] [CrossRef]
20. Hasan AR, Kabir CS, Wang X. Wellbore two-phase flow and heat transfer during transient testing. SPE J. 1998;3(2):174–80. doi:10.2118/38946-PA. [Google Scholar] [PubMed] [CrossRef]
21. Hasan AR, Kabir CS, Lin D. Analytic wellbore-temperature model for transient gas-well testing. SPE Reserv Eval Eng. 2003;8(3):240–7. [Google Scholar]
22. Jing ZH. Research on the accuracy of survey values for shallow sea water temperature, salinity, and depth. Acta Oceanol Sin. 1980;2(4):1–12. [Google Scholar]
23. Hasan AR, Wang X, Kabir CS. A transient wellbore/reservoir model for testing gas wells in high-temperature reservoirs, part I. In: SPE Annual Technical Conference and Exhibition; 1994 Sep 25–28; New Orleans, LA, USA. [Google Scholar]
Cite This Article
 Copyright © 2024 The Author(s). Published by Tech Science Press.
This work is licensed under a Creative Commons Attribution 4.0 International License , which permits unrestricted use, distribution, and reproduction in any medium, provided the original work is properly cited.


 Submit a Paper
 Propose a Special lssue
 View Full Text
 Download PDF
 Downloads
 Citation Tools