 Open Access
ARTICLE
Research on the Microstructure Construction Technology of Fully Degraded Polymer Vascular Stent Based on Electric Field Driven 3D Printing
1 College of Mechatronics, Xuchang University, Xuchang, 461000, China
2 College of Mechanical Engineering, Chongqing University, Chongqing, 400044, China
3 State Key Laboratory of Mechanical Transmissions, Chongqing University, Chongqing, 400044, China
* Corresponding Authors: Yanpu Chao. Email: ,
; Hao Yi. Email:
Fluid Dynamics & Materials Processing 2024, 20(11), 2489-2508. https://doi.org/10.32604/fdmp.2024.051962
Received 19 March 2024; Accepted 11 June 2024; Issue published 28 October 2024
Abstract
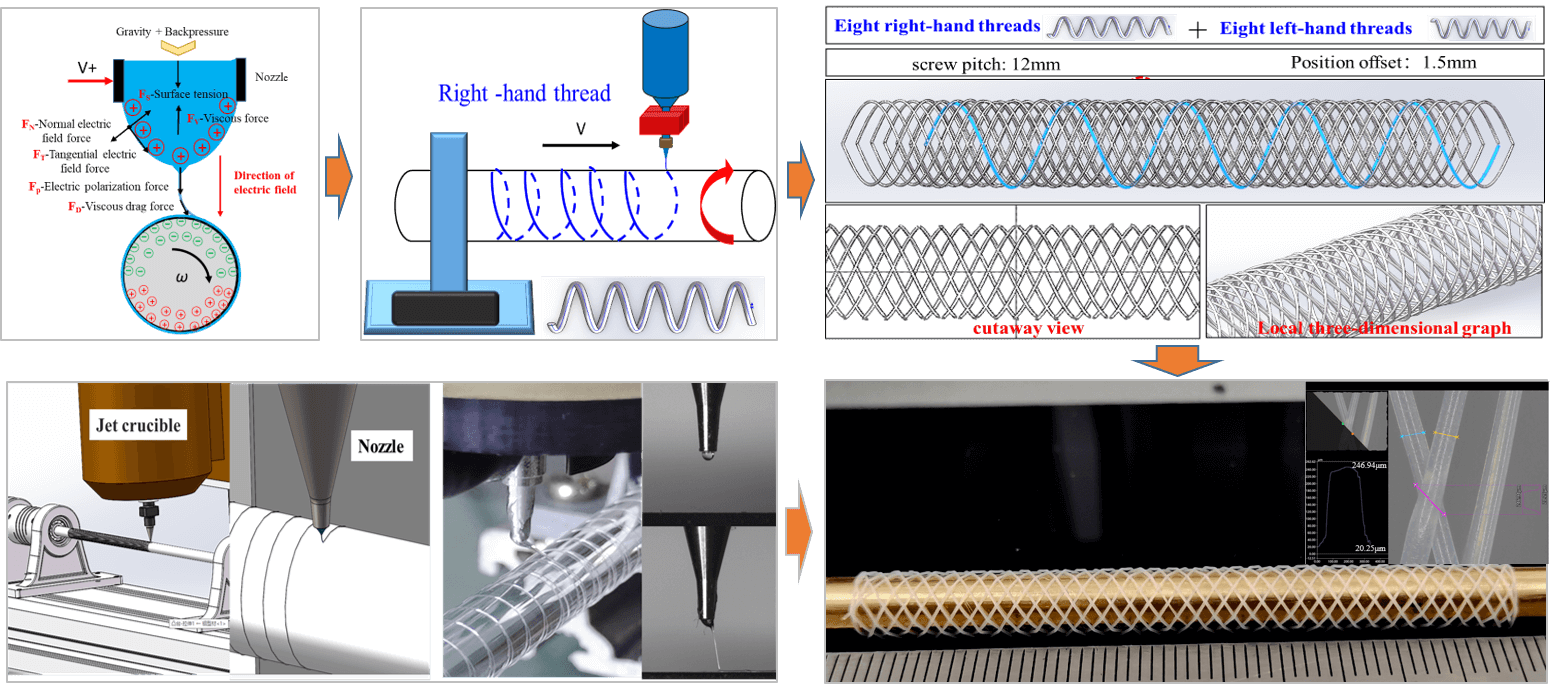
The so-called fourth-generation biodegradable vascular stent has become a research hotspot in the field of bio-engineering because of its good degradation ability and drug-loading characteristics. However, the preparation of polymer-degraded vascular stents is affected by known problem such as poor process flexibility, low forming accuracy, large diameter wall thickness, limited complex pore structure, weak mechanical properties of radial support and high process cost. In this study, a deposition technique based on a high-voltage electric-field-driven continuous rotating jet is proposed to fabricate fully degraded polymer vascular stents. The experimental results show that, due to the rotation of the deposition axis, the deposition direction of PCL (polycaprolactone) micro-jet is always tangent to the surface of the deposition axis. The direction of the viscous drag force is also consistent with the deposition direction of the jet. It is shown that by setting different rotation speeds of deposition axis ω and linear motion speeds of the nozzle V, the direction of rotation, pitch and angle of the individual printed spiral curve can be precisely tuned. In the process of multiple spiral curves matching the deposition forming thin wall tube mesh, the mesh shape and size of the thin wall tube can be accurately controlled by changing the number of matching spiral curves and the size of the matching position bias distance. Finally, the characteristics of a PCL tubular stent sample (with uniform-size microfibers and mesh shape), fabricated under the appropriate process parameters are described in detail.Graphic Abstract
Keywords
Notation
| FN | Normal electric field force |
| FT | Tangential electric field force |
| FP | Polarization electric field force |
| FS | Surface tension |
| FV | Viscous force |
| FD | Viscous drag force |
| θ | Angle of spiral |
| P | Spiral pitch |
| r | Radius of the helix |
| S | Eccentric distance |
| L | Circumference of the spiral curve |
| ω | Rotation speed |
| V | Linear motion speed |
| H | Deposition height |
| D | Diameter of nozzle |
| U | Electric field voltage |
| Tn | Temperature of nozzle |
| Pr | Air pressure |
Cardiovascular disease is a common and frequently occurring disease that poses a significant threat to human health [1]. Current treatments for vascular diseases rely on medications, surgery, and interventional stent therapies [2,3]. However, traditional stents, typically made of metal, can lead to long-term complications. Fourth-generation biodegradable stents offer a revolutionary approach (compared to previous scaffolds) [4]. These innovative stents provide temporary support to facilitate revascularization, the process of restoring blood flow to an occluded vessel. Once fully absorbed by the body, they leave behind only the natural, healthy blood vessels [5]. This allows the coronary arteries to return to their normal size and function, minimizing complications associated with permanent implants and offering a significantly reduced impact on the human body. Biodegradable stents are rapidly gaining recognition as the safest and most effective option, representing the future of vascular stent development [6].
Biodegradable polymer vascular stents have gained significant attention due to their artificial design, good degradation properties, and effective drug-loading capabilities. However, their preparation presents some challenges, such as poor process flexibility, low forming accuracy, large diameter and wall thickness, limited complex pore structure, weak mechanical properties of radial support, and high process cost. Several manufacturing methods can be employed for biodegradable vascular stents, including braided winding forming, injection molding, laser cutting, electrospinning, and fused deposition forming (FDM) three-dimensional (3D) printing. The braided winding forming method [7] involves using one or more silk wire materials to wrap around a mandrel according to a set trajectory to complete the manufacturing of the vascular stent. While offering simplicity and high molding efficiency, the resulting vascular stent often exhibits poor radial support, a single and unstable structure, and is prone to displacement or dislocation after implantation into blood vessels [8]. Injection molding [9] uses an injection molding machine to shape the vascular stent. This method is suitable for mass manufacturing of vascular stents with uniform structure at low cost. However, due to the small size and many fine structures of vascular stents, it is challenging to fill and release material during the process. Additionally, the need for corresponding molds to be manufactured in advance leads to long mold manufacturing cycles and limited structural complexity, thus failing to meet individual patient needs [10]. The laser cutting method [11] starts with creating a polymer tube of size that meets the specification. A laser then precisely cuts the required vascular stent structure onto the polymer tube, followed by cutting the obtained vascular stent from the tube to complete the manufacturing process. Vascular stents obtained by this method have high precision and can meet the individual needs of patients, making it one of the mainstream methods for manufacturing vascular stents [12]. However, vascular stents manufactured through this method produce a heat-affected zone, which affects the surface quality of the material and subsequently affects the performance of the vascular stent. Moreover, this method incurs high manufacturing costs and requires complex post-processing to obtain usable vascular stents. FDM [13] is a process in which molten polymer material is extruded from a heating nozzle to form filaments, which are then printed and deposited layer by layer onto the substrate to complete the fabrication of vascular scaffolds. This process allows for the controllable adjustment of various parameters, such as structure, shape, and porosity of vascular stents. However, there are challenges such as poor surface finish, large minimum molding size, and inability to achieve accurate printing [14]. Electrospinning [15] involves spraying polymer solution or melting through a high-pressure electrostatic field to form a polymer micro-jet for nanofibers spinning. However, traditional electrospinning’s disordered and uncontrollable jet flow impedes the controllable manufacturing of complex pore structures for vascular stents, resulting in structures with inferior mechanical properties [16]. In summary, existing methods such as braided winding forming, injection molding, laser cutting, FDM 3D printing, and electrospinning all face various theoretical and technical challenges. These include difficulty in forming complex scaffold microstructures, maintaining quality control of size and surface accuracy, ensuring limited flexibility and support stability of the scaffold, and achieving limited process control.
Electric field-driven jet deposition micro–nano 3D printing technology presents a novel process based on electrostatic induction self-excited electric field to achieve high-resolution micro-nano scale jet printing. This innovative technology [17] uses electro-hydrodynamic injection and charge-induced self-alignment principle to stretch the molten liquid at the nozzle tip into a Taylor cone. Based on the shrinking effect of the Taylor cone, high-resolution micro-nano scale 3D printing can be realized, which is an order of magnitude lower than the nozzle diameter. This facilitates efficient, cost-effective production of complex micro-nano scale components. Electric field-driven jet deposition micro–nano 3D printing technology has been initially applied in various fields, including transparent electrode, transparent electric heating [18], transparent electromagnetic shielding [19], porous tissue scaffolds [20], conformal surface structures [21], and flexible electronics [22]. For example, Peng et al. successfully employed electric field-driven jet deposition 3D printing technology to fabricate a PCL thin-wall tubular grid structure, demonstrating the feasibility of printing polymer vascular stent microstructure with this technology [23]. An ideal polymer vascular stent structure [24] should exhibit excellent supporting performance, flexibility, and mechanical properties such as small axial shortening and elastic recovery. Key factors influencing the mechanical properties of vascular stents include mesh shape, width, length, and thickness of supporting and connecting bars. However, research on electric field-driven 3D printing for vascular stent geometry remains relatively limited.
This study proposes a high-voltage electric field-driven jet and four-axis linkage printing deposition technology to fabricate vascular stents. By establishing a theoretical model for the geometric structure of the stent, this study aims to precisely control the continuous and stable extrusion of polymer microfibers. This will enable effective control over the forming mesh shape, pipe diameter, wall thickness, and size of the connecting bars of the stent. This process has the potential to fulfill the need for short-process, low-cost, and flexible manufacturing of customized, fully degradable polymer vascular stents.
Electric field-driven jet continuous micro-n–nano 3D printing technology is an innovative process based on electrostatic induction self-excited electric fields to achieve high-resolution micro–nano scale jet printing. Fig. 1 illustrates the principle of this process. The conductive nozzle is connected to the positive electrode of the high-voltage direct current (HVDC) power supply, and the molten polymer material forms a liquid bend at the bottom of the nozzle under the combined action of gravity and gas back pressure. Activating the power switch charges the conductive nozzle to a high potential, polarizing the polymer material inside the nozzle and accumulating a positive charge on the surface of the curved liquid. When the deposition mandrel approaches the positively charged nozzle, electrostatic induction is generated between the conductive nozzle and the deposition mandrel, resulting in charge redistribution. The negative charge attracts the upper semicircle surface of the deposition mandrel, while the positive charge repels the lower semicircle surface. Under the influence of electric field force, surface tension, and viscous force, the polymer material at the bottom of the nozzle gradually stretches and deforms to form a Taylor cone.
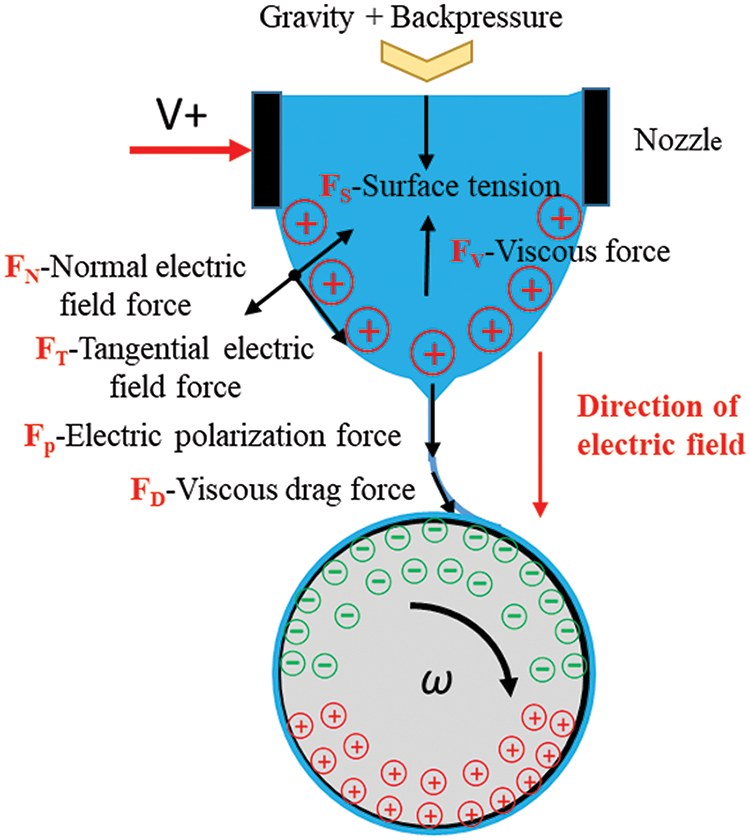
Figure 1: Schematic diagram illustrating the principle of high-voltage electric field-driven continuous cone-jet deposition
With the increase in applied voltage, charge accumulation at the tip of the Taylor cone intensifies, resulting in a significant electric field force, including normal electric field force (FN), tangential electric field force (FT), and polarization electric field force (FP). When this electric field force exceeds the surface tension (FS) and viscous force (FV) of the jet material, the polymer material at the tip of the Taylor cone is expelled, forming a continuous micro-jet deposited on the outer circular surface of the mandrel. Due to the rapid rotation of the deposition mandrel, the deposited micro-jet generates viscous drag force (FD), which further elongates the micro-jet to form micro-fibers. Precise control of the applied voltage, injection back pressure, heating temperature, and the rotation speed of the deposition core shaft enables high-resolution printing through continuous injection deposition of fine fiber filaments.
3 Materials and Experimental Systems
In this experiment, polycaprolactone (PCL; CAS NO: 24980-41-4) polymer particles (Shandong USOLF) were used as printing materials. PCL, with the chemical formula (C6H10O2)N and an average molecular weight of 50,000 g/mol, exhibits non-toxic and excellent biocompatibility and biodegradability. Its melting point is 65°C, density at 25°C is 1.146 g/mL, and viscosity after melting is 11.25 dL/Gm. Additionally, its yield stress is 17.5 Mpa, and Young’s modulus is 470 Mpa. Various mandrel materials, such as glass, stainless steel, and copper rods with different diameters, were selected as deposited mandrel materials.
The electric field-driven jet deposition 3D printing system was designed and developed following the principle of electric-field-driven continuous jet deposition, as shown in Fig. 2a. The polymer material was placed inside a quartz crucible housed within the ring heating furnace, fixed on the Z-axis movement platform. The temperature of the ring heating furnace was controlled via the temperature controller to facilitate melting. A conductive nozzle, installed at the bottom of the quartz crucible, was connected to the positive electrode of the HVDC transmission power supply. The top of the quartz crucible was connected to the air pressure control unit, with an external air pump providing positive and negative air pressure. A high-speed charge-coupled device (CCD) camera and stroboscope were employed for real-time monitoring and capturing of the dynamic process of nozzle bottom bending surface and Taylor cone jet deposition, facilitating process parameter optimization and enhancement.
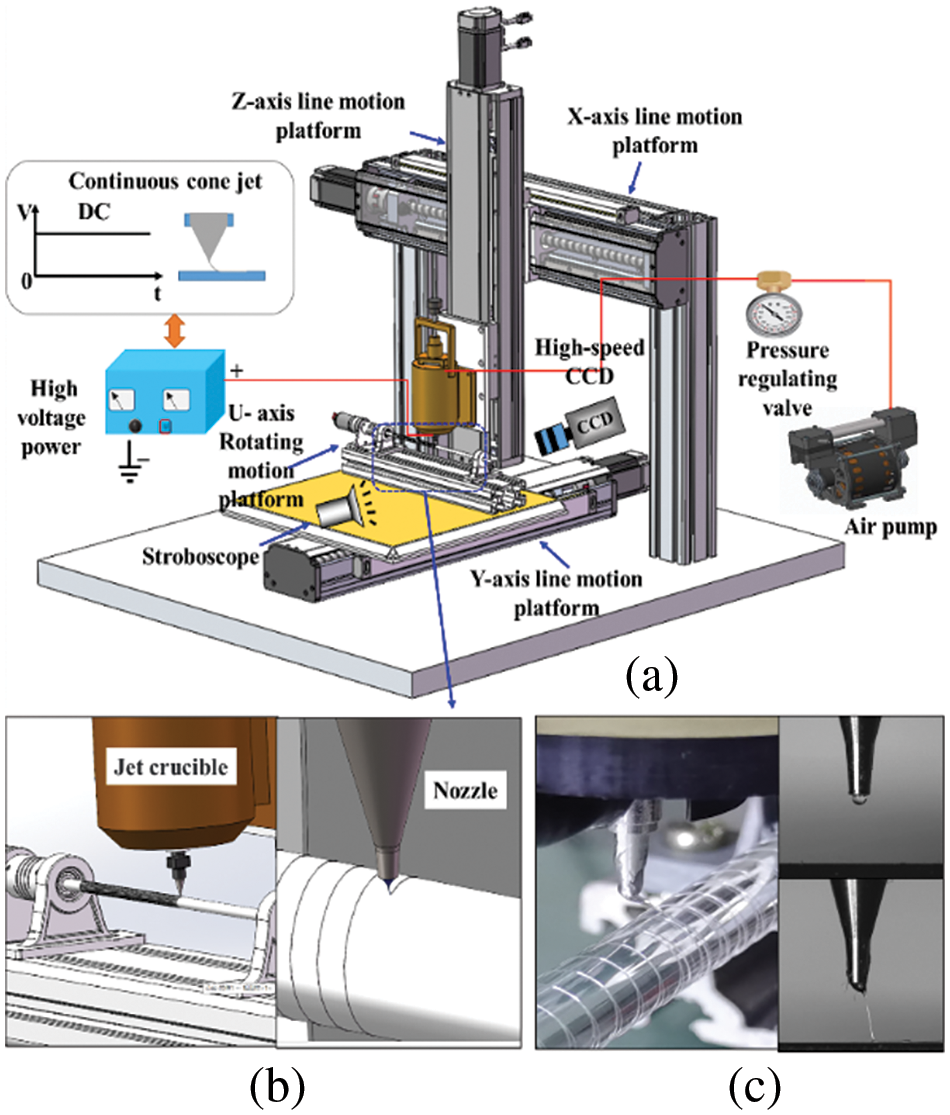
Figure 2: Schematic of the high-voltage electric field-driven continuous jet printing experimental system: (a) experimental setup; (b) enlarged schematic of the deposition process of microfibers on the surface of a rotating mandrel; (c) actual deposition process of microfibers on the surface of a rotating mandrel
An X-axis linear motion platform is installed on two aluminum profile columns, a Z-axis linear motion platform is installed on the X-axis, a Y-axis linear motion platform is installed on the plane bottom plate, and the U-axis rotating platform is installed on the Y-axis. The repeated positioning accuracy of the XYZ-axis moving platform is 0.01 mm, while the positioning accuracy of the U-axis rotating platform is 0.018°. By controlling the linear motion of the XYZ-axis and the rotational motion of the U-axis, precise formation of polymer microfiber material on the deposited core axis can be achieved. Fig. 2b shows an enlarged diagram of the microfiber deposition process on the surface of the rotating mandrel, while Fig. 2c shows the actual printing process of micro-fiber deposition on the surface of the rotating mandrel.
4.1 Deposition Analysis of Preset Eccentric
The eccentric distance between the nozzle centerline and the center of the deposition mandrel is defined as S. Fig. 3b illustrates the scenario where the nozzle centerline coincides with the centerline of the deposition mandrel, resulting in an eccentric distance of 0 mm. When the nozzle centerline is to the left of the deposition mandrel centerline, the eccentricity distance is −X mm (Fig. 3a), and when it is to the right, the eccentricity distance is X mm (Fig. 3c).
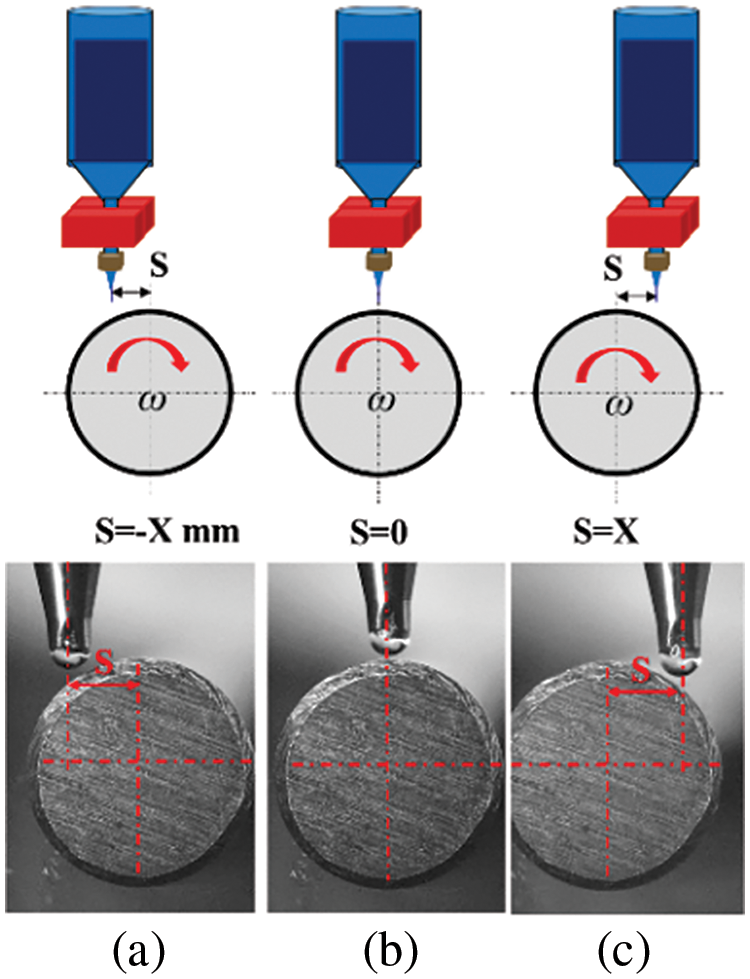
Figure 3: Schematic of the preset eccentricity distance between the nozzle and the center of the deposition mandrel: (a) S = −X mm; (b) S = 0; (c) S = X mm
To analyze the influence of eccentric distance on the print deposition morphology, a high-speed CCD camera was used to observe the deflection of the jet. Experimental parameters include a glass rod with a diameter of 12 mm serving as the deposition mandrel, nozzle diameter of 300 μm, crucible temperature set at 130°C, nozzle temperature at 80°C, back pressure of 15 kPa, electric field voltage of 1800 V, vertical distance from the nozzle to the deposition mandrel surface set at 5 mm, axial velocity at 37.6 mm/s, and rotational at 2π rad/s.
Fig. 4 shows the state of PCL jet deposition on the mandrel surface under different rotation directions. Throughout the experiment, the nozzle position remained unchanged. For counterclockwise rotation of the deposition core axis, preset eccentricity distances of −12, −6, 0, 4, and 8 mm were applied, as shown in Fig. 4a. However, for clockwise rotation, preset eccentricity distances of −6, 0, 6, 8, and 10 mm were employed, as shown in Fig. 4b.
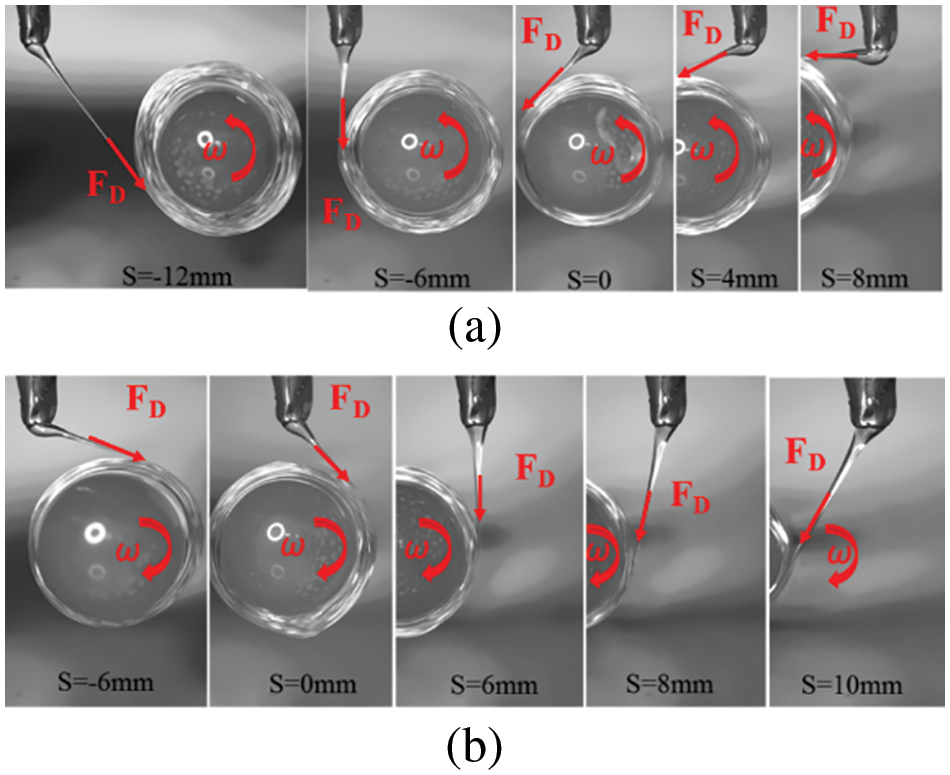
Figure 4: Deposition state of PCL jet on mandrel surface under different rotation directions and preset eccentricity: (a) the mandrel rotates counterclockwise; (b) the mandrel rotates clockwise
Analysis reveals that the PCL micro-jet can be effectively deposited on the core shaft surface with varying eccentricity distances S in different rotation directions. However, due to the rotation of the deposition core axis, the deposition direction of the PCL micro-jet changes noticeably with the change in eccentric distance S, consistently tangent to the surface of the deposition core axis. In addition, owing to the rotation of the deposition mandrel, the direction of viscous drag force (FD) produced by the PCL micro-jet also significantly changes, aligning with the deposition direction of the jet.
4.2 Deposition Principle of Single Spiral Curve
To achieve the deposition of PCL micro-jets in a spiral curve on the surface of the deposition mandrel, it is necessary to coordinate the rotational motion of the mandrel with the linear motion of the nozzle. Fig. 5 shows the process principle of forming left and right spiral curves by deposition of PCL micro-jets on the mandrel surface.
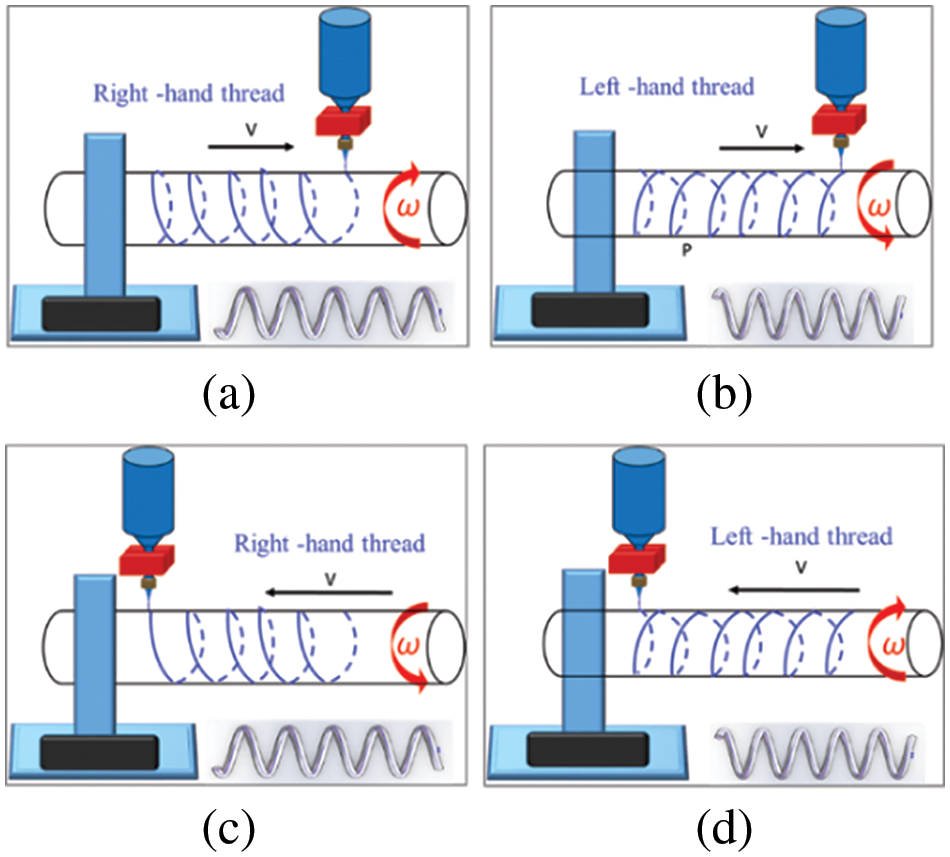
Figure 5: Schematic of the left and right spiral curves formed by the deposition of PCL micro-jet on the mandrel surface: (a) right-handed spiral curve, (b) left-handed spiral curve, (c) right-handed spiral curve, and (d) left-handed spiral curve
When the rotation direction of the core shaft and the linear direction of the nozzle adopt different matching modes, curves of different spiral directions are formed. In Fig. 5a, when the rotation direction of the deposition core axis is clockwise, and the linear movement direction of the nozzle is from left to right, the resulting spiral curve formed by deposition is right-handed. However, in Fig. 5b, with counterclockwise rotation of the core axis and left-to-right linear nozzle movement, the resulting spiral curve is left-handed. Similarly, Fig. 5c depicts a counterclockwise rotation of the core axis and right-to-left nozzle movement, yielding a spiral curve is right-handed, whereas Fig. 5d shows a clockwise rotation of the core axis and right-to-left nozzle movement, resulting in a l spiral curve is left-handed.
In addition to the rotation direction of the spiral curve, its pitch and spiral angle are also the key parameters. Fig. 6 presents a schematic principle of controlling the spiral pitch and angle. P represents the spiral pitch,
Eq. (4) expresses the computational relationship between the rotation speed of the deposition axis (ω), the linear motion speed of the nozzle (V), and the deposition motion time (t). Eqs. (5) and (6) further express P and
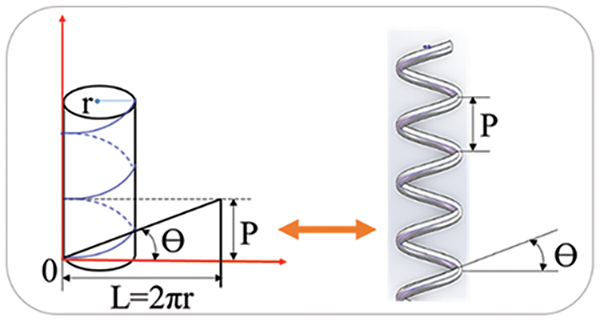
Figure 6: Control of spiral pitch and angle
Fig. 7 shows the calculated results of the spiral pitch P under different rotation speeds ω and linear motion speeds V. The spiral pitch P solely depends on the rotation speed ω and linear motion speed V, as shown in Eq. (5).
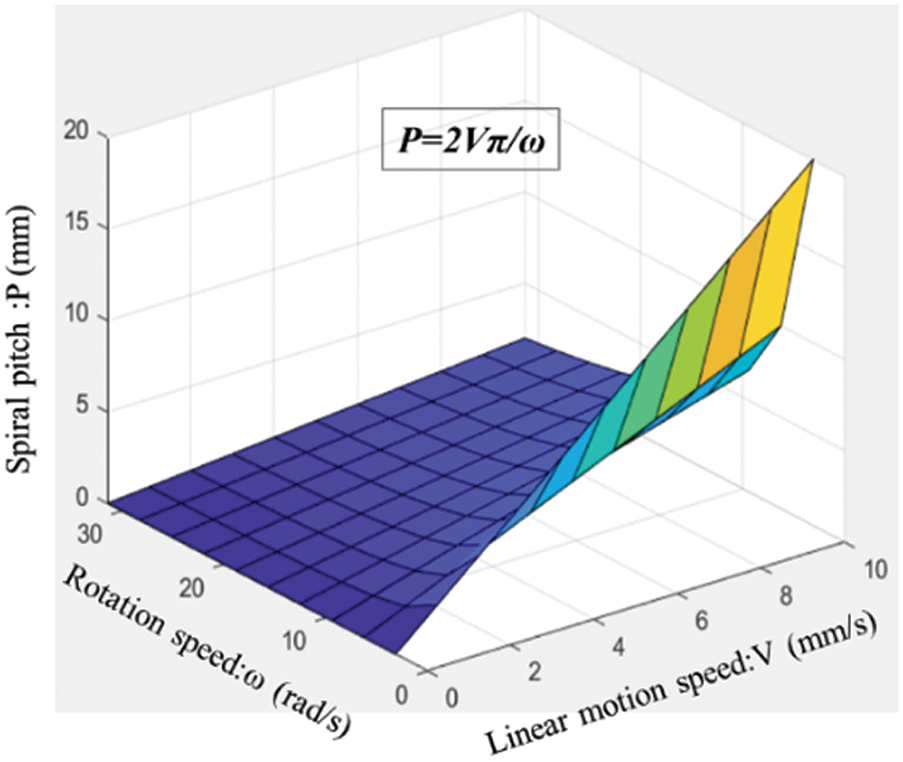
Figure 7: Calculated results of spiral pitch P under different rotation speeds ω and linear motion speeds V
Similarly, Fig. 8 shows the calculated results of the spiral angle
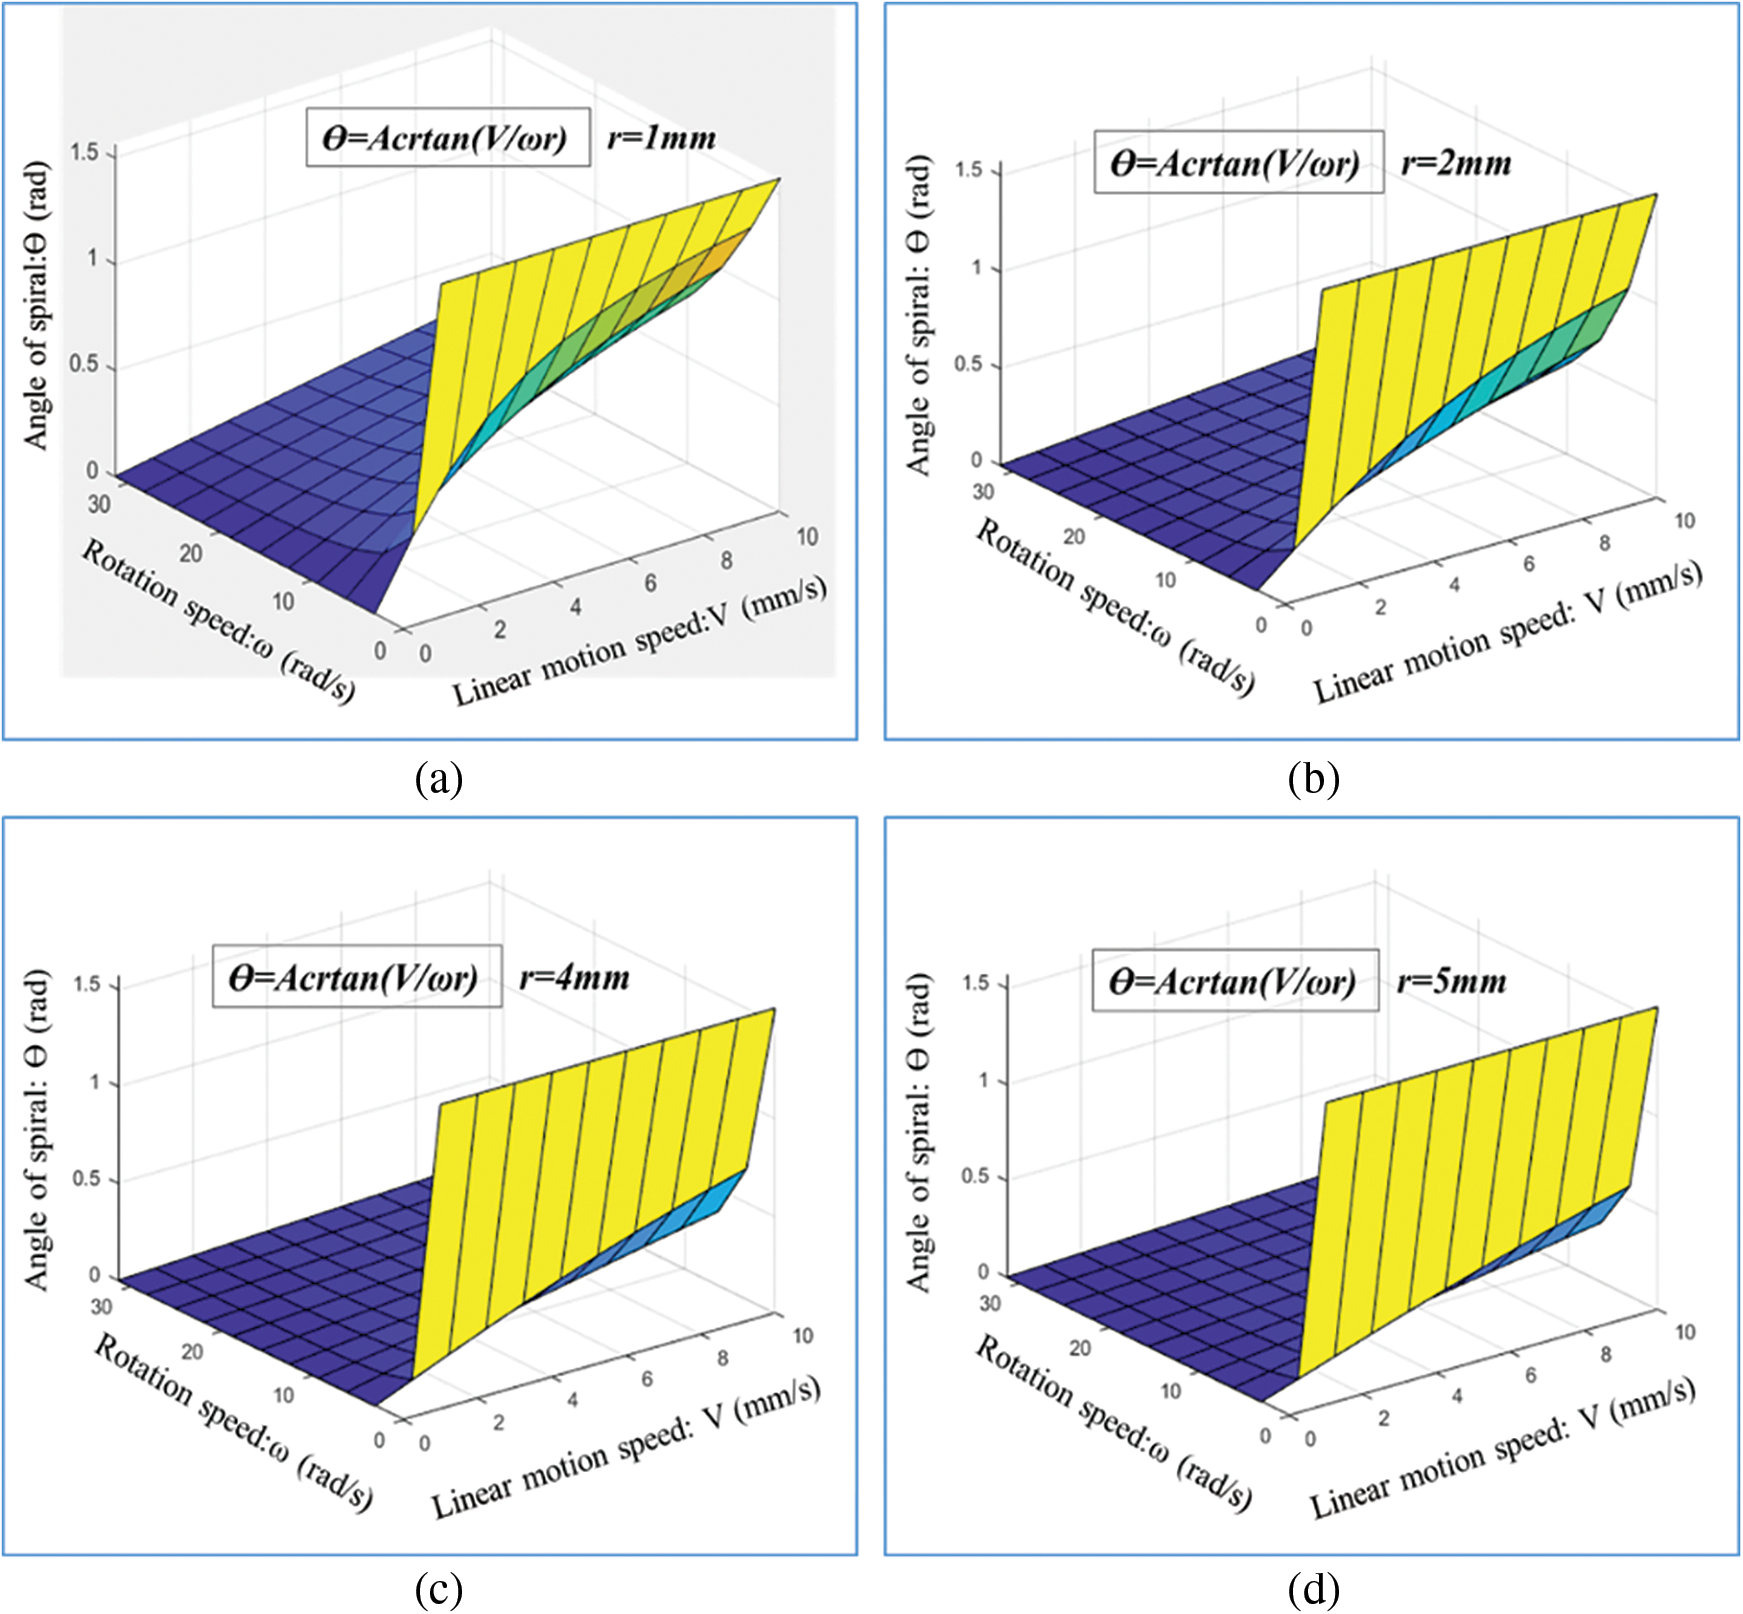
Figure 8: Calculated results of spiral angle θ under different rotation speeds ω and linear motion speeds V: (a) r = 1 mm, (b) r = 2 mm, (c) r = 4 mm, and (d) r = 5 mm
4.3 Forming Principle of a Thin-Walled Tubular Mesh Structure
The thin-walled tubular mesh structure serves as the fundamental form of vascular and nerve catheter scaffolds in tissue engineering. Utilizing the technological principle of micro-jet deposition on the surface of the mandrel to form a spiral curve (Fig. 6), multiple spiral curves can be used to form different spiral mesh structures. The distance between the starting positions of two spiral curves that match each other is defined as the position offset distance, while the angle between their starting positions is referred to as the angular deflection value.
Fig. 9 shows the helical grid structure formed by matching two spiral curves with the same turning direction. Fig. 9a displays the result of matching two spiral curves with a pitch of 2 mm, right-handed rotation, and a matching position offset distance of 1 mm under different angular offsets (0° and 90°). However, Fig. 9b shows the result of matching two spiral curves with a pitch of 2 mm, left-handed rotation, and a matching position offset distance of 1 mm, also under different angular offsets (0° and 90°). The analysis reveals that when two spiral curves with the same pitch and rotation are offset at a certain distance, the resultant mesh structure remains unchanged regardless of different angular offsets (0° and 90°). This underscores that the spiral mesh structure is formed by helix matching, with the matching angular deflection having no impact on the shape of the formed structure.
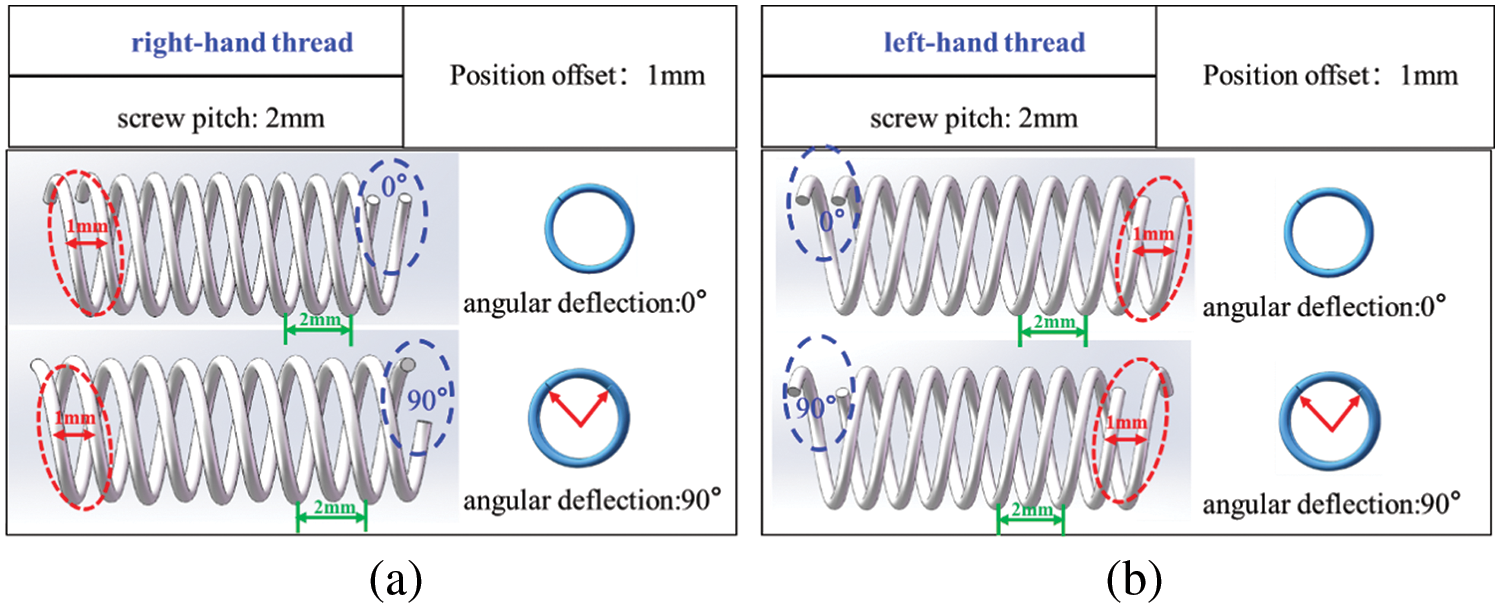
Figure 9: Helical grid structure formed by matching two spiral curves with the same turning direction: (a) right-handed rotation (2 mm pitch and 1 mm position offset); (b) left-handed rotation (2 mm pitch and 1 mm position offset)
Fig. 10 shows the helical mesh structure formed by matching two same spiral curves with a left-turning direction and a 2 mm pitch at different position offsets. As the position offset distance changes from 0 to 1.6 mm, the shape of the spiral mesh structure formed by the matching of these curves significantly changes. This highlights the impact of position offset distance on the shape of the helical mesh structure when matching spiral curves with the same turning direction.
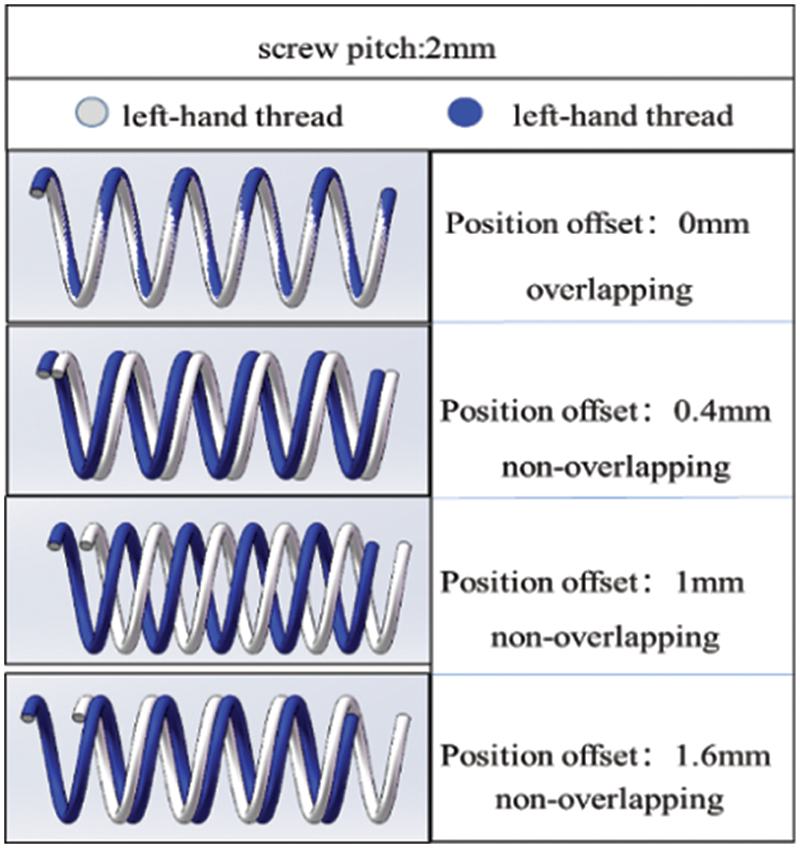
Figure 10: Helical grid structure formed by matching two spiral curves with the same direction and different position offsets
To further investigate the influence of position offset and angle deflection on the shape of spiral mesh structure formed by matching spiral curves, Fig. 11 shows two spiral curves with different rotation directions with a 2 mm pitch and a matching position offset distance of 1 mm. The spiral mesh structure is formed under different angles of deflection (0°, 45°, 90°, 135°, 180°, and 225°). The findings reveal that when two spiral curves with the same pitch and different directions are matched, and the position offset distance is fixed, the shape of the resulting mesh structure remains consistent regardless of the varying angles of deflection. This reaffirms that the deflection of the fitting angle does not alter the shape of the formed structure when a spiral mesh is formed through helix matching.
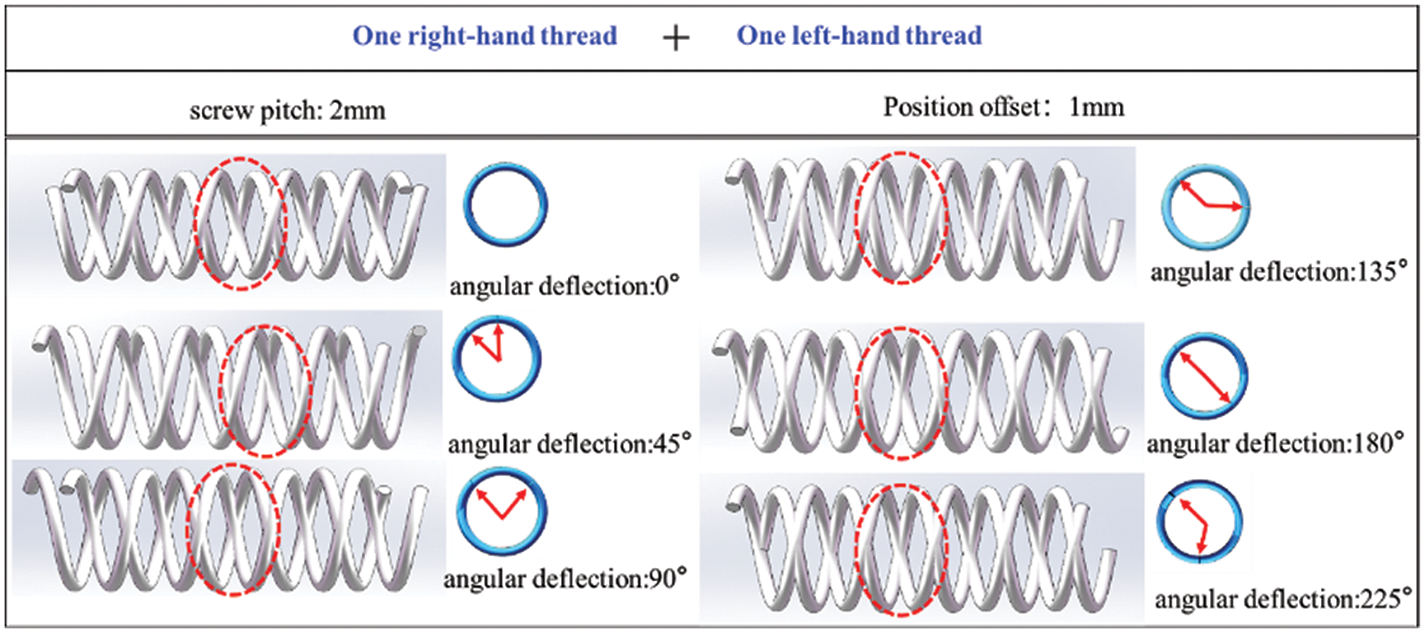
Figure 11: Helix grid structure formed by two helices with different turns at different angles
Fig. 12 shows the helical mesh structure formed by coordinating two distinct spiral curves with different rotation directions and a 2 mm pitch under different position offsets. As the position bias distance changes from 0 to 2 mm, the shape of the resulting spiral mesh structure undergoes significant changes. This highlights the influence of position offset distance on the shape of the helical mesh structure when matching spiral curves with different rotation directions.
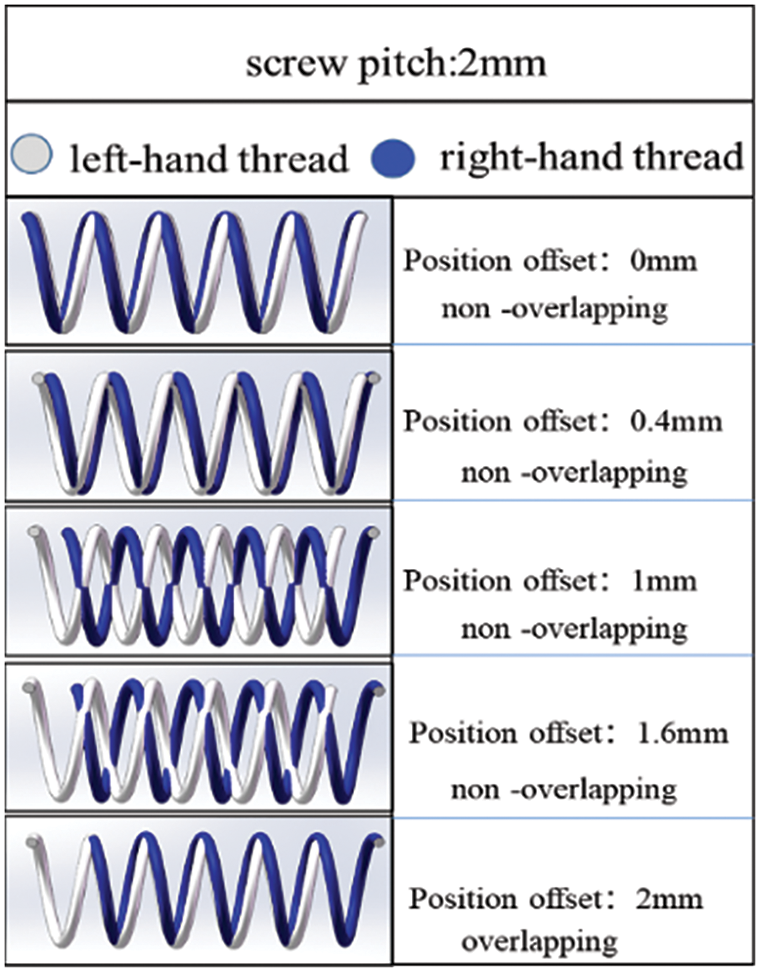
Figure 12: Helix grid structure formed by matching two spiral curves with different directions under different position offsets
Fig. 13 shows the helical grid structure formed by coordinating three left and three right spiral curves at different position offset distances. In Fig. 13a, the helical mesh structure results from the coordination of six spiral curves with a pitch of 4.5 mm and a position offset distance of 1 mm. The local 3D and sectional plane views reveal that the formed helical mesh structure is in a discontinuous state, with significant dimensional changes in the shape of a single mesh. However, Fig. 13b shows the helical mesh structure formed by coordinating six spiral curves with a pitch of 4.5 mm and a position offset distance of 1.5 mm. Here, the local 3D and sectional plane views reveal that the formed helical mesh structure is in a continuous and uniform state, with each mesh shaped like a diamond and consistent in size. Finally, Fig. 13c presents the helical mesh structure formed by coordinating six spiral curves with a pitch of 4.5 mm and a position offset distance of 2 mm. Similar to Fig. 13a, the local 3D and sectional plane views reveal that the formed helical mesh structure is in a discontinuous state, with significant dimensional changes in both the shape and size of a single mesh.
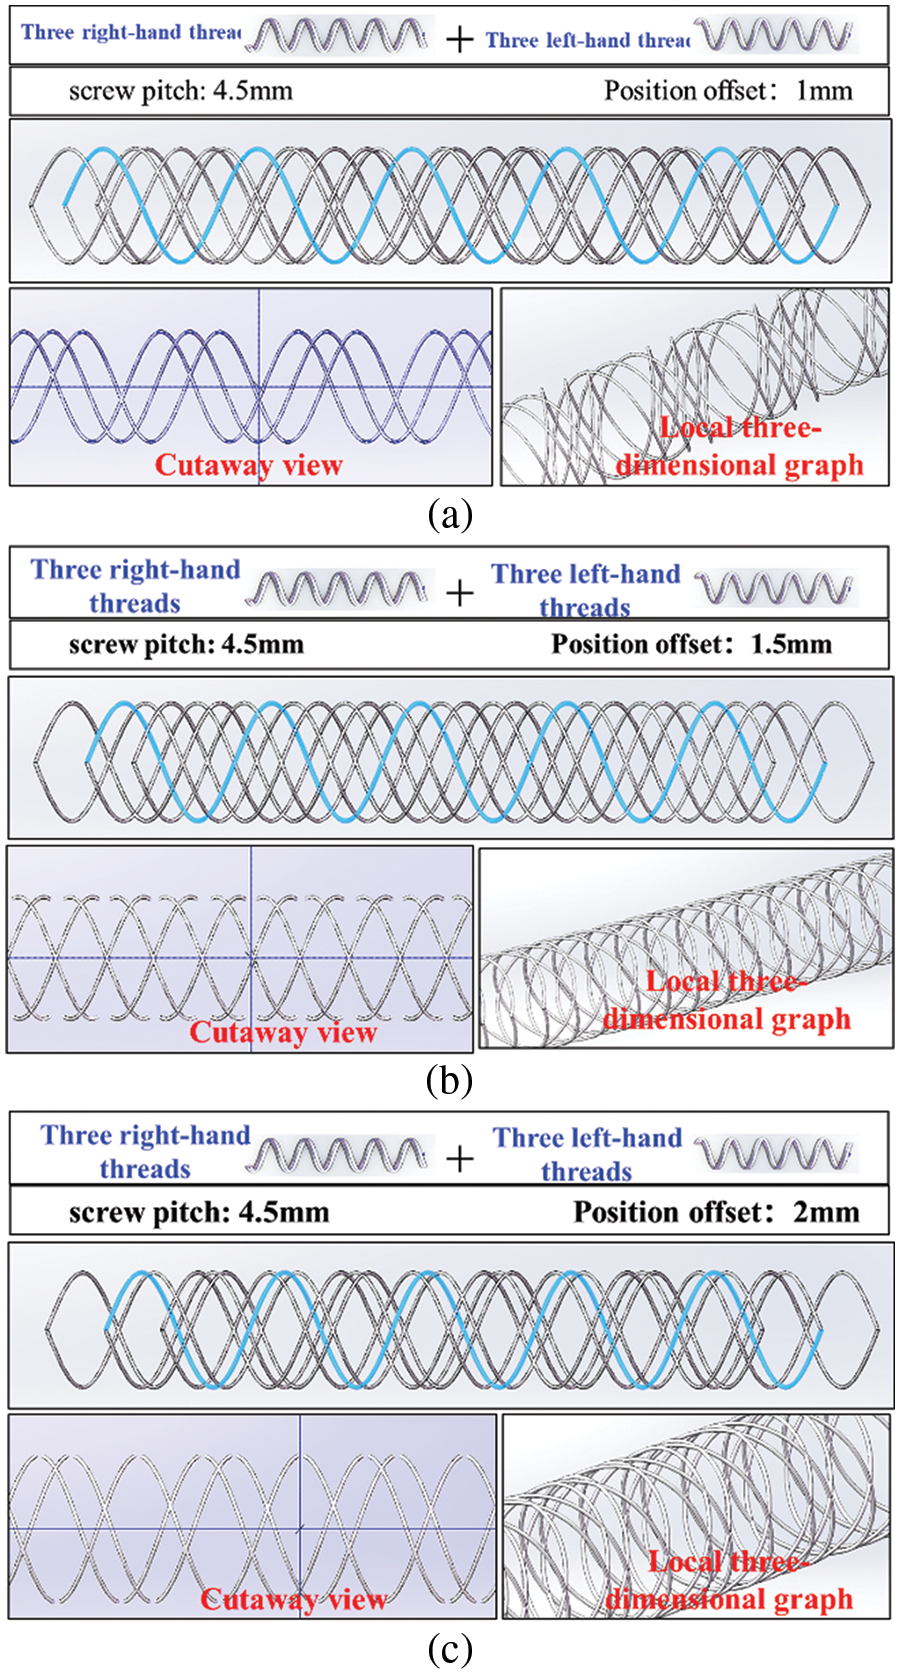
Figure 13: Helical grid structure formed by six spiral curves with different directions under different position offset: (a) screw pitch of 4.5 mm and position offset distance of 1 mm; (b) screw pitch of 4.5 mm and position offset distance of 1.5 mm; (c) screw pitch of 4.5 mm and position offset distance of 2 mm
Fig. 14 shows the helical grid structure formed by coordinating six left and six right spiral curves at different position offset distances. In Fig. 14a, the spiral mesh structure is formed by coordinating 12 spiral curves with a pitch of 9 mm and a position offset distance of 1 mm. Both the local 3D and sectional plane views revealed a discontinuous helical mesh structure, with each mesh divided into small and large segments. However, Fig. 14b shows the helical mesh structure formed by coordinating 12 spiral curves with a pitch of 9 mm and a position offset distance of 1.5 mm. In this case, local 3D view and sectional plane views revealed a continuous and uniform helical mesh structure, with each mesh shaped like a diamond and consistent in size.
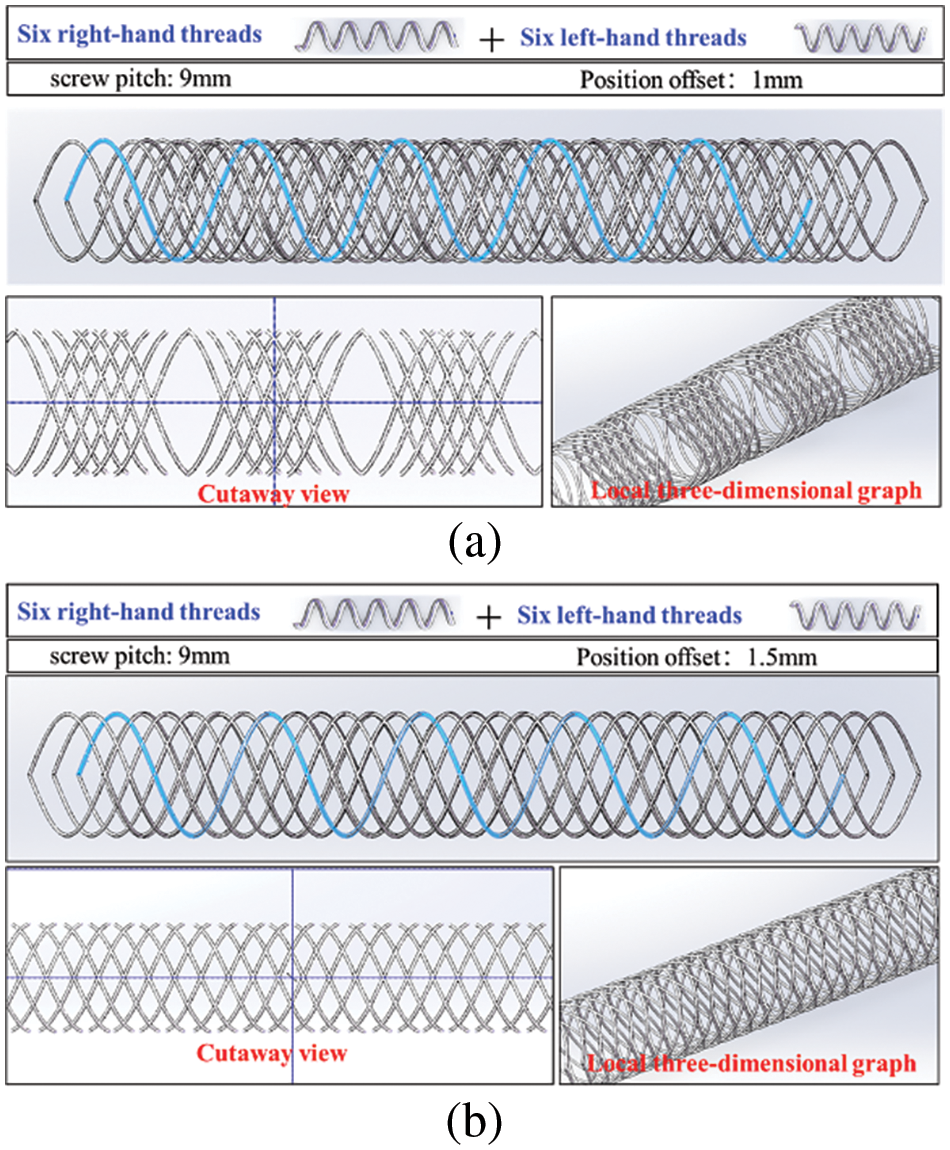
Figure 14: Helical grid structure formed by the coordination of twelve spiral lines with different directions in fixed position offset: (a) 9 mm pitch and 1 mm position bias distance; (b) 9 mm pitch and 1.5 mm position bias distance
Fig. 15 shows the helical grid structure formed by coordinating eight left-handed and eight right-handed spiral lines at fixed position offset distances. Here, the pitch is 12 mm, and the position offset distance is 1.5 mm, resulting in a helical mesh structure formed by 16 spiral lines. Both the local 3D and sectional plane views show that the shape of the spiral mesh is continuous and uniform, with each mesh adopting a diamond shape and consistent size.
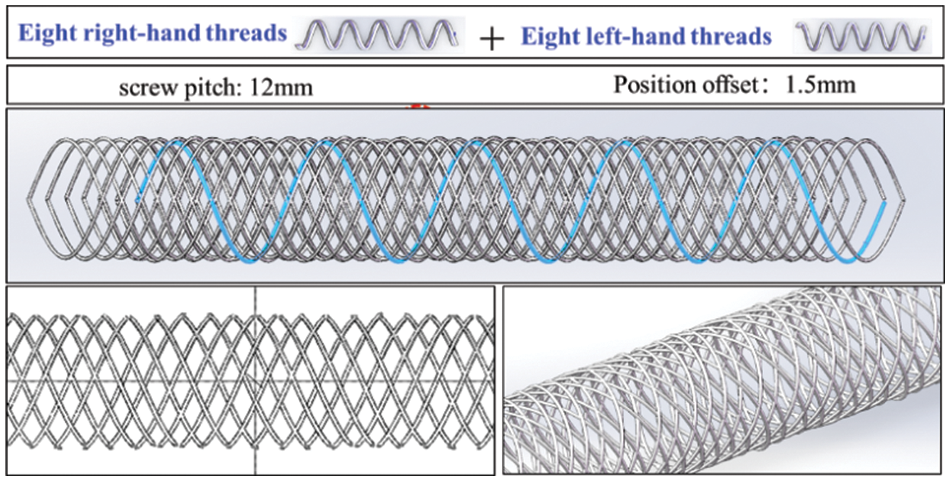
Figure 15: Helical grid structure formed by the coordination of sixteen spiral lines with different directions in a fixed position offset
From the analysis of the results depicted in Figs. 14–16, it becomes evident that when the pitch and direction of the helix remain constant, and the product of the number of selected helices and the offset distance of the helix position matches the helix pitch, the resulting helical mesh structure is continuous and uniform. Furthermore, each mesh adopts a diamond shape, maintaining consistent size. By adjusting the number of spiral lines and the size of the matching position bias distance, a single rhomboid grid structure of different sizes can be obtained.
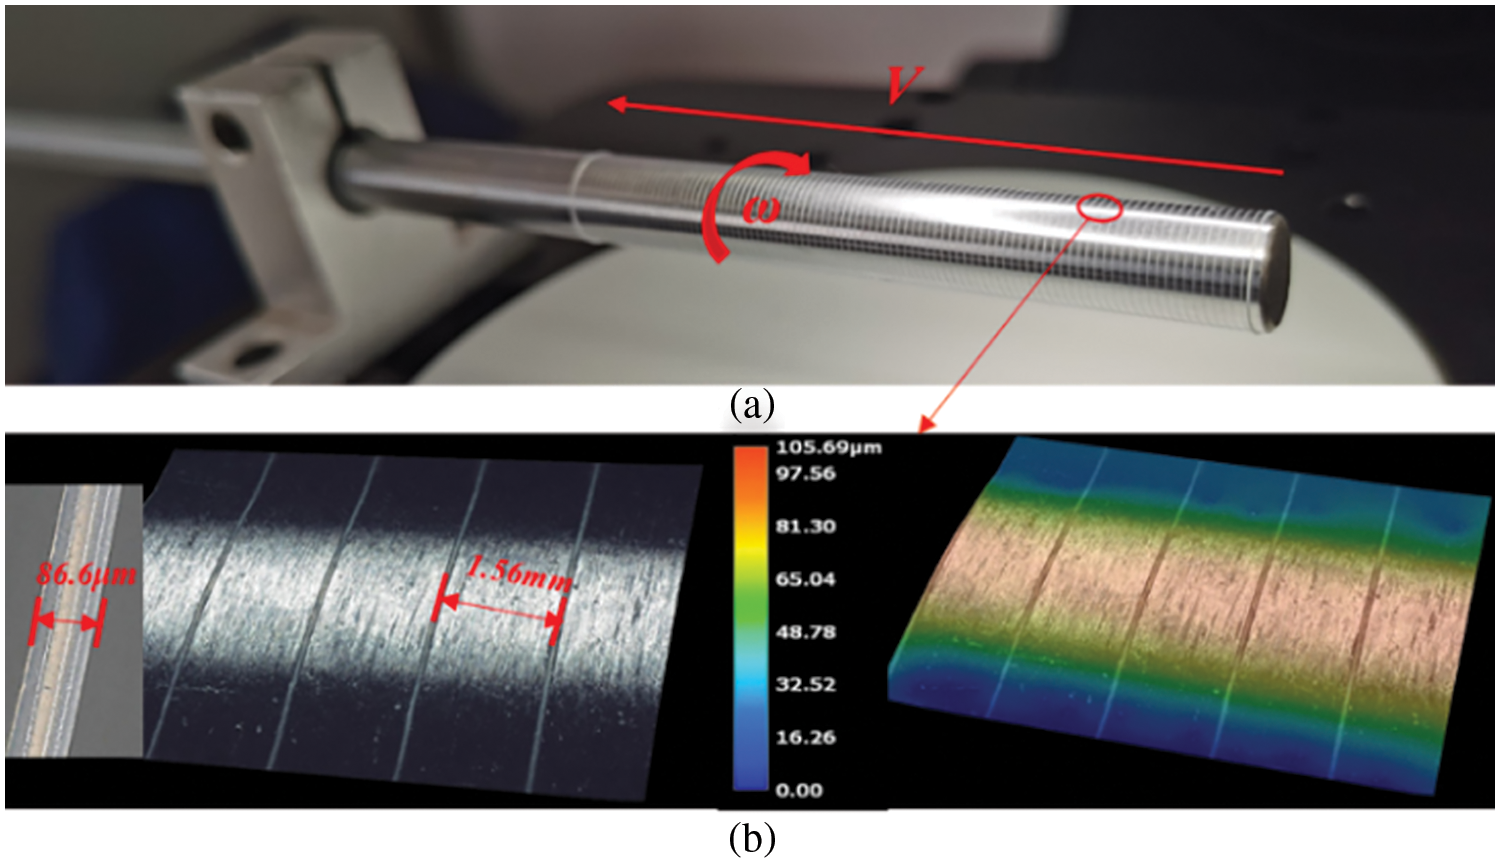
Figure 16: Single spiral curve printing forming experiment: (a) schematic of the forming result (b) schematic of the microstructure
5 Experimental Results and Discussion
Fig. 16 shows the forming process results for a single helix. The overall view of the spiral after deposition is presented in Fig. 16a, while Fig. 16b shows the microscopic morphology of the spiral. In this experiment, an 8 mm diameter stainless steel cylinder was selected as the deposition mandrel, which was rotated clockwise while the nozzle moved unidirectionally from right to left. Table 1 provides specific test parameters used in the experiment. After the experiment, the spiral formed by deposition underwent observation and measurement using a KEYENCE VHX7100 ultra-depth field microscope. The spiral formed by deposition was uniform in size and constant in shape, with a linear width of 86.6 μm, a spiral pitch of 1.56 mm, and a left spiral curve. The relative error between the measured result of spiral pitch (1.56 mm) and the set value (1.5 mm) was 4%.

Fig. 17 displays the printing process of three spiral curves while maintaining the main process parameters from Table 1. By changing the rotation speed of the deposition axis (ω) and the linear motion speed of the nozzle (V), a spiral curve pitch of 6 mm was achieved. The experiment involved printing three spiral curves, as shown in Fig. 17. Here, During the experiment, an 8 mm diameter stainless steel cylinder was employed as the deposition mandrel. The mandrel rotated counterclockwise at an angular velocity of 5.2 rad/s, while the nozzle moved at a linear speed of 5 mm/s. The first movement of the nozzle was from left to right t, the second from right to left t, and the third also from left to right. The three spiral curves comprised a left, right, and left spiral, respectively, with a pitch of 6 mm. To ensure continuity, the end point of one spiral curve coincided with the starting point of the subsequent curve. However, a 1.5 mm position offset was introduced between the starting point of the third spiral curve and that of the first.
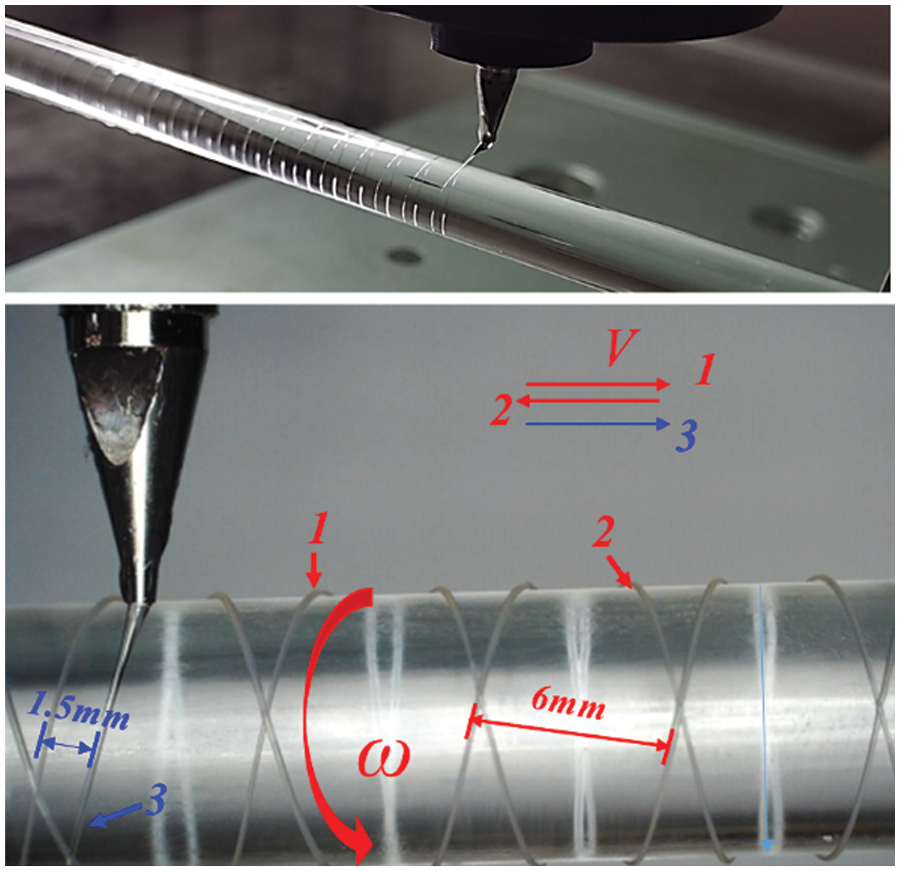
Figure 17: Image of the printing process of three spiral curves
Fig. 18 shows the results of PCL microfiber printing deposition on a glass mandrel surface. By using an 8 mm diameter glass rod as the deposition mandrel, the mandrel rotated counterclockwise, and the nozzle moved in the direction shown in Fig. 18a. This arrangement allowed for the implementation of single, two, three, and four spiral curves on a single deposition mandrel. Table 2 outlines the main experimental parameters.
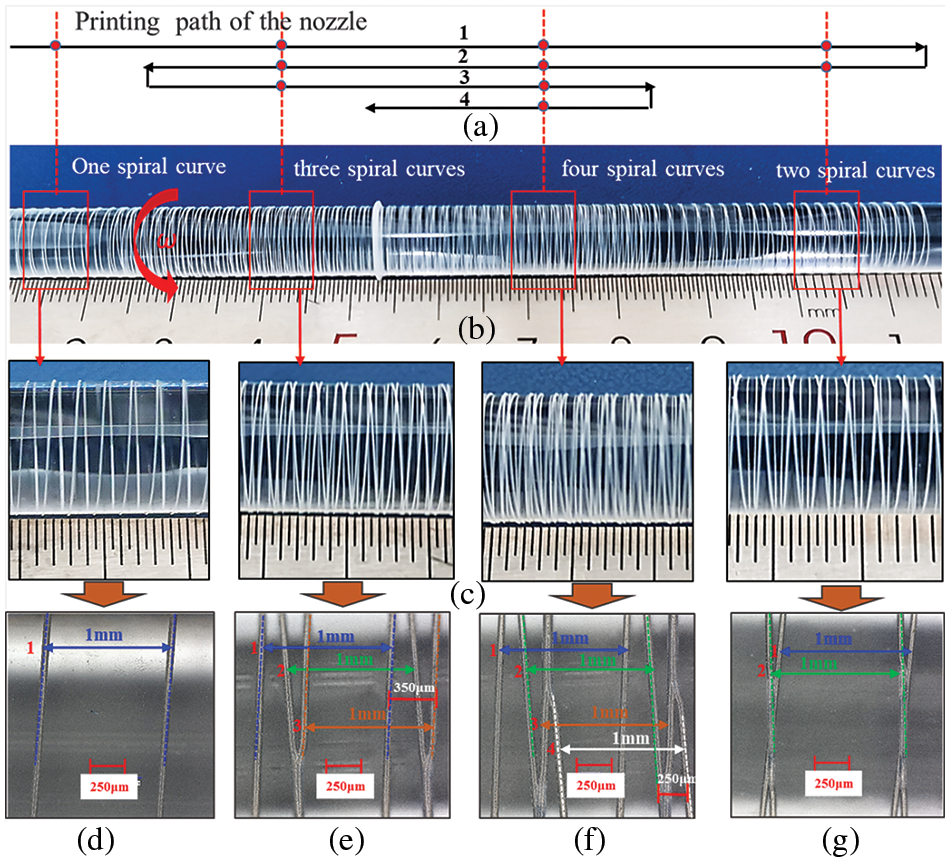
Figure 18: Glass mandrel surface printing deposition forming results: (a) printing path of nozzle; (b) overall view of forming results; (c) local enlarged view; (d) microstructure of single spiral curve; (e) microstructure of three spiral curves; (f) microstructure of four spiral curves (g) microstructure of two spiral curves

Fig. 18b shows the overall view of the print-forming results, divided into four different forming areas, as further illustrated in Fig. 18c. Due to the transparency of the glass core axis, both front and back views of the deposited single spiral curves are visible. Detailed microstructures of the single, two, three, and four spiral curves are depicted in Fig. 18d–g, respectively.
To further analyze the results of the deposition experiment, a KEYENCE VHX7100 ultra-depth field microscope was used to observe and measure the spiral lines formed by deposition at 100× magnification. Fig. 18d shows the microscopic morphology of single spirals. The deposited fiber lines appear uniform in size, with high straightness, forming a left-handed helix with a pitch of 1 mm. Fig. 18g shows the microscopic morphology of two spiral curves formed together, where the first spiral curve is left-handed and the second is right-handed, with both forming an intersection point. Each spiral line maintains a pitch of 1 mm. Fig. 18e shows the microscopic morphology of three spiral curves formed together. Here, the first and third curves are left-handed helices, while the second is right-handed. The second and third spiral curves form an intersection point, with each of the three spiral curves having a pitch of 1 mm. The position offset distance of the first and third spiral curves is about 350 μm. Fig. 18f shows the microscopic morphology of four spiral curves formed together. In this arrangement, the first and third curves are left-handed helices, while the second and fourth are right-handed. Similar to the previous scenario, each spiral has a 1 mm pitch, with intersections formed between the second and third and the third and fourth curves. The position offset distance between the second and fourth spiral curves is about 250 μm.
Fig. 19 presents a printed sample of a PCL tubular stent. Using an 8 mm diameter glass rod as the deposition mandrel, which rotated clockwise, the nozzle followed the trajectory shown in Fig. 19a. Fig. 19b shows the overall structural view of the formed sample after it was removed from the glass rod. Local observation of the shaped sample at 300× magnification using the KEYENCE VHX7100 ultra-depth field microscope reveals the micro-topography of the scaffold in Fig. 19c. The deposited PCL microfibers appear uniform in size, exhibiting a braided effect at the intersection of fiber lines.
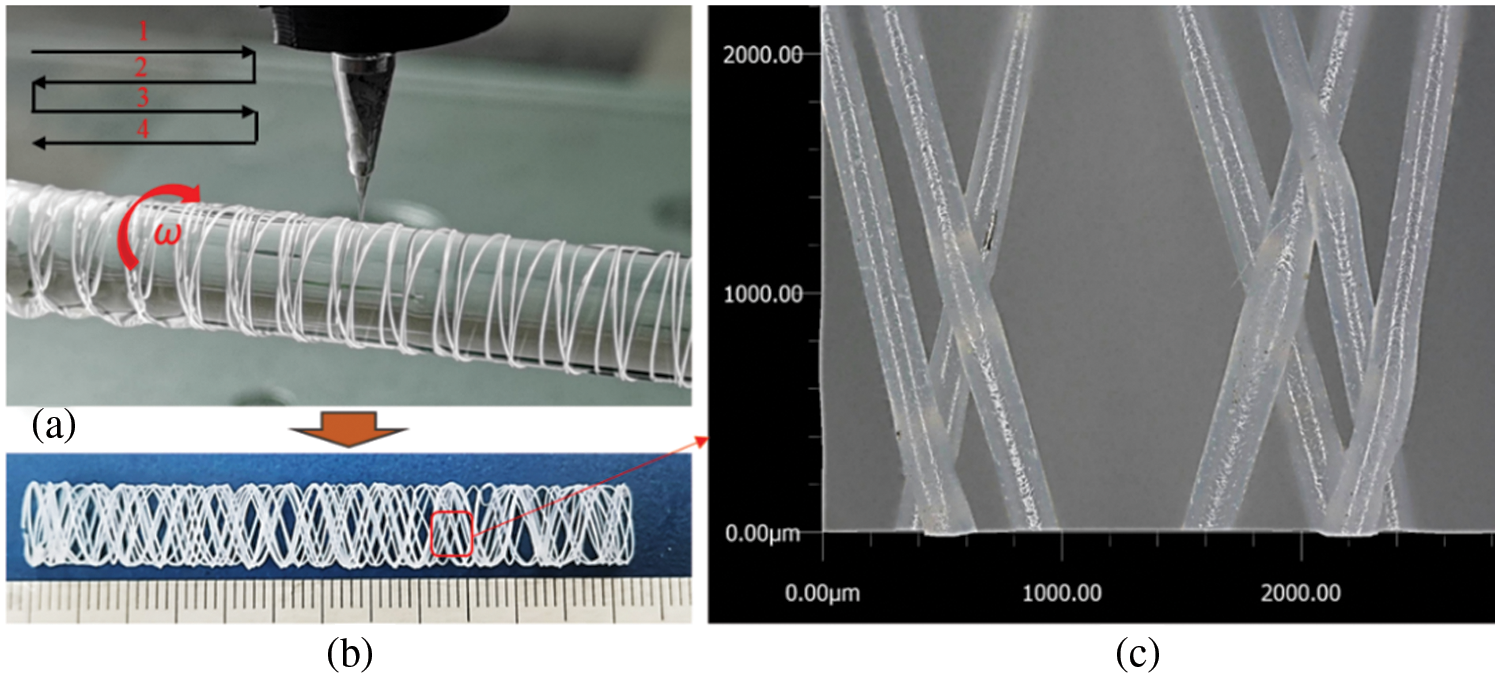
Figure 19: Printed sample of PCL tubular stent: (a) printing process; (b) overall view of the formed specimen; (c) local microscopic topography
To further analyze the characteristics of 3D cross-section shape changes at the intersection of multiple fibers, the KEYENS VHX7100 ultra-depth field microscope was used to capture photos at the intersection of formed samples at 400× magnification, and software was used for measurement, as shown in Fig. 20. Fig. 20a presents the 3D cross-section shape of the first layer of deposited fibers, showcasing a symmetrical cross-section profile with a height range from 25.88 to 91.53 μm. Fig. 20b shows the 3D cross-section shape of the second layer of deposited fibers. Here, height variations ranged from 91.21 to 151.20 μm due to fiber deposition bonding with the first layer of fibers. Fig. 20c shows the 3D cross-section shape at the intersection and superposition of the two layers of fibers, indicating a significant increase in forming height after superposition, with heights ranging from 20.25 to 246.94 μm. Finally, Fig. 20d shows the 3D cross-section shape measured along the deposition direction of the fiber surface, with heights ranging from 67.84 to 246.99 μm. Interestingly, the positions of the highest points in Fig. 20c,d are basically the same, resulting in similar measured data for the highest points.


Figure 20: Measurement results of 3D cross-section shape of local fibers of PCL scaffold sample: (a) first layer of fibers; (b) second layer of fibers; (c) superimposed junction of two layers of fibers; (d) view along the fiber direction
(1) A novel high-voltage electric field-driven continuous jet rotating deposition technique is proposed for fabricating fully degraded polymer vascular stents. The process principle of high-voltage electric field-driven continuous cone-jet deposition was analyzed, and a four-axis rotary printing system was designed and developed.
(2) The rotation of the deposition core axis significantly influences the deposition direction of the PCL micro-jet, with changes in eccentric distance S resulting in tangent deposition directions to the surface of the deposition core axis. Additionally, the direction of the viscous drag force FD is consistent with the deposition direction of the jet.
(3) Matching the rotation direction of the deposition mandrel and the linear movement direction of the nozzle in four different ways results in the formation of spiral curves with different spiral directions. Keeping the radius of the deposition mandrel fixed, the spiral pitch P and the spiral angle
(4) In the process of thin-wall tube mesh using multiple matching deposition spiral curves, we observed that when the pitch and direction of the spiral curve remain unchanged, and the product of the number of the selected spiral curves and the offset distance of the spiral curve fit position equals the spiral curve pitch, the resulting helix mesh structure is continuous and uniform. This structure features diamond-shaped single meshes with consistent sizes. By changing the number of spiral curves and the size of the matching position bias distance, a single rhomboid grid structure of different sizes can be obtained.
Acknowledgement: None.
Funding Statement: This work was financially supported by the National Natural Science Foundation of China (Grant Nos. 51305128 and 52005059). The Key Scientific and Technological Project of Henan Province (Grant Nos. 242102231054 and 242102220073). The Provincial Graduate Quality Engineering Project (Grant No. YJS2024JD38).
Author Contributions: The authors confirm contribution to the paper as follows: Conceived idea and wrote the paper: Yanpu Chao, Developed the theory and provided corrections: Hao Yi; Performed the experiments and parameter optimization: Fulai Cao; Analyzed the experiment results: Shuai Lu; Constructed modeling and value analyzed: Yaohui Li; Revised drafts and language: Hui Cen. All authors reviewed the results and approved the final version of the manuscript.
Availability of Data and Materials: All the supplementary data to this article reported here can be made available on request by email (chaoyanpu@163.com).
Conflicts of Interest: The authors declare that they have no conflicts of interest to report regarding the present study.
References
1. Saito Y, Tanaka A, Node K, Kobayashi Y. Uric acid and cardiovascular disease: a clinical review. J Cardiol. 2021;78(1):51–7. doi:10.1016/j.jjcc.2020.12.013. [Google Scholar] [PubMed] [CrossRef]
2. Song Z, Zhao YG, Liu GX, Cao C, Gao YW, Zhang XJY, et al. Study on finishing inner wall of Co-Cr alloy cardiovascular stent tube via novel atomized CBN/metal spherical magnetic abrasive powders. J Manuf Process. 2023;92:206–25. doi:10.1016/j.jmapro.2022.12.028. [Google Scholar] [CrossRef]
3. Lim GB. Vascular disease treatment of ischaemic vascular disease with 3D-printed vessels. Nat Rev Cardiol. 2017;14(8):442. doi:10.1038/nrcardio.2017.101. [Google Scholar] [PubMed] [CrossRef]
4. Eltom A, Zhong GY, Muhammad A. Scaffold techniques and designs in tissue engineering functions and purposes: a review. Adv Mater Sci Eng. 2019;2019:1–14. doi:10.1155/2019/3429527. [Google Scholar] [CrossRef]
5. Kirillova A, Yeazel TR, Asheghali D, Petersen SR, Dort S, Gall K, et al. Fabrication of biomedical scaffolds using biodegradable polymers. Chem Rev. 2021;121(18):11238–304. doi:10.1021/acs.chemrev.0c01200. [Google Scholar] [PubMed] [CrossRef]
6. Arif ZU, Khalid MY, Noroozi R, Sadeghianmaryan A, Jalalvand M, Hossain M. Recent advances in 3D-printed polylactide and polycaprolactone-based biomaterials for tissue engineering applications. Int J Biol Macromol. 2022;218(1):930–68. doi:10.1016/j.ijbiomac.2022.07.140. [Google Scholar] [PubMed] [CrossRef]
7. Shalumon KT, Liao HT, Li WH, Darshan TG, Mini PA, Chen JP. Braided suture-reinforced fibrous yarn bundles as a scaffold for tendon tissue engineering in extensor digitorum tendon repair. Chem Eng J. 2023;454:140366. doi:10.1016/j.cej.2022.140366. [Google Scholar] [CrossRef]
8. Shirvan AR, Nouri A, Sutti A. A perspective on the wet spinning process and its advancements in biomedical sciences. Eur Polym J. 2022;181:111681. doi:10.1016/j.eurpolymj.2022.111681. [Google Scholar] [CrossRef]
9. Guerra AJ, Ciurana J. 3D-printed bioabsordable polycaprolactone stent: the effect of process parameters on its physical features. Mater Des. 2018;137(3):430–7. doi:10.1016/j.matdes.2017.10.045. [Google Scholar] [CrossRef]
10. Park J, Kim JK, Kim DS, Shanmugasundaram A, Park SA, Kang S, et al. Wireless pressure sensor integrated with a 3D printed polymer stent for smart health monitoring. Sens Actuators B: Chem. 2019;280:201–9. doi:10.1016/j.snb.2018.10.006. [Google Scholar] [CrossRef]
11. Demir AG, Previtali B. Lasers in the manufacturing of cardiovascular metallic stents: subtractive and additive processes with a digital tool. Sci Comput Program. 2023;217:604–13. doi:10.1016/j.procs.2022.12.256. [Google Scholar] [CrossRef]
12. Moeri L, Lichtenberg M, Gnanapiragasam S, Barco S, Sebastian T. Braided or laser-cut self-expanding nitinol stents for the common femoral vein in patients with post-thrombotic syndrome. J Vasc Surg-Ven Lymphat Disord. 2021;9(3):760–9. doi:10.1016/j.jvsv.2020.08.027. [Google Scholar] [PubMed] [CrossRef]
13. Singh G, Paetzold R, Coulter F, McMahon CJ, Walsh K, Ronan W, et al. Fused filament fabrication of bioresorbable stent on a rotating mandrel. Procedia CIRP. 2022;110:156–61. doi:10.1016/j.procir.2022.06.029. [Google Scholar] [CrossRef]
14. Robles JD, Utomo E, Cornelius VA, Anjani QK, Korelidou A, Gonzalez Z, et al. TPU-based antiplatelet cardiovascular prostheses prepared using fused deposition modelling. Mater Des. 2022;220:110837. doi:10.1016/j.matdes.2022.110837. [Google Scholar] [CrossRef]
15. Kurowska A, Nikodem A, Jab A, Janusz JL, Szczygie P, Abka MZ, et al. Layered PCL scaffolds modified with bioactive additives fabricated by electrospinning and 3D-printing for the nasal bone and cartilage defects. Mater Des. 2023;233:112255. doi:10.1016/j.matdes.2023.112255. [Google Scholar] [CrossRef]
16. Lee JC, Hwan S, Park CH, Kim CS. Development of multi-layer membrane manufacturing technology for stent coating using electrospinning technology. Mater Lett. 2023;331:133415. doi:10.1016/j.matlet.2022.133415. [Google Scholar] [CrossRef]
17. Li HK, Li ZH, Li N, Zhu XY, Zhang YF, Sun LF, et al. 3D printed high performance silver mesh for transparent glass heaters through liquid sacrificial substrate electric-field-driven jet. Small. 2022;18(17):2107811. doi:10.1002/smll.202107811. [Google Scholar] [PubMed] [CrossRef]
18. Almuslem AS, Shaikh SF, Hussain MM. Flexible and stretchable electronics for harsh-environmental applications. Adv Mater Technol. 2019;4(9):1900145. doi:10.1002/admt.201900145. [Google Scholar] [CrossRef]
19. Li HK, Zhang YX, Tai YP, Zhu XY, Qi XM, Zhou LJ, et al. Flexible transparent electromagnetic interference shielding films with silver mesh fabricated using electric-field-driven microscale 3D printing. Opt Laser Technol. 2022;148(28):107717. doi:10.1016/j.optlastec.2021.107717. [Google Scholar] [CrossRef]
20. Chao YP, Yi H, Cao FL, Lu S, Ma LH. Experimental analysis of polycaprolactone high-resolution fused deposition manufacturing-based electric field-driven jet deposition. Crystals. 2022;12:1660. doi:10.3390/cryst12111660. [Google Scholar] [CrossRef]
21. Mkhize N, Bhaskaran H. Electrohydrodynamic jet printing: introductory concepts and considerations. Small Sci. 2022;2(2):2100073. doi:10.1002/smsc.v2.2. [Google Scholar] [CrossRef]
22. Li HK, Zi DH, Zhu XY, Zhang HC, Tai YP, Wang R, et al. Electric field driven printing of repeatable random metal meshes for flexible transparent electrodes. Opt Laser Technol. 2023;157:108730. doi:10.1016/j.optlastec.2022.108730. [Google Scholar] [CrossRef]
23. Peng ZL, Wang MJ, Lv H, Zhang JY, Li YA, Wu JY, et al. Electric field-driven microscale 3D printing of flexible thin-walled tubular mesh structures of molten polymers. Mater Des. 2023;225:111433. doi:10.1016/j.matdes.2022.111433. [Google Scholar] [CrossRef]
24. Farabi E, Sharp JA, Vahid A, Fabijanic DM, Barnett MR, Gallo SC. Development of high strength and ductile Zn-Al-Li alloys for potential use in bioresorbable medical devices. Mater Sci Eng C. 2021;122:111897. doi:10.1016/j.msec.2021.111897. [Google Scholar] [PubMed] [CrossRef]
Cite This Article
 Copyright © 2024 The Author(s). Published by Tech Science Press.
This work is licensed under a Creative Commons Attribution 4.0 International License , which permits unrestricted use, distribution, and reproduction in any medium, provided the original work is properly cited.


 Submit a Paper
 Propose a Special lssue
 View Full Text
 Download PDF
 Downloads
 Citation Tools