
 Submit a Paper
 Propose a Special lssue
 Open Access
ARTICLE

Investigation of the Film Formation in Dynamic Air Spray Painting
School of Mechanical Engineering, Yancheng Institute of Technology, Yancheng, 224051, China
* Corresponding Author: Yong Zeng. Email:
Fluid Dynamics & Materials Processing 2024, 20(10), 2393-2415. https://doi.org/10.32604/fdmp.2024.053114
Received 24 April 2024; Accepted 02 July 2024; Issue published 23 September 2024
 View Full Text
 Download PDF
Abstract
To accurately predict the film thickness distribution during dynamic spraying performed with air guns and support accordingly the development of intelligent spray painting, the spray problem was analyzed numerically. In particular, the Eulerian-Eulerian approach was employed to calculate the paint atomization and film deposition process. Different spray heights, spray angles, spray gun movement speeds, spray trajectory curvature radii, and air pressure values were considered. Numerical simulation results indicate that the angle of spray painting significantly affects the velocity of droplets near the spray surface. With an increase in the spraying angle, spraying height and spray gun movement speed, the maximum film thickness decreases to varying degrees, and the uniformity of the film thickness also continuously worsens. When the spray gun moves along an arc trajectory, at smaller arc radii, the film thickness on the inside of the arc is slightly greater than that on the outside, but the impact on the maximum film thickness is minimal. Increasing air pressure expands the coating coverage area, results in finer atomization of paint droplets, and leads to a thinner and a more uniform paint film. However, if the pressure is too high, it can cause paint splattering. Using the orthogonal experimental method, multiple sets of simulation calculations were conducted, and the combined effects of spraying height, spray angle, and spray gun movement speed on the film thickness distribution were comprehensively analyzed to determine optimal configurations. Finally, the reliability of the numerical simulations was validated through dynamic spray painting experiments.Keywords
Due to its high level of automation, stable painting quality, and high efficiency, robot painting has been widely applied in the production of various industrial products, such as automobiles, aircraft, and ships [1,2]. The surfaces of these products often possess complex freeform features, like aircraft fuselages and ship hulls, and typically require spray painting with varied poses. To further enhance production efficiency, digital spray trajectory planning using offline programming technology is currently a research focus in this field [3]. Revealing the pattern of film formation under different spray gun poses and establishing a model for predicting the film thickness distribution are fundamental to the digitization of spray trajectory planning [4].
With the advancement of computer technology, it is theoretically feasible to combine computational fluid dynamics with experiments to reveal the spray film formation process [5–7]. Conner et al. [8] analyzed the influence of the rotational speed of an electrostatic rotary cup on the film thickness distribution under flat spraying and established a model for the film thickness distribution in electrostatic air spraying based on their findings. Zhang et al. [9] conducted numerical simulations of the electrostatic spraying process under varying electric field strengths. The results indicated that the deposition rate of coating droplets increases with the strength of the electric field. Garbero et al. [10] observed that an increase in paint viscosity correlates with a marked reduction in the splashing phenomenon when atomized droplets impact the workpiece surface. Fogliati et al. [11] examined the influences of various factors, including air and mist, on the spraying process using a spray gun in the automotive industry. They simulated the process and predicted the trajectories of paint droplets. Moore et al. [12], aiming to understand the sensitivity of each parameter in the spraying process, used the k-ε model for numerical simulations and studied the impact of a single jet airstream, modeling the results accordingly. Chen et al. [13–15] employed the Eulerian-Eulerian approach to study the film formation mechanisms and characteristics on different curved surfaces such as arcs [16,17] and spheres [18]. However, they only studied the spraying process at a spray angle of 0° and a certain spray height, without considering the effects of multiple parameters like spray gun height and inclination angle on the dynamic spray film formation pattern. Zhang et al. [19] planned a spraying trajectory for surfaces with boundary features, which not only meets the requirements for film thickness uniformity but also improves spraying efficiency. Zeng et al. [20] proposed a multivariable spray parameter optimization method to improve the film uniformity after boundary-constrained spraying, showing good results for spraying filleted surfaces along an arc trajectory. However, when using arcs for trajectory planning, they failed to consider the effect of arc trajectory curvature on the distribution of film thickness. Therefore, this paper incorporates the radius of trajectory curvature into the study of the spray film formation pattern. Khaghani et al. [21] designed an air turbine-driven paint spray spindle and conducted a comprehensive analysis under various operating conditions using CFD simulations. The results indicate that air supply pressure and speed significantly impact the turbine’s rotational stability. Similarly, airflow speed—determined by air pressure—directly influences the quality of the paint film. Therefore, this study also focuses on how air pressure affects the film thickness distribution. In summary, investigating the impact of parameters such as spray gun position, posture, spray trajectory curvature, and air pressure on the film formation pattern in dynamic spraying is a pressing matter.
In the numerical simulation study of two-phase flow atomization spraying, two primary methods are typically employed: the Eulerian-Lagrangian approach and the Eulerian-Eulerian approach. The Eulerian-Lagrangian method can determine the trajectory of each paint particle through statistical analysis. Consequently, many researchers, such as Wang et al. [6], Li et al. [22], Xie et al. [23], and Yang et al. [24], have utilized this method to study the atomization process of spraying. However, in simulations of dense phase flows, the increasing number of particles leads to a significant rise in computational complexity. Additionally, the computational time required for dynamic spraying simulations is several times that of the aforementioned static spraying studies, rendering this method unsuitable for our research.
In contrast, the Eulerian-Eulerian approach not only alleviates the computational burden associated with the increasing number of particles in the Eulerian-Lagrangian method but also effectively simulates the paint mist distribution. When combined with the Eulerian wall film model, it can also predict the coating thickness distribution after spraying. Additionally, since our study does not focus on droplet trajectories or other physical properties, the Eulerian-Eulerian approach was chosen for the numerical simulation.
This paper employs the Eulerian-Eulerian approach to establish a planar dynamic spray painting model. Utilizing CFD numerical simulation, a comparative analysis was conducted on the spray flow field morphology and film thickness distribution under various spray heights, spray angles, spray gun movement speeds, spray trajectory curvature radii, and air pressure. The study elucidates the influence of each spray parameter on the film thickness distribution. Finally, the effectiveness and feasibility of the established planar dynamic spray painting CFD numerical simulation model were validated through robotic spray painting experiments.
In the process of spray painting, both gas and liquid phases are treated as continuous media, in line with the continuum medium model in fluid mechanics.
The expression of the mass conservation equation is [5]:
where
The equation for momentum conservation is [5]:
In Eq. (2),
This research adopts the Reynolds-Averaged Navier-Stokes methodology to address turbulent flow issues. Instead of directly solving for the Reynolds stress terms, the eddy viscosity model represents them as a function of the turbulent viscosity
Here,
For gas-liquid multiphase flow, the standard k-ε turbulence model is utilized to close the momentum equations. This model includes turbulent kinetic energy k and turbulent dissipation rate ε, with the corresponding transport equations as follows [16]:
In these expressions,
After being atomized by air, paint droplets are transported to the workpiece surface and deposit to form a liquid film. The thickness of the liquid film can be calculated using the mass conservation equation and the momentum conservation equation.
The equation for mass conservation is [17]:
In these equations,
The equation for momentum conservation is [17]:
Here,
3 Simulation of Dynamic Spray with Variable Parameters
3.1 Computing Domain Setting and Mesh Division
This paper focuses on the WRA-101 air spray gun and uses the 3D software SolidWorks to establish a model of the spray gun’s air cap. Fig. 1 shows the model of the spray gun’s air cap.
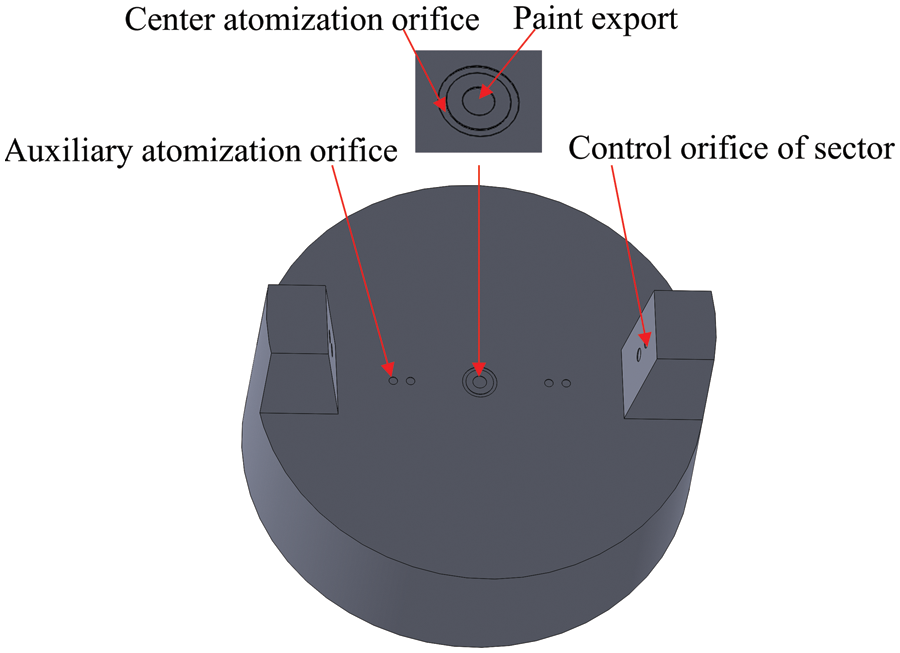
Figure 1: 3D model of spray gun
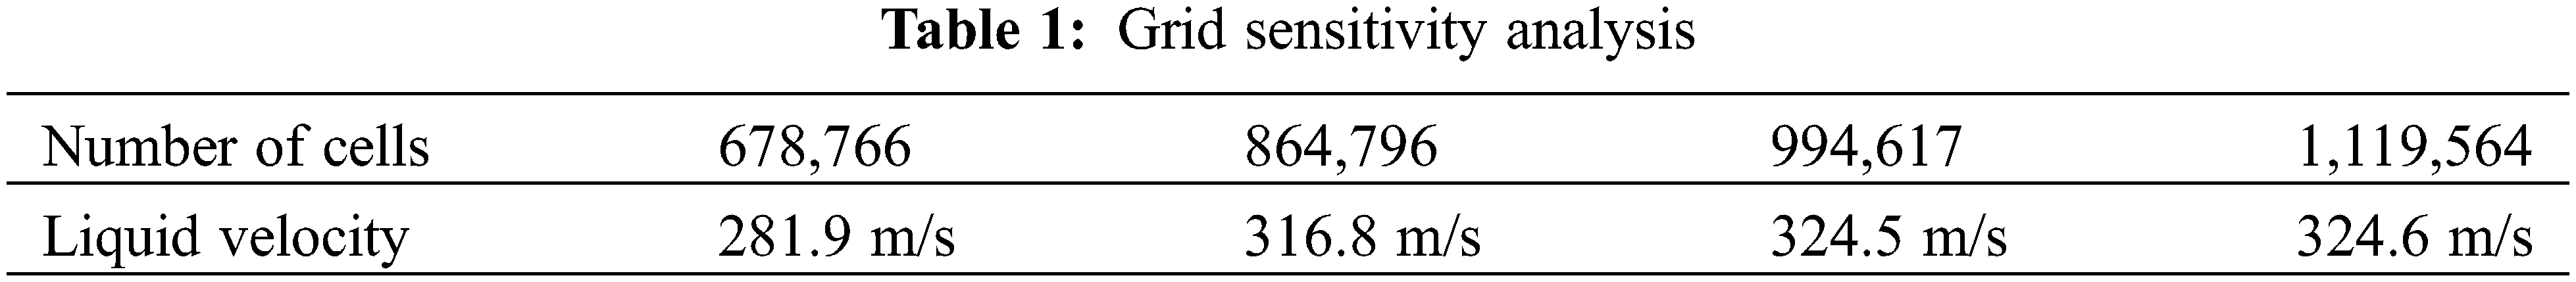
The movement of the spray gun is facilitated by the sliding mesh model in Fluent. As illustrated in Fig. 2, the computational domain is divided into two zones. One part is the sliding zone, where the spray gun moves along a pre-planned path, and the grid of this area translates as a whole without undergoing any changes. The other part is the non-sliding zone, where the grid remains immobile. An unstructured tetrahedral mesh generation method is employed for grid partitioning. To balance computational efficiency and accuracy, the grid within the sliding zone is refined, while the grid in the non-sliding zone is relatively sparser. The number of cells in the calculation domain under different types of spraying parameters is different. Taking the vertical spraying at a height of 200 mm as an example, the total number of cells in the calculation domain is 994,617. It has been proved that increasing the number of cells has a negligible effect on the simulation results.
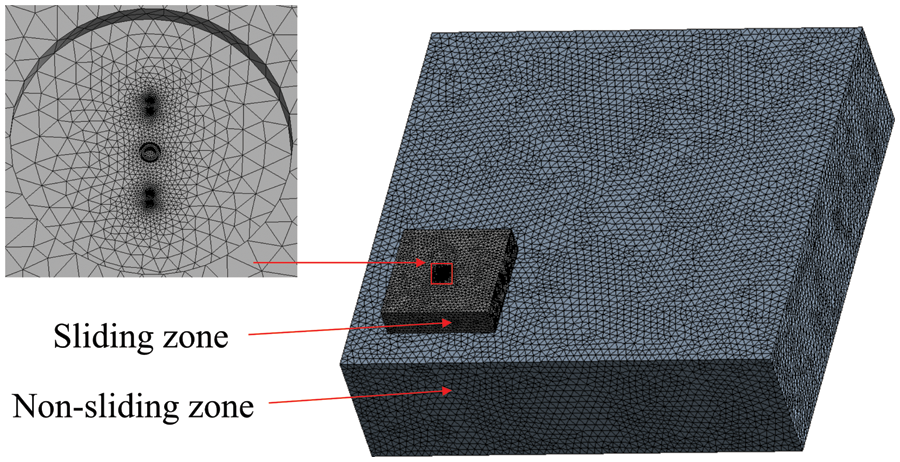
Figure 2: Mesh partitioning of the computational domain
Table 1 indicates that once the number of cells exceeds 994,617, the velocity of the liquid phase within the computational domain remains essentially unchanged. Therefore, in the division of grids, the total number of cells is set to 994,617. With this grid configuration, the average cell quality is 0.87, the minimum orthogonal quality is 1.8, and the skewness is 0.22.
3.2 Simulation Conditions and Parameter Settings
In the numerical simulation process, the spray flow field is set with two phases. The first phase represents air, with a density of 998.2 kg/m³ and a viscosity of 0.0181 mPa·s; the second phase represents paint, with a density of 1200 kg/m³ and a viscosity of 94.27 mPa·s. The viscosity of the water-based paint was measured using a viscometer, as shown in Fig. 3.
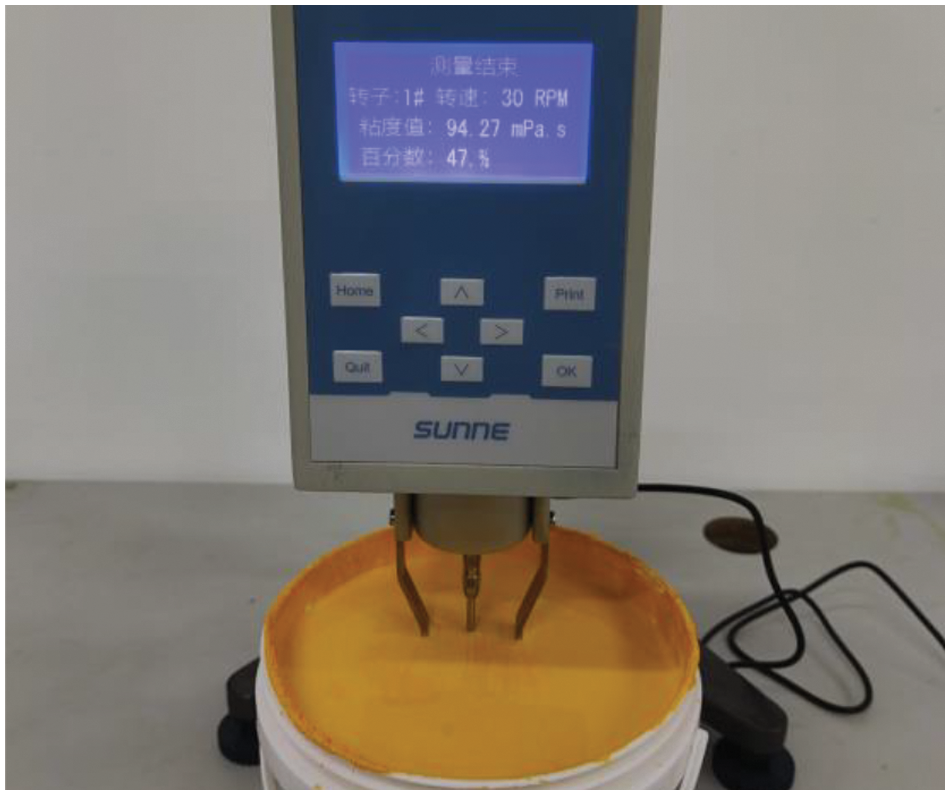
Figure 3: Paint viscometer
In this paper, we employ the Eulerian multi-phase flow model and the standard k-ε turbulence model to simulate the atomization flow field of paint, setting up the Eulerian wall film model to collect paint droplets. Upon inspection, the Y+ value falls within the range of 30–200. Therefore, standard wall functions are used for near-wall treatment. The paint aperture is configured as a mass flow inlet, with the liquid phase mass flow rate being 1.32 × 10⁻³ kg/s and the gas phase mass flow rate at 5 × 10⁻⁶ kg/s. At the liquid phase inlet, the volume fraction is set to 0.2, the turbulence intensity to 15%, and the hydraulic diameter to 2 × 10⁻³ m. The atomization aperture is designated as a pressure inlet with an atomization pressure of 140 kPa. As the spatial distribution of the spray paint in this study was conical, there was no setting for fan control orifices in both numerical simulation and spray experiments.
Langer-Moller et al. [25] compared the results obtained using various numerical simulation methods. In this study, the SIMPLE algorithm is chosen as the pressure-velocity coupling scheme. To reduce computational costs, a gradient method based on the least squares approach is used. The second-order upwind scheme is adopted as the spatial numerical scheme. We employed a second-order implicit time discretization method to ensure computational stability and accuracy. The time step size is set to 1 × 10⁻⁴ s [26].
4.1 Analysis of Spray Flow Field Morphology
Taking the center of the spray gun’s paint nozzle as the origin, a spatial Cartesian coordinate system is established. In this system, the Z-axis is perpendicular to the surface to be painted, the movement direction of the spray gun is defined as the Y-axis, and the X-axis is perpendicular to the YZ plane. The liquid phase velocity distribution under perpendicular spray painting is shown in Fig. 4a, and the distribution under angled spray painting is depicted in Fig. 4b.
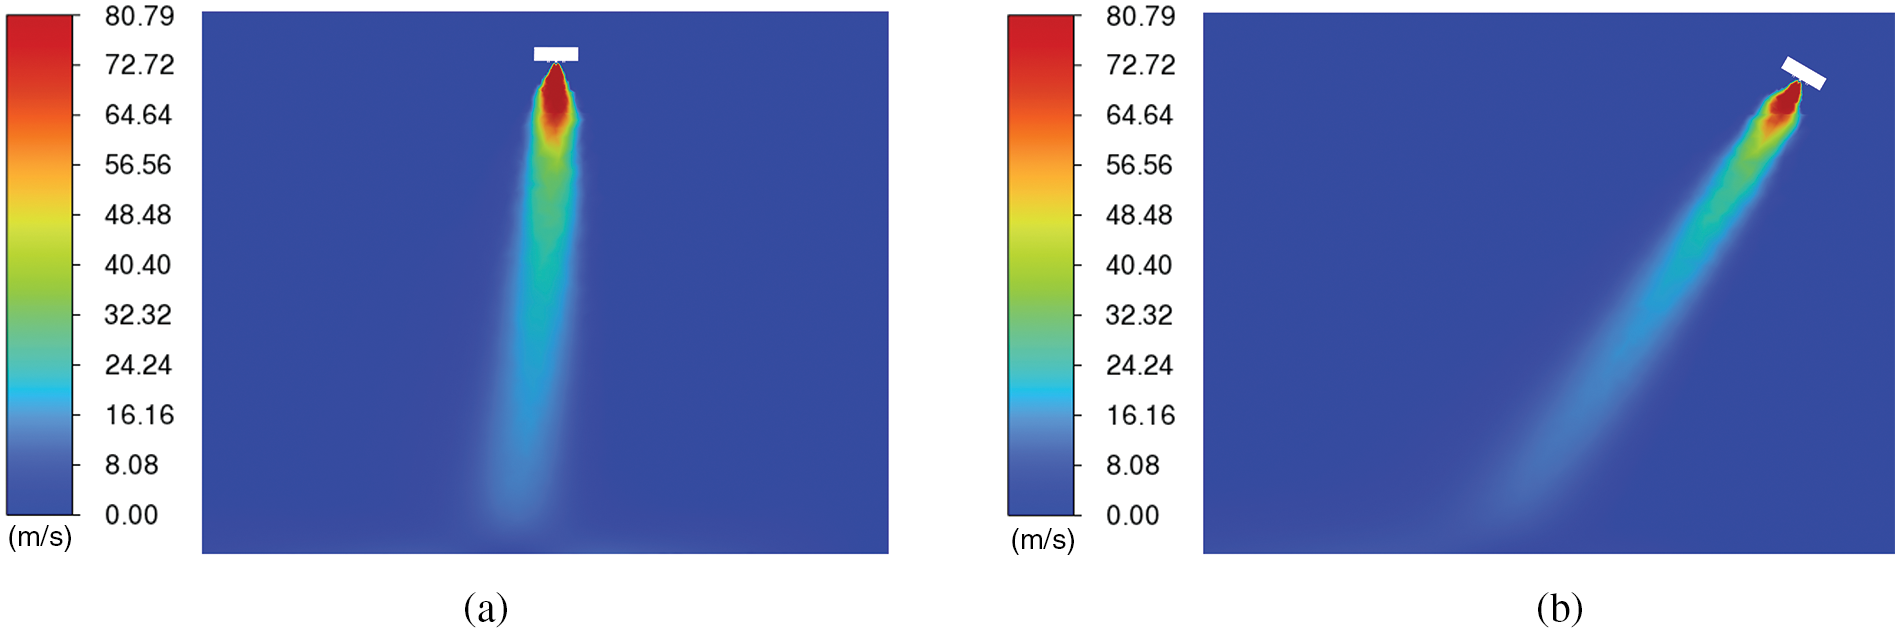
Figure 4: Distribution of spray liquid phase velocity. (a) Vertical spraying. (b) Angled spraying
As Fig. 4 demonstrates, near the air cap, the differences in spray flow field morphology between perpendicular and angled spray painting are almost negligible. However, as the liquid phase particles approach the workpiece, they spread significantly in the negative Y-axis direction due to the spray gun’s angle, which can impact the quality of the film in angled spray painting scenarios. Additionally, Fig. 4a indicates that due to the movement of the spray gun, the spray flow field tends to shift opposite to the direction of motion.
4.2 Effect of Spraying Height on Coating Thickness Distribution
In this section, to thoroughly investigate how varying spray heights affect the distribution of film thickness, the spray angle was fixed at 0 degrees, and the spray gun’s movement speed was set at 0.1 m/s. Numerical simulations were performed at spray heights ranging from 200 to 300 mm, with the results shown in Fig. 5. As illustrated by Fig. 5, with other parameters held constant, an increase in spray height leads to a broader film coverage. The film at the edges becomes more dispersed, worsening the uniformity. This dispersion occurs because the droplets spread due to air resistance during transport, altering their original diffusion path. Conversely, a decrease in spray height results in a smaller area of film coverage, with the paint droplets becoming more concentrated and fewer dispersed droplets at the edges of the coverage area. Theoretically, this should improve film uniformity. However, in practical production, the film thickness at the center of the coverage area may become excessively thick. If the paint film does not solidify in time, sagging may occur, reducing the film’s uniformity.
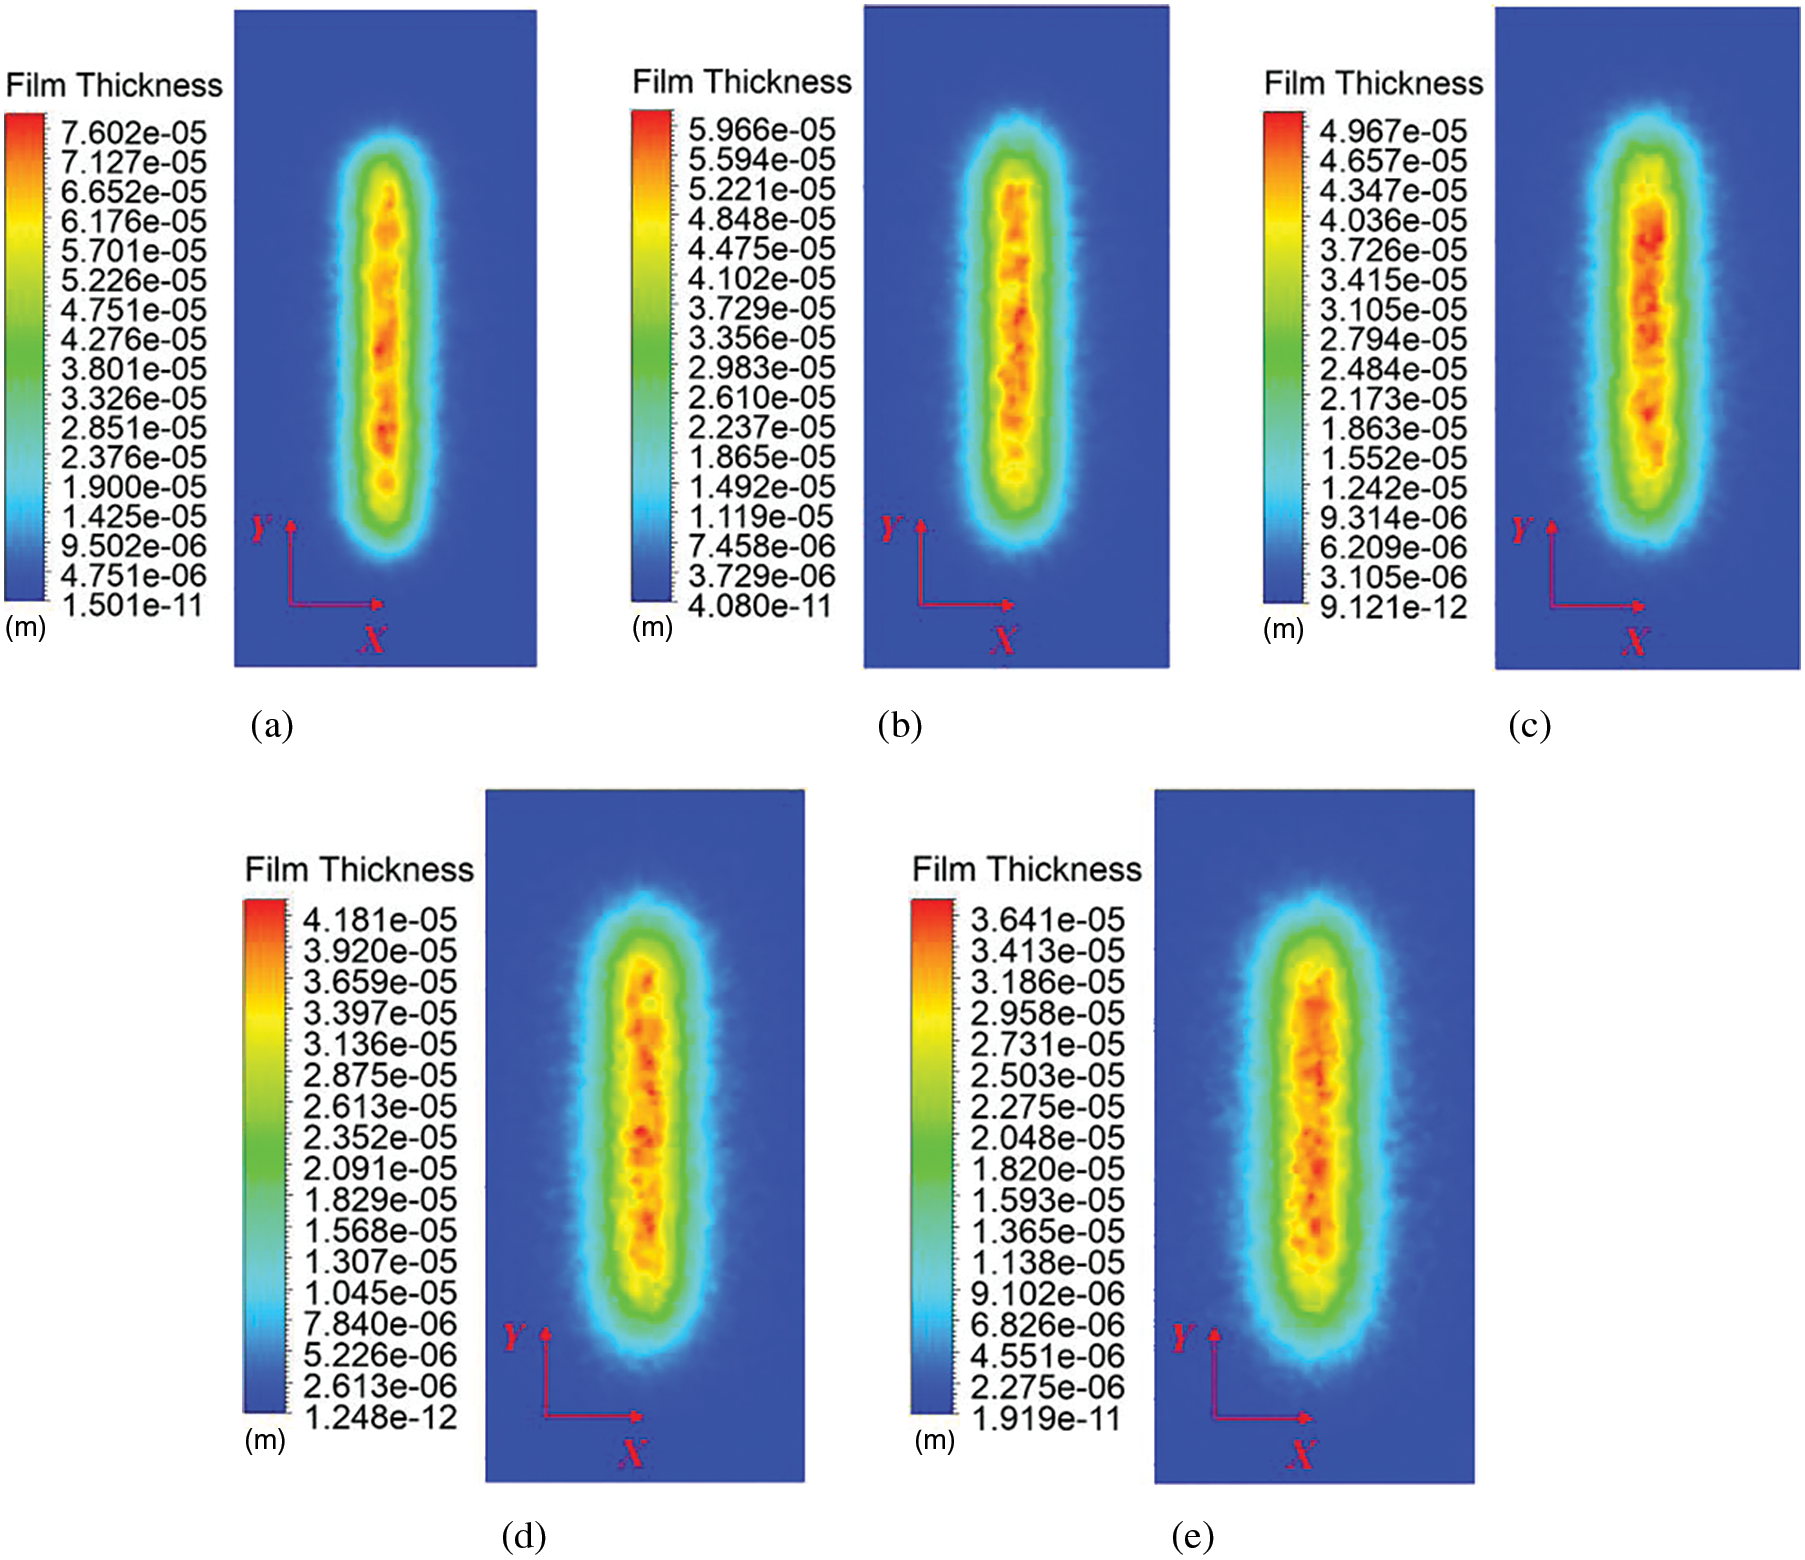
Figure 5: Film thickness distribution at various spray heights. (a) H = 200 mm. (b) H = 225 mm. (c) H = 250 mm. (d) H = 275 mm. (e) H = 300 mm
To provide a more intuitive comparison of film thickness distribution at different spray heights, cross-sections of film thickness were measured every 50 mm within the area covered by the film. The average film thickness at the same positions of these cross-sections was calculated, and a curve graph of average film thickness distribution against spray height was plotted, as shown in Fig. 6.
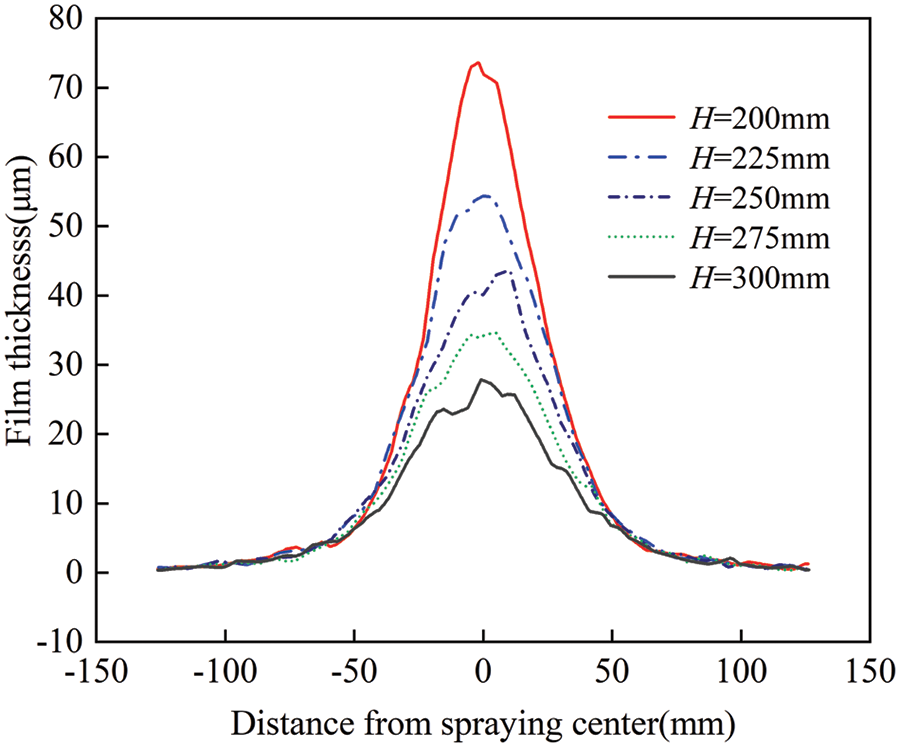
Figure 6: Cross-sectional curves of average film thickness at different spray heights
According to Fig. 6, the film thickness decreases progressively with the spray height rising from 200 to 300 mm. The maximum film thickness decreases from 72.35 to 35.01 μm. Additionally, the smoothness of the average film thickness curve diminishes, indicating a gradual reduction in film uniformity. This phenomenon is attributed to the higher dispersal of paint droplets during transit as the spray height increases.
To more intuitively analyze the variation pattern of maximum film thickness under the influence of different spray heights, the maximum thickness values from the simulation results at various spray heights were collected. A curve illustrating the relationship between maximum film thickness and spray height was then plotted, as shown in Fig. 7. From Fig. 7, it can be observed that as the spray height increases, the trend of decreasing maximum film thickness approximates an inverse proportion function.
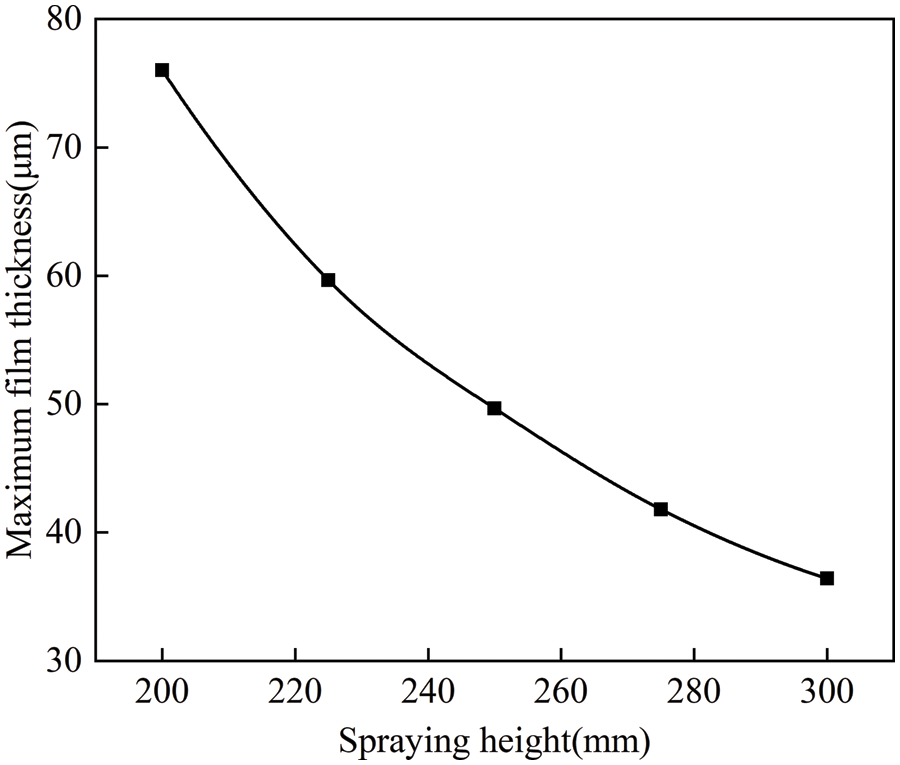
Figure 7: Curve of maximum film thickness variation with spray height
4.3 Effect of Spray Angle on Film Thickness Distribution
In this section, the spray height was fixed at 200 mm and the spray gun’s movement speed at 0.1 m/s. The spray gun was rotated around the X-axis toward the positive direction of the Y-axis at angles of 0°, 10°, 20°, and 30°. Based on this setup, numerical simulations were conducted with the spray gun moving along both the X and Y directions to analyze the effect of the spray angle on the distribution of film thickness.
Fig. 8 indicates that when spraying along the X direction, the film coverage range gradually expands in the Y-axis direction as the spraying angle increases. Due to lateral velocity, paint splashing occurs.
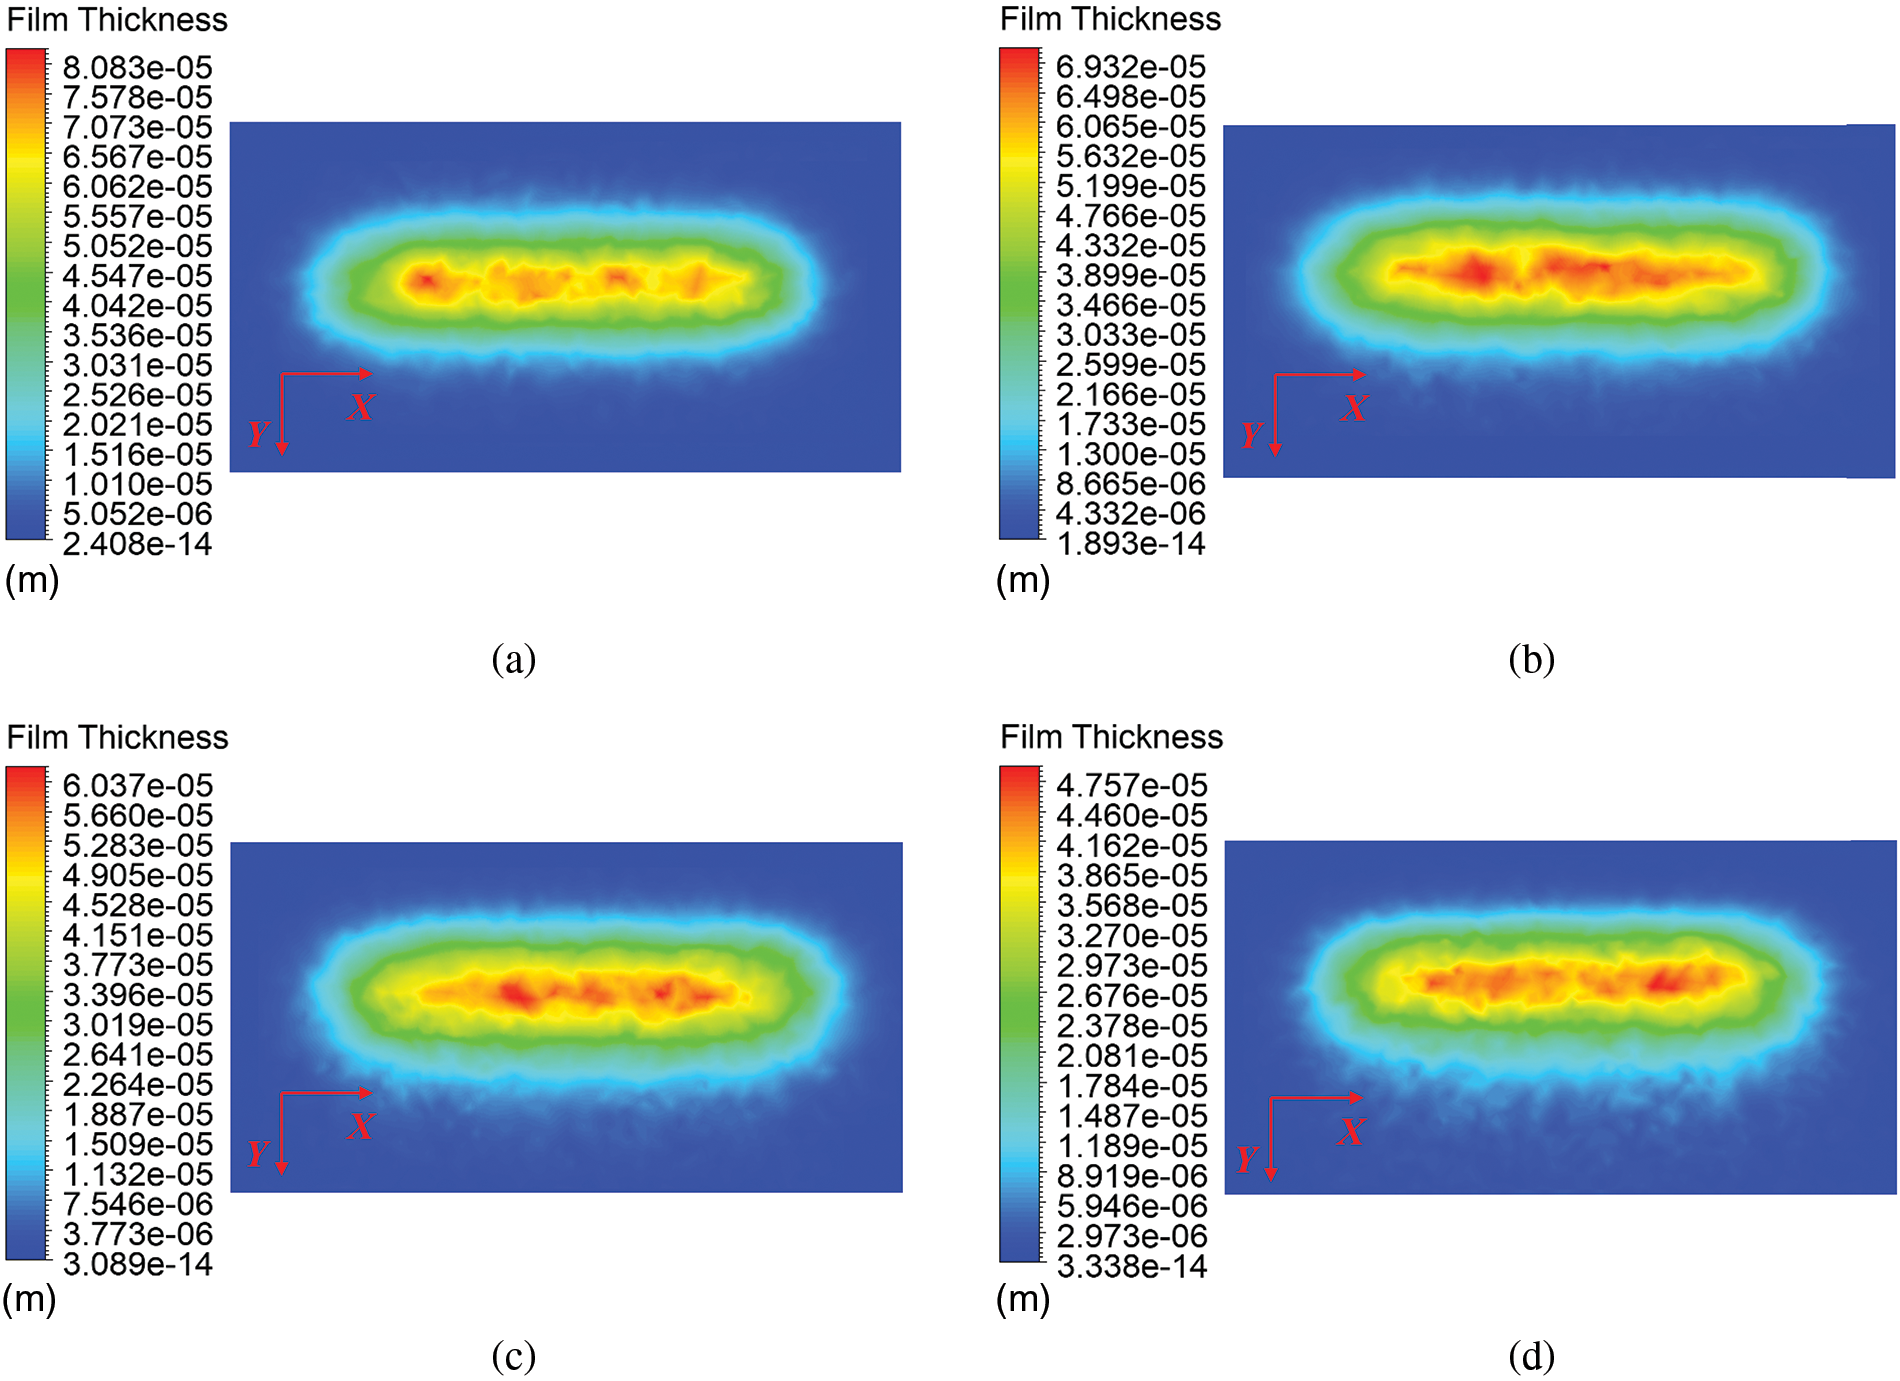
Figure 8: Film thickness distribution when the spray gun moves in the X direction at various angles. (a) α = 0°. (b) α = 10°. (c) α = 20°. (d) α = 30°
As illustrated in Fig. 9, when spraying along the Y direction, the paint coverage area on the X-axis direction gradually increases. According to the simulation results, as the angle of inclination of the spray gun increases from 0° to 30°, the maximum film thickness drops sharply from 76.42 to 49.34 μm. Under the same spraying duration, angled spraying decreases film thickness. This is because the droplets located on the side of the angle inclination have a longer travel distance to reach the workpiece surface compared to those on the other side, resulting in a higher degree of dispersion upon reaching the wall, thus reducing the uniformity of the film. Since the spray gun’s speed and tilt direction are aligned, the paint splashing phenomenon is less severe than when the spray gun moves in the X direction.
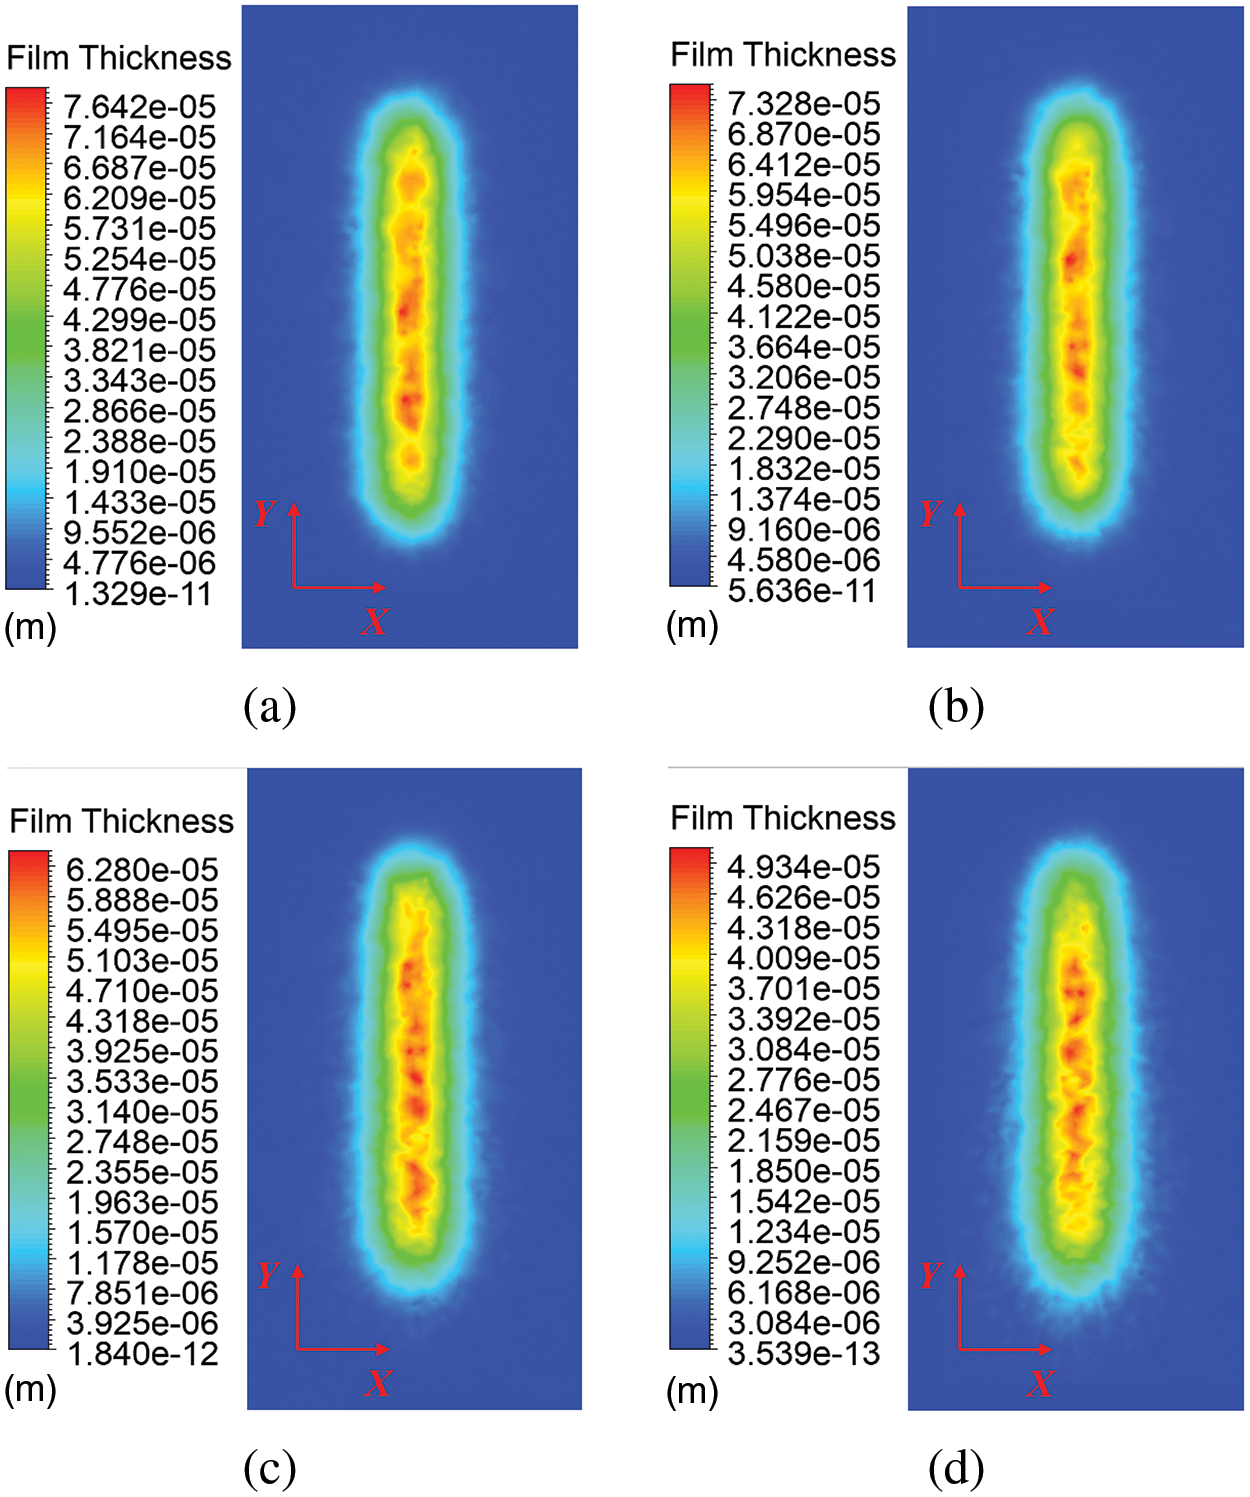
Figure 9: Film thickness distribution when the spray gun moves in the Y direction at various angles. (a) α = 0°. (b) α = 10°. (c) α = 20°. (d) α = 30°
To visually compare film thickness distribution at different spray gun tilt angles, cross-sectional film thickness was measured every 50 mm within the coverage area. The average film thickness at corresponding locations on these cross-sections was calculated, and a comparative graph showing the average film thickness distribution at different spray gun tilt angles was drawn, as shown in Fig. 10.
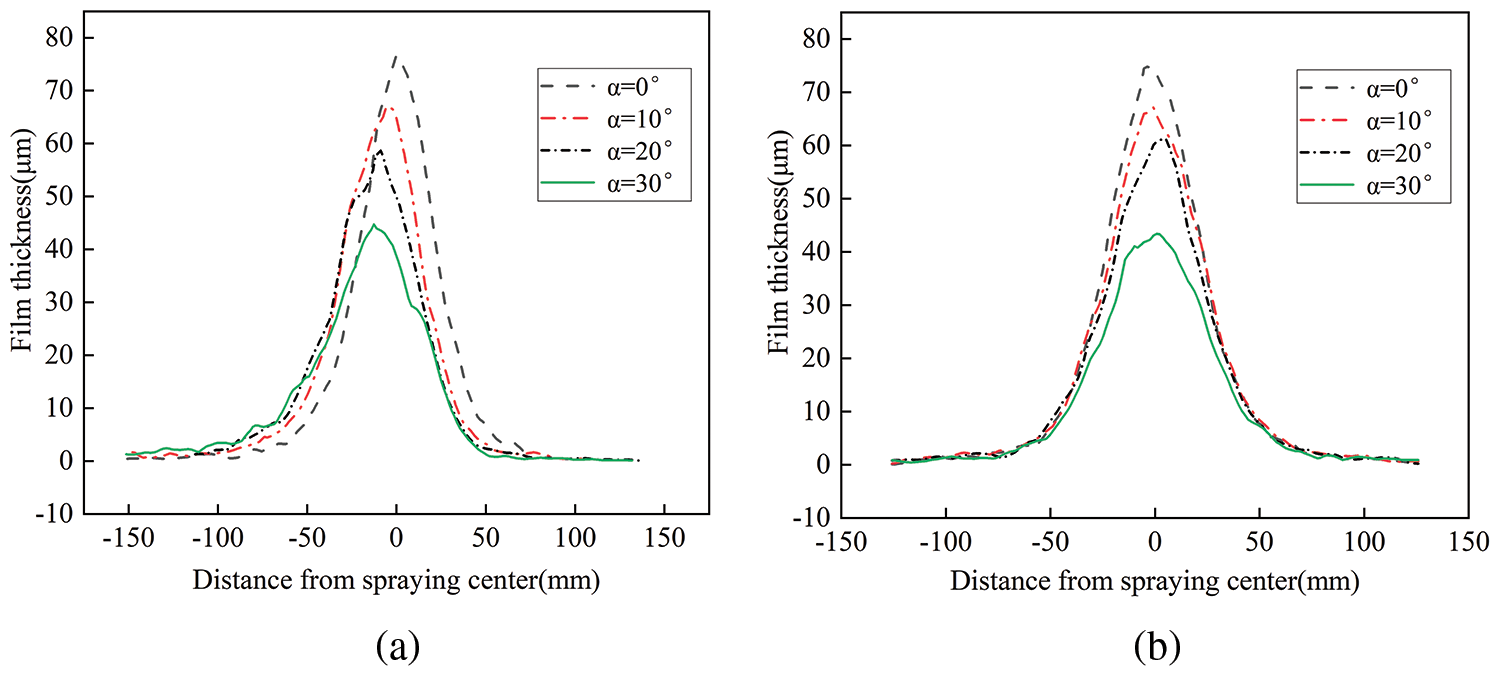
Figure 10: Cross-sectional curves of average film thickness at different spray angles. (a) Spray gun movement along the X-axis. (b) Spray gun movement along the Y-axis
As depicted in Fig. 10a, when the spray gun is tilted, the distribution of film thickness shows a characteristic of being thin on one side and thick on the other. The position of the maximum film thickness moves leftward as the spray angle increases. This shift occurs because the droplets on the negative Y-axis are compressed and rapidly deposited on the workpiece surface, resulting in a concentrated accumulation, while on the positive Y-axis, the droplets are transported farther and thus become more dispersed. As shown in Fig. 10b, the film thickness on both sides of the spray center is symmetrically distributed. This is because, despite the inclination of the spray gun, the liquid velocity is equal on both sides of the origin in the X direction.
To more intuitively analyze the variation in maximum film thickness under different spray angles, maximum thickness values from simulations at various spray angles were collected. A curve depicting how maximum film thickness changes with spray angle was plotted.
From Fig. 11, it is evident that when the spray gun moves in the X direction, the decrease in maximum film thickness with increasing spray angle is approximately linear. Conversely, when the spray gun moves in the Y direction, the rate of decrease in maximum film thickness accelerates with an increase in spray angle. The decrease in maximum film thickness is more gradual when the spray angle is below 10°, but becomes more pronounced when the angle exceeds 10°. This is due to the increased paint droplet splashing and lower paint utilization as the spray angle increases.
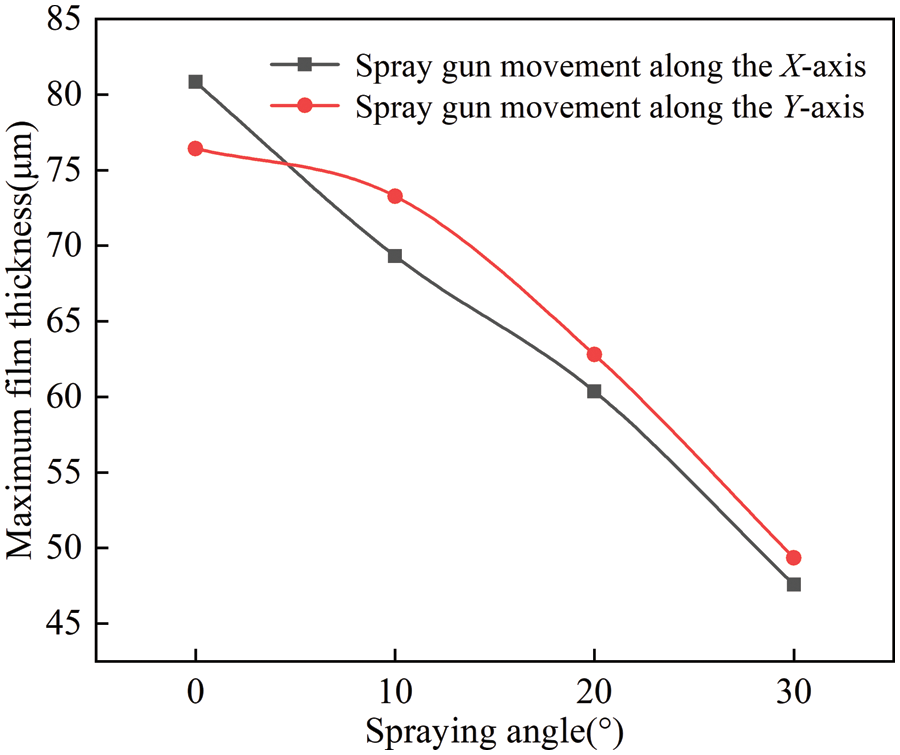
Figure 11: Curve of maximum film thickness variation with spray tilt angle
4.4 Effect of Spray Gun Movement Speed on Film Thickness Distribution
In this section, with the spray height fixed at 200 mm and the spray angle at 0°, spray gun movement speeds were set between 0.1 and 0.5 m/s for numerical simulations to analyze the effect of spray gun movement speed on film thickness distribution.
As Fig. 12 indicates, with an increase in spray gun movement speed, the film at the edges becomes more dispersed, leading to a deterioration in film uniformity. This is due to the increase in air resistance encountered by the spray gun as its movement speed increases, which increases the influence of the airflow on the spray droplets during transport, causing the droplets to diverge more. When the spray gun movement speed is at 0.1 m/s, the maximum film thickness is 76.61 μm; however, as the speed gradually increases to 0.5 m/s, the maximum film thickness decreases to only 14.52 μm. At this point, the film thickness is unable to meet the coating quality requirements for most products.
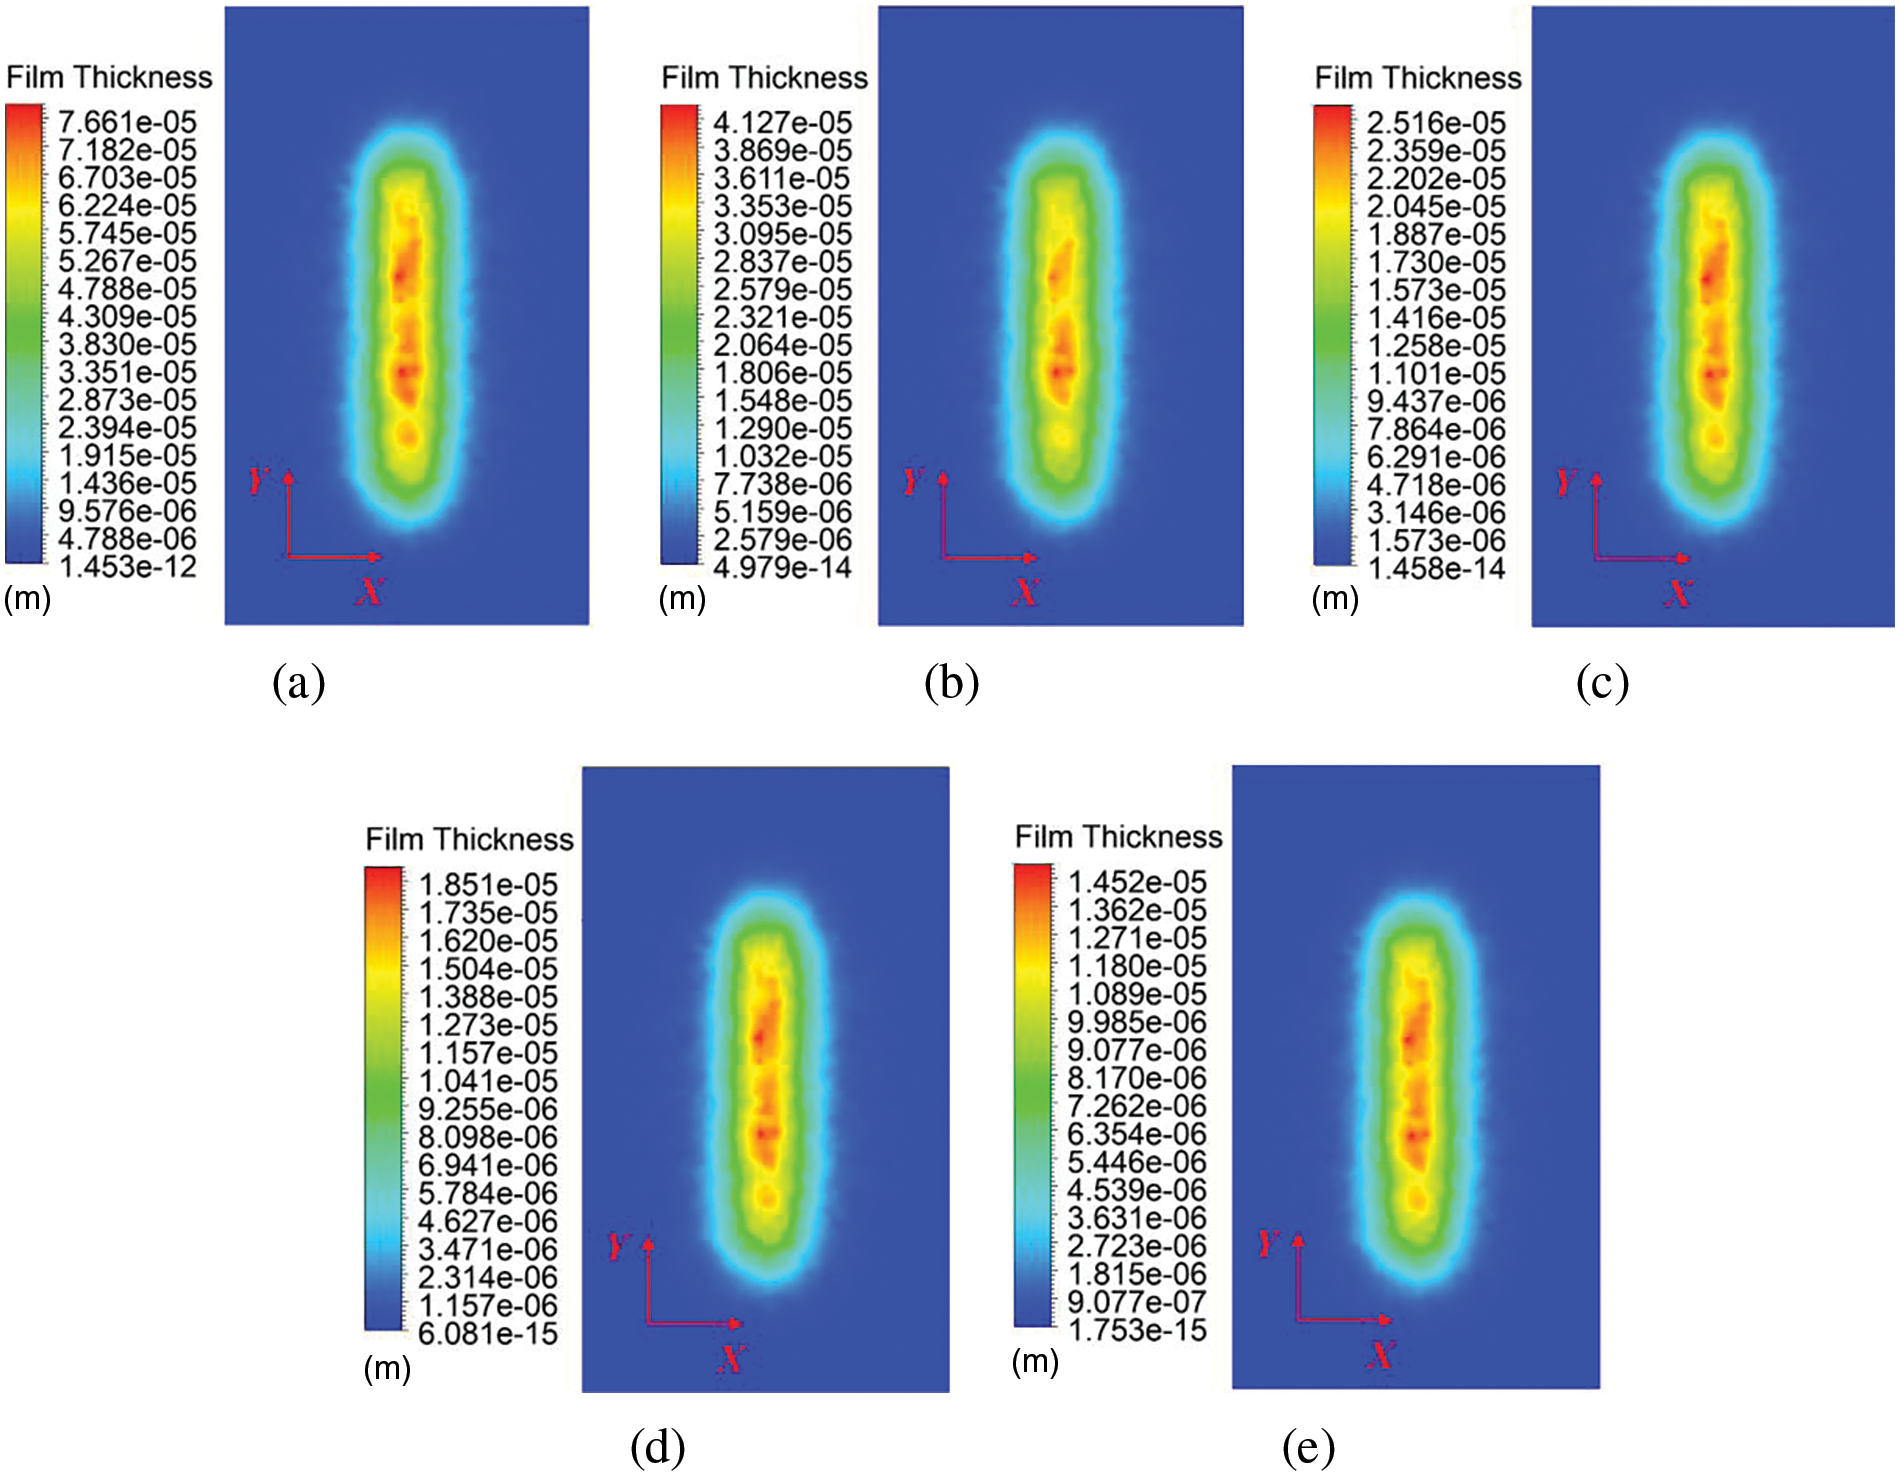
Figure 12: Film thickness distribution at different spray gun movement speeds. (a) V = 0.1 m/s. (b) V = 0.2 m/s. (c) V = 0.3 m/s. (d) V = 0.4 m/s. (e) V = 0.5 m/s
To provide a more intuitive comparison of the film thickness distribution at different spray gun movement speeds, cross-sectional film thicknesses were measured every 50 mm within the covered area. The average film thickness at the same positions of these sections was calculated, and a comparative graph of the average film thickness distribution under different spray gun movement speeds was drawn, as illustrated in Fig. 13.
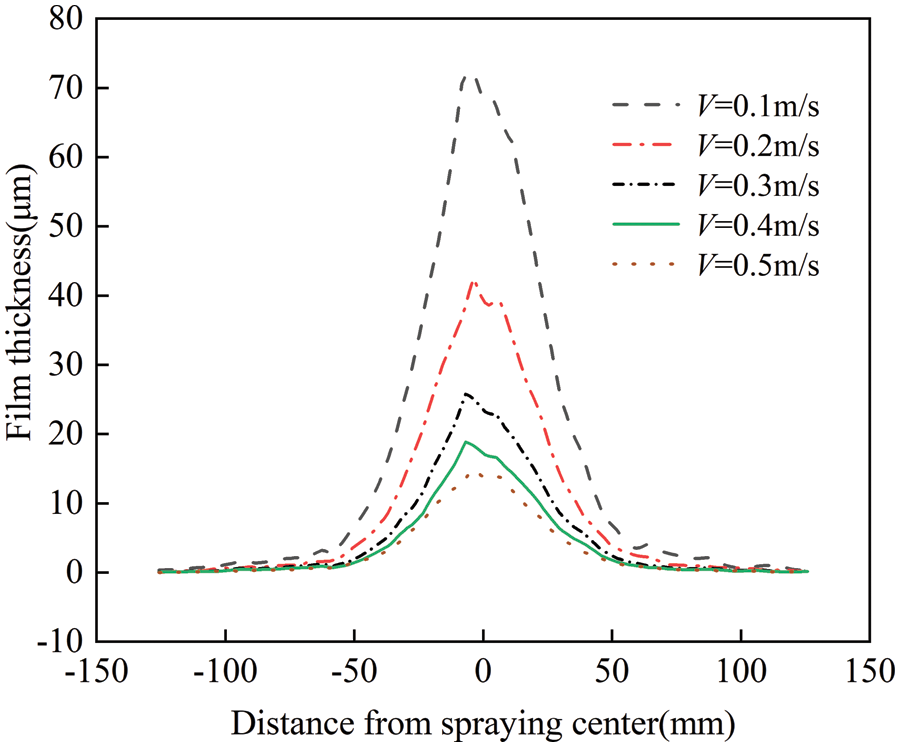
Figure 13: Cross-sectional curves of average film thickness at different spray gun movement speeds
Fig. 13 indicates that with an increase in spray gun movement speed, the maximum film thickness decreases. This is because the faster the movement speed of the spray gun, the fewer paint droplets the workpiece surface receives per unit time and area. In actual production, the determination of the spray gun movement speed is related to multiple factors such as the drying speed and viscosity of the paint, as well as the ambient temperature.
To analyze the variation pattern of maximum film thickness under different spray gun movement speeds more intuitively, the maximum film thickness values from the simulations at each spray gun movement speed were collected. A curve depicting the change in maximum film thickness with varying spray gun movement speeds was plotted.
According to Fig. 14, as the movement speed of the spray gun increases, the rate of decrease in maximum film thickness slows down, approximating an inverse proportion function. When the spray gun movement speed is below 0.3 m/s, the maximum film thickness decreases at a faster rate. However, when the speed exceeds 0.3 m/s, the rate of decrease slows down and continues to decelerate further.
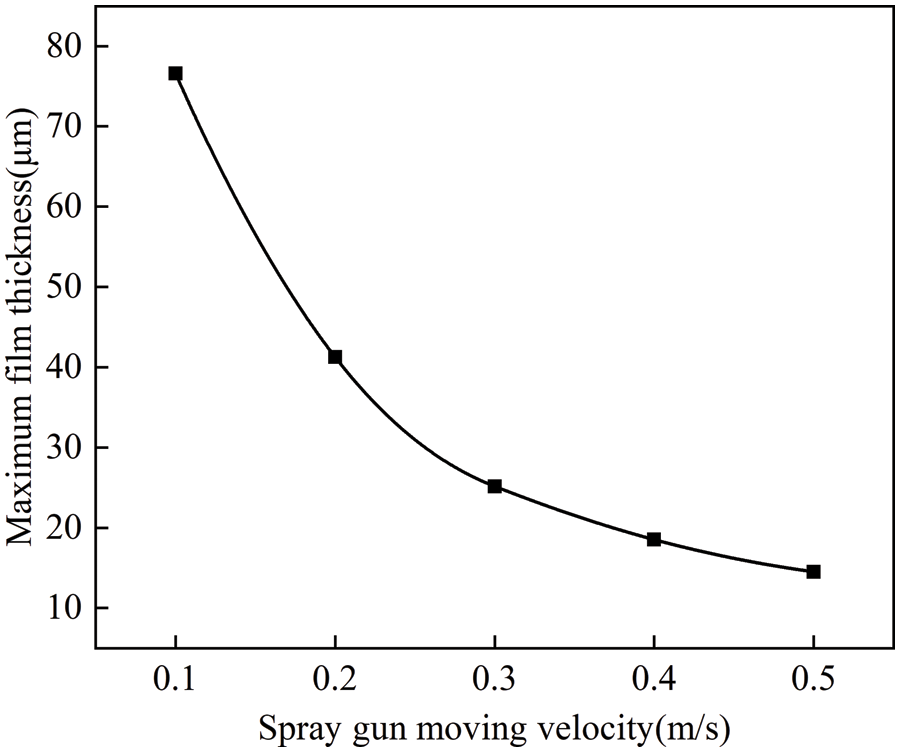
Figure 14: Curve of maximum film thickness with changes in spray gun movement speed
4.5 Effect of Spray Trajectory Curvature Radius on Film Thickness Distribution
In this section, the spray height was fixed at 200 mm, the spray angle at 0°, and the spray gun’s linear speed was 0.1 m/s. When the spray gun moving along a circular arc trajectory, numerical simulations were conducted with arc radii ranging from 50 to 200 mm to analyze how the spray trajectory curvature radius affects the film thickness distribution. The distribution of film thickness at different curvature radii is shown in Fig. 15. The figure indicates that the variation in spray trajectory curvature radius has a minimal impact on the maximum film thickness.
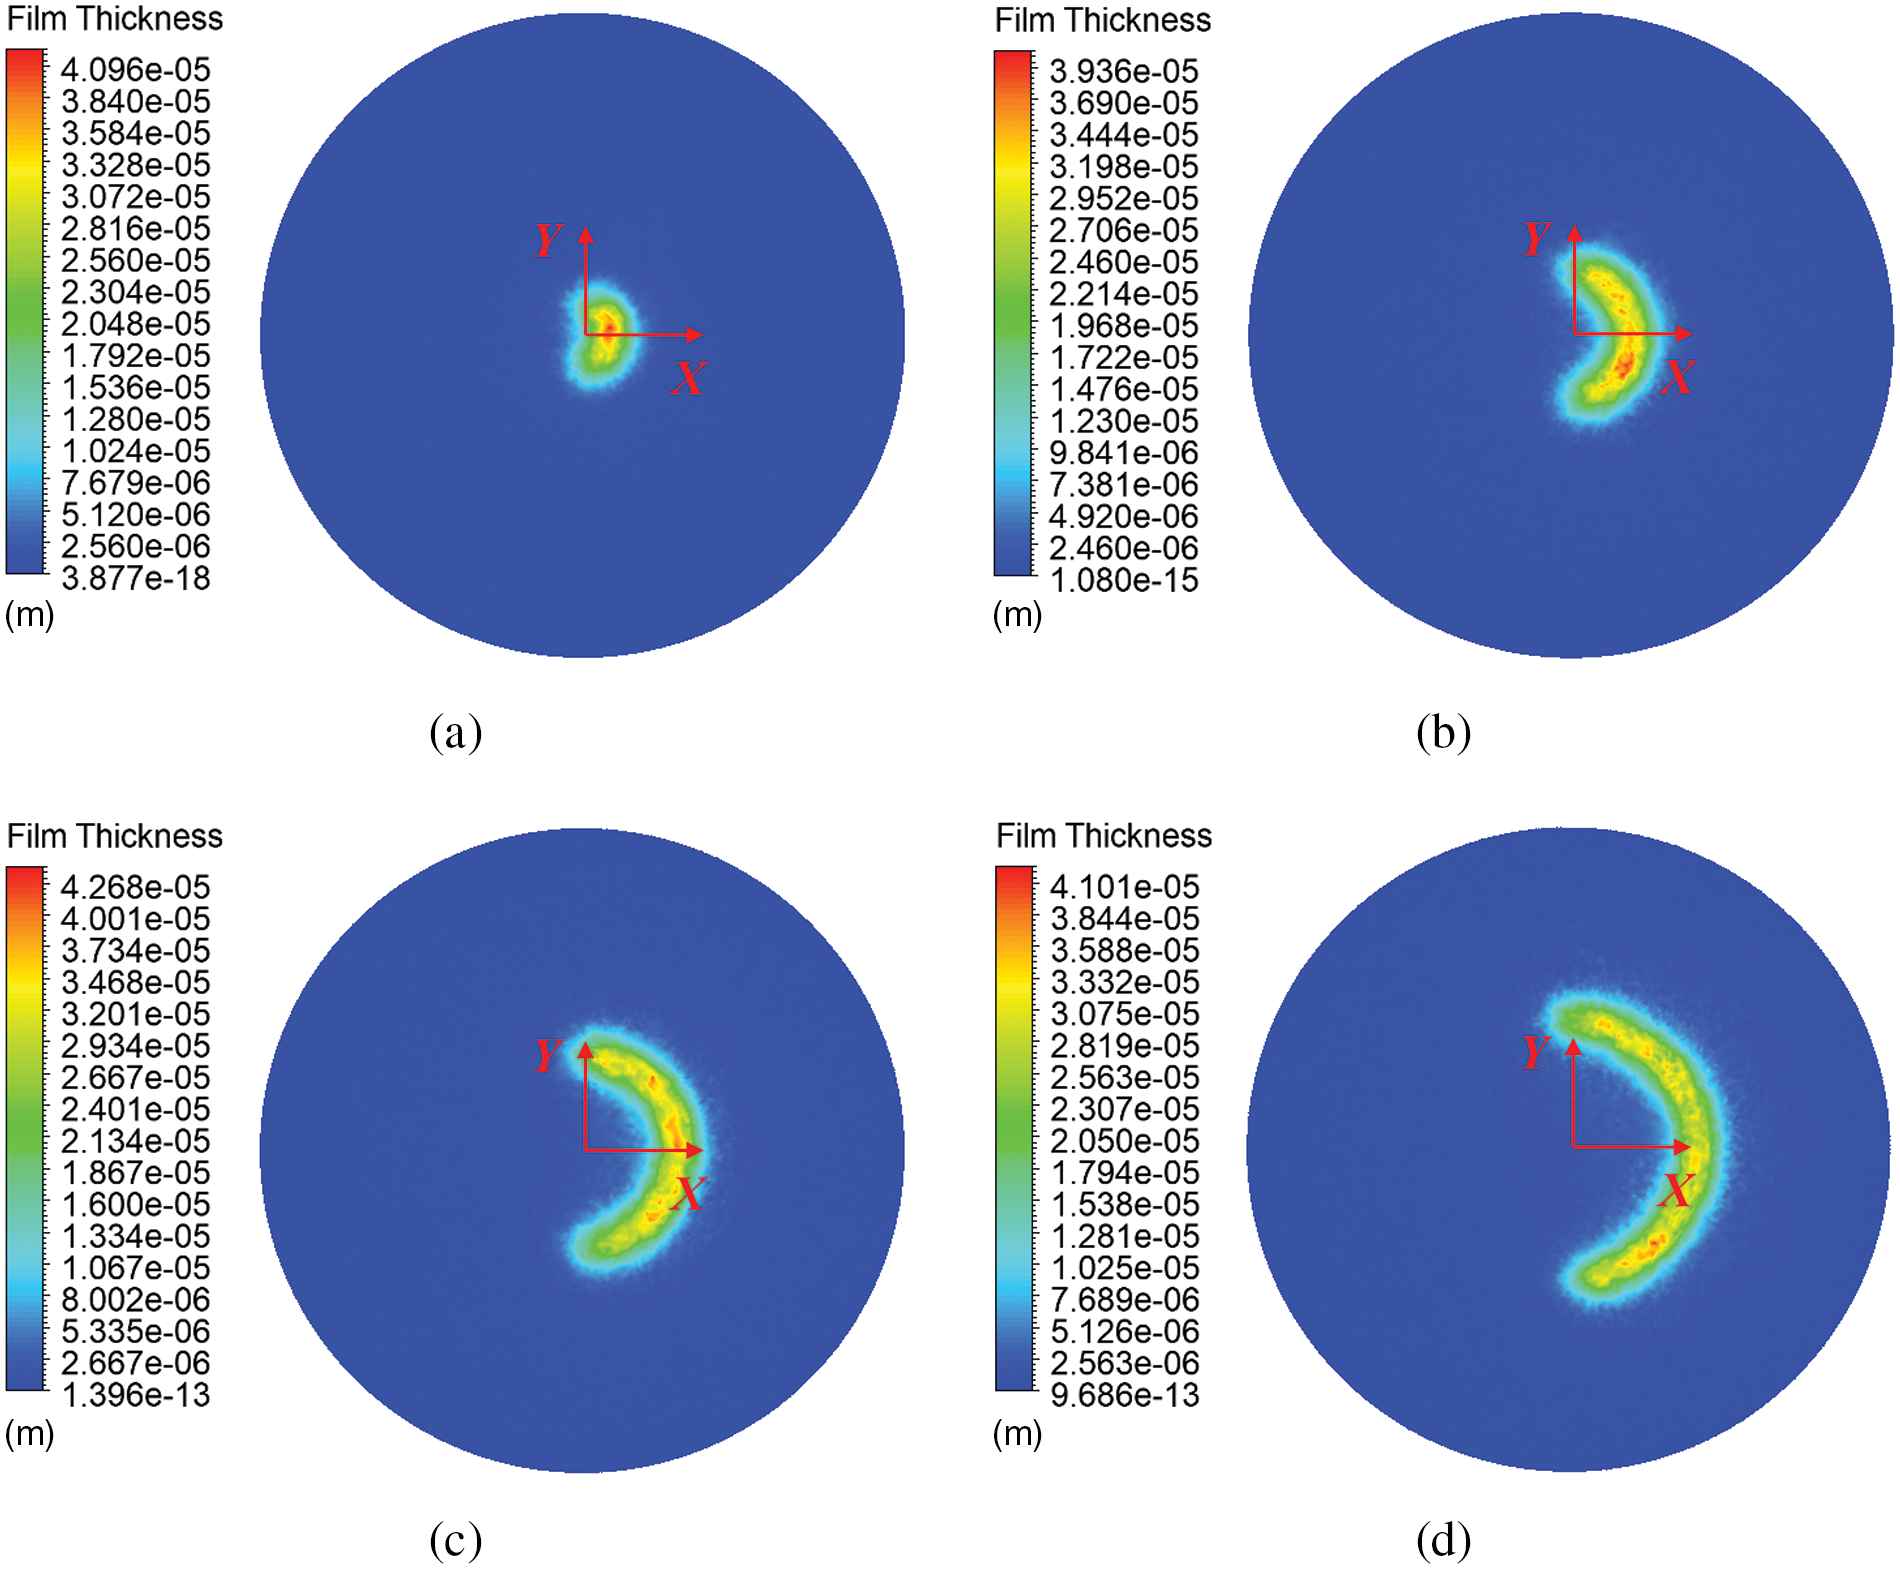
Figure 15: Film thickness distribution under different spray trajectory curvature radii. (a) R = 50 mm. (b) R = 100 mm. (c) R = 150 mm. (d) R = 200 mm
Based on the simulation results, average cross-sectional film thickness curves for each curvature radius were plotted, as shown in Fig. 16. The figure reveals that when the spray gun moves along a circular arc trajectory, the film thickness on the inside of the arc tends to be slightly greater than that on the outside. This is attributed to the shorter arc length of the inner arc within the same spraying duration. As the arc radius increases, this phenomenon gradually becomes less noticeable and eventually disappears.
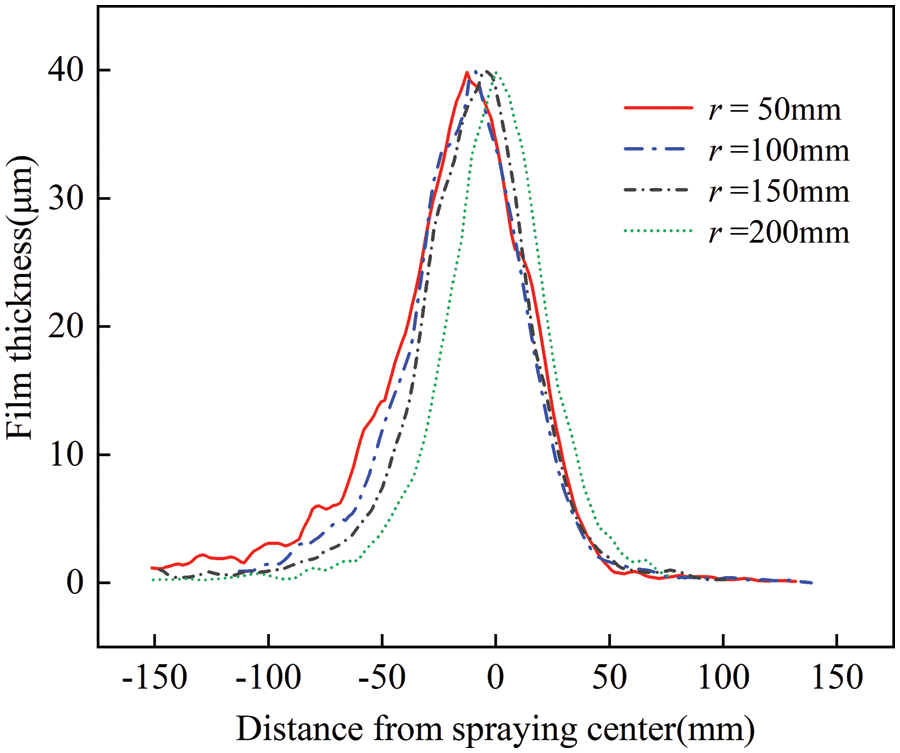
Figure 16: Average film thickness cross-sectional curves for various spray trajectory curvatures
Building on the research concerning the impact of spray angles on film thickness distribution, it has been observed that angled spraying causes the liquid film on either side of the spray torch center to shift towards one side, as illustrated in Fig. 17. In practical spraying applications, if a smaller spray curvature radius is needed for trajectory planning, this characteristic of angled spraying can be utilized to eliminate the uneven distribution of film thickness on both sides of the arc.
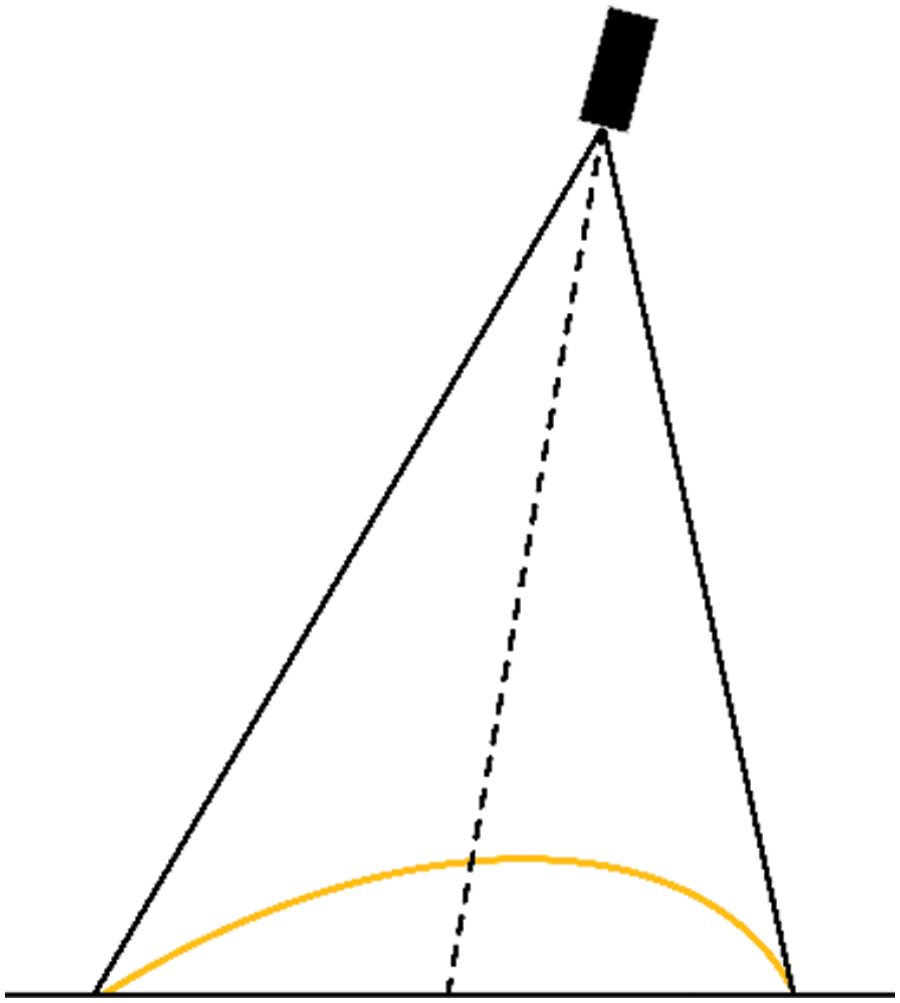
Figure 17: Schematic diagram of coating deposition by angled spraying
4.6 Effect of Air Pressure on Coating Thickness Distribution
In this section, the spray height is fixed at 200 mm, the spray angle is set to 0°, and the spray gun movement speed is 0.1 m/s. The air pressure is set between 0.15 and 0.25 MPa for numerical simulations. The coating thickness distribution under different air pressure conditions is shown in Fig. 18. The figure indicates that an increase in air pressure expands the coating coverage area. This is because increased air pressure enlarges the spray width. As the air pressure increases, theoretically, the paint particles become finer, allowing for more uniform coverage of the sprayed surface, thereby improving the coating’s uniformity and smoothness. However, as shown in Fig. 18e, if the pressure is too high, it may result in paint wastage and splatter, negatively affecting the coating quality.
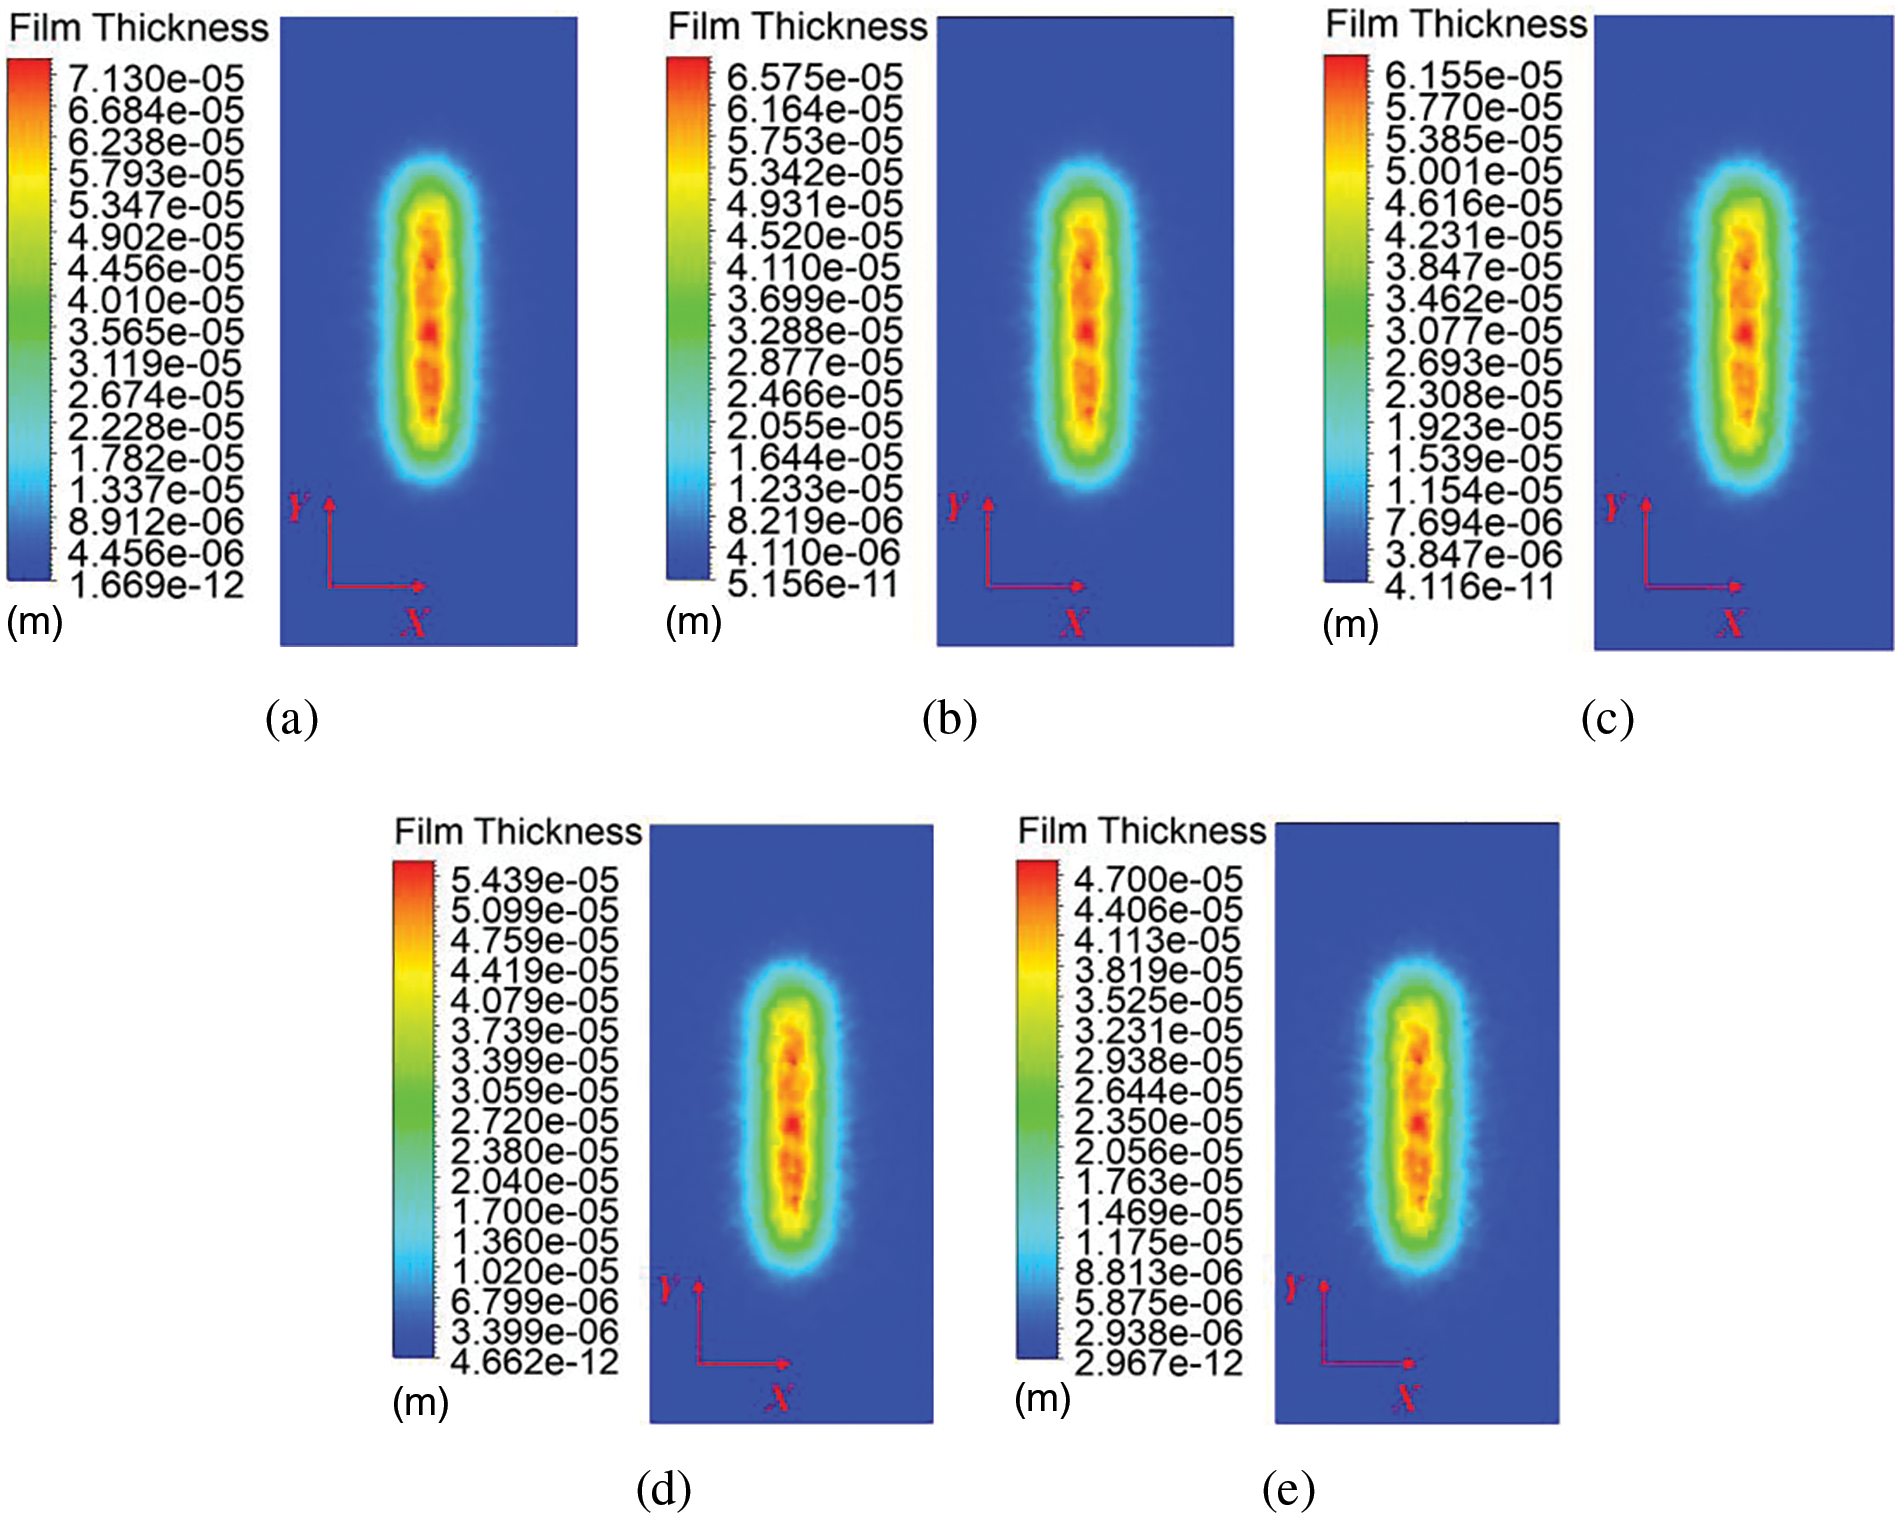
Figure 18: Film thickness distribution at various air pressures. (a) P = 1.5 MPa. (b) P = 1.75 MPa. (c) P = 2.0 MPa. (d) P = 2.25 MPa. (e) P = 2.5 MPa
Based on the simulation results, we plotted the cross-sectional curves of average coating thickness under different air pressures, as shown in Fig. 19. As the paint particles become finer, the amount of paint deposited per unit area may decrease, leading to a thinner coating. To achieve the desired coating thickness, adjustments to the spraying speed and the number of passes are necessary. With increasing air pressure, the paint droplets become more fully atomized, resulting in progressively smoother cross-sectional profiles.
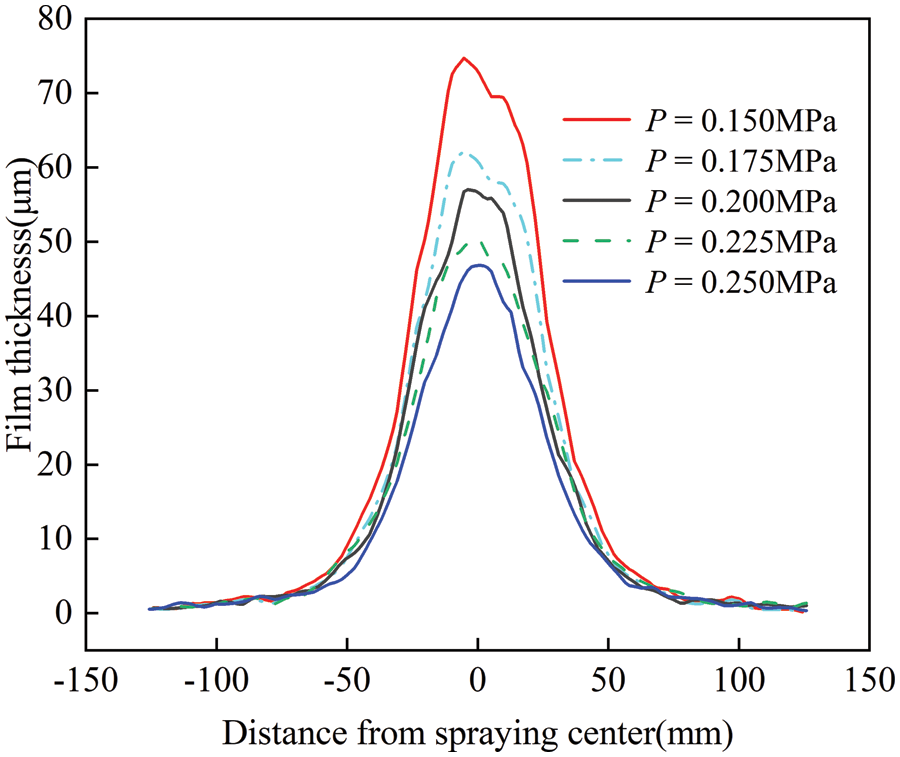
Figure 19: Cross-sectional curves of average film thickness at different air pressures
To determine the variation in maximum film thickness under different air pressures, the maximum thickness values from the simulation results at each air pressure were collected. The curve showing the change in maximum film thickness with varying air pressures is plotted in Fig. 20. As shown in Fig. 20, as the air pressure increases, the maximum film thickness continuously decreases. The decreasing trend of the data approximates a straight line, demonstrating a significant linear decline.
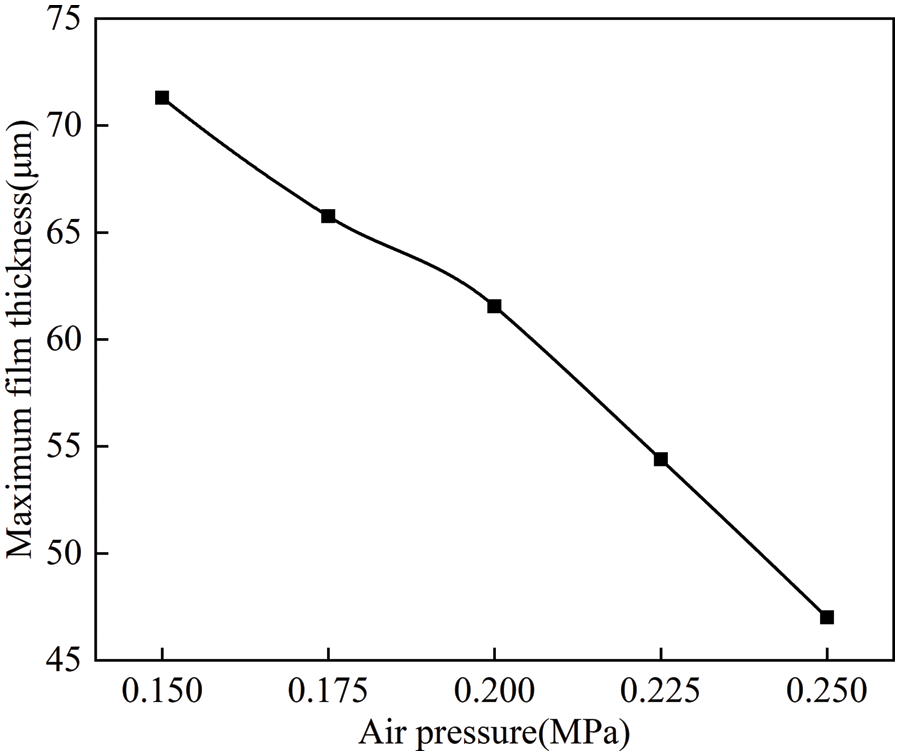
Figure 20: Curve of maximum film thickness variation with air pressure
4.7 The Combined Effects of Various Spray Parameters on Film Thickness Distribution
From the analysis provided, it is evident that the distribution of film thickness is significantly influenced by factors such as spray height, spray angle, and the velocity of the spray gun’s movement. However, the discussion so far has focused only on the influence of these factors individually on film thickness distribution, without exploring the combined effects of multiple parameters. The subsequent section will utilize the orthogonal experimental method to examine the impact on film thickness distribution when variables such as spray height, spray angle, and spray gun movement speed are altered simultaneously. This exploration aims to identify the optimal adjustment ranges for spray height and spray angle across various spray gun movement speeds, within which satisfactory film quality can be achieved. The spray parameters selected for investigation are detailed in Table 2, and the orthogonal experiments are structured around these parameters.

Spray painting practice indicates that if the film thickness is too thin, it can lead to poor leveling of the paint film; conversely, if the film thickness is too thick, sagging may occur. Therefore, in this experiment, the maximum film thickness was set to be between 20 and 60 μm, ensuring complete coating coverage and free of defects such as sagging. Based on the results obtained from the orthogonal experiments and adhering to the aforementioned film quality standards, suitable spraying parameters were identified. A diagram illustrating the relationship between the adjustable range of spray height and spray angle under different spray gun movement speeds was plotted, as shown in Fig. 21.
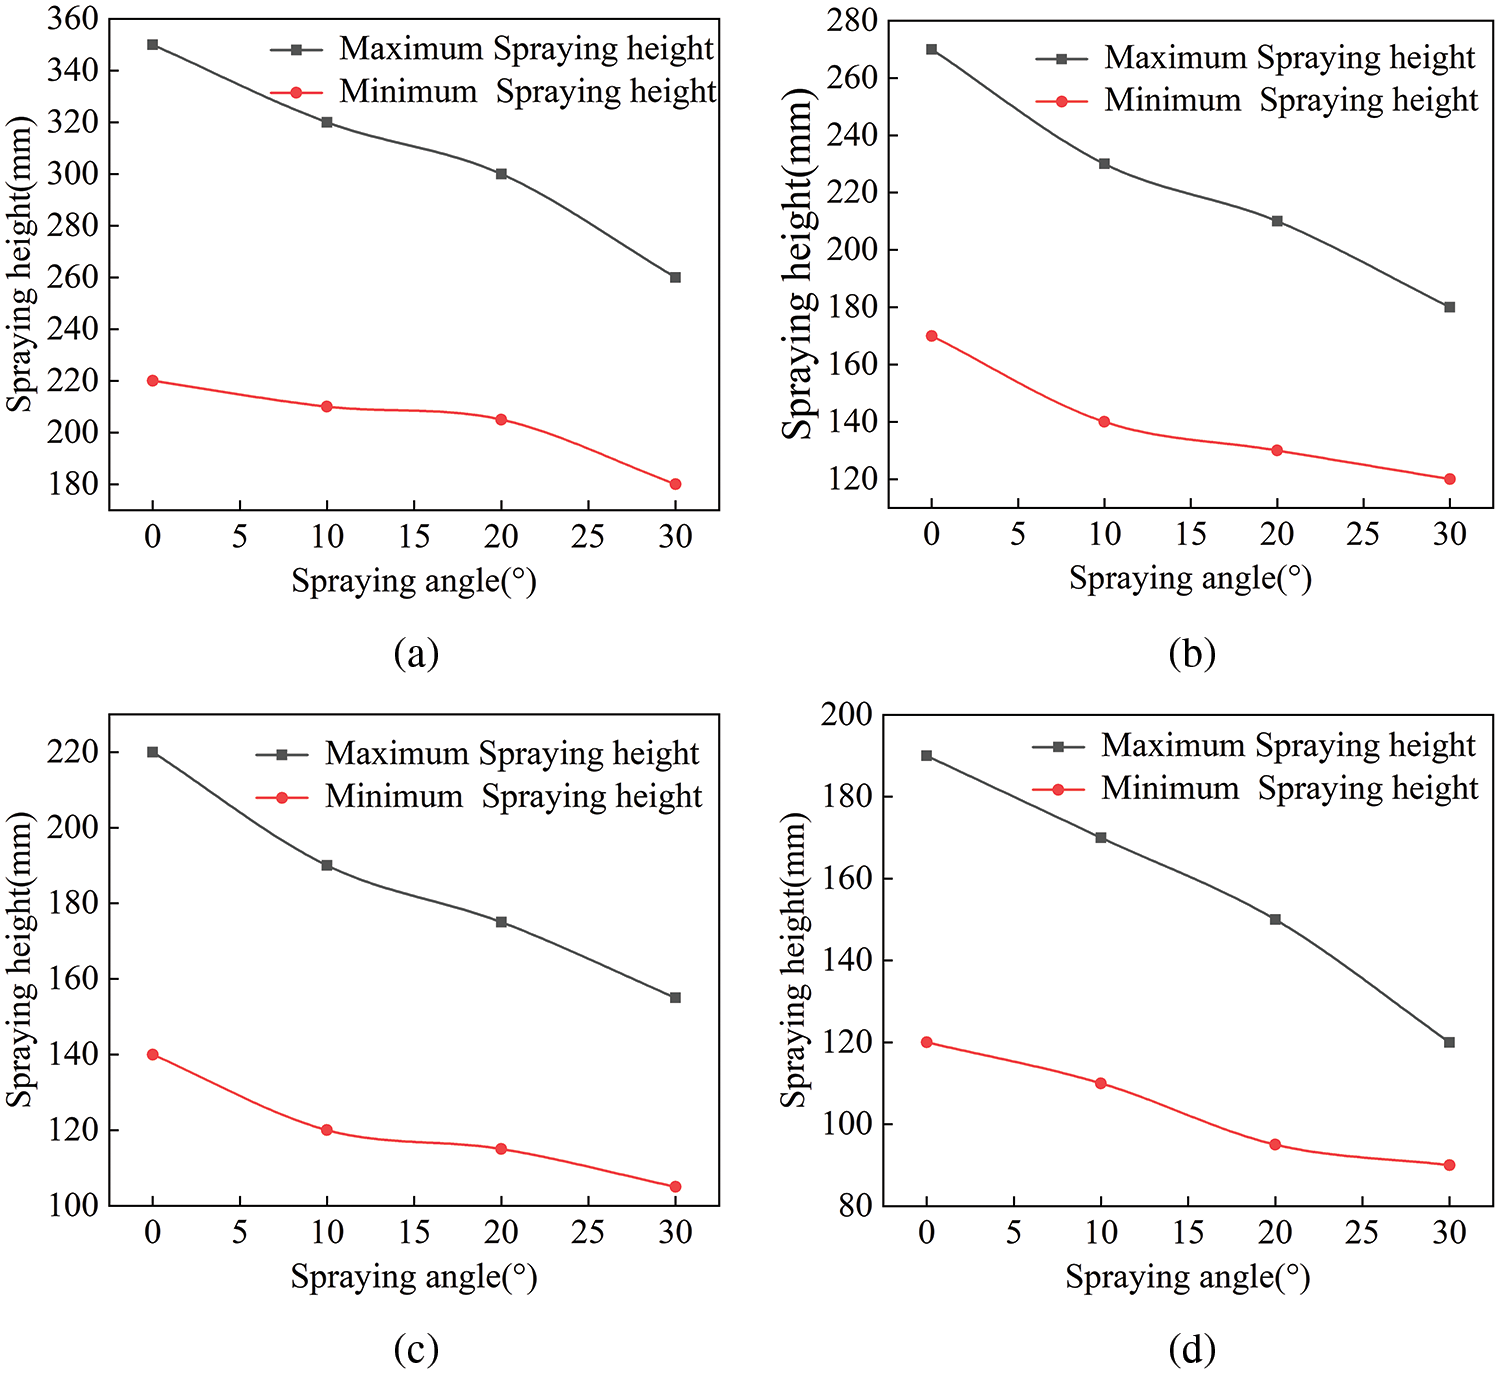
Figure 21: Optimal adjustment ranges for spray height and angle at different spray gun speeds. (a) V = 0.1 m/s. (b) V = 0.2 m/s. (c) V = 0.3 m/s. (d) V = 0.4 m/s
Fig. 21 indicates that as the spray gun movement speed increases, the adjustable range of spray heights under different spray angles becomes narrower, and the overall height continuously decreases. With a fixed spray gun movement speed, as the spray angle increases from 0° to 30°, the adjustable range of spray heights also narrows. As shown in Fig. 21a, at a spray gun movement speed of 0.1 m/s and a spray angle of 0°, the adjustable range of spray heights is from 220 to 350 mm, within which the spray angle is almost non-adjustable. As the spray angle increases, both the maximum and minimum spray heights decrease. With the reduction in spray height, the adjustable range of spray angles continuously expands. At a spray height of 220 to 260 mm, the spray angle can be freely adjusted between 0° and 30°. Similarly, as shown in Figs. 21b to 21d, at spray gun movement speeds of 0.2–0.4 m/s respectively, the range of spray heights within which the spray angle can be freely adjusted between 0° and 30° are 170 to 180 mm, 140 to 160 mm, and 120 to 130 mm, with other characteristics being similar to those at a speed of 0.1 m/s.
An experiment of dynamic spray painting with an air spray gun in varying poses on a flat plane was conducted to verify the accuracy of the numerical simulation results. The physical experimental setup is shown in Fig. 22. The main experimental equipment includes a spray painting robot, an Iwata WRA-101 air spray gun, an air compressor, and a pneumatic diaphragm pump, among others. Commercial water-based paint was used as the deposition material, and the substrate was a 5 mm thick flat aluminum plate, which had been sanded to a smooth finish before the experiment. The spray height was set at 200mm, and the spray angles were set at 0°, 10°, 20°, and 30°, with the spray gun moving in the Y direction for the dynamic spray painting experiment. During the experiment, the air pressure from the compressor was set at 0.2 MPa, and the spray gun movement speed was 0.1 m/s. After completing the dynamic spray painting experiment, the workpiece was left undisturbed until the coating was completely dry.
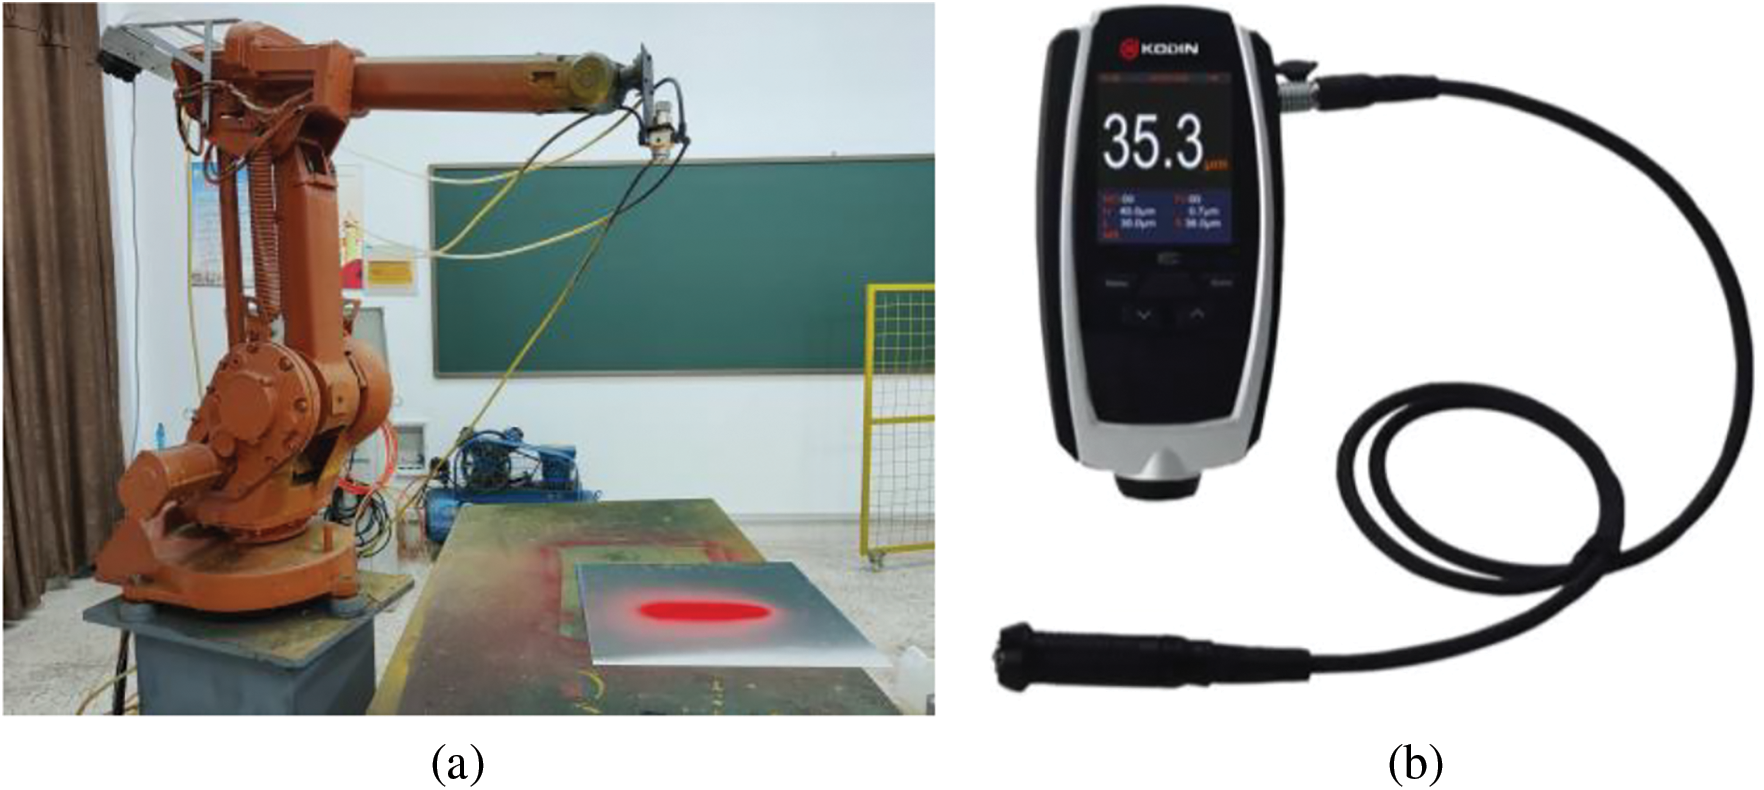
Figure 22: Spray experiment equipment. (a) Spray painting robot. (b) Coating thickness gauge. (c) Pneumatic diaphragm pump. (d) Air compressor
Fig. 23 shows the results of the painting experiment. In areas with better spray quality, points were taken every 5 mm along the X direction to measure the coating cross-section thickness, and this measurement was repeated 5 times to take the average value. This procedure was then repeated along the Y direction at 30 mm intervals. After all measurements were completed, the average film thickness for each corresponding point on the cross-sections was calculated.
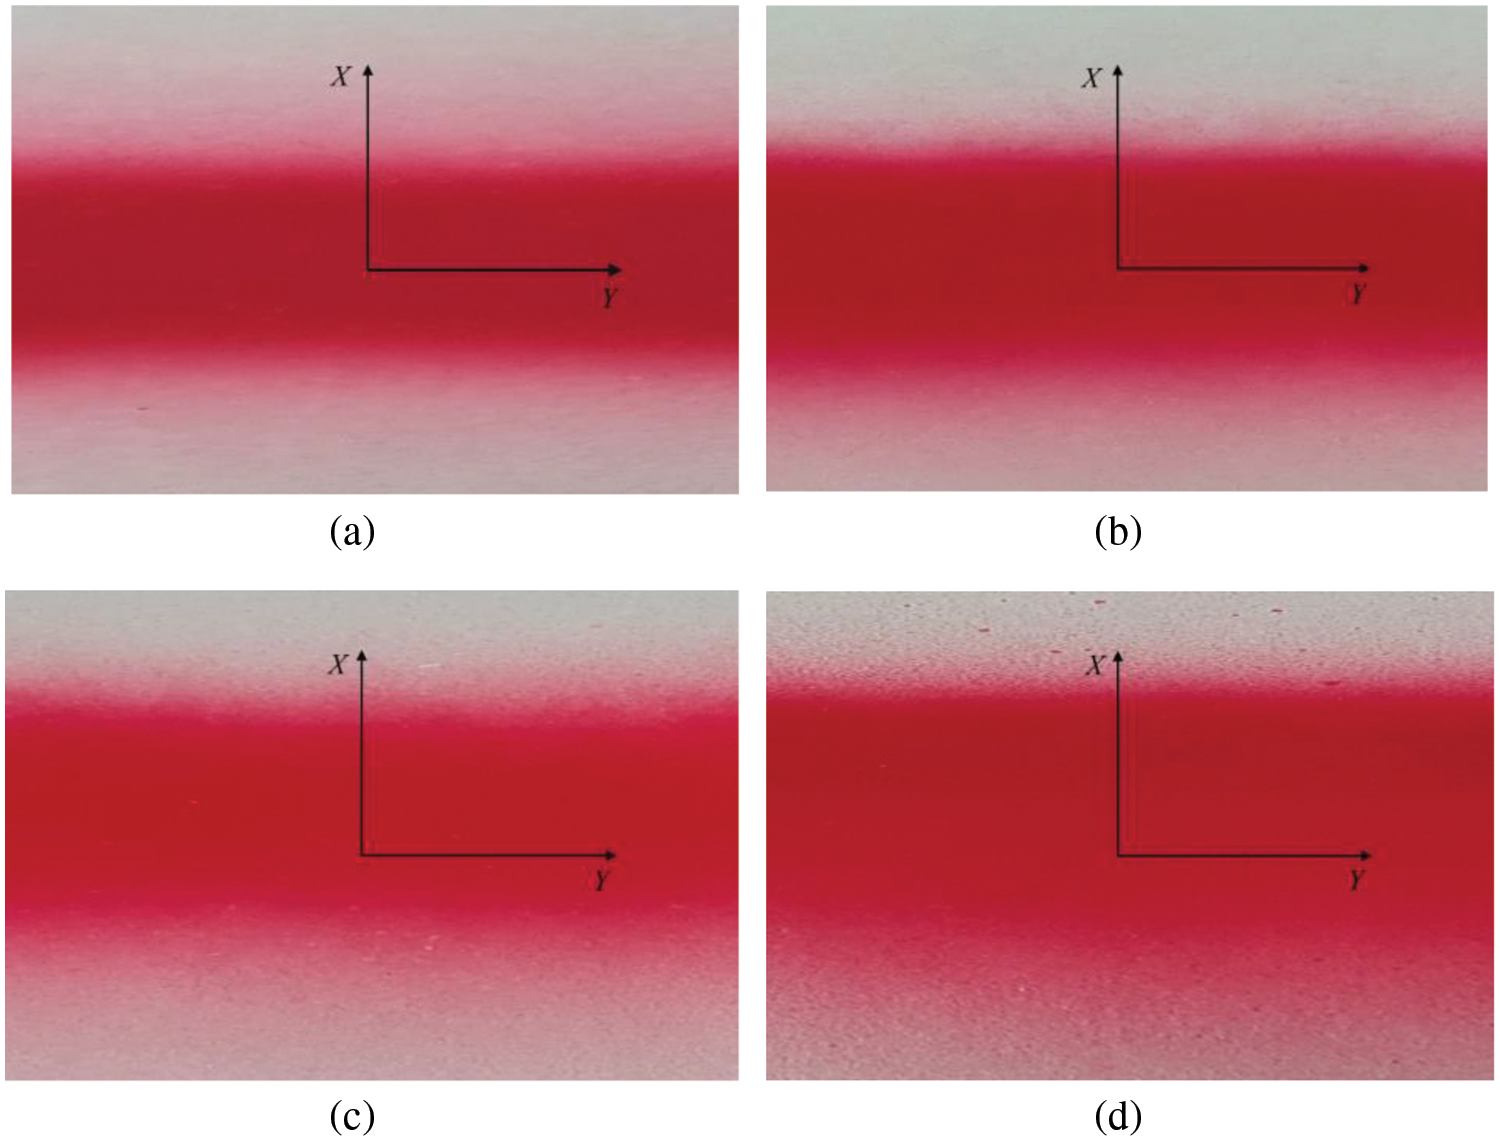
Figure 23: Physical spray experiment results. (a) α = 0°. (b) α = 10°. (c) α = 20°. (d) α = 30°
Given that the numerical simulation yielded wet film thicknesses, a conversion to dry film thickness was necessary for comparison with experimental outcomes, as shown in the following equation [25]:
Here, H2 represents the dry film thickness, H1 the simulated wet film thickness, and Vs the solid content of the paint.
Combining experimental data with numerical simulation data, a comparative graph of film thicknesses obtained from both methods was drawn, as shown in Fig. 24.
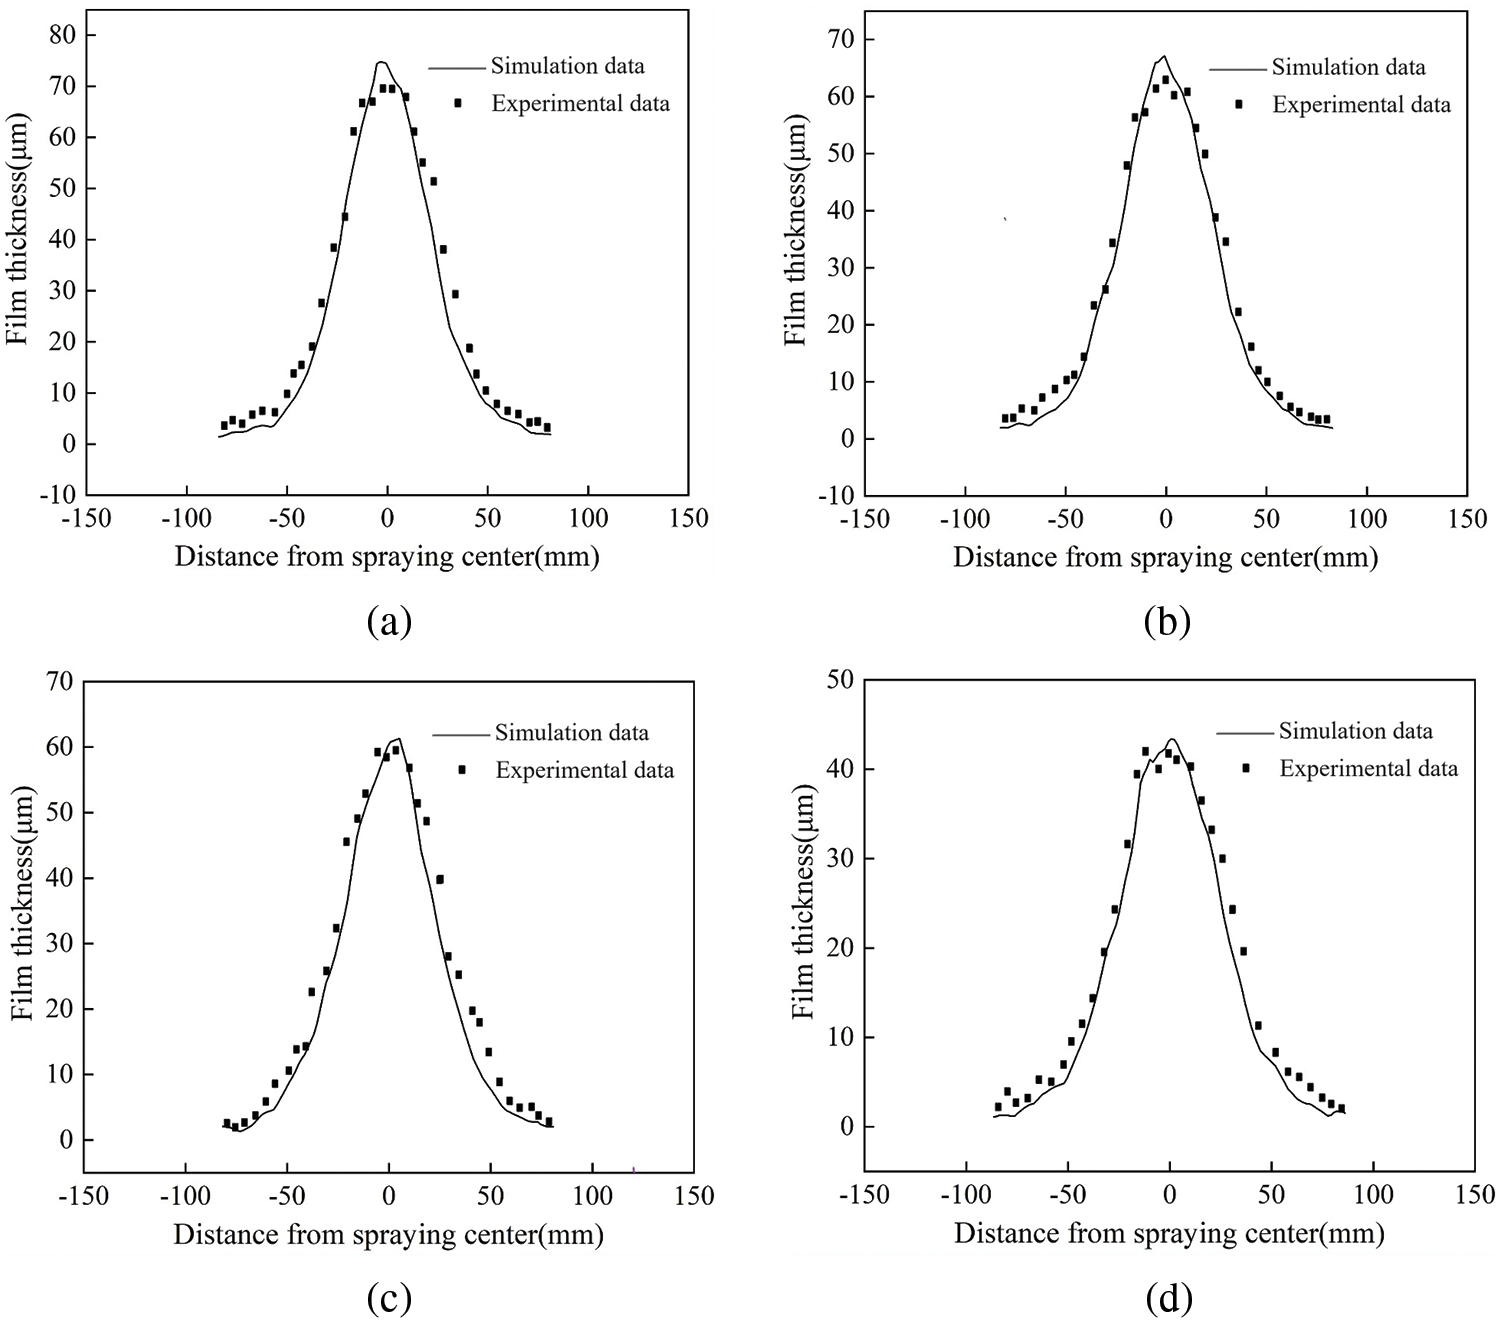
Figure 24: Comparison of numerical simulation results with experimental results. (a) α = 0°. (b) α = 10°. (c) α = 20°. (d) α = 30°
Fig. 24 indicates that the simulation results align well with the experimental outcomes. The maximum relative errors in film thickness between the four sets of experimental and numerical simulation results are 10.2%, 9.7%, 9.5%, and 10.6%, respectively. Overall, this indicates that the results obtained from numerical simulations and spray experiments are consistent in terms of the pattern of variation in coating thickness distribution.
Investigating the film formation patterns in dynamic variable spraying lays a foundational premise for the advancement of a predictive model concerning the distribution of film thickness in dynamic spray applications. The comparison between the simulated and actual spray experiment results demonstrates a favorable correlation. This validates the efficacy of the simulation model developed in this paper for delineating the distribution patterns of film thickness in dynamic variable spray processes.
The results from numerical simulations reveal that spray height, spray angle, and the speed of the spray gun’s movement significantly affect the dispersion of paint droplets during transport, which substantially influences the film thickness, the quality of the coating, and the shape of the coverage area. Therefore, it is crucial to keep these parameters within reasonable limits. Moreover, the curvature radius of the spray trajectory affects the symmetry of film thickness on either side of the spray center. Consequently, when it becomes necessary to use a smaller curvature radius for trajectory planning, angled spraying can be employed to counteract this phenomenon. An increase in air pressure expands the coating coverage area and continuously decreases the maximum film thickness. As the air pressure increases, the paint droplets become more finely atomized, leading to improved film uniformity within a certain range of air pressure. However, excessively high pressure can cause paint wastage and splattering, negatively affecting the quality of the film. Therefore, in actual spraying, the air pressure should be selected within an appropriate range.
Acknowledgement: I extend my deepest thanks to the instructors and my colleagues for their invaluable support.
Funding Statement: This work was supported in part by the National Natural Science Foundation of China (51405418); in part by the Jiangsu “Qing Lan Project” Talent Project (2021); Projects of Natural Science Research in Jiangsu Higher Education Institutions (Grant No. 22KJD460009).
Author Contributions: The authors confirm contribution to the paper as follows: study conception and design: Deqing Han, Yong Zeng; data collection: Deqing Han, Bin Yan; analysis and interpretation of results: Deqing Han, Jintong Gu; draft manuscript preparation: Deqing Han. All authors reviewed the results and approved the final version of the manuscript.
Availability of Data and Materials: The data and materials are available from the corresponding author on reasonable request.
Conflicts of Interest: The authors declare that they have no conflicts of interest to report regarding the present study.
References
1. Guan LW, Chen L. Trajectory planning method based on transitional segment optimization of spray painting robot on complex-free surface. Ind Robot. 2019;46(1):31–43. doi:10.1108/IR-02-2018-0033. [Google Scholar] [CrossRef]
2. Ning L, Wang GL. Research on automatic spraying process of aviation products. Aeronautic Manuf Technol. 2018;61(12):59–64 (In Chinese). [Google Scholar]
3. Zeng Y, Zhou H, Zhang CW, Ma RH, Zheng L. Spray technology planning of spray painting robot for complex free surface. Int J Robotics Autom. 2016;31(4):321–8. doi:10.2316/Journal.206.2016.4.206-4462. [Google Scholar] [CrossRef]
4. Zhang SZ, Mao W, Zhen JB, Li CL. Research progress of coating thickness distribution model by electrostatic spray. Surf Technol. 2019;48(1):291–7 (In Chinese). [Google Scholar]
5. Liu Y, Zeng Y, Zhao X, Liu J, Liu D. Analysis of film forming law and characteristics for an air static spray with a variable position of the plane. Coatings. 2021;11(10):1236. doi:10.3390/coatings11101236. [Google Scholar] [CrossRef]
6. Wang Y, Xie X, Lu X. Design of a double-nozzle air spray gun and numerical research in the interference spray flow field. Coatings. 2020;10(5):475. doi:10.3390/coatings10050475. [Google Scholar] [CrossRef]
7. Ye Q, Pulli K. Numerical and experimental investigation on the spray coating process using a pneumatic atomizer: influences of operating conditions and target geometries. Coatings. 2017;7(1):13. [Google Scholar]
8. Conner DC, Greenfield A, Atkar PN, Rizzi AA, Choset H. Paint deposition modeling for trajectory planning on automotive surfaces. IEEE Trans Autom Sci Eng. 2005;2(4):381–92. [Google Scholar]
9. Zhang SZ, Zhao P, Li ZY. Numerical simulation and experimental study of spray model of electrostatic spray gun. Mach Building Autom. 2018;47(3):140–4 (In Chinese). [Google Scholar]
10. Garbero M, Vanni M, Baldi G. CFD modelling of a spray deposition process of paint. Macromol Symp. 2002;187(1):719–30. [Google Scholar]
11. Fogliati M, Fontana D, Garbero M, Vanni M, Baldi R. CFD simulation of paint deposition in an air spray process. J Coat Technol Res. 2006;3(2):117–25. [Google Scholar]
12. Moore B, Nabhani F, Askari V. Sensitivity analysis of spray painting process to input parameters: validation of CFD jet impingement model against an experimental dataset. Robot Comput Integr Manuf. 2017;47:111–6. [Google Scholar]
13. Chen Y, Chen S, Chen W. An atomization model of air spraying using the volume-of-fluid method and large eddy simulation. Coatings. 2021;11(11):1400. [Google Scholar]
14. Kaltenbach C, Laurien E. CFD simulation of spray cooling in the model containment THAI. Nucl Eng Des. 2018;328:359–71. [Google Scholar]
15. Sanjose M, Senoner JM, Jaegle F. Fuel injection model for Euler-Euler and Euler-Lagrange large-eddy simulations of an evaporating spray inside an aeronautical combustor. Int J Multiphase Flow. 2011;37(5):514–29. [Google Scholar]
16. Chen W, Chen Y, Zhang W. Paint thickness simulation for robotic painting of curved surfaces based on Euler-Euler approach. J Braz Soc Mech Sci Eng. 2019;41(4):199. [Google Scholar]
17. Chen Y, Chen WZ, He SW. Spray flow characteristics of painting cylindrical surface with a pneumatic atomizer. China Surf Eng. 2017;30(6):122–31 (In Chinese). [Google Scholar]
18. Chen Y, Hu J, Zhang G, Chen WZ, Pan HW, Lou BW. Research on characteristics of paint deposition on spherical surface. J Hunan Univ (Natural Sciences). 2019;46(6):37–46 (In Chinese). [Google Scholar]
19. Zhang YK, Zeng Y, Zhang CW. Research on spray path planning of free curve boundary. Mach Tool Hydraul. 2019;47(16):139–43 (In Chinese). [Google Scholar]
20. Zeng Y, Yu YQ, Liu Y, Liu DZ. Parameter optimization of boundary-constrained spray trajectory for irregular plane. Mech Sci Technol Aerospace Eng. 2020;39(6):904–9 (In Chinese). [Google Scholar]
21. Khaghani A, Cheng K. CFD-based design and analysis of air-bearing-supported paint spray spindle. Nanotechnol Precision Eng. 2018;1(4):226–35. doi:10.1016/j.npe.2018.12.004. [Google Scholar] [CrossRef]
22. Li WT, Qian LJ, Song SB. Numerical study on the influence of shaping air holes on atomization performance in pneumatic atomizers. Coatings. 2019;9(7):410. doi:10.3390/coatings9070410. [Google Scholar] [CrossRef]
23. Xie XP, Wang YN. Research on distribution properties of coating film thickness from air spraying gun-based on numerical simulation. Coatings. 2019;9(11):721. doi:10.3390/coatings9110721. [Google Scholar] [CrossRef]
24. Yang GC, Chen Y, Chen SM, Jiang JZ. Modeling of airless spray coating film formation. Mach Design Manuf. 2024;10(5):219–22 (In Chinese). [Google Scholar]
25. Langer-Moller A, Lowe J, Kessler R. Investigation of the NREL phase VI experiment with the incompressible CFD solver THETA. Wind Energy. 2017;20(9):1529–49. doi:10.1002/we.2107. [Google Scholar] [CrossRef]
26. Chen SM, Chen Y, Chen WZ, Jiang JZ, Zhou S. Numerical simulation of film formation on v-shaped surface by spraying. Surf Technol. 2023;52(6):285–95 (In Chinese). [Google Scholar]
Cite This Article
 Copyright © 2024 The Author(s). Published by Tech Science Press.
This work is licensed under a Creative Commons Attribution 4.0 International License , which permits unrestricted use, distribution, and reproduction in any medium, provided the original work is properly cited.
 Downloads
 Citation Tools