
 Submit a Paper
 Propose a Special lssue
 Open Access
ARTICLE

Effect of Sweptback Angle of a Delta Wing on Surface Pressure Distribution at Supersonic Mach Numbers
1 Mathematics Department, Mangalore Institute of Technology and Engineering, Visvesvaraya Technological University, Near Moodabidre, Mangaluru, Karnataka, 574225, India
2 Nitte Meenakshi Institute of Technology, Visvesvaraya Technological University, Bangalore, 560064, India
3 Department of Mechanical and Aerospace Engineering, Faculty of Engineering, International Islamic University Malaysia, Kuala Lumpur, 53100, Malaysia
4 Department of Engineering Management, College of Engineering Prince Sultan University, P.O. Box 66833, Riyadh, 11586, Saudi Arabia
* Corresponding Author: Sher Afghan Khan. Email:
(This article belongs to the Special Issue: Computational Fluid Dynamics: Two- and Three-dimensional fluid flow analysis over a body using commercial software)
Fluid Dynamics & Materials Processing 2024, 20(10), 2353-2376. https://doi.org/10.32604/fdmp.2024.051059
Received 26 February 2024; Accepted 25 June 2024; Issue published 23 September 2024
 View Full Text
 Download PDF
Abstract
The purpose of this work is to shed light on the effect of the pivot position on the surface pressure distribution over a 3D wing in different flight conditions. The study is intended to support the design and development of aerospace vehicles where stability analysis, performance optimization, and aircraft design are of primary importance. The following parameters are considered: Mach numbers (M) of 1.3, 1.8, 2.3, 2.8, 3.3, and 3.8, angle of incidence (θ) in the range from 5° to 25°, pivot position from h = 0.2 to 1. The results of the CFD numerical simulations match available analytical data, thereby providing evidence for the reliability of the used approach. The findings provide valuable insights into the relationship between the surface pressure distribution, the Mach number and the angle of incidence.Keywords
Nomenclature
| P2 | Pressure on the compression side |
| P1 | Atmospheric pressure |
| Θ | Angle of incidence |
| | Shock angle |
Design expertise for delta wing configurations is increasingly in demand as high-performance military aircraft like the space shuttle are introduced. For aeronautical vehicles, aerodynamic load and dynamic stability forecasts are needed. Multiple researchers have highlighted the importance of predicting performance at a high angle of attack during re-entry. Aerospace vehicles experience shock waves during their descent at supersonic or hypersonic speeds. These waves can be severe and separate or adhere to the leading edges of the wings. The shock attachment case is frequently preferred to improve the lift/drag ratio. In this instance, the lee and windward surfaces are not in communication. Hence, the issues related to aerodynamics can be resolved separately. Therefore, the bottom surface’s flow field—whether steady or not—can be looked at first. Vortex-sheet roll-up is another factor to consider in this regard. One can ignore different scales of flow separation brought on by the high incidence.
The four parameters determining the shock attachment criterion are the gas’s specific heat ratio, the freestream Mach number M, the sweepback angle, and the flow incidence. The compression zone contained by the enclosed shock waves and the bottom portion of the wing surface is the flow field of interest. Such persistent difficulties have, in the past, caught the interest of numerous researchers. First, efforts were made to find numerical answers. Researchers employed a unified supersonic/hypersonic technique to provide closed-form analytical solutions. Previous approaches, based on the framework of the hypersonic small disturbance theory, were limited to the constrained case where the outboard region must be larger than the center region circumscribed by the Mach cone. Later, Hui expanded on this idea to create a unified supersonic/hypersonic theory that does away with the previous limitations. Hui’s solution in the central region, also found via the perturbation approach, explains the minor deviation from the reference wedge flow. It is interesting to note that answers from characteristic theory nearly match those obtained by numerical calculations.
It should be noted that even though a lesser incidence angle is expected, trim situations are not necessary to limit this assumption. In steady states, all occurrences provide acceptable outcomes, stipulating that the shock attachment to the (LE) (i.e., leading edges) is ensured. It is expected that this also holds in unstable situations. On the other hand, not much is known about the erratic nature of this kind of issue. Hui’s exact theory predicts zones of dynamic instability for flat plates and wedges in a specific Mach number range at high enough incidences in the two-dimensional case. Based on the hypersonic thin shock layer technique, Hui et al. [1] investigated the unstable delta wing problem for the shock detachment situation. Otherwise, previous approaches to analyzing unstable three-dimensional flow issues were limited to the unsteady Newtonian theory or relied on the supersonic potential flow assumption of the piston analogy. There is now no workable approach in the intermediate Mach number range. Thus, this study aims to create an analytical method that unifies the Mach number range and the impacts of unstable shock waves. As a result, the rotationality is adequately explained. Hui [2] extended steady theory for pitch-varying oscillating delta wings. The stability derivatives are calculated by first analyzing the unsteady flow disturbances over the compression zone. In response to the need for a comprehensive understanding of surface pressure distributions on delta wings, we have expanded our literature review to include pivotal wind tunnel experiments focusing on slender and non-slender delta wings across subsonic and transonic flow regimes. This integration includes studies such as those conducted by Mohamed et al. [3], which provide valuable insights into the aerodynamic performance and flow separation characteristics under varying angles of attack and flow conditions. By referencing these empirical investigations, we validate and contextualize our computational findings, ensuring that our simulations reflect real-world aerodynamics accurately. These references not only bolster the scientific rigor of our study but also bridge the gap between theoretical predictions and experimental validations, offering a holistic view that enhances the relevance and applicability of our research in practical aerospace vehicle design and optimization.
Pike presented theories on stable delta wings at high-speed flow, provided the shock waves are attached [4], which Hui [2] and other scholars studied later. Transporter Carrier’s research [5] may be relevant to oscillating wedge for 2-D flow solutions. Their study showed how a wedge-shaped object behaves when it oscillates or moves in a fluid flow, commonly called an “oscillating wedge.” Hui [6] gave precise solutions for 2-D flow, and Hui [7] gave solutions for an oscillating flat plate. Hui [7] also calculated the pressure for a flat delta wing’s compression side. Orlik-Ruckemann’s research [8] emphasized how important dynamic stability is at large incidence angles, particularly while re-entering or maneuvering. Dynamic stability is crucial in aerodynamics to ensure that an aircraft or spacecraft can maintain control and stability throughout various flying conditions, including high angles of attack or incidence. Liu et al. [9] expanded Hui’s theory [7] to include delta wings under pitching motion and having attached shock waves. Light Hill [10] created a theoretical framework called “Piston Theory.” A new parameter, δ, was added by Light Hill to the theory.
This value most likely measures the most significant gradient angle of the Mach wave. Shock waves play a critical function when analyzing the aerodynamic characteristics of airfoils and other aerodynamic surfaces in high-speed flows. The introduction of δ was aimed at quantifying and characterizing the extent to which the Mach waves are affected or influenced by the motion of the oscillating airfoil. It may have implications for understanding such airfoils’ dynamic behavior and performance at high Mach numbers. Light Hill’s work and the development of the “Piston Theory” with the parameter δ are valuable contributions to the field of aerodynamics. It is assumed that M ∞ δ ≤ 1. Light Hill [10] referred to a 2-D unstable situation as a “Piston Analogy.” After drawing a parallel between it and the gas velocity in a tube when a piston is in motion. A high frequency has emerged, according to Ghosh [11]. 2-D hypersonic similitude and piston theory likely involve applying these theoretical concepts to the specific scenario of 2-D hypersonic flows. Light Hills [10] and Miles [12] are included. As was previously mentioned, oscillating airfoils and other moving surfaces in high-speed flows can be analyzed, and their behavior can be predicted using the theoretical framework of piston theory in aerodynamics.
Using this idea, Ghosh et al. [13] analyzed and forecast the behavior of hypersonic flows. To determine relationships, they might utilize Φ and its square (Φ2). The only other limitation is that M2, behind the shock, is greater or equal to 2.5. Ghosh determined two similarity parameters and a similitude for wings at a considerable inclination angle [14].
Crasta et al. expanded the Ghosh simulation beyond planar and non-planar wedges to include hypersonic and supersonic flows [15]. Crasta et al. evaluated stability parameters for wings whose edges are straight. The aerodynamic forces and moments acting on an aircraft and the curved leading edges for supersonic flows are described by the variables known as stability derivatives [16] and [17].
The study by Jadhav et al. [18] explored the comparative efficacy of linear regression and regression trees, assessing their applicability in varied contexts. Logistic regression and tree algorithms are examined for their effectiveness in classifying categorical outcomes [19], highlighting the comparative strengths of each methodology. Usman et al. [20] delved into the integration of machine learning with CFD, discussing new advancements and potential applications, as presented at the Swedish Artificial Intelligence Society Workshop. Meng et al. [21] investigated double-cone missiles’ drag reduction and thermal protection through spike and multi-jet configurations, offering significant insights into missile design. Kanaani et al. [22] focused on predicting gas coming into hydrocarbon reservoirs using tNavigator, providing innovative approaches to improve extraction efficiency. Mahfouz et al. [23] analyzed the response of the IEA Wind 15 MW floating wind turbines to wind and second-order waves, assessing their stability and efficiency. Nazer et al. [24] studied a photovoltaic passive heat storage system incorporating microencapsulated paraffin wax for thermoelectric generation, highlighting the performance enhancements. Subbulakshmi et al. [25] provided an integrated review of experimental and numerical methods for the dynamic analysis of floating offshore wind turbines, discussing recent advances and methodological improvements. Faraggiana et al. [26] reviewed numerical modeling and optimization of floating support structures for offshore wind turbines, summarizing current findings and suggesting areas for further research. Xu et al. [27] explored high-fidelity computational fluid dynamics for floating offshore wind turbines, detailing the advantages and challenges of these advanced simulation techniques. Mirzaei et al. [28] present a CFD simulation alongside experimental validation of multiphase flow in industrial cyclone preheaters, showcasing the applicability of these models in optimizing industrial processes. Finally, Cato et al. [29] compared different data-assimilation approaches to augment RANS turbulence models, providing insights into their relative performances and potential improvements in fluid dynamics simulations.
Therefore, this study effectively integrates extensive theoretical concepts and empirical data to address the dynamic complexities of delta wing configurations at varying Mach numbers and angles of incidence. By focusing on the pivot effect of position on surface pressure distribution over a 3D wing, our findings enhance the understanding of shock wave behavior and aerodynamic stability under diverse flight conditions. The comprehensive examination of delta wings, from slender to non-slender designs across different flow regimes, has allowed us to derive crucial stability derivatives and validate the computational models through critical comparisons with wind tunnel experiments and previously established theories. This research not only substantiates the reliability of the CFD simulations, which align well with analytical expectations, but also contributes significantly to aerospace vehicle design and performance optimization. By meticulously delineating the influence of pivot position adjustments, this work offers new perspectives and optimization strategies for improving high-speed aircraft’s design and operational efficacy, further bridging the gap between theoretical predictions and practical applications in modern aerospace engineering.
The authors used ANSYS workbench to calculate the surface pressure distribution for a delta wing. CFD simulation through the ANSYS software was used for the pressure [30–33] and heat transfer analysis [34]. The pivot point, or position (h), is 0.1 to 1 for the delta wings along its length. The incidence angles range from 5° to 25°, and the Mach numbers used in the simulation are 1.3, 1.8, 2.3, 2.8, 3.3, and 3.8. Fig. 1 shows the wing’s geometry.
Figure 1: Wing geometry
Here, considering a delta wing whose edge is straight, the x-axis equation:
The leading-edge equation is given by:
Consequently, the Ghosh piston theory is utilized rather than the shock piston theory created by Light Hill and Miles. Eq. (3) gives the formula for the pressure distribution. The surface pressure P directly influences the Mach number at the piston Mp on the wing strip.
P2 is the pressure of the compression side, and P1 is the pressure of the atmosphere.
Strips do not depend on each other. In the present case, “Mp” and flow incidence can be significantly substantial. Currently known as Eq. (4), it also explains supersonic flow using the piston theory covered in Eq. (3).
where
Using CFD analysis, different flow parameters are applied to the wing to numerically simulate the surface pressure for the wings’ non-dimensional parameter (h). The numerical solution results were used to calculate wing surface pressure Mach Numbers of 1.3, 1.8, 2.3, 2.8, 3.3, and 3.8. The angle of attack (θ) ranged from 5° to 25°, and the location (h) was between 0.0 and 1.0 along the delta wing’s length.
In this study, the numerical simulations were performed using ANSYS Fluent. The simulations solve the governing equations for mass, momentum, and energy conservation. The balance equations are given by:
Mass Conservation Equation (Continuity Equation):
where ρ is the fluid density, u is the velocity vector, and t is time.
Momentum Conservation Equation:
where p is the pressure, τ is the viscous stress tensor, and f represents body forces. The body force approximated is considered zero in horizontal conditions, where gravitational forces do not significantly influence the horizontal components of motion.
Energy Conservation Equation:
E is the total energy, k is the thermal conductivity, T is the temperature, and Φ represents viscous dissipation. Viscous dissipation becomes crucial in high-speed flows where shock waves and boundary layers are presented. This term is essential in energy equations to model heat generated by viscous friction, which affects temperature and, consequently, pressure distributions. In supersonic flow, especially near and within shock waves, viscous dissipation can significantly heat the air.
The simulations employed the Pressure-Implicit with Splitting of Operators (PISO) algorithm for pressure-velocity coupling, which is known for its robustness in handling transient flows. The spatial discretization used the second-order upwind scheme to ensure high accuracy and stability. This choice was guided by the need to accurately capture sharp gradients and discontinuities prevalent in high-speed aerodynamic flows.
A second-order implicit scheme was utilized for temporal discretization, balancing accuracy and computational efficiency well. The time step size was selected based on the Courant-Friedrichs-Lewy (CFL) condition to ensure numerical stability and convergence. Typically, a CFL number of less than one was maintained throughout the simulations.
The meshing and modeling for the CFD analysis were finished using the ANSYS Fluent workstation. ANSYS Fluent was used concurrently for the analysis and post-processing. Numerical results obtained with structured mesh are exact and accurate [32]. The semi-angles of incidence in the present investigation were 5°, 10°, 15°, 20°, and 25°. The range of Mach numbers was 1.8, 2.3, 2.8, 3.3, and 3.8. Every component of weak solutions is included in the CFD study when the shock wave is attached.
The ANSYS design Modeller can be used to model any axisymmetric geometry at any angle of incidence. Fig. 2 demonstrates the wing geometry and enclosure. The angles of attack of 5, 10, 15, 20, and 25 degrees are all considered by each geometry. A 3D geometry perspective of a wing with a 5° angle of incidence is depicted in Fig. 2a,b.
Figure 2: Wing with an angle of attack of 5° and the bottom view (a) top view and (b) side view
Due to its suitability for complex aerodynamic analyses, we employed a structured mesh for the CFD simulations of the delta wing at supersonic speeds. It helps determine the optimal mesh size that produces reliable results at an acceptable computing cost. A grid test was carried out for a Mach at 3.8 and a wing angle of 15° using mesh sizes of 10 to 400 mm. The details about the elements and nodes are presented in Table 1. The mesh was created using ANSYS meshing, which provides robust control over the distribution and refinement of elements. Initially, a coarse mesh was created to evaluate the overall flow features and computational stability. Subsequently, we refined the mesh iteratively at critical regions, such as the leading edges and shock boundaries, where high gradients in flow variables are expected. The final mesh configuration consisted of approximately 4 million tetrahedral elements. Special attention was given to maintaining a high aspect ratio near the wing surface to accurately capture boundary layer effects while avoiding excessive element skewness to ensure numerical stability. To verify that the CFD results are sovereign of the mesh size, a series of grid independence tests were prepared for three different mesh densities: coarse, medium, and fine, with the number of elements increasing from 2 million in the coarse grid to 6 million in the fine grid. To ensure comprehensive coverage, the surface pressure distribution was analyzed for each grid configuration at multiple locations along the wing, not just at the nose.
Following the guidelines outlined by Roache [35] and Hefny et al. [36], we implemented the Grid Convergence Index (GCI) to assess the mesh unconventionality of our results quantitatively. The GCI provides a quantity of the numerical erroneousness associated with spatial discretization and is calculated based on the following formula (Eq. (5)):
where
Using this methodology, we evaluated the GCI for surface pressure measurements at various points along the delta wing. The results showed a GCI of less than 1% for the pressure distributions, confirming that our mesh was sufficiently refined for the simulations presented. The use of GCI in our study strengthens the reliability of our computational model by quantitatively verifying that our results are minimally affected by mesh resolution. The enhanced grid analysis demonstrates our commitment to rigorous scientific methods and contributes meaningful insights into the complex fluid dynamics encountered by delta wings in high-speed flight regimes.
Fig. 3 displays the outcomes of the grid check. For additional CFD studies, this mesh size is the ideal choice. The 50 mm mesh size was chosen because it compromises the precision and processing expense required for accurate and productive simulations. According to the data, a mesh element size of 50 mm produces reliable results; therefore, future CFD research should consider that size.
Figure 3: Grid autonomy check
Fig. 4a displays a 3D meshed model with an enclosure, and Fig. 4b exhibits a stretched view of the wing’s geometry.
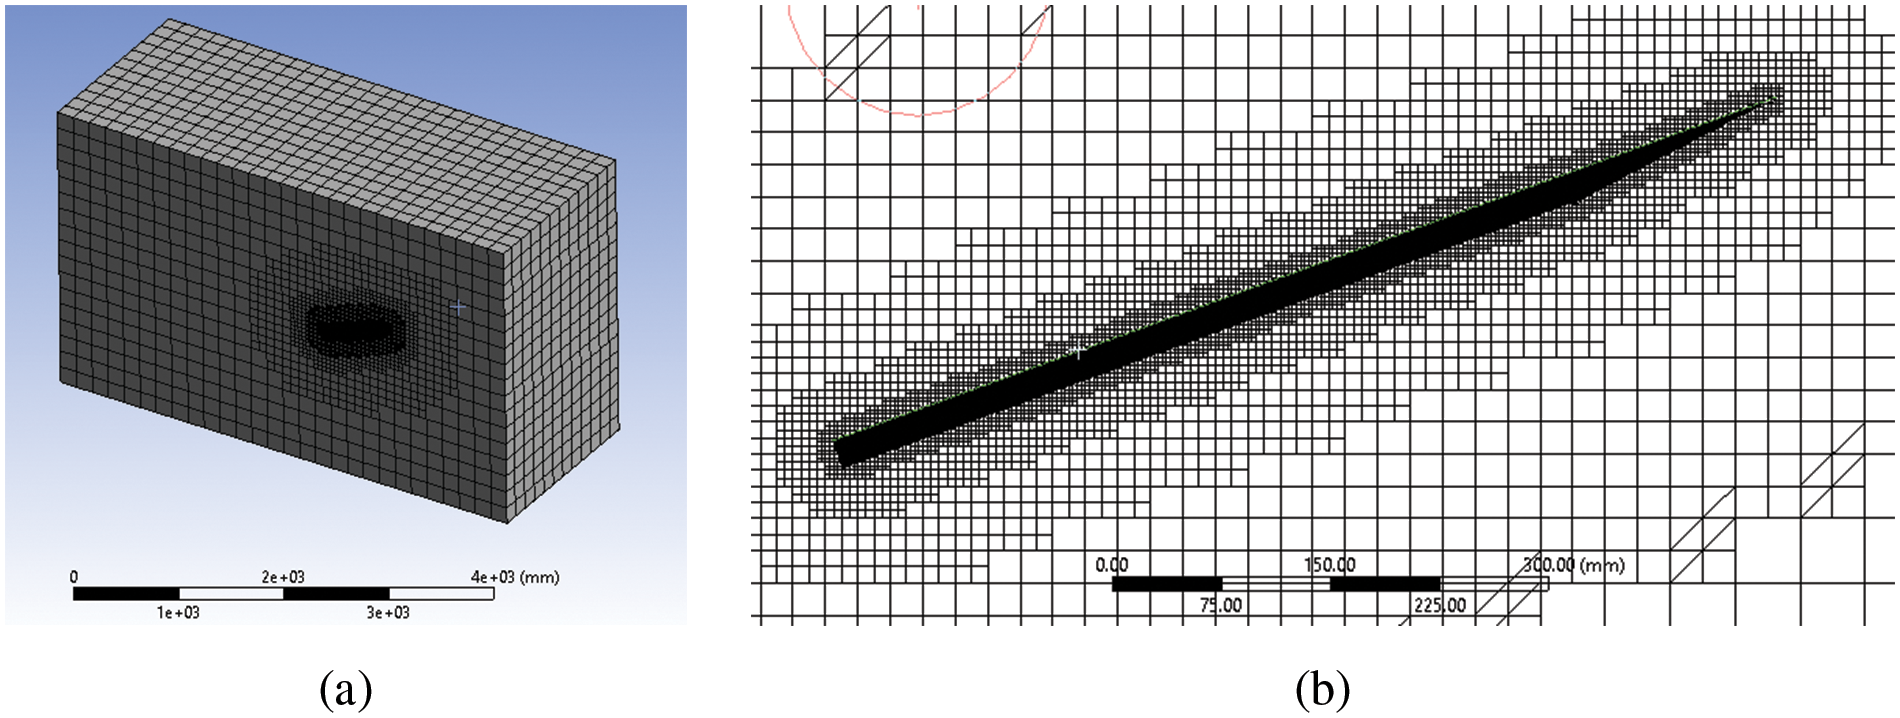
Figure 4: (a) Total geometry (b) Meshed arrangement
Every possible combination of parameters is established for the duration of the CFD analysis. After determining the boundary conditions, the solution is initiated and runs through at least 10,000 iterations. In some cases, a thousand iterations are needed to solve the problem. The analysis employs the widely recognized k-epsilon turbulent model. Two added transport equations show how turbulent the flow is. The constraints defining the flow at the inlet and exit and outflow limits are the flow speed and pressure at the outlet. One can compute the velocity using the Mach (M) to determine the inlet velocity. The EASY approach methodology is used to conduct the analysis. Since the flow is compressible and supersonic, the solution for the investigation is density-based.
3.3 Supporting Current Work Using Scholarly Sources
The validation process is crucial to CFD analysis since it establishes the validity and dependability of your simulation results. When your CFD results agree with the data from the literature, you can feel more confident that the simulations are accurate and appropriate for the real-world circumstances depicted in Fig. 5. The pressure of a wavering wing with a Mach number of 2.3 at the piston has been examined and calculated by Crasta et al. [16]. Fig. 5 illustrates how the findings of the ongoing research study and the pressure variation analytical analysis agree.
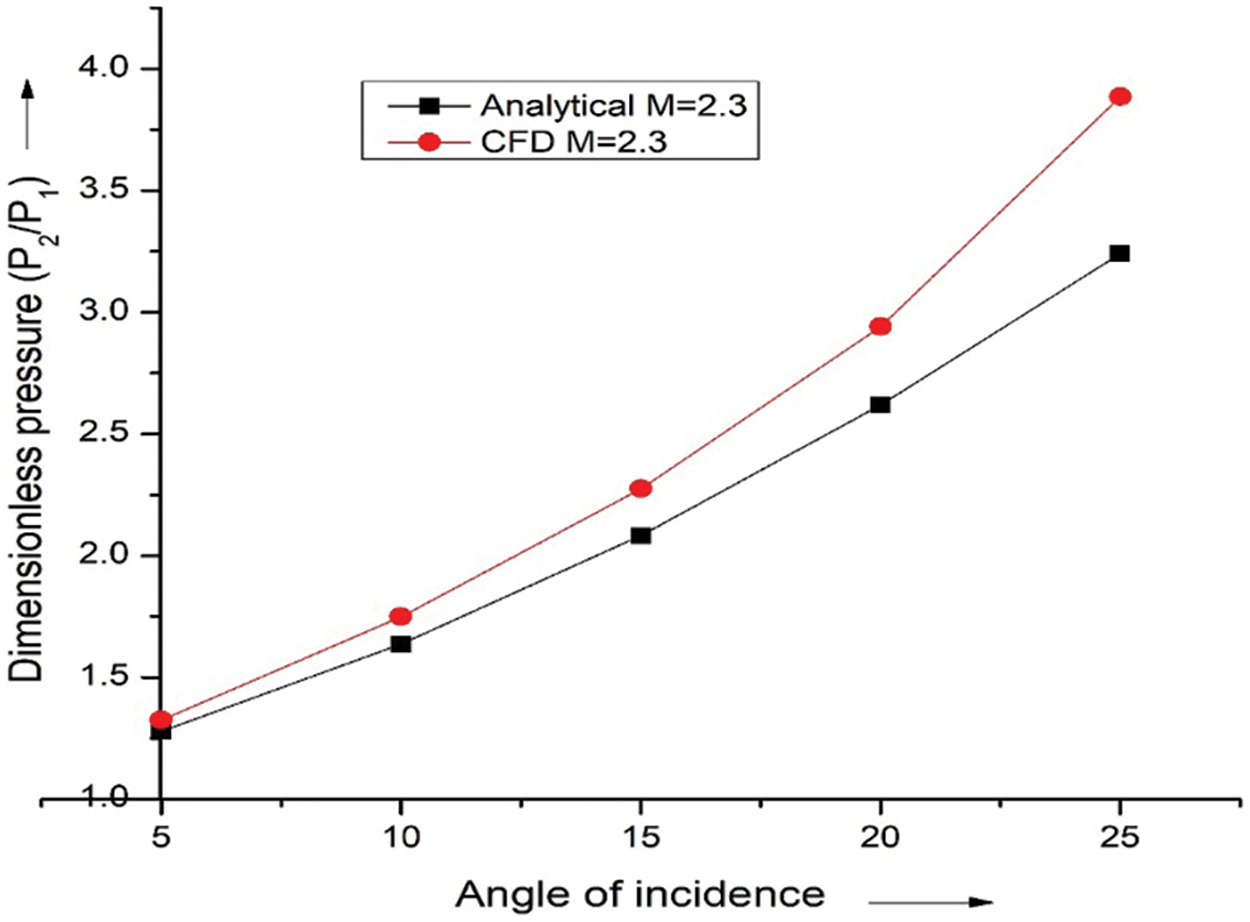
Figure 5: Pressure ratio vs. angle of attack at M = 2.3
The pressure contours illustrate the relationship between Mach number, angle of attack, and the resulting aerodynamic behavior of a wing (Fig. 6). As the Mach number increases, the Mach cone angle decreases, evident in the pressure contours provided. This relationship indicates that the shock waves’ strength on the windward surface of the wing grows with the wing angle. Specifically, the pressure contours for different Mach numbers (ranging from 1.3 to 3.8) and angles of attack (5° to 25°) show a clear trend: at higher Mach numbers, the shock waves become more pronounced, and the pressure distribution changes significantly, highlighting the increased aerodynamic load on the wing.
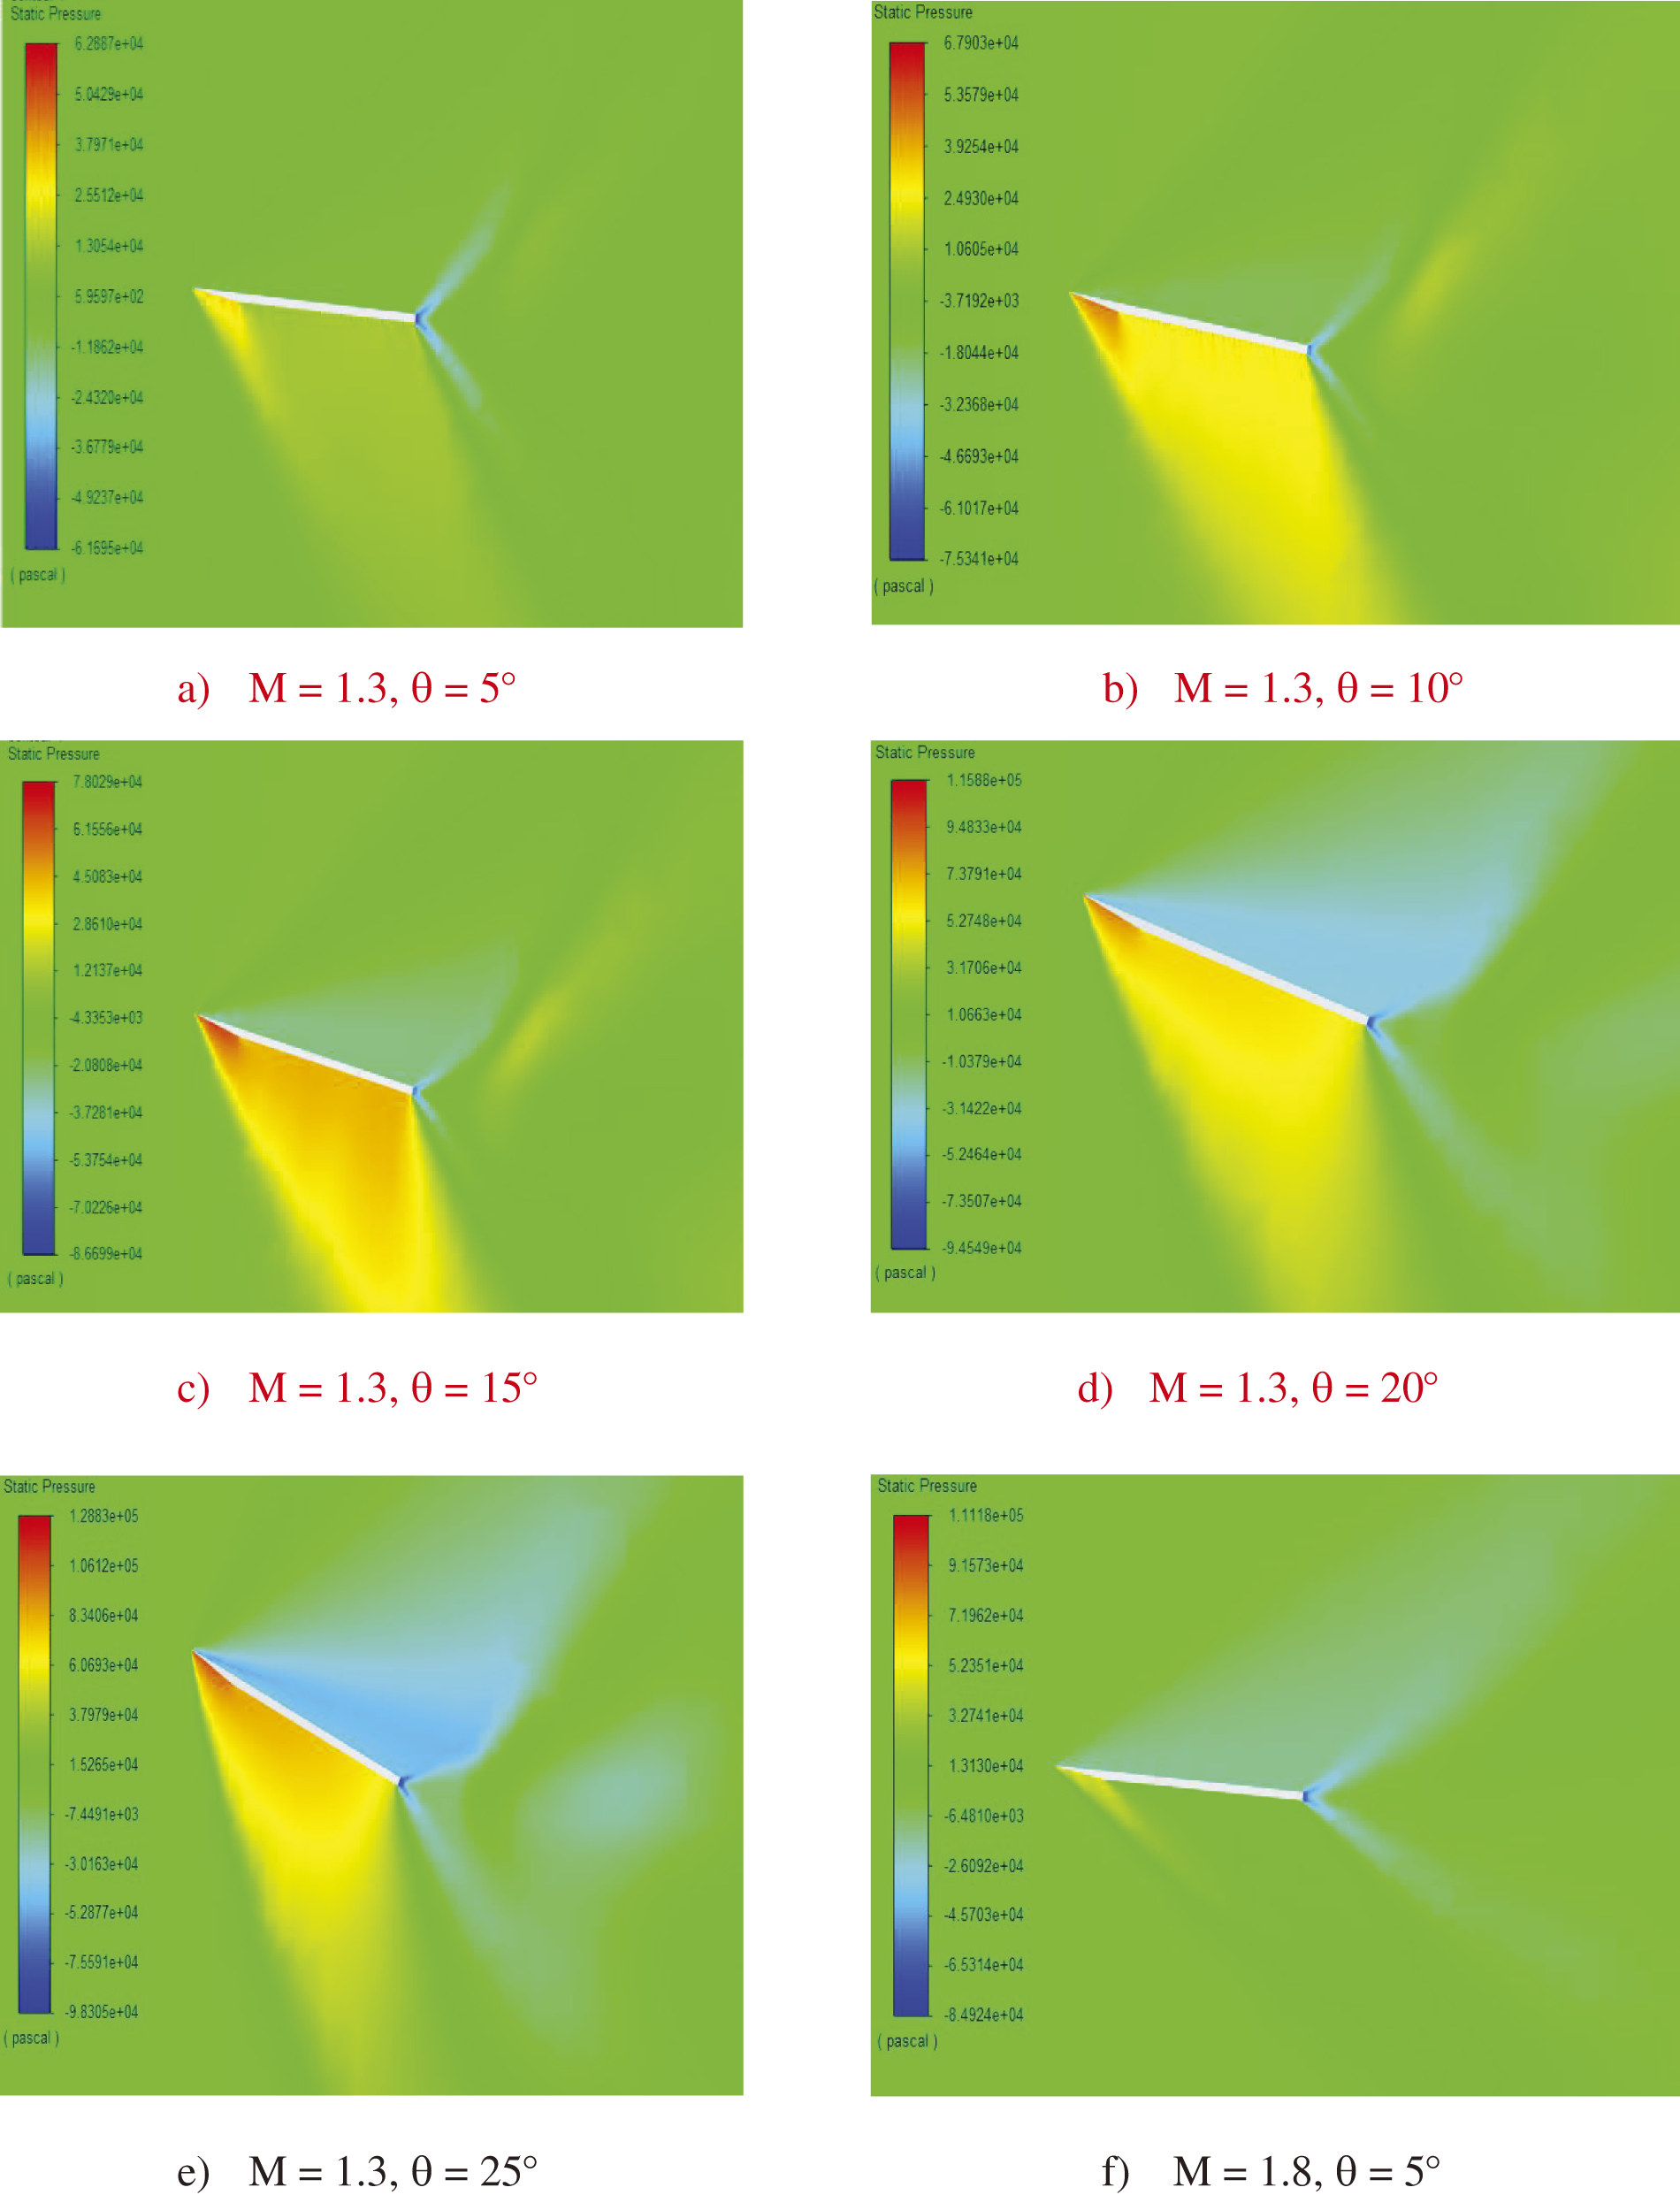
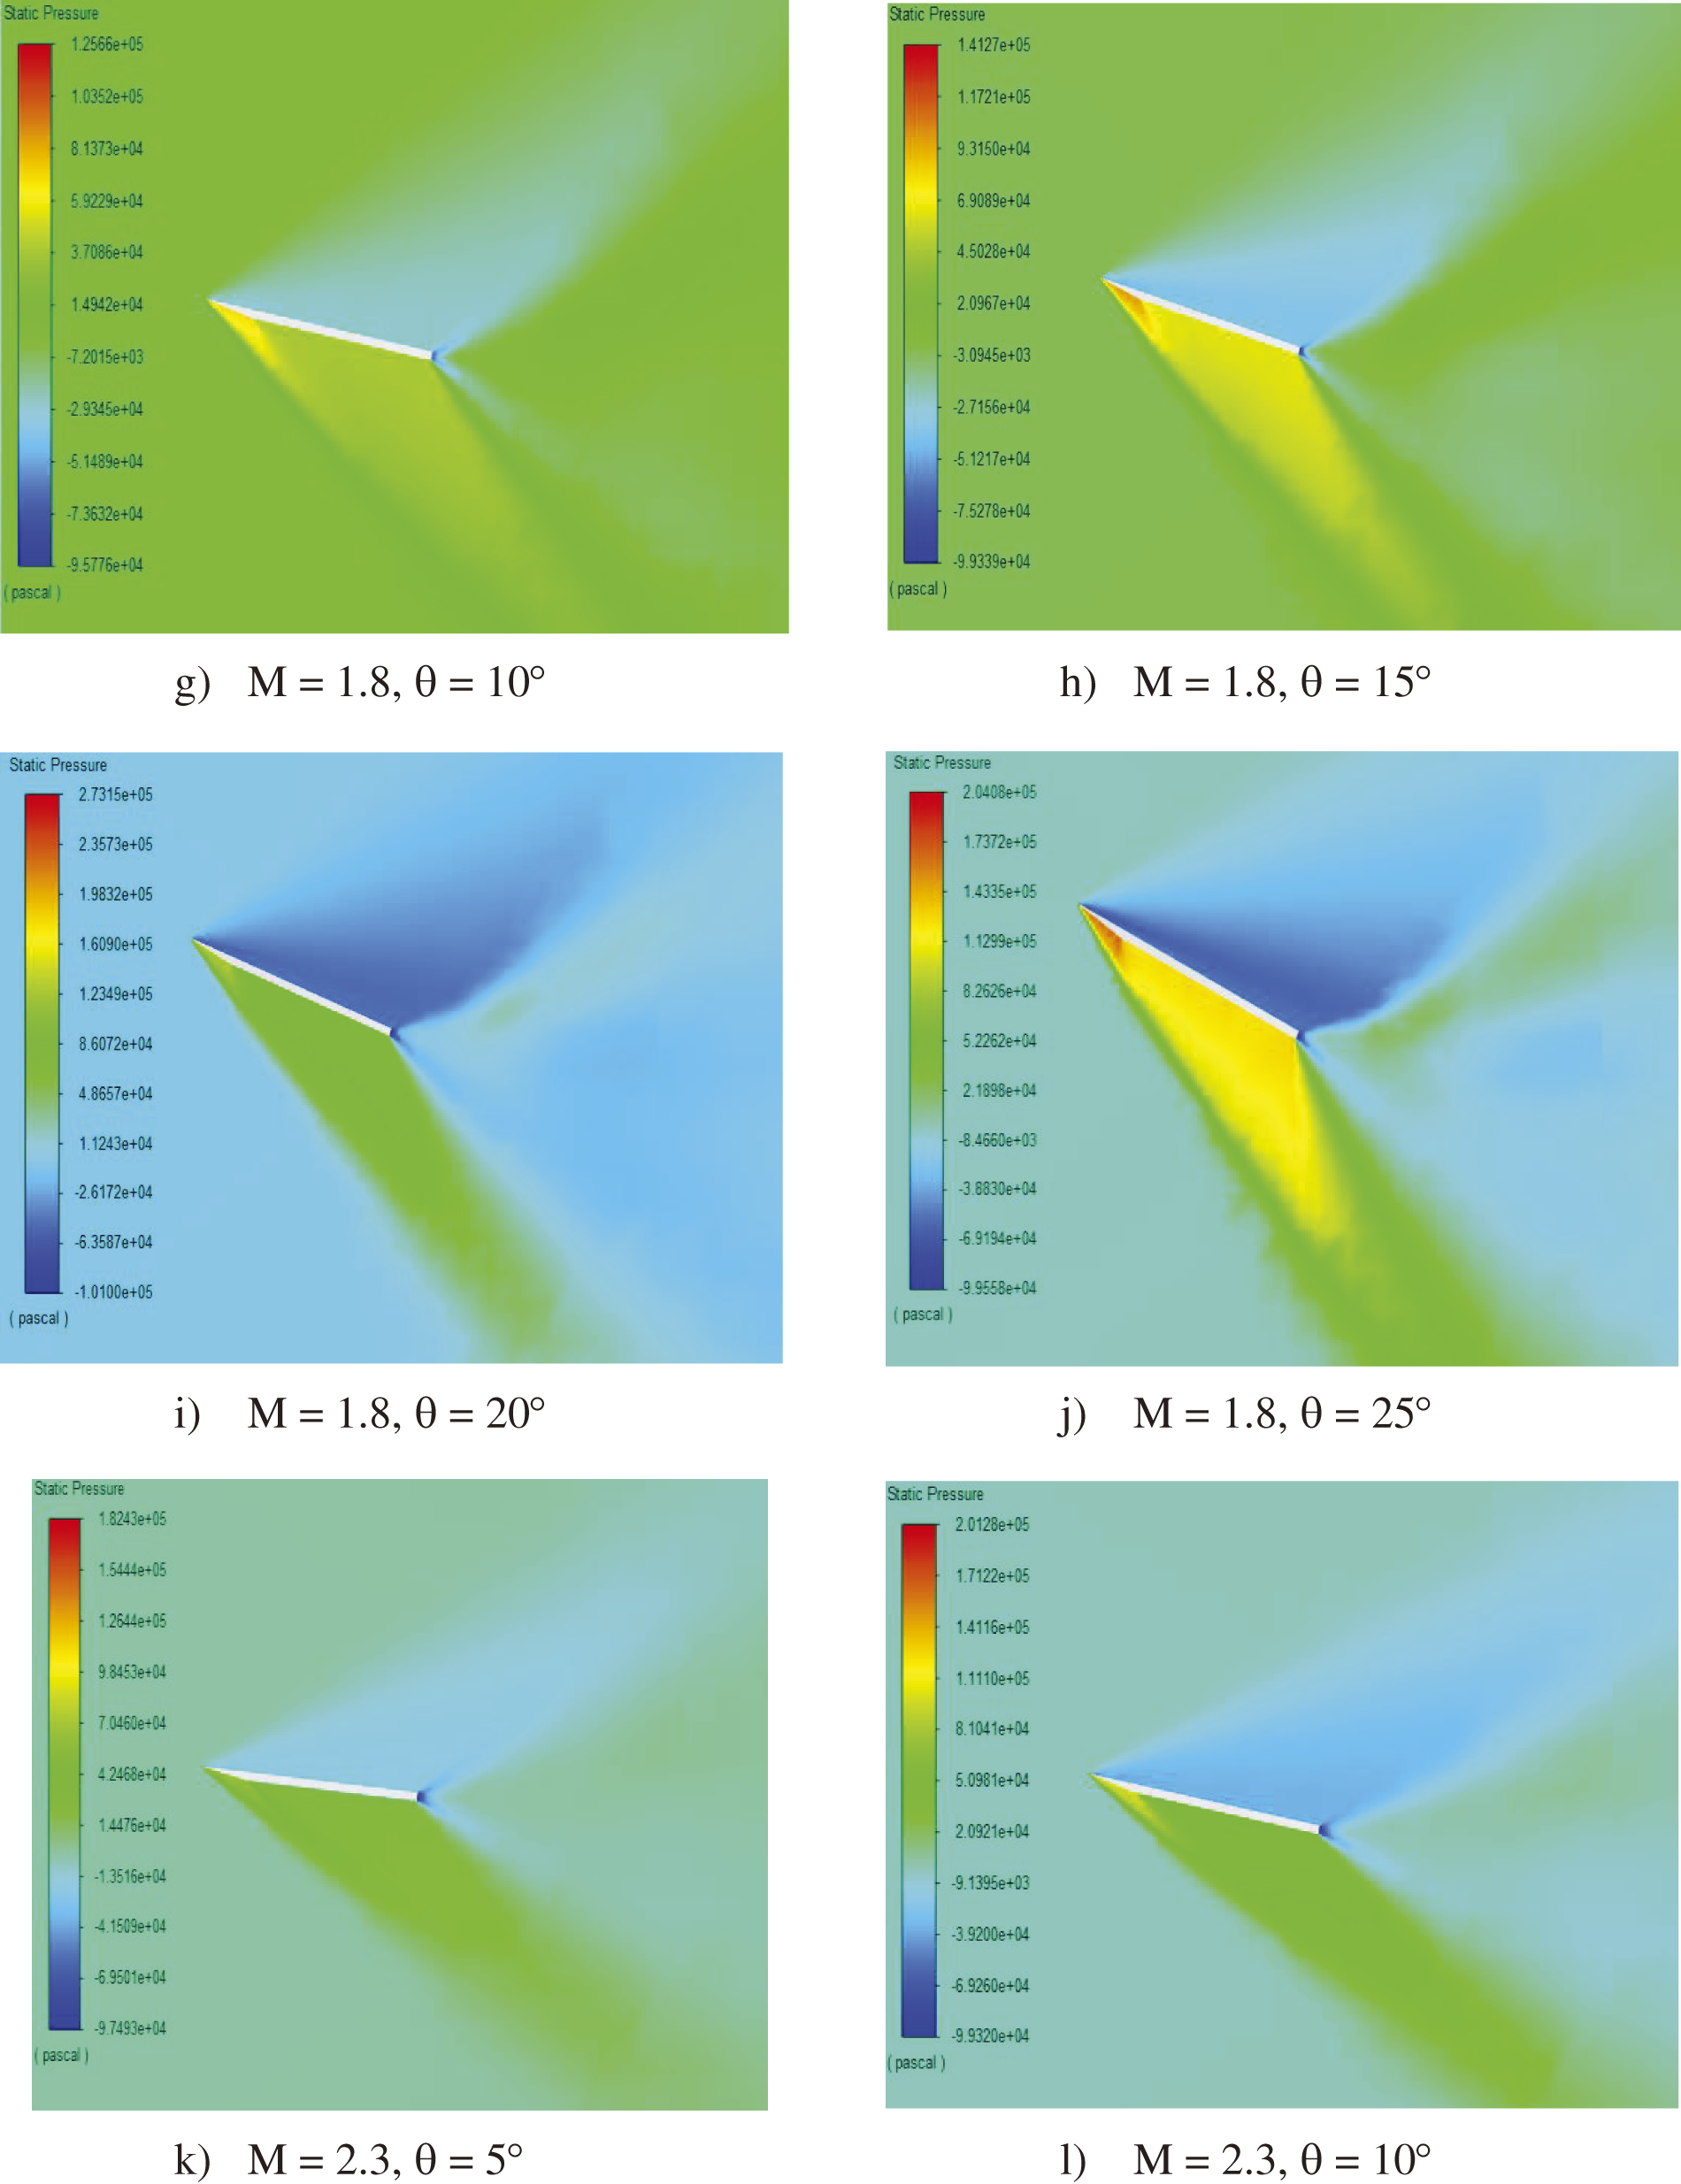
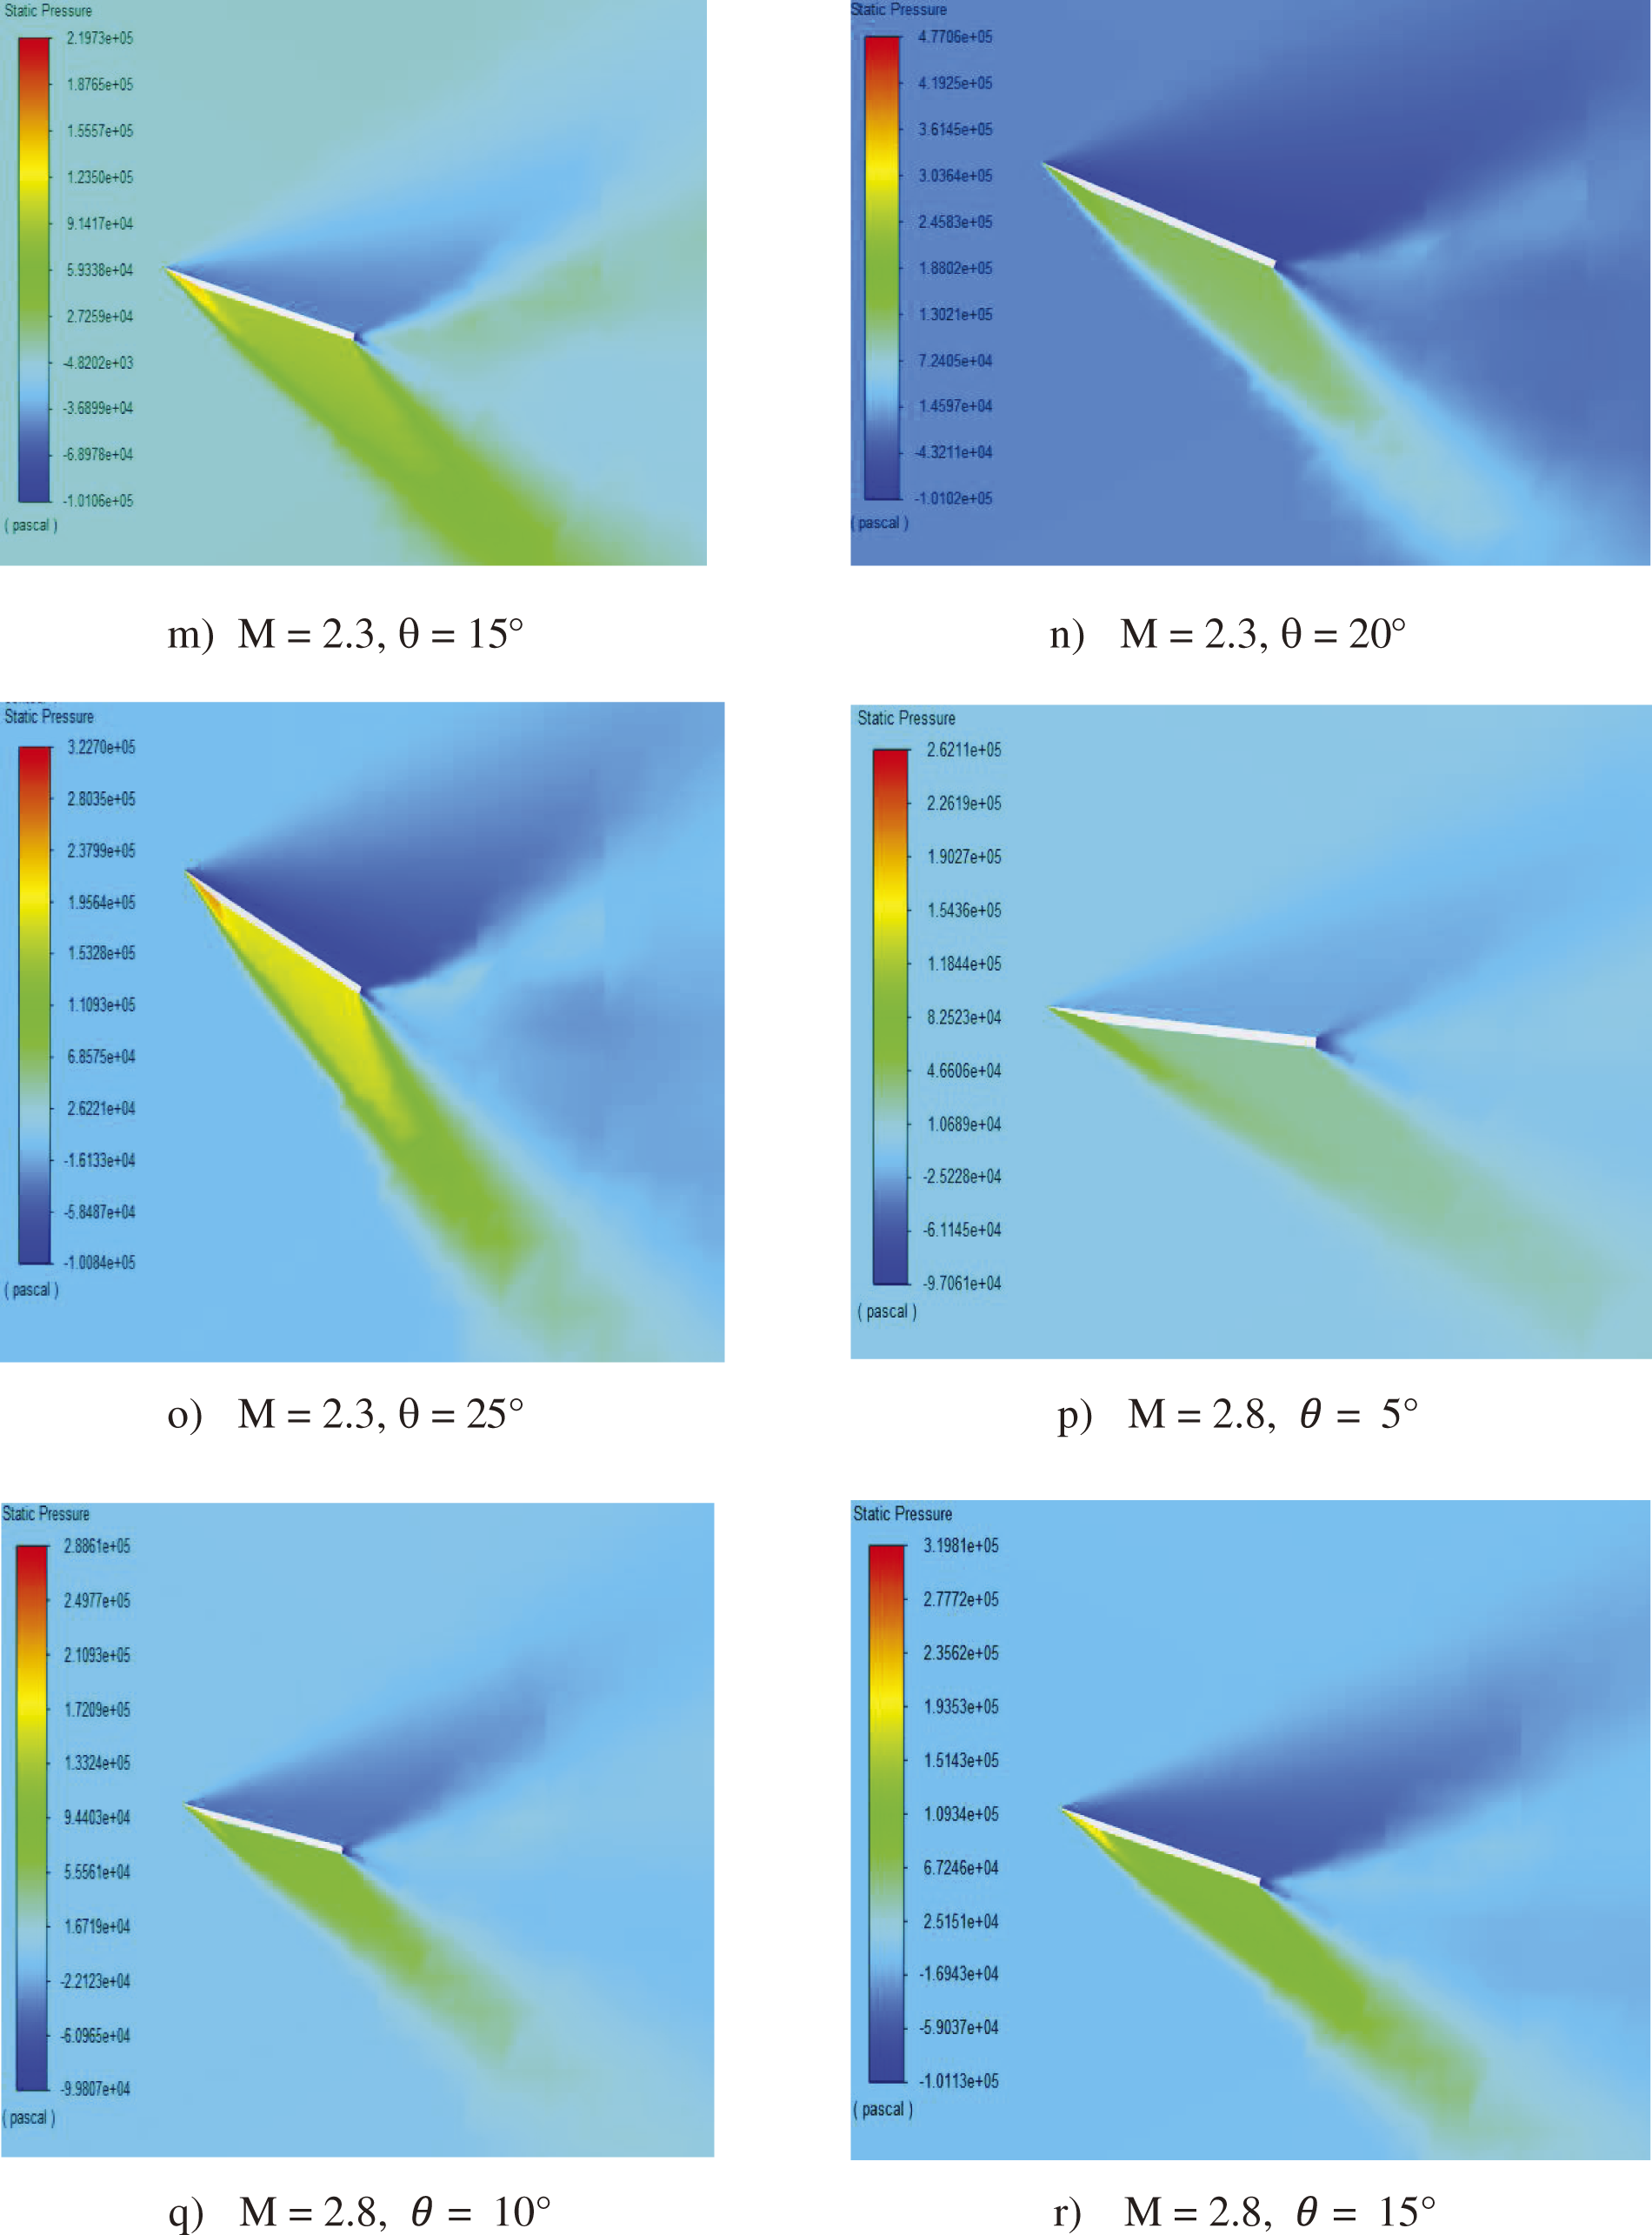
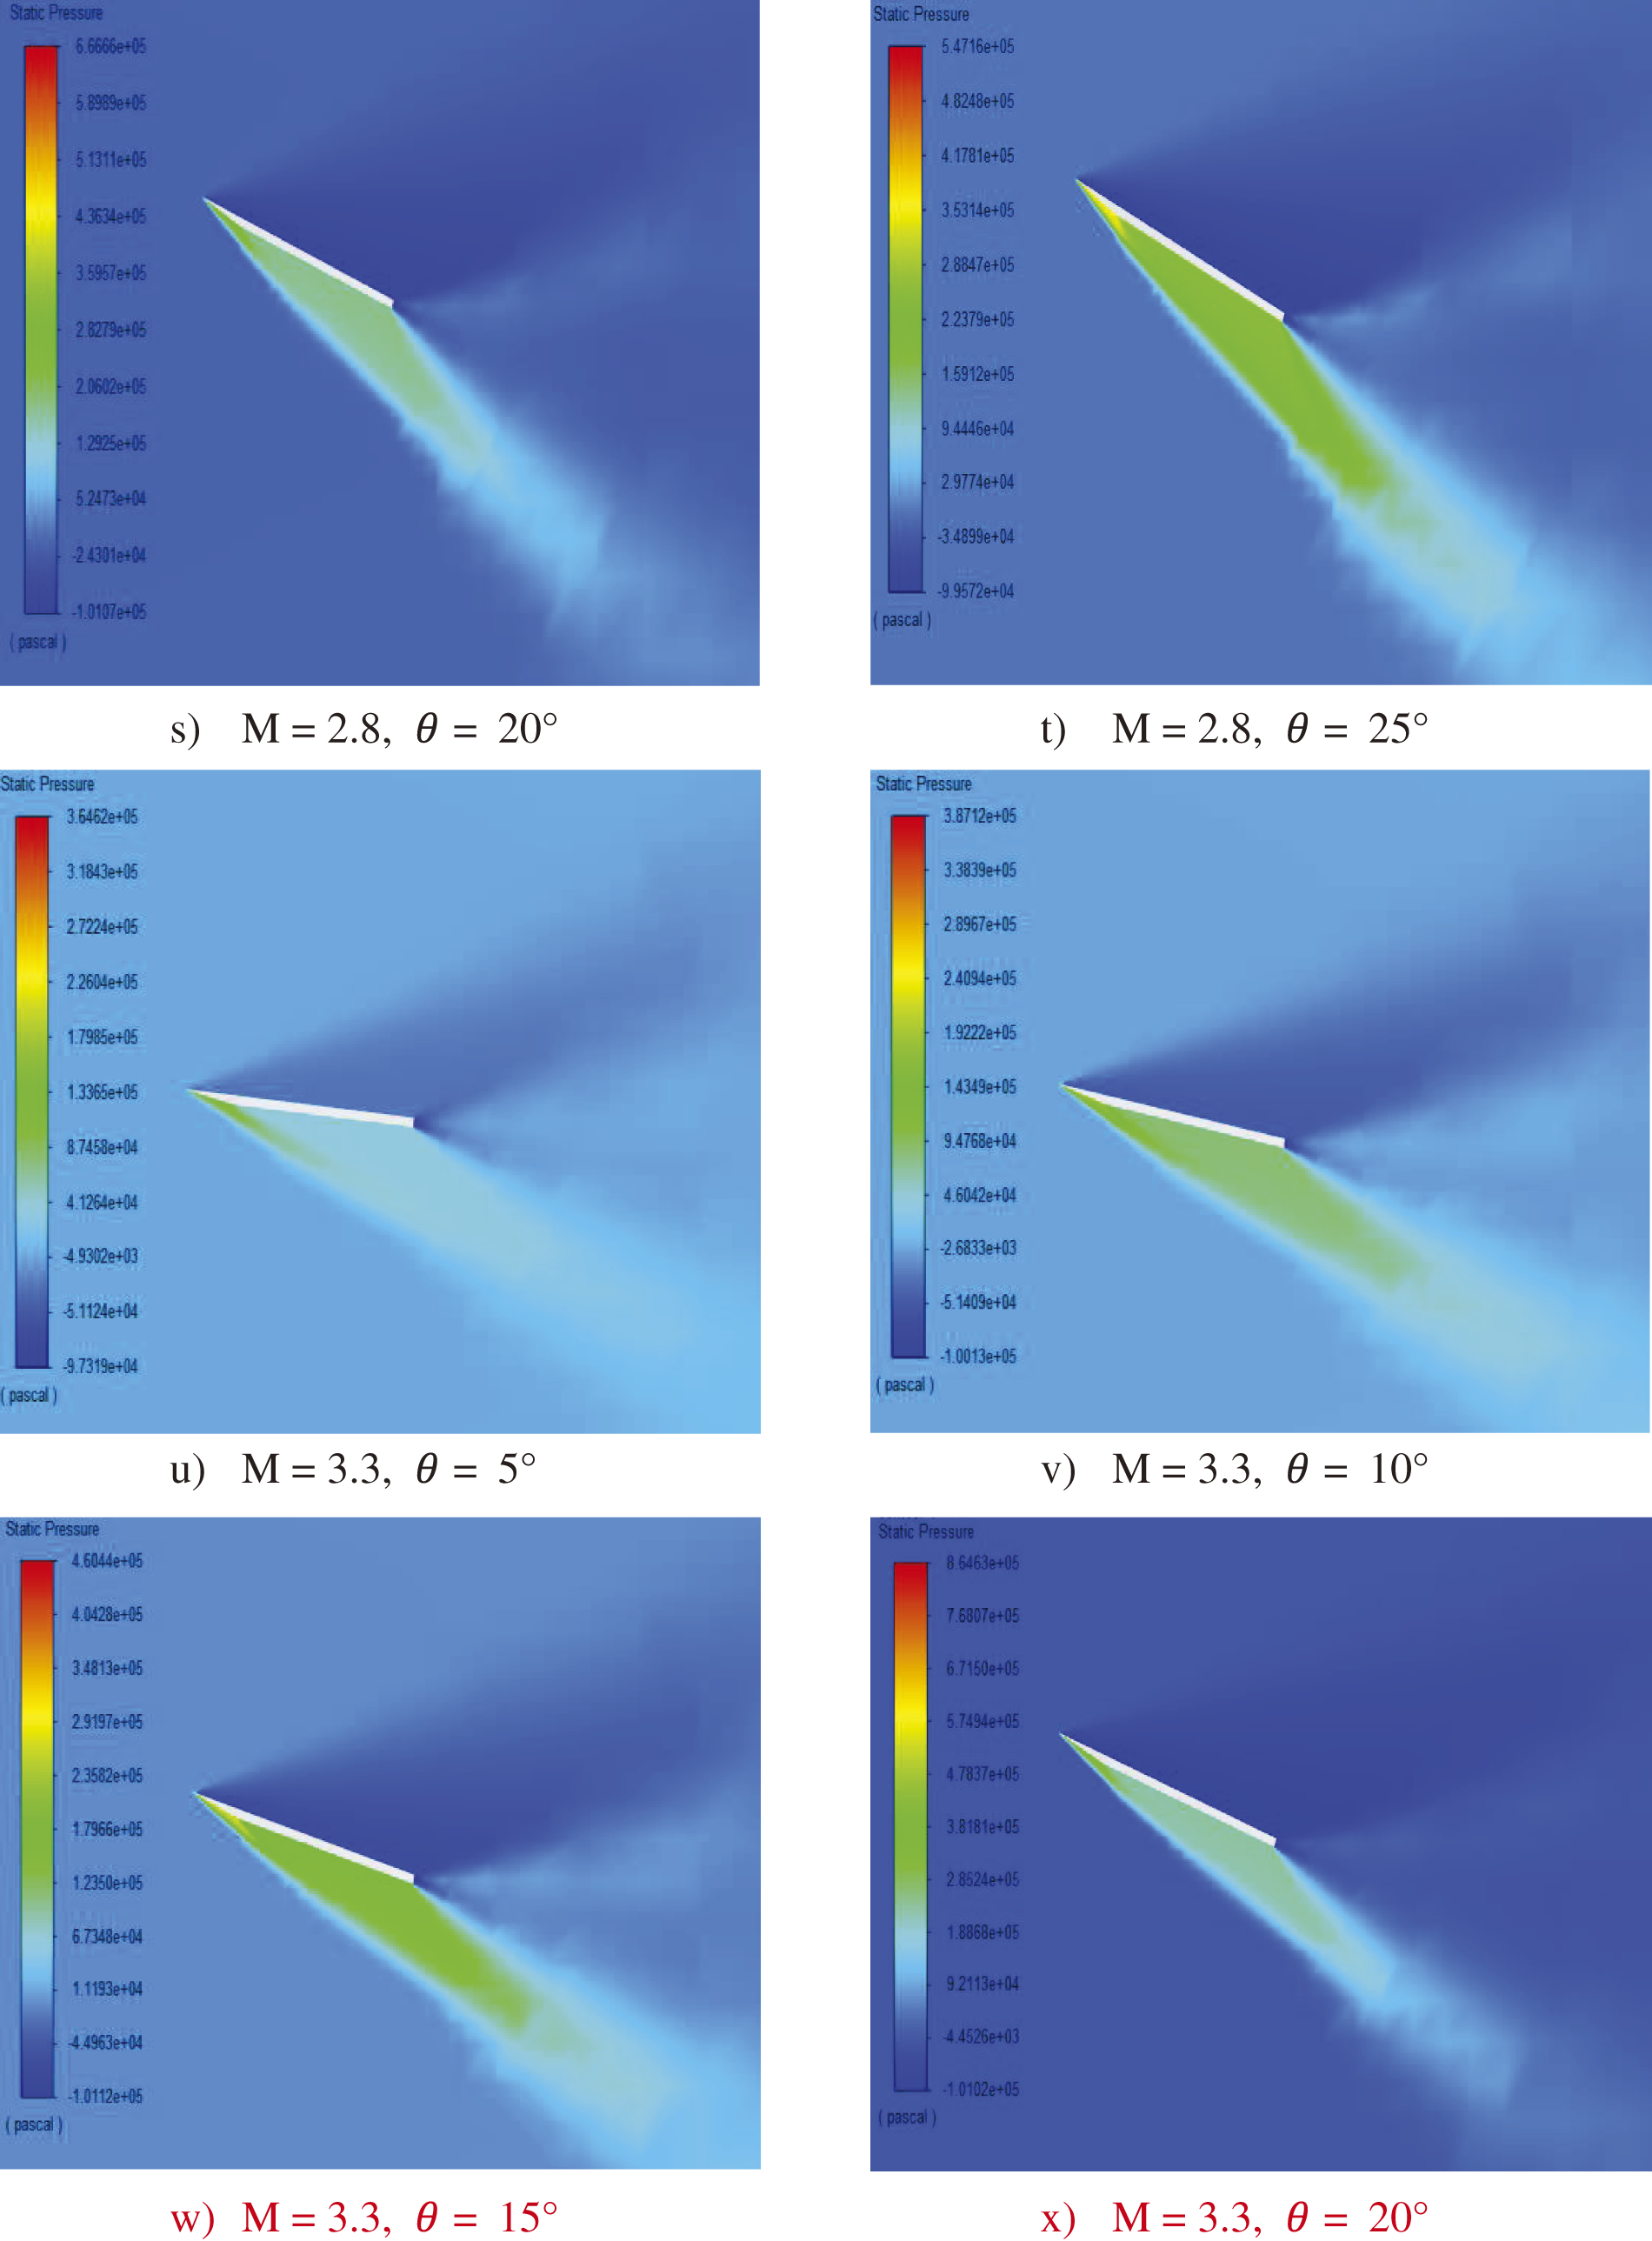
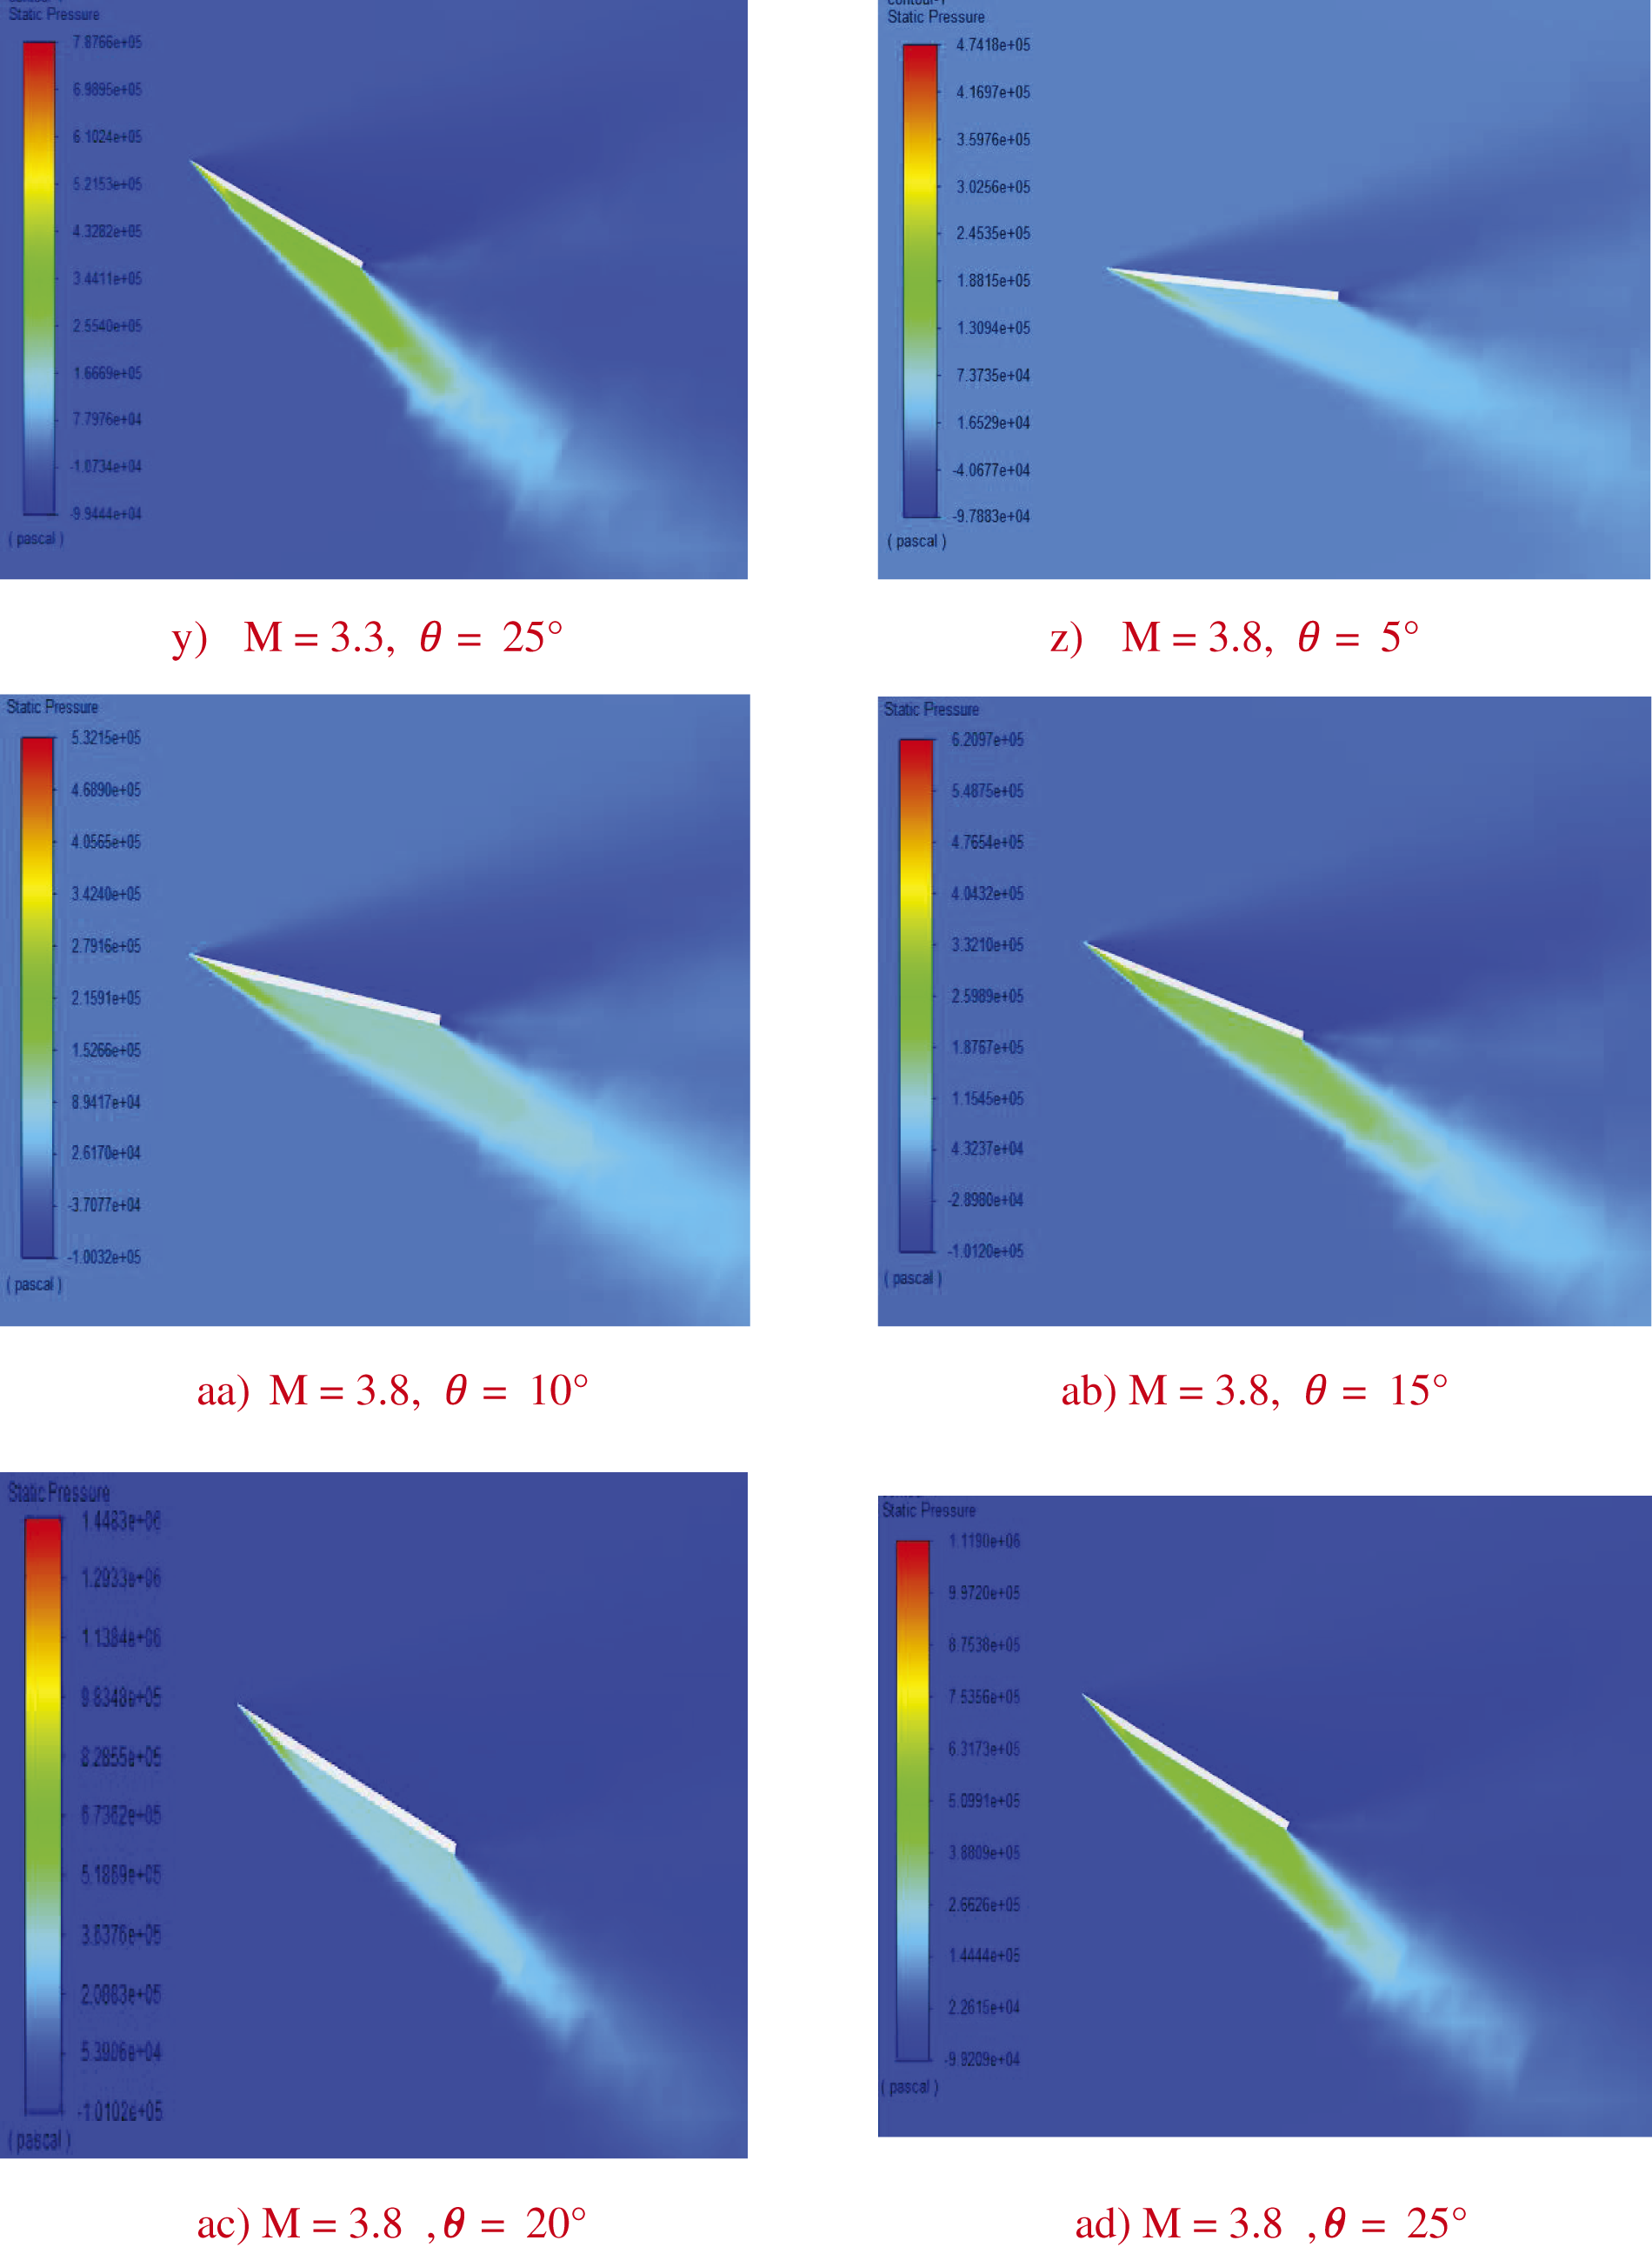
Figure 6: Pressure contours
The data suggest that increasing the Mach number for a given wing angle leads to a more compact Mach cone, implying higher aerodynamic stresses and potential changes in flight characteristics that are to be managed for stability and performance. This phenomenon becomes crucial in high-speed aerodynamics, where precise control and understanding of pressure distribution are necessary to optimize wing design and ensure safe and efficient flight operations. The contours provide valuable insights into how different combinations of Mach numbers and angles of attack impact the wing’s pressure profile, aiding in the design and analysis of supersonic and hypersonic aircraft.
4.2 Main Effects of Inertia Level with Static Pressure
Fig. 7 illustrates the relationship between non-dimensional wing surface pressure (P2/P1) and the Mach number. The image displays the average pressure readings for each case. The findings show that pressure at the delta wing’s nose increases as the Mach number rises. The pressure ratio is also an indicator of the shock wave strength.
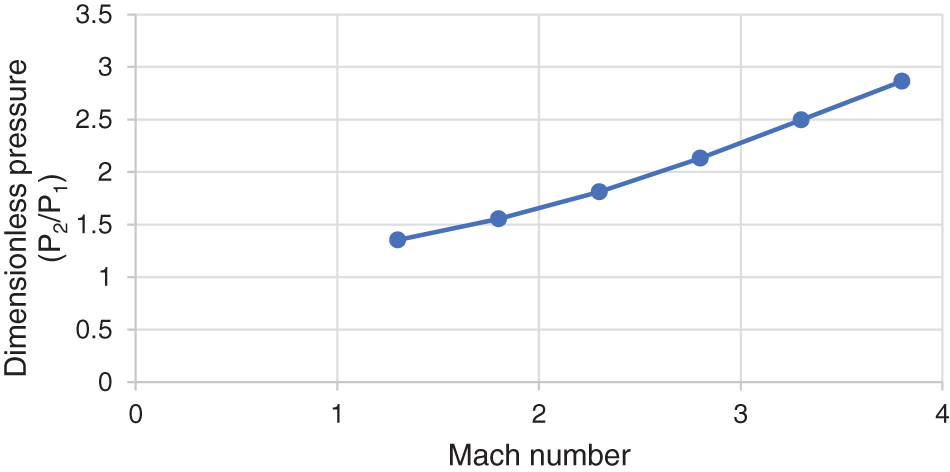
Figure 7: Significance inertia level influence on the pressure
The figure presents a main effect plot depicting the relationship between the dimensionless pressure ratio (P2/P1) and the Mach number. As the Mach number increases from 1.5 to 3.5, the pressure ratio has a consistent upward trend. This indicates that higher Mach numbers result in higher pressure ratios, with the pressure ratio rising from approximately 1.5 at a Mach number of 1.5 to about 2.5 at a Mach number of 3.5. The plot highlights a nearly linear relationship between the Mach number and the pressure ratio, suggesting that the pressure differential across the surface increases as the airflow speed increases. This trend is significant in understanding the aerodynamic performance and the effects of high-speed airflow on pressure distribution, which is crucial for designing and analyzing aircraft and other high-speed vehicles.
4.3 Principal Outcomes Plots with the Angle of Incidence for Surface Pressure
Fig. 8 shows the central impact of the inclination angle plot on the normalized pressure ratio (P2/P1). The collected data exhibits that as the angle of attack rises, so does the pressure. The figure presents a main effect plot illustrating the relationship between the dimensionless pressure ratio (P2/P1) and the angle of incidence (θ). As the angle of incidence increases from 5° to 25°, there is an apparent, nearly linear increase in the pressure ratio. This trend indicates that higher angles of incidence result in greater aerodynamic loads, as reflected by the increasing pressure ratio. The plot shows data points at specific intervals (5°, 10°, 15°, 20°, and 25°), each demonstrating a consistent rise in the pressure ratio with increasing angle. This suggests a direct correlation between the angle of incidence and the pressure differential, implying that as the angle of incidence increases, the aerodynamic forces acting on the wing or surface become more pronounced, leading to higher pressure ratios. This relationship is crucial for understanding the aerodynamic behavior and stability of the wing or surface under varying angles of incidence.
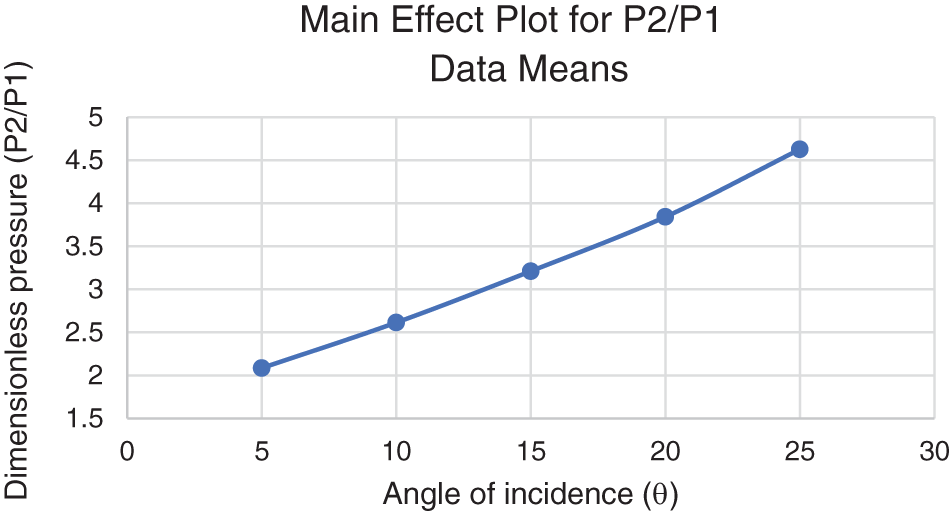
Figure 8: Effect of angle attack and pressure of the wing
4.4 Dimensionless Static Pressure Is Affected by the Following Factors Depending on Where the Wing Is Located
Fig. 9 demonstrates the principal influence of (h) on the wing plot lengths for static pressure. The normalized pressure decreased for h = 0.2 to 0.4, dropping to 0.4 after spot 0.4. The figure presents a main effect plot showing the relationship between the dimensionless pressure ratio (P2/P1) and the location along the pivot position (h). Initially, as the pivot position increases from 0 to approximately 0.2, the pressure ratio rises to a peak of about 1.34. Beyond this point, there is a sharp decline in the pressure ratio, reaching a minimum of around 1.24 as the pivot position approaches 0.5. From 0.5 to 1.0, the pressure ratio stabilizes with minor fluctuations, indicating a relatively steady state. This behavior suggests that the location along the pivot position significantly affects the pressure distribution, with the highest pressure ratio occurring near the start of the pivot position. The sharp decrease following the peak indicates a critical transition point where the aerodynamic forces change, leading to a lower pressure ratio. This trend highlights the importance of pivot positioning in managing pressure distributions and ensuring optimal aerodynamic performance.
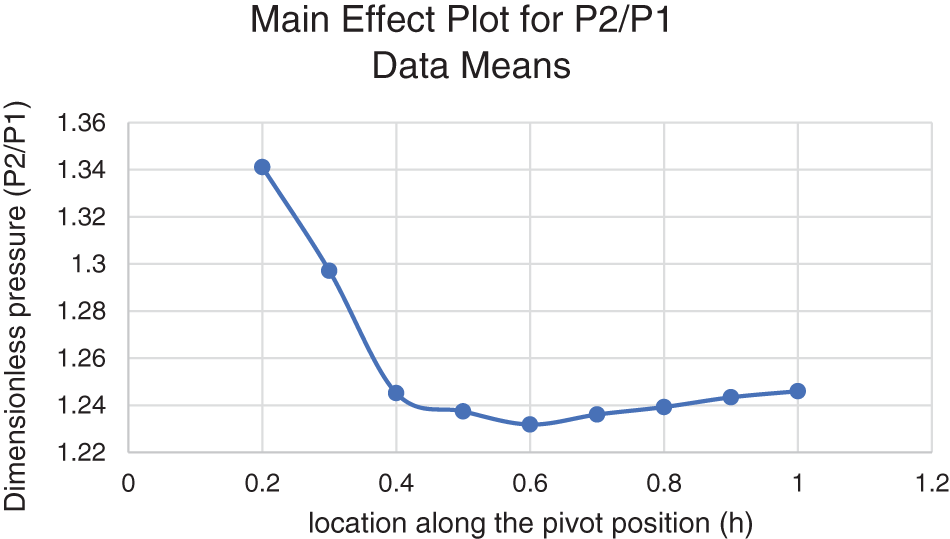
Figure 9: Main effect of pressure ratio vs. h
4.5 Pressure at Fixed Inertia Levels at Several Points of the Wings
With CFD and ANSYS software, which generated graphs at a constant Mach number, the pressure over the pivot point (h) was examined. One can normalize pressure by dividing it with ambient pressure. For varying angles of incidence, Fig. 10 shows the variation in dimensionless static pressure on the pivot point throughout the wing’s length, with a fixed Mach at 1.3. The pressure gradually decreases as the angle of incidence increases, according to the results. Moreover, the pressure decreases from 0.2 to 0.4 for all incidence angles. The pressure is constant between locations 0.4 and 1 for angles of attack of five, ten, and fifteen degrees. For any angle of incidence value between 20 and 25 degrees, when the pivot location is between 0.9 and 1, there are recorded changes in marginal pressure.
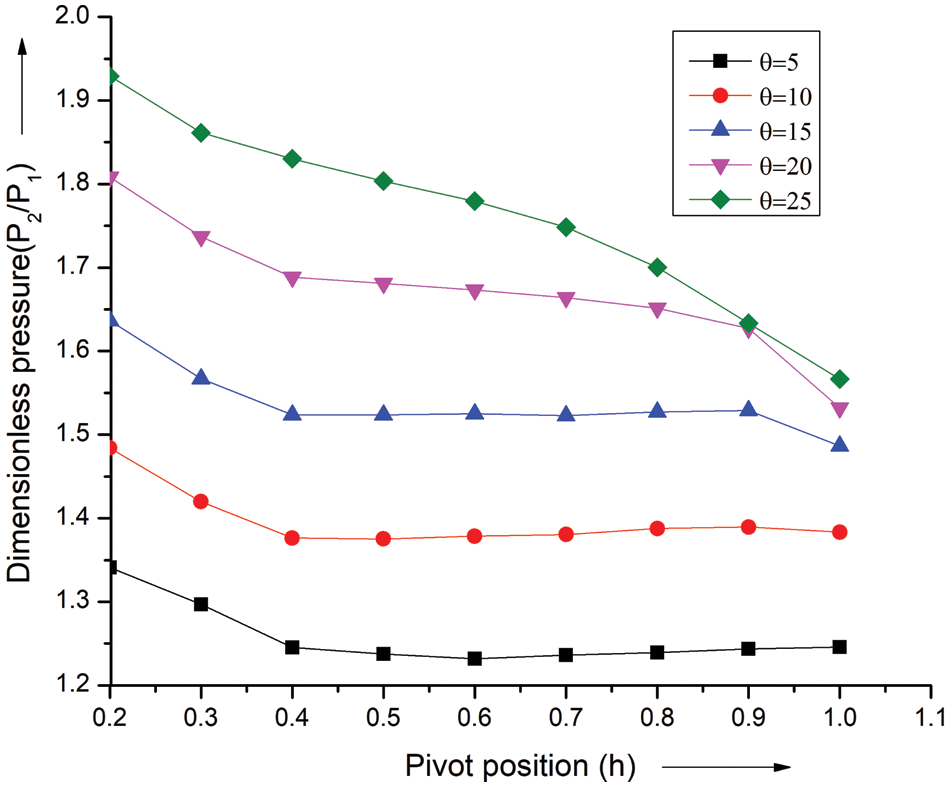
Figure 10: Pressure ratio vs. h for M = 1.3
Along the length of the 3D wing, Fig. 11 demonstrates static pressure changes at various pivot points for multiple incidence angles at a fixed Mach number of 1.3. The consequences indicate a steady increase in pressure with an increasing angle of incidence. Additionally, the pressure drops from 0.2 to 0.5 at every angle of incidence. After passing through point 0.5, the pressure drops to 0.7. There is a tiny variation in pressure between points 0.7 and 1.0 for every value of the angle of attack. Along the length of the 3D wing, the consequences indicate a steady increase in pressure with an increasing angle of incidence.
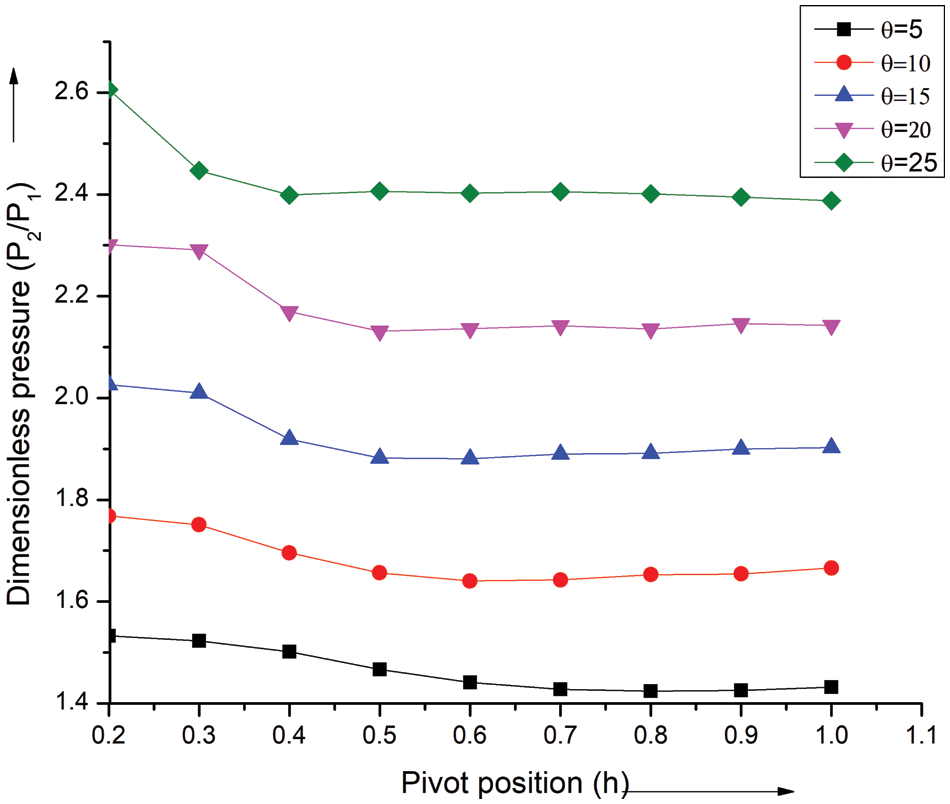
Figure 11: Pressure ratio vs. h for M = 1.8
Additionally, the pressure drops from 0.2 to 0.5 at every angle of incidence. After passing through point 0.5, the pressure drops to 0.7. There is a tiny variation in pressure between points 0.7 and 1.0 for every value of the flow inclination.
Fig. 12 shows the deviation in normalized static pressure against the (h) throughout the wing’s segment at numerous incidence angles, all with a fixed inertia of Mach at 2.3. The data show that at an angle of incidence of 50, the pressure grows for h = 0.2 to 0.4 for the wing. The pressure is constant between 0.5 and 1.0 at all incidence angles. The pressure at positions 0.2 and 0.4 differs slightly for angles 200 and 250.
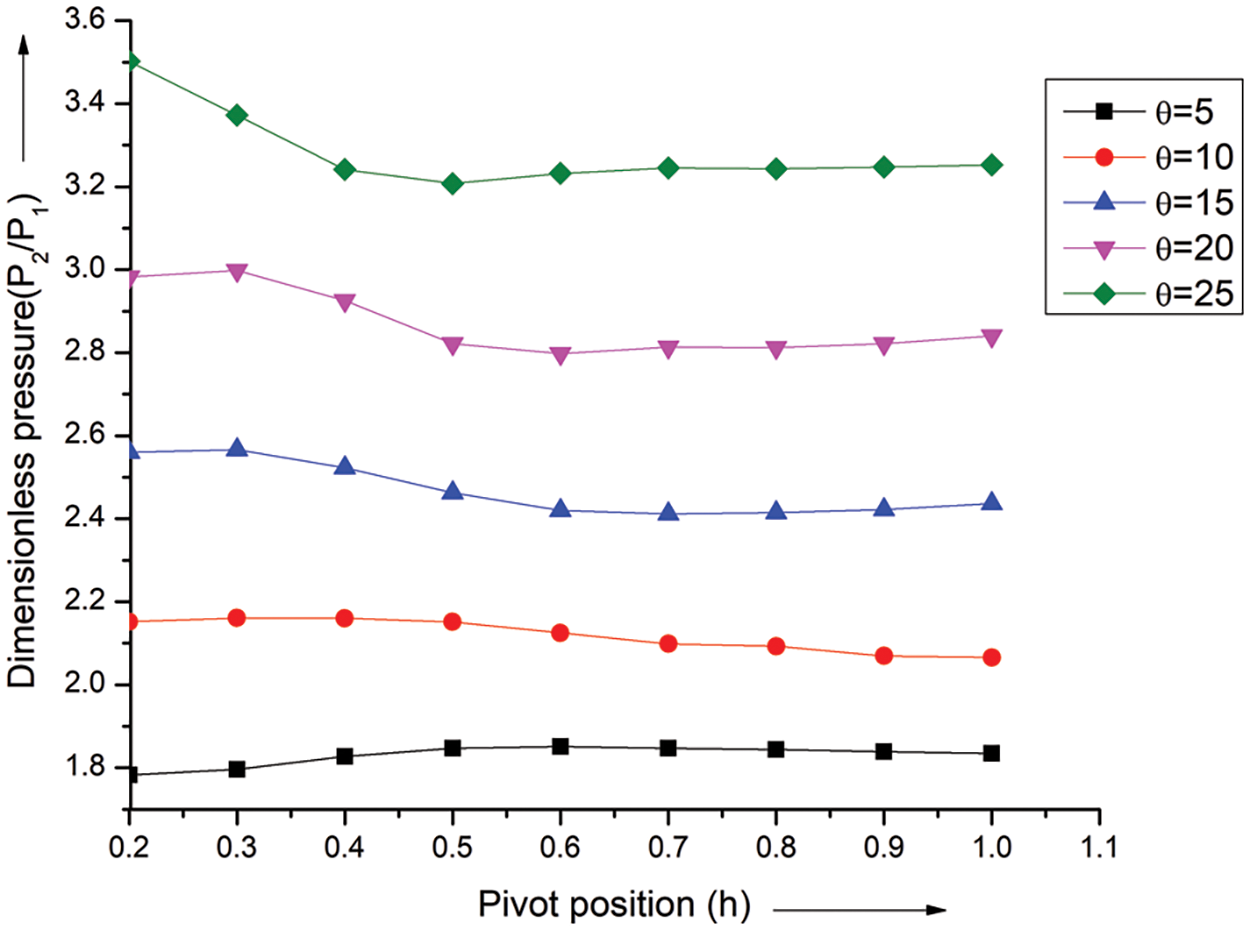
Figure 12: Pressure ratio vs. h at M = 2.3
Fig. 13 shows the fluctuation in pressure with (h) across the wing for different incidence angles and a fixed Mach at 2.8. The pressure grows steadily lengthways of the wings at angles of attack ranging from 5° to 10°, according to the data. Additionally, it is seen that the pressure rises throughout a range from 5° to 10°, from position 0.2 to 0.5. From points 0.2 to 0.5, the pressure is constant between 15° and 25° of incidence angle. Because the shock wave strength and angle vary at different angles of attack, the pressure drops to 0.5 for all incidence angles and stabilizes between 0.6 and 1.0. The parameter P2/P1 represents the strength of the oblique shock wave.
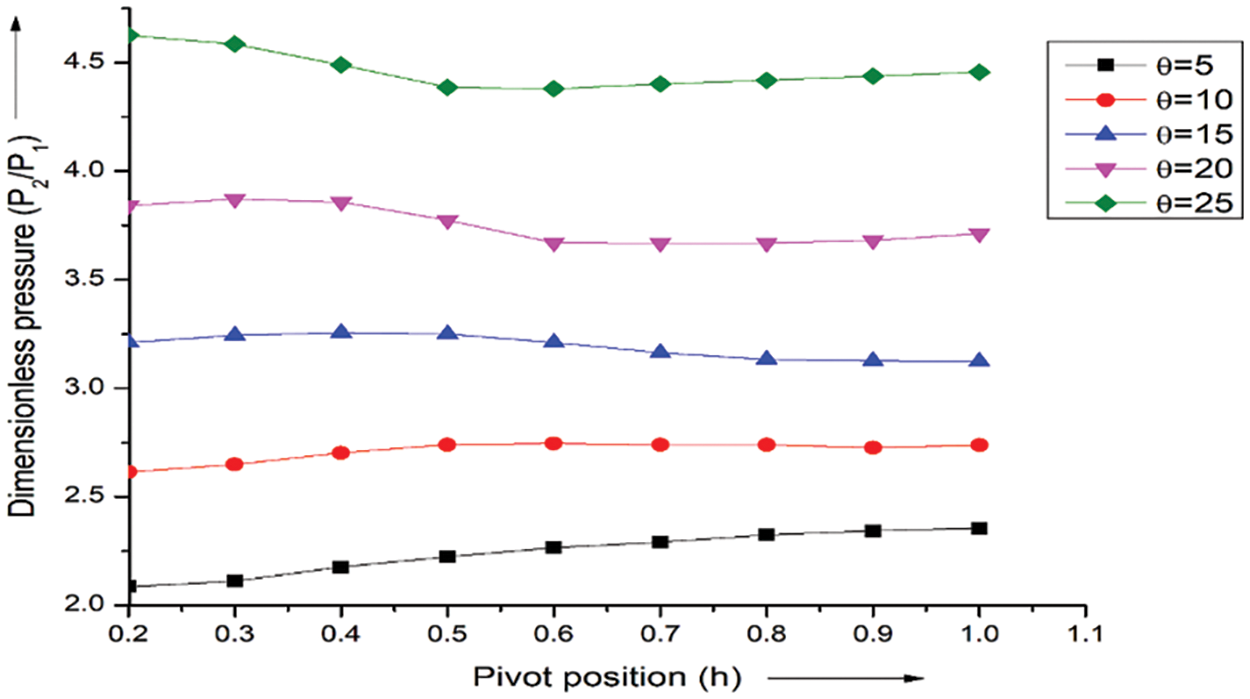
Figure 13: Pressure Ratio vs. h at M = 2.8
The variation of normalized pressure vs. h at various flow inclinations and with a fixed Mach at 3.3 is depicted along the wing in Fig. 14. As the results demonstrate, pressure increases steadily along the three-dimensional wing’s length with the angle of attack between 5° and 15°. The pressure increases for the 5° to 20° range, rising from position 0.2 to 0.5. The pressure drops from 0.3 to 0.5 after staying constant from position 0.2 to 0.3 at a 25° angle of incidence—every angle of incidence between 0.6 and 1.0 experiences the same pressure. The fluctuation of dimensionless static pressure vs. location (h) at several angles of attack and Mach at 3.3 is depicted along the wing in Fig. 14. As the results demonstrate, pressure increases steadily along the three-dimensional wing’s length for an angle of attack between 5° and 15°. The pressure increases for the 5° to 20° range, rising from position 0.2 to 0.5. The pressure drops from 0.3 to 0.5 after staying constant from position 0.2 to 0.3 at a 25° angle of incidence—every angle of incidence between 0.6 and 1.0 experiences the same pressure.
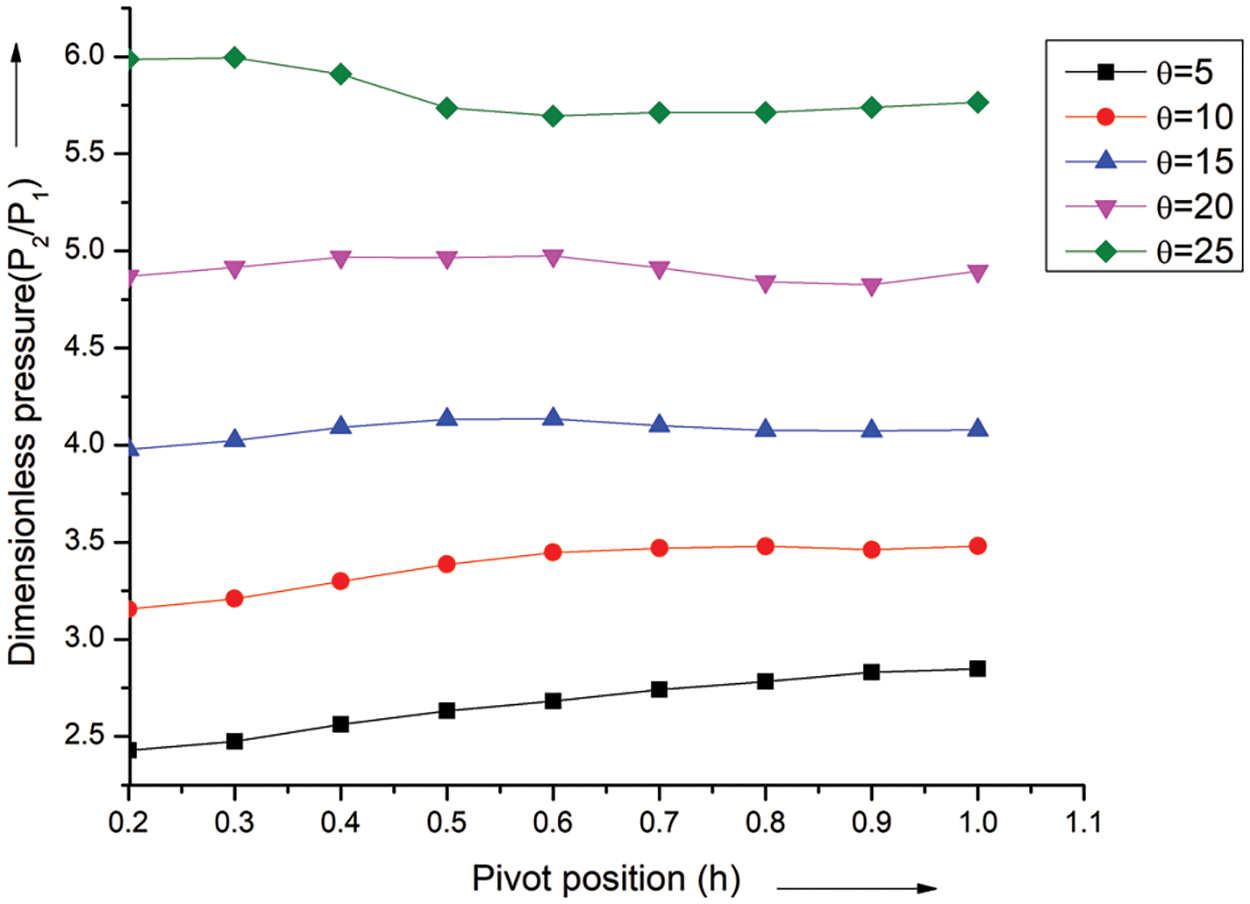
Figure 14: Pressure ratio vs. h at M = 3.3
The variation in dimensionless static pressure vs. for various angles of incidence is displayed in Fig. 15. Location (h) with a constant Mach number of 3.8 along the wing. The outcome indicates a steady increase in pressure with wing length for the angle of attack involving 50 and 200. Furthermore, it is seen that the pressure rises from position 0.2 to 0.5 throughout a range of 5° to 20°. The pressure remains constant from position 0.2 to 0.4 and decreases from 0.4 to 0.5 at a 25° angle of incidence. At all incidence angles, the pressure continues steady between 0.6 and 1.0.
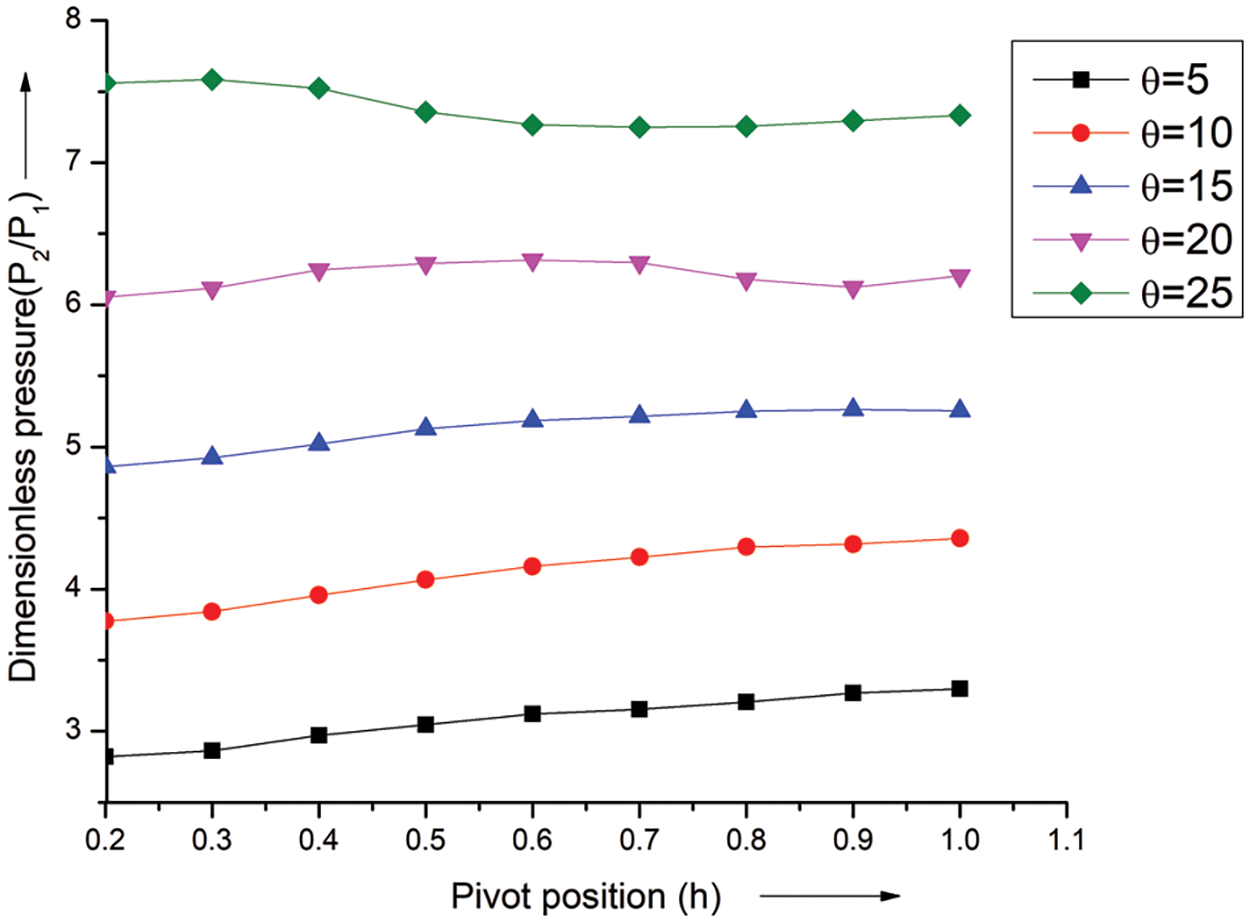
Figure 15: Pressure ratio vs. h at M = 3.8
4.6 Surface Pressure at Various Points Alongside the Wing’s Length at a Constant Incidence Angle
The ANSYS program generated the CFD study results for the pressure at numerous places along (h) at a constant incidence angle. As a result, pressure is normalized by the ambient pressure to obtain the dimensionless pressure values. Plotting the dimensionless fluctuations in pressure for different Mach (M) vs. location (h) for a fixed flow deflection (θ = 5°) is shown in Fig. 16. The findings for Mach at 2.8, 3.3, and 3.8 show that pressure gets stronger constantly from 0.2 to 0.4 with (h). At every position along the pivot of the wing, the pressure change is significant for Mach values of 1.3, 1.8, and 2.3. Pressure fluctuations with any Mach number can be seen from h = 0.5 to 1.0 throughout the wings.
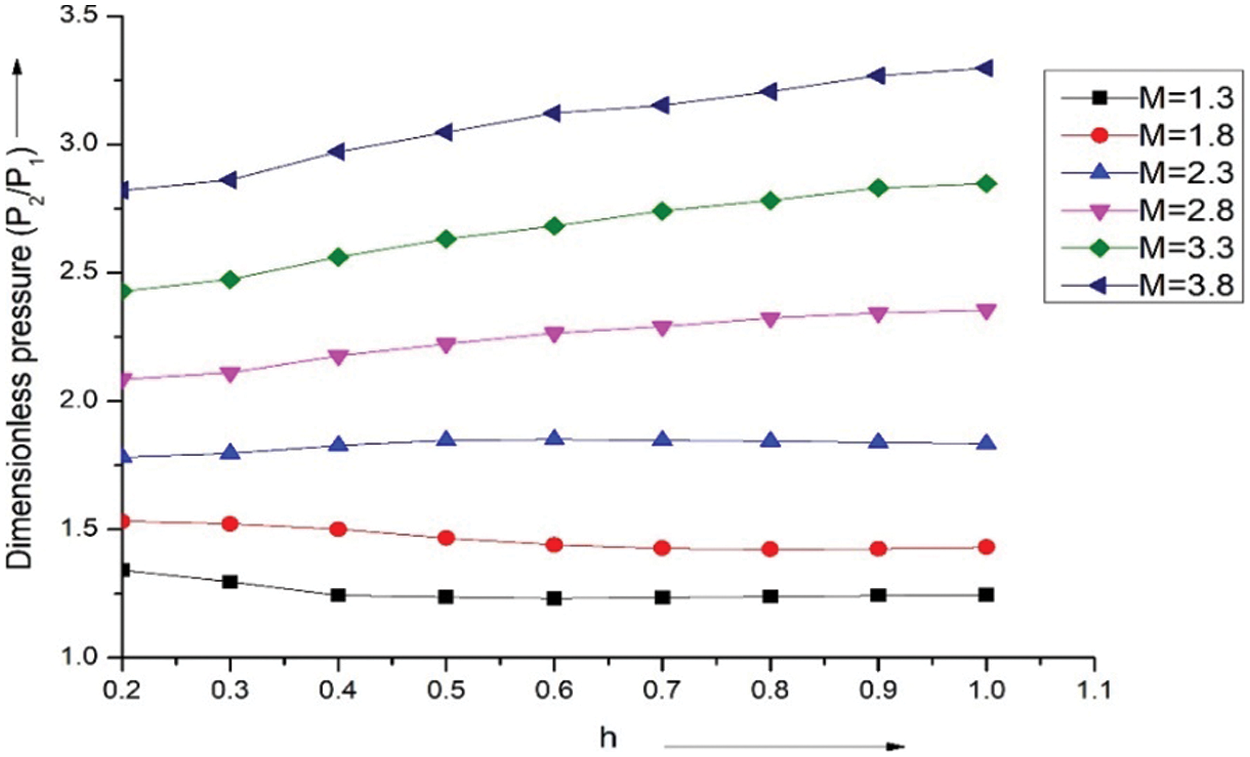
Figure 16: Pressure ratio vs. h at θ = 5°
Fig. 17 demonstrates the variations in normalized pressure for different Mach (M) with (h) for a fixed flow deflection angle (θ = 10°). Mach number of 1.3 and 1.8, the results indicate a constant pressure decrease from 0.2 to 0.4 along the pivot location of the wing. The pressure variation increases dramatically at positions 0.2 to 0.7 with (h) for Mach numbers 3.3 and 3.8. Variations in the wing’s pressure with any Mach number can be seen from position 0.5 to 1.0.
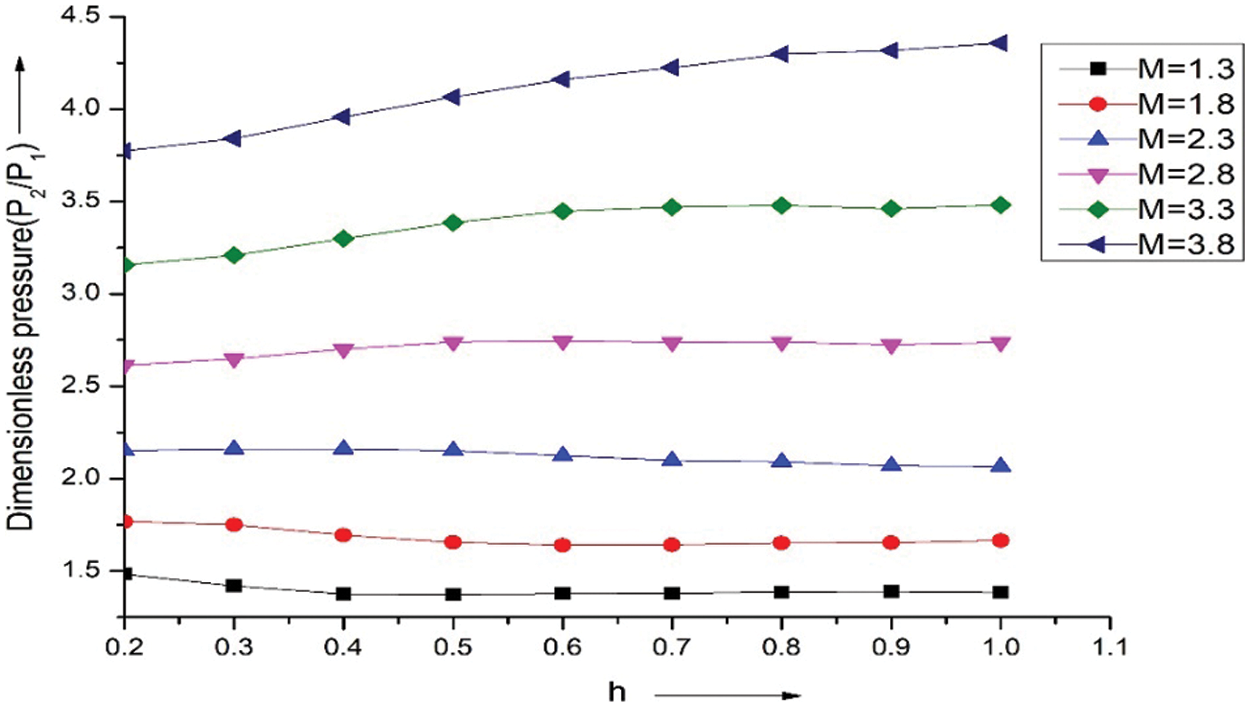
Figure 17: Pressure ratio vs. h at θ = 10°
The graph in Fig. 18 demonstrates how, for various Mach (M), normalized pressure varies with (h) at a fixed flow inclination θ = 15 degrees. The results of the Mach number at 1.3 and 1.8 confirm a consistent pressure reduction from 0.2 to 0.4 across the wing. The pressure variation increases dramatically at positions 0.2 to 0.7 along the wing’s h location for Mach number at 3.3 and 3.8. Pressure fluctuations with any Mach number can be seen at h = 0.5 to 1.0 throughout.
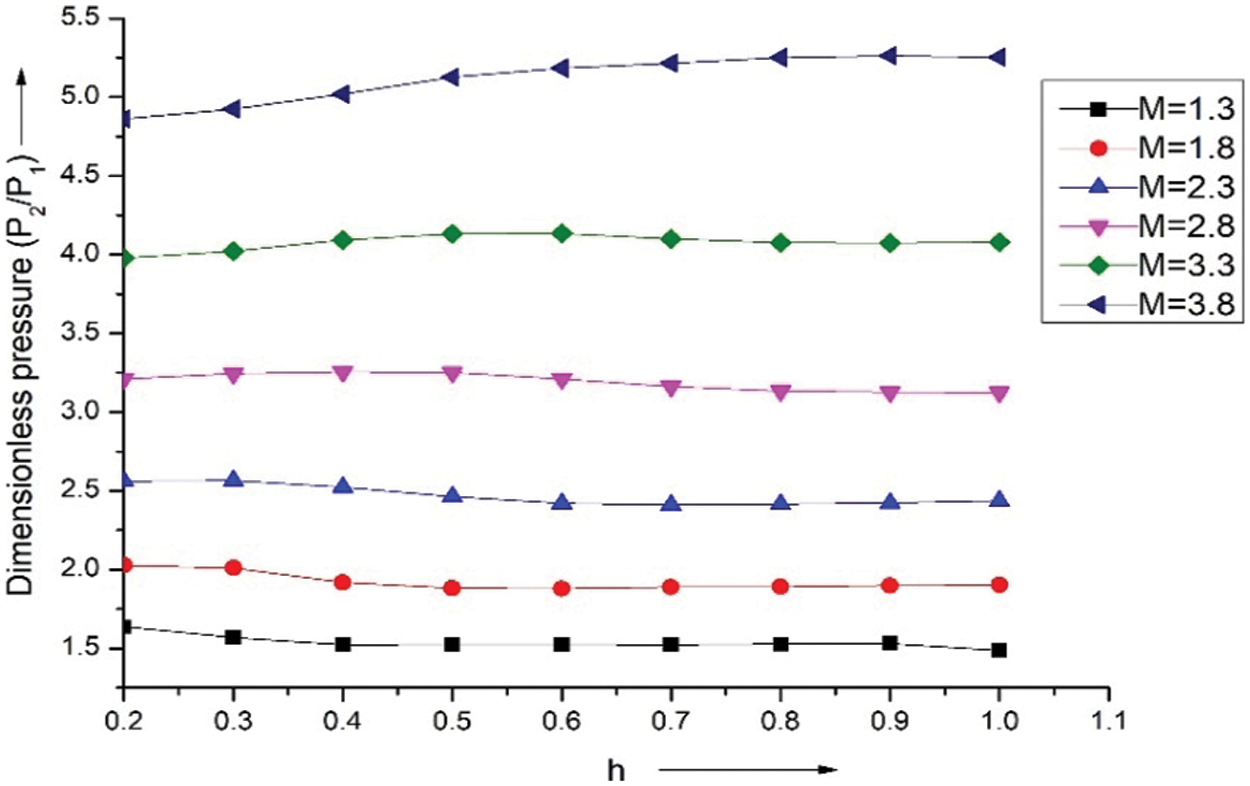
Figure 18: Pressure ratio vs. h at θ = 15°
Fig. 19 exhibits fluctuations in normalized pressure for numerous Mach values, plotted vs. h at a fixed angle of θ = 20°. Mach numbers 1.3 and 1.8 show that the pressure steadily drops for h = 0.2 to 0.4. Furthermore, the pressure variation is substantially more significant, h = 0.2 to 0.7, for Mach values of 3.3 and 3.8. The pressure varies throughout the wings from 0.5 to 1.0 for all Mach (M) values.
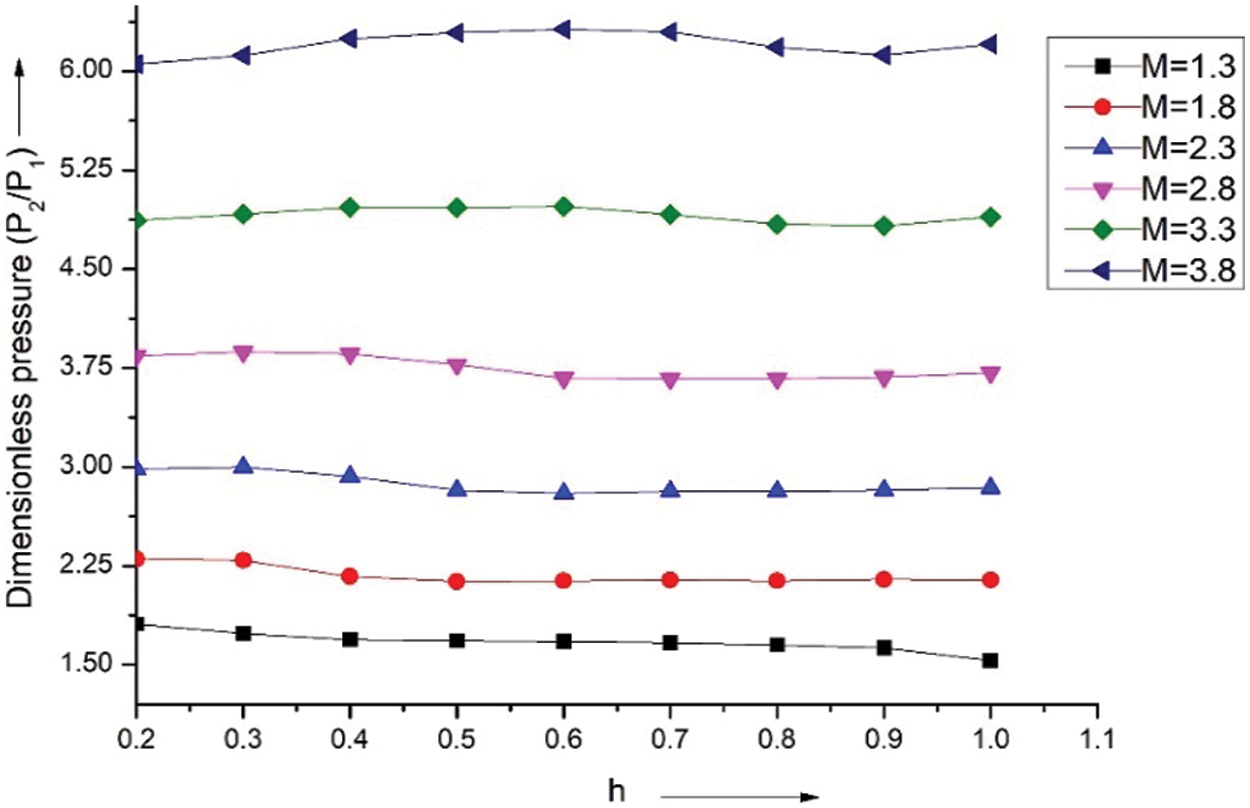
Figure 19: Pressure ratio vs. h at θ = 20°
Fig. 20 displays the dimensionless variations in pressure for different Mach (M) vs. h at a given flow deflection angle (θ = 25°). Mach numbers 1.3 and 1.8 show that the pressure steadily drops from h = 0.2 to 0.4. For every Mach level, the pressure remains constant along the wing’s length, between 0.5 and 1.0.
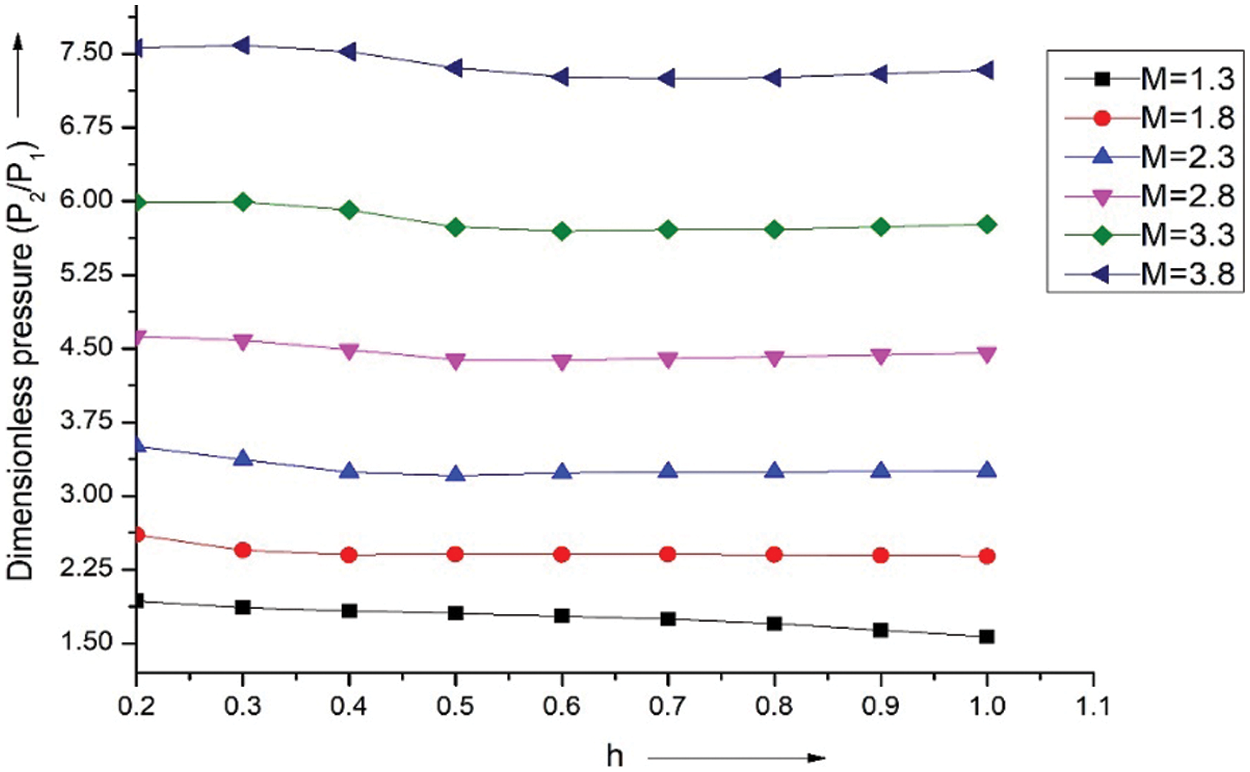
Figure 20: Pressure ratio vs. h at θ = 25°
The research explores the influence of Mach number and angle of incidence on surface pressure distribution along delta wings for supersonic Mach numbers. The study highlights the relevance of these factors in designing and optimizing aerospace vehicles for improved aerodynamic performance and stability. Results indicate that the pressure ratio along the pivot position about which the wing is oscillating, by and large, remains constant with marginal variation due to the pivot position affecting the surface pressure spreading towards the length of the wing. Key findings indicate that an increase in Mach number and angle of incidence leads to higher surface pressure, which is crucial for predicting wing behavior under various flight conditions. This parameter is also an indicator of the oblique shock wave strength. It is also noticed that as the angle of attack is raised, there is a significant alteration in the pressure along the compression side of the wing. The research also underscores the cost-effectiveness of using CFD analysis over traditional wind tunnel testing. CFD provides comparable insights at reduced costs, making it valuable during the design phase of aerospace vehicles where development expenses are significant.
Further, the compatibility of CFD results with existing literature and empirical data from wind tunnel tests enhances the reliability of computational approaches. This integration helps cut down development costs and timeframes. The findings suggest potential areas for future research, such as exploring new materials and wing geometries to leverage these aerodynamic properties for further performance enhancements. Overall, this study contributes significant theoretical and practical insights to aerospace engineering, particularly in improving lift-to-drag ratios and fuel efficiency, thereby aiding the design and operation of future aerospace vehicles.
Acknowledgement: This research is supported by the Structures and Materials (S&M) Research Lab of Prince Sultan University. Furthermore, the authors acknowledge Prince Sultan University’s support for paying this publication’s article processing charges (APC).
Funding Statement: The authors received no specific funding for this study.
Author Contributions: Writing—original draft preparation, Shamitha Shetty; conceptualization, Asha Crasta, Sher Afghan Khan; validation, Abdul Aabid; resources, Shamitha Shetty; review and editing, Asha Crasta, Sher Afghan Khan and Muneer Baig; evaluation, Muneer Baig. All authors reviewed the results and approved the final version of the manuscript.
Availability of Data and Materials: The data is available upon request.
Ethics Approval: Not applicable.
Conflicts of Interest: The authors declare that they have no conflicts of interest to report regarding the present study.
References
1. Hui WH, Hemdan HT. Unsteady hypersonic flow over delta wings with detached shock waves. AIAA J. 1976;14:505–11. doi:10.2514/3.7120. [Google Scholar] [CrossRef]
2. Hui WH. Stability of oscillating wedges and caret wings in hypersonic and supersonic flows. AIAA J. 1969;7:1524–30. doi:10.2514/3.5426. [Google Scholar] [CrossRef]
3. Mohamed MA, Afgan I, Salim MH, Mohamed IK. Low speed aerodynamic characteristics of non-slender delta wing at low angles of attack. Alexandria Eng J. 2022;61:9427–35. doi:10.1016/j.aej.2022.03.003. [Google Scholar] [CrossRef]
4. Pike J. The pressure on flat and an hydral delta wings with attached shock waves. Aeronautl Quart. 1972;4:253–62. doi:10.1017/S0001925900006156. [Google Scholar] [CrossRef]
5. Carrier GF. The oscillating Wedge in Supersonic stream. J Aeronaut Sci. 1949;16(3):150–2. doi:10.2514/8.11755. [Google Scholar] [CrossRef]
6. Hui WH. Supersonic/hypersonic flow past an oscillating flat plate at high angles of attack. J Appl Math Phy (ZAMP). 1978;29:414–27. doi:10.1007/BF01590763. [Google Scholar] [CrossRef]
7. Hui WH. Supersonic and hypersonic flow with attached shock waves over delta wings. Proc R Soc. 1971;325:251–68. doi:10.1098/rspa.1971.0168. [Google Scholar] [CrossRef]
8. Orlik-Ruckemann KJ. Dynamic stability testing of aircraft needs versus capabilities. Progr Aerospace Sci. 1975;16:431–47. doi:10.1016/0376-0421(75)90005-6. [Google Scholar] [CrossRef]
9. Lui DD, Hui WH. Oscillating delta wings with attached shock waves. AIAA J. 1977;15(6):804–12. doi:10.2514/3.7371. [Google Scholar] [CrossRef]
10. Light Hill MJ. Oscillating aerofoil at high mach numbers. J Aeronautical Sci. 1953;20:402–6. doi:10.2514/8.2657. [Google Scholar] [CrossRef]
11. Ghosh K. A new similitude for Aerofoil in hypersonic flow. In: Proceedings of the 6th Canadian Congress of Applied Mechanics, 1977; Vancouver, BC, Canada; p. 685–6. Available from: https://www.researchgate.net/publication/347534609 [Google Scholar]
12. Miles JW. Unsteady flow at hypersonic speeds, hypersonic flow. London: Butter worths Scientific Publications; 1960. p. 185–97. [Google Scholar]
13. Ghosh K, Mistry BK. Large incidence hypersonic similitude and oscillating non-planar wedges. AIAA J. 1980;18(8):1004–6. doi:10.2514/3.7702. [Google Scholar] [CrossRef]
14. Ghosh K. Hypersonic large deflection similitude for oscillating delta wings. Aeronaut J. 1984;357–61. doi:10.1017/S0001924000020868. [Google Scholar] [CrossRef]
15. Crasta A, Khan SA. High incidence supersonic similitude for planar wedge. Int J Eng Res Appl. 2012;2(5):468–71. [Google Scholar]
16. Crasta A, Khan SA. Oscillating Supersonic delta wing with straight leading edges. Int J Computat. 2012;2(5):1226–123. [Google Scholar]
17. Crasta A, Khan SA. Stability derivatives of a Delta Wing with a straight leading edge in the Newtonian Limit. Int J Eng Res Appl. 2014;4(3):32–8. [Google Scholar]
18. Jadhav PV, Patil V, Gore S. A comparative study of linear regression and regression tree. In: 2nd International Conference on Communication & Information Processing (ICCIP), 2020; India. doi:10.2139/ssrn.3645883. [Google Scholar] [CrossRef]
19. Jadhav PV, Patil V, Gore S. Classification of categorical outcome variable based on logistic regression and tree algorithm. Int J Recent Technol Eng. 2020;8(5):4685–90. doi:10.35940/ijrte.E6844.018520. [Google Scholar] [CrossRef]
20. Usman A, Rafiq M, Saeed M, Nauman A, Almqvist A, Liwicki M. Machine learning computational fluid dynamics. In: 2021 Swedish Artificial Intelligence Society Workshop (SAIS), 2021; Sweden. p. 1–4. doi:10.1109/SAIS53221.2021.9483997. [Google Scholar] [CrossRef]
21. Meng Y, Yan L, Huang W, Chen J, Jie L. Coupled investigation on drag reduction and thermal protection mechanism of a double-cone missile by the combined spike and multi-jet. Aerospace Sci Technol. 2021;115(1):150–65. doi:10.1016/j.ast.2021.106840. [Google Scholar] [CrossRef]
22. Kanaani OO, Yagoub SAM, Habib S, Aulia A, Hasiholan B. Prediction of gas coning in hydrocarbon reservoir using the navigator. Progr Energy Environ. 2021;1(18):1–22. doi:10.37934/progee.18.1.122. [Google Scholar] [CrossRef]
23. Mahfouz MY, Molins C, Trubat P, Hernández S, Vigara F. Response of the IEA Wind 15 MW–WindCrete and Activefloat floating wind turbines to wind and second-order waves. Wind Energy Sci. 2021;1–24. doi:10.5194/wes-6-867-2021. [Google Scholar] [CrossRef]
24. Nazer M, Rostam MFH, Eh Noum SY, Hajibeigy MT, Shameli K. Performance analysis of photovoltaic passive heat storage system with microencapsulated paraffin wax for a thermoelectric generation. J Res Nanosci Nanotechnol. 2021;1:75–90. doi:10.37934/jrnn.1.1.7590. [Google Scholar] [CrossRef]
25. Subbulakshmi A, Verma M, Keerthana M, Sasmal S, Harikrishna P, Kapuria S. Recent advances in experimental and numerical methods for dynamic analysis of floating offshore wind turbines—an integrated review. Renew Sustain Energ Rev. 2022;164:112–525. doi:10.1016/j.rser.2022.112525. [Google Scholar] [CrossRef]
26. Faraggiana E, Giorgi G, Sirigu M, Ghigo A, Bracco G, Mattiazzo G. A review of numerical modelling and optimisation of the floating support structure for offshore wind turbines. J Ocean Eng Mar Energy. 2022;8(3):433–456. doi:10.1007/s40722-022-00241-2. [Google Scholar] [CrossRef]
27. Xu S, Xue Y, Zhao W, Wan D. A review of high-fidelity computational fluid dynamics for floating offshore wind turbines. J Mar Sci Eng. 2022;(10):13–57. doi:10.3390/jmse10101357. [Google Scholar] [CrossRef]
28. Mirzaei M, Clausen S, Wu H, Zakrzewski S, Nakhaei M, Zhou H, et al. CFD simulation and experimental validation of multiphase flow in industrial cyclone preheaters. Chem Eng J. 2023;465:142757. doi:10.1016/j.cej.2023.142757. [Google Scholar] [CrossRef]
29. Cato AS, Volpiani PS, Mons V, Marquet O, Sipp D. Comparison of different data-assimilation approaches to augment RANS turbulence models. Comput Fluids. 2023;266:106054. doi:10.1016/j.compfluid.2023.106054. [Google Scholar] [CrossRef]
30. Kalimuthu R, Mehta RC, Rathakrishnan E. Measured aerodynamic coefficients of without and with spiked blunt body at Mach 6. Adv Aircr Spacecr Sci. 2019;6(3):225–38. doi:10.12989/aas.2019.6.3.225. [Google Scholar] [CrossRef]
31. Zuhair MAB, Mohammed A. Trailing edge geometry effect on the aerodynamics of low-speed BWB aerial vehicles. Adv Aircr Spacecr Sci. 2019;6(4):283. doi:10.12989/aas.2019.6.4.283. [Google Scholar] [CrossRef]
32. Shaikh JS, Kumar K, Pathan KA, Khan SA. Analytical and computational analysis of pressure at the nose of a 2D wedge in high-speed flow. Adv Aircr Spacecr Sci. 2022;9(2):119–30. doi:10.12989/aas.2022.9.2.119. [Google Scholar] [CrossRef]
33. Azami MH, Faheem M, Aabid A, Mokashi I, Khan SA. Experimental research of wall pressure distribution and effect of the microjet at Mach 1.5. Int J Recent Technol Eng. 2019;8(3):1000–3. doi:10.35940/ijrte.B1187.0782S319. [Google Scholar] [CrossRef]
34. Elfaghi AMA, Alhadi A, Munir FAA, Abdoulhdi ABO. CFD simulation of forced convection heat transfer enhancement in pipe using Al2O3/water nanofluid. J Adv Res Num Heat Transfer. 2022;8(1):44–9. doi:10.37934/cfdl.14.9.118124. [Google Scholar] [CrossRef]
35. Roache PJ. Perspective: a method for uniform reporting of grid refinement studies. J Fluids Eng. 1994;116:405–13. doi:10.1115/1.2910291. [Google Scholar] [CrossRef]
36. Hefny MM, Ooka R. CFD analysis of pollutant dispersion around buildings effect of cell geometry. Build Environ. 2009;44(8):1699–706. doi:10.1016/j.buildenv.2008.11.010. [Google Scholar] [CrossRef]
Cite This Article
 Copyright © 2024 The Author(s). Published by Tech Science Press.
This work is licensed under a Creative Commons Attribution 4.0 International License , which permits unrestricted use, distribution, and reproduction in any medium, provided the original work is properly cited.
 Downloads
 Citation Tools