
 Submit a Paper
 Propose a Special lssue
 Open Access
ARTICLE

Transient Experiments on a Prototype Pump with an Atypical Open Impeller for Different Discharge Valve Openings
1 School of Mechanical Engineering, Hunan University of Technology, Zhuzhou, 412007, China
2 College of Mechanical Engineering, Quzhou University, Quzhou, 324000, China
3 Quzhou Academy of Metrology and Quality Inspection, Quzhou, 324024, China
4 The Zhejiang Provincial Key Lab of Fluid Transmission Technology, Zhejiang Sci-Tech University, Hangzhou, 310018, China
5 Zhuzhou Nanfang Valve Co., Ltd., Zhuzhou, 412000, China
* Corresponding Author: Lianghuai Tong. Email:
Fluid Dynamics & Materials Processing 2024, 20(10), 2251-2264. https://doi.org/10.32604/fdmp.2024.050997
Received 24 February 2024; Accepted 20 May 2024; Issue published 23 September 2024
 View Full Text
 Download PDF
Abstract
In order to obtain the transient characteristics of a low-speed centrifugal pump during the start-up and shutdown stages, dedicated experimental tests were conducted with eight different valve opening conditions. The Pearson correlation coefficient was used to reveal the linear correlation between variables. According to the results, the stable rotational speed decreases with increasing valve opening (rotational speed decreases from approximately 1472 to 1453 r/min), while the stable shaft power exhibits an increasing trend (shaft power increases from approximately 0.242 to 0.390 kW). The stable time and zeroing time of each parameter during start-up and shutdown processes vary, with the flow zeroing time significantly increasing with the relative flow, reaching up to 10.468 s, while the shaft power zeroing time is roughly between 1.219 and 1.375 s. The results demonstrate that with increasing valve opening, the stable and zeroing time of flow significantly increase (|r| greater than 0.95), while the stable and zeroing time of rotational speed, power, and head display a smaller sensitivity on the valve opening (|r| less than 0.6).Keywords
Nomenclature
| Q/Qr | Relative flow rate |
| | Stable value of rotational speed |
| | Stable value of flow rate |
| | Stable value of head |
| | Stable value of shaft power |
| nt1 | Stable time of rotational speed |
| Qt1 | Stable time of flow rate |
| Ht1 | Stable time of head |
| Pt1 | Stable time of shaft power |
| nt0 | Time for rotational speed to return to zero |
| Qt0 | Time for flow rate to return to zero |
| Ht0 | Time for head to return to zero |
| Pt0 | Time for shaft power to return to zero |
| X, Y | Variable observations |
| r | Correlation coefficient |
| er | Relative Error |
The low specific speed centrifugal pump, characterized by its relatively low rotational speed not exceeding 3000 r/min, offers enhanced efficiency, extended service life, and reduced noise levels compared to traditional high-speed centrifugal pumps. It finds common application in sewage treatment, irrigation systems, and industrial processes, handling high flow rates and low pressures. While centrifugal pumps typically operate under stable conditions, start-up and shutdown transitions entail rapid and significant changes in performance parameters, leading to transient flow conditions within the pump. These transient conditions may induce instabilities such as backflow, secondary flow, separation, and vortex formation, heightening flow instability and potentially causing equipment damage. Thus, a comprehensive understanding of centrifugal pump hydraulic performance during start-up and shutdown transitions is imperative for bolstering system operational reliability.
In recent years, numerous scholars have researched the start-up and shutdown processes of centrifugal pumps. Among them, Zheng et al. analyzed strong transient mechanisms observed during the rapid start-up process of an axial flow water-jet pump through numerical and experimental analysis, elucidating the relationship between the transition zone and transient effects [1]. Ahmed et al. extended the study to reciprocating pumps, investigating the transient and steady-state characteristics during their rapid start-up and shutdown processes [2]. Jin et al. focused on the transient simulation of the pump mode start-up process of reversible pump-turbines [3]. In addition, Das et al. examined transient phenomena during the start-up process of a pump-fed liquid rocket engine through numerical simulations [4]. Uhlmann et al. proposed enhanced control strategies to investigate the start-up and shutdown behavior of residential heat pumps [5]. Rezghi et al. conducted a numerical study on the sensitivity analysis of the hydraulic transients of two parallel pump-turbine units operating under runaway conditions [6]. Dehghan et al. conducted numerical and experimental studies on the long-term transient response of a single-effect ammonia-water absorption heat pump prototype [7]. Wang et al. simulated the transient shutdown process of pump-turbine guide vanes in a pumped-storage hydropower plant [8]. Pagaimo et al. assessed the reliability of two pumps in series acting as turbines under transient off-grid conditions, showing that a change in the first pump, acting as the turbine set, significantly impacts the dynamics of the other set [9]. Kan et al. established an accurate prediction model considering air-water interaction, providing a foundation for further research on predicting transient characteristics in pump stations [10]. Fu et al. studied the transient characteristics of axial flow pumps during the start-up process using experimental and numerical methods to explore the impact load and instantaneous fluid pressure of transient flow on pump station systems under non-standard operating conditions [11]. Nenkaew et al. conducted experimental research on the transient characteristics of cascaded heat pump systems [12]. Tian et al. conducted research on the transitional stages of flow field and head of an electric pump in hybrid rocket engine start-up processes from numerical and experimental perspectives, analyzing the influence of pipeline length on the flow field and head [13]. Chalghoum et al. carried out theoretical analysis on the transient flow inside centrifugal pumps based on unstable and incompressible fluid equations, particularly focusing on impeller analysis during the start-up stage [14]. Elaoud et al. numerically simulated and modeled the transient flow caused by centrifugal pump start-up in cylindrical pipes, investigating the impact of pump start-up time on transient flow in pipes [15]. Additionally, there have been simulation analyses of the energy characteristics of the flow field during the transition of water pump-turbine system shutdown, including the research by Li et al. [16]. Kim et al. analyzed the transient characteristics of chemical adsorption heat pumps during multiple iteration runs based on simulation and experimental results. They obtained results with similar temperature and pressure values and trends [17]. Behroozi et al. studied transient behavior and water hammer phenomenon in pipelines caused by rapid changes in the operation of parallel pump groups [18]. Their results showed that the transient characteristics of the system depend entirely on the shutdown and start-up modes of the parallel pump groups. Duplaa et al. demonstrated that under different stable flow conditions, the larger the flow rate during the start-up of a low-specific-speed centrifugal pump, the more severe the pressure oscillation and cavitation phenomena at the impeller inlet [19]. Ossai developed a new technique to determine the activation time of the pump-off event for Progressive Cavity Pumps (PCPs) using transient drainage rates from coalbed methane wells [20]. Roeder et al. proposed a mathematical framework for simulating the transient response of a small-capacity ammonia-water absorption heat pump desorption tower [21]. O’Reilly et al. performed transient analysis of pressure and rate generated by a new approach to cyclic pump-off controllers [22]. Liu et al. discussed the cavitation evolution and pressure pulsation characteristics of centrifugal pumps during the start-up process [23]. Fu et al. studied the synchronous closing process of water pump guide vanes and ball valves after power failure through numerical simulations and experiments [24]. Liang et al. analyzed the influence of viscosity on the transient behavior during the start-up and shutdown stages of centrifugal pumps [25]. Namazizadeh et al. presented a comprehensive study on the optimization of centrifugal pump impellers, proposing an optimization scheme that involves adding splitter blades and modifying their geometrical shapes through a combined approach of experimental testing and numerical simulations [26]. Kan et al. conducted large eddy simulations of centrifugal pump water flow, analyzed the turbulent statistical characteristics and flow structures under different flow conditions, and obtained clear research results [27].
In recent years, many scholars have conducted research on the start-up and shutdown processes of centrifugal pumps. Through numerical simulations and experimental analysis, they have revealed the transient and steady-state characteristics during rapid start-up and shutdown processes of different types of pumps. The research covers various fields, including axial flow water-jet pumps, reciprocating pumps, reversible pump-turbines, residential heat pumps, and pump-turbines. The findings of these studies are of great theoretical and practical significance for optimizing control strategies of pump start-up and shutdown, improving system efficiency, and enhancing operational stability.
In this paper, to investigate the start-up and shutdown characteristics of a low specific speed centrifugal pump, external characteristic experiments were conducted during start-up and shutdown processes at different valve openings on a transient performance testing rig. Time-related characteristic variables were extracted, and their specific values were measured. The Pearson correlation coefficient was then used to reveal the linear correlation between the variables.
2 Experimental Setup and Model Pump
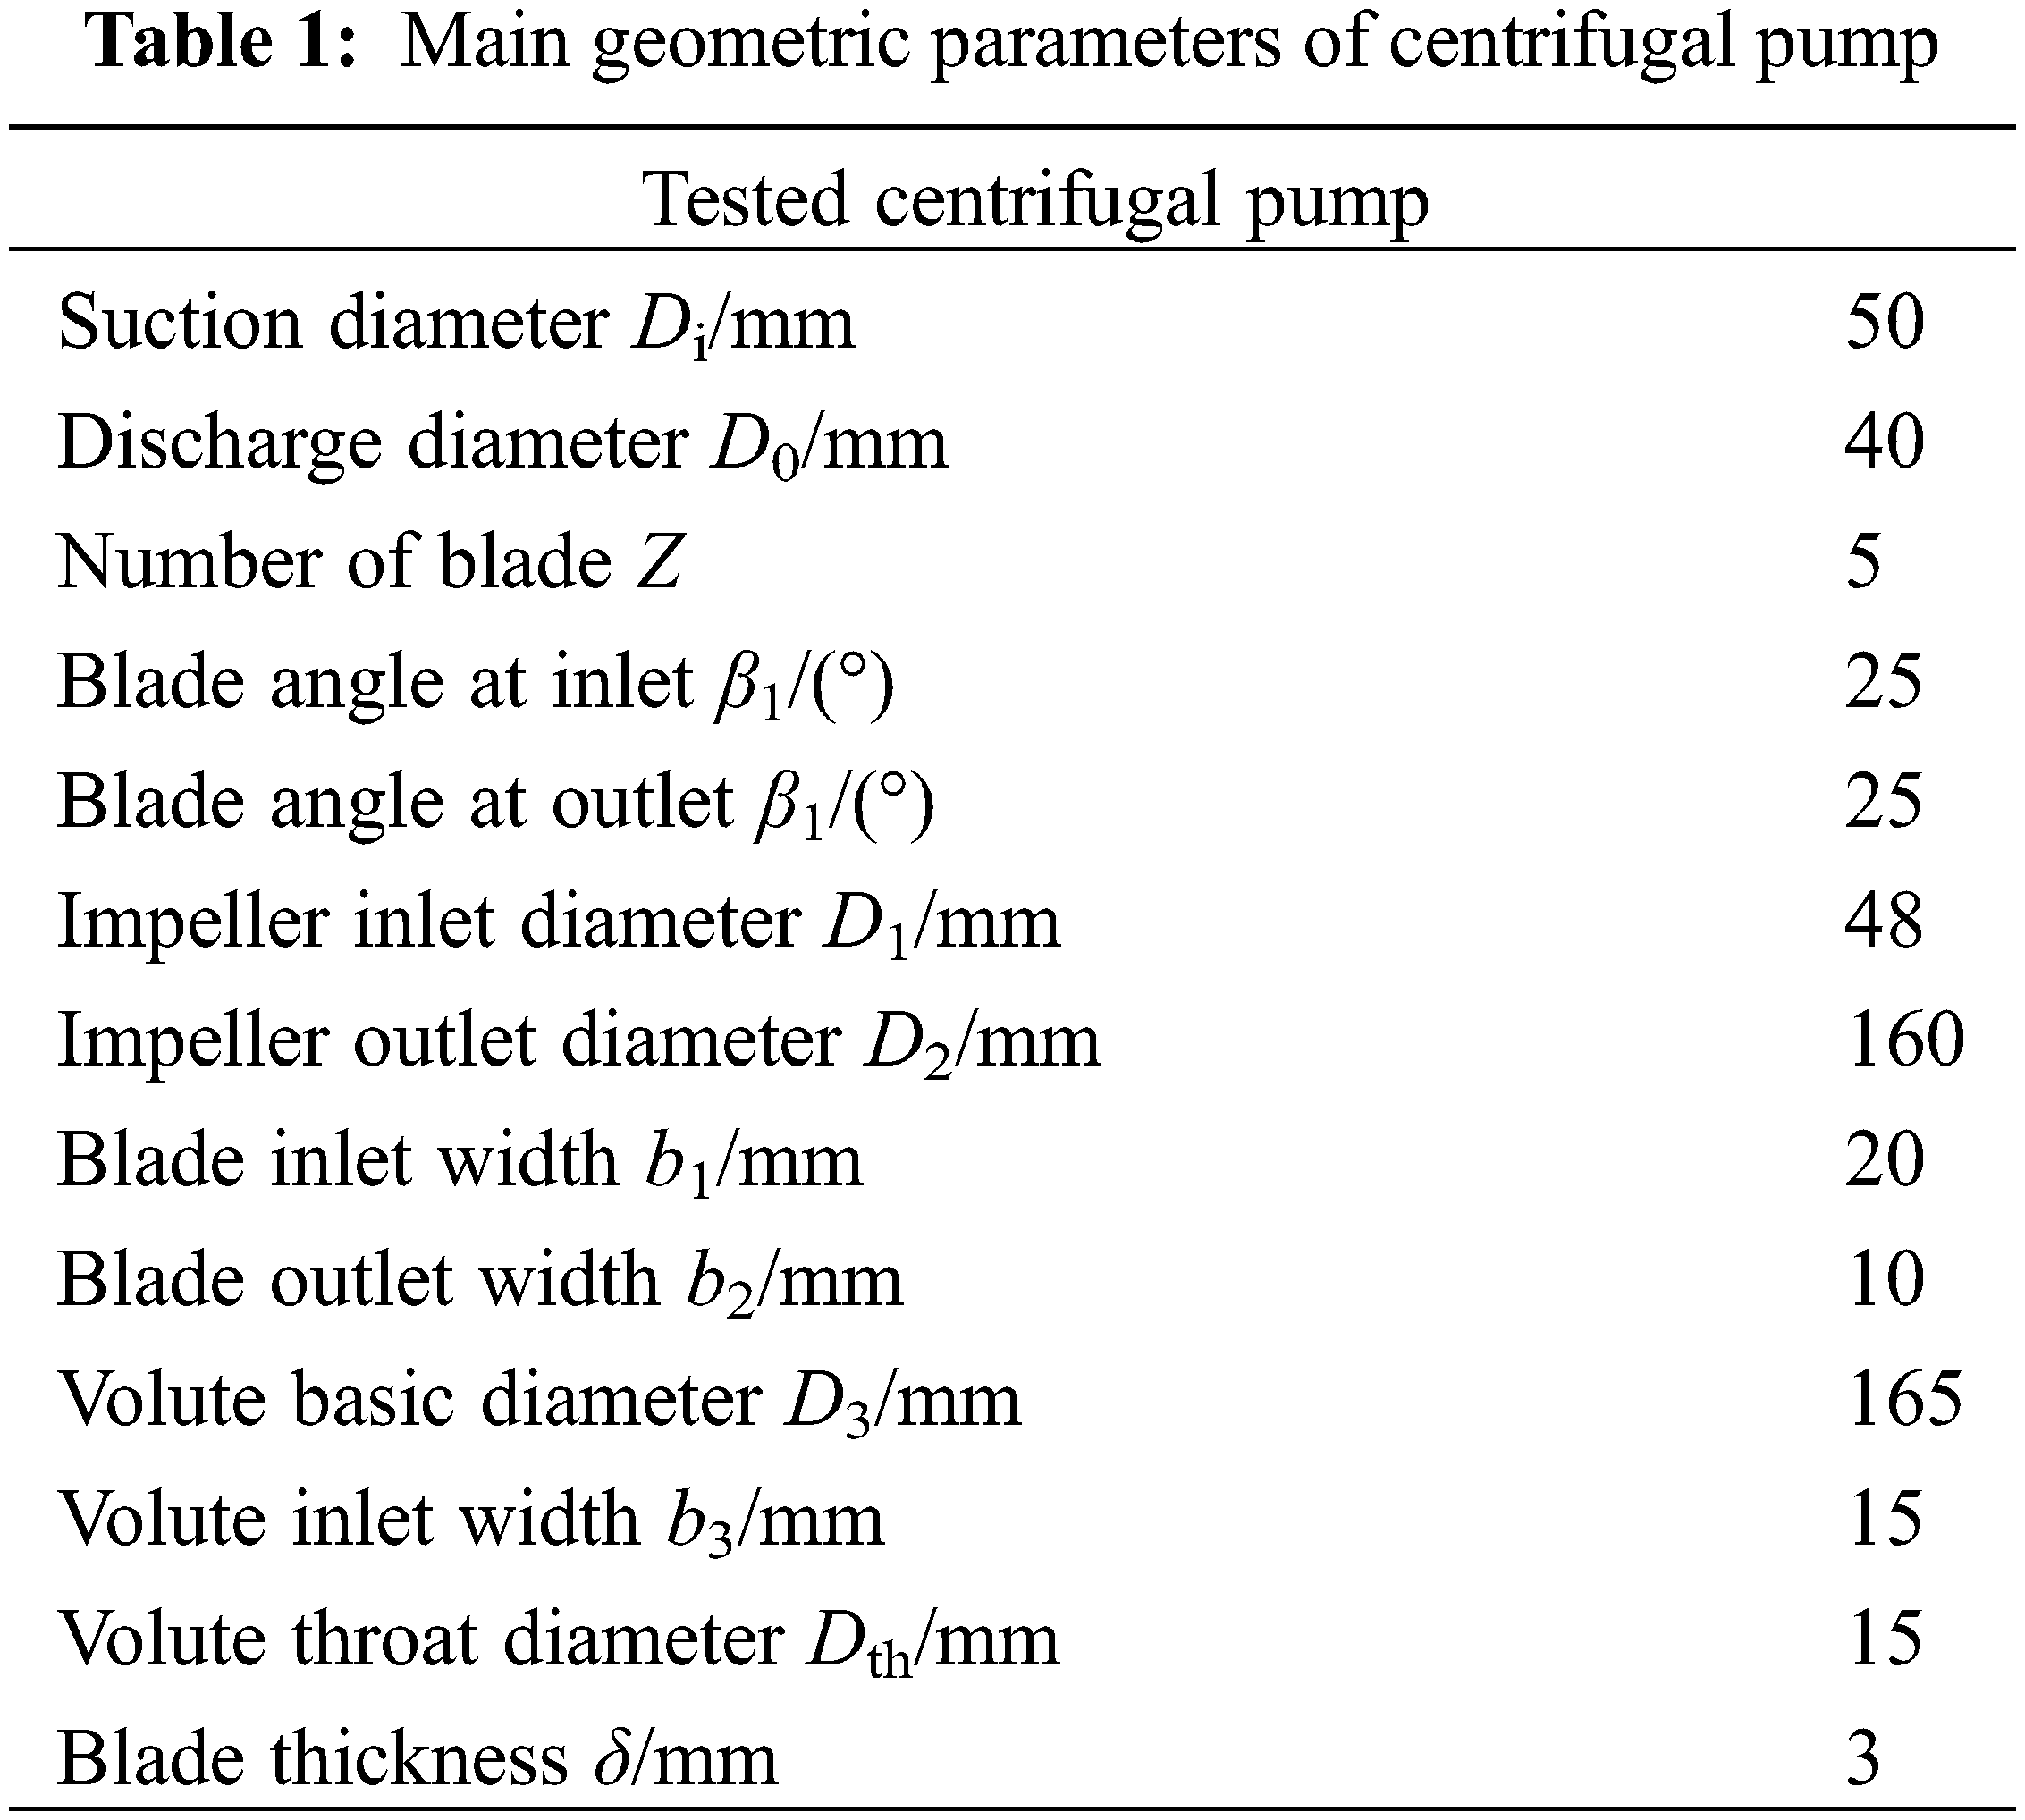
The model pump used in the experiment is a low specific speed open impeller centrifugal pump with a specific speed of ns = 45. The design parameters are: flow rate Qr = 6 m3/h, head H = 8 m, and speed n = 1450 r/min. The main geometric parameters of the centrifugal pump are shown in Table 1.
As shown in Fig. 1, blade profile is in the form of a double arc cylinder, and the variation in the size of the volute follows an Archimedean spiral curve. The clearance between the blade tip and the volute is 1.2 mm.
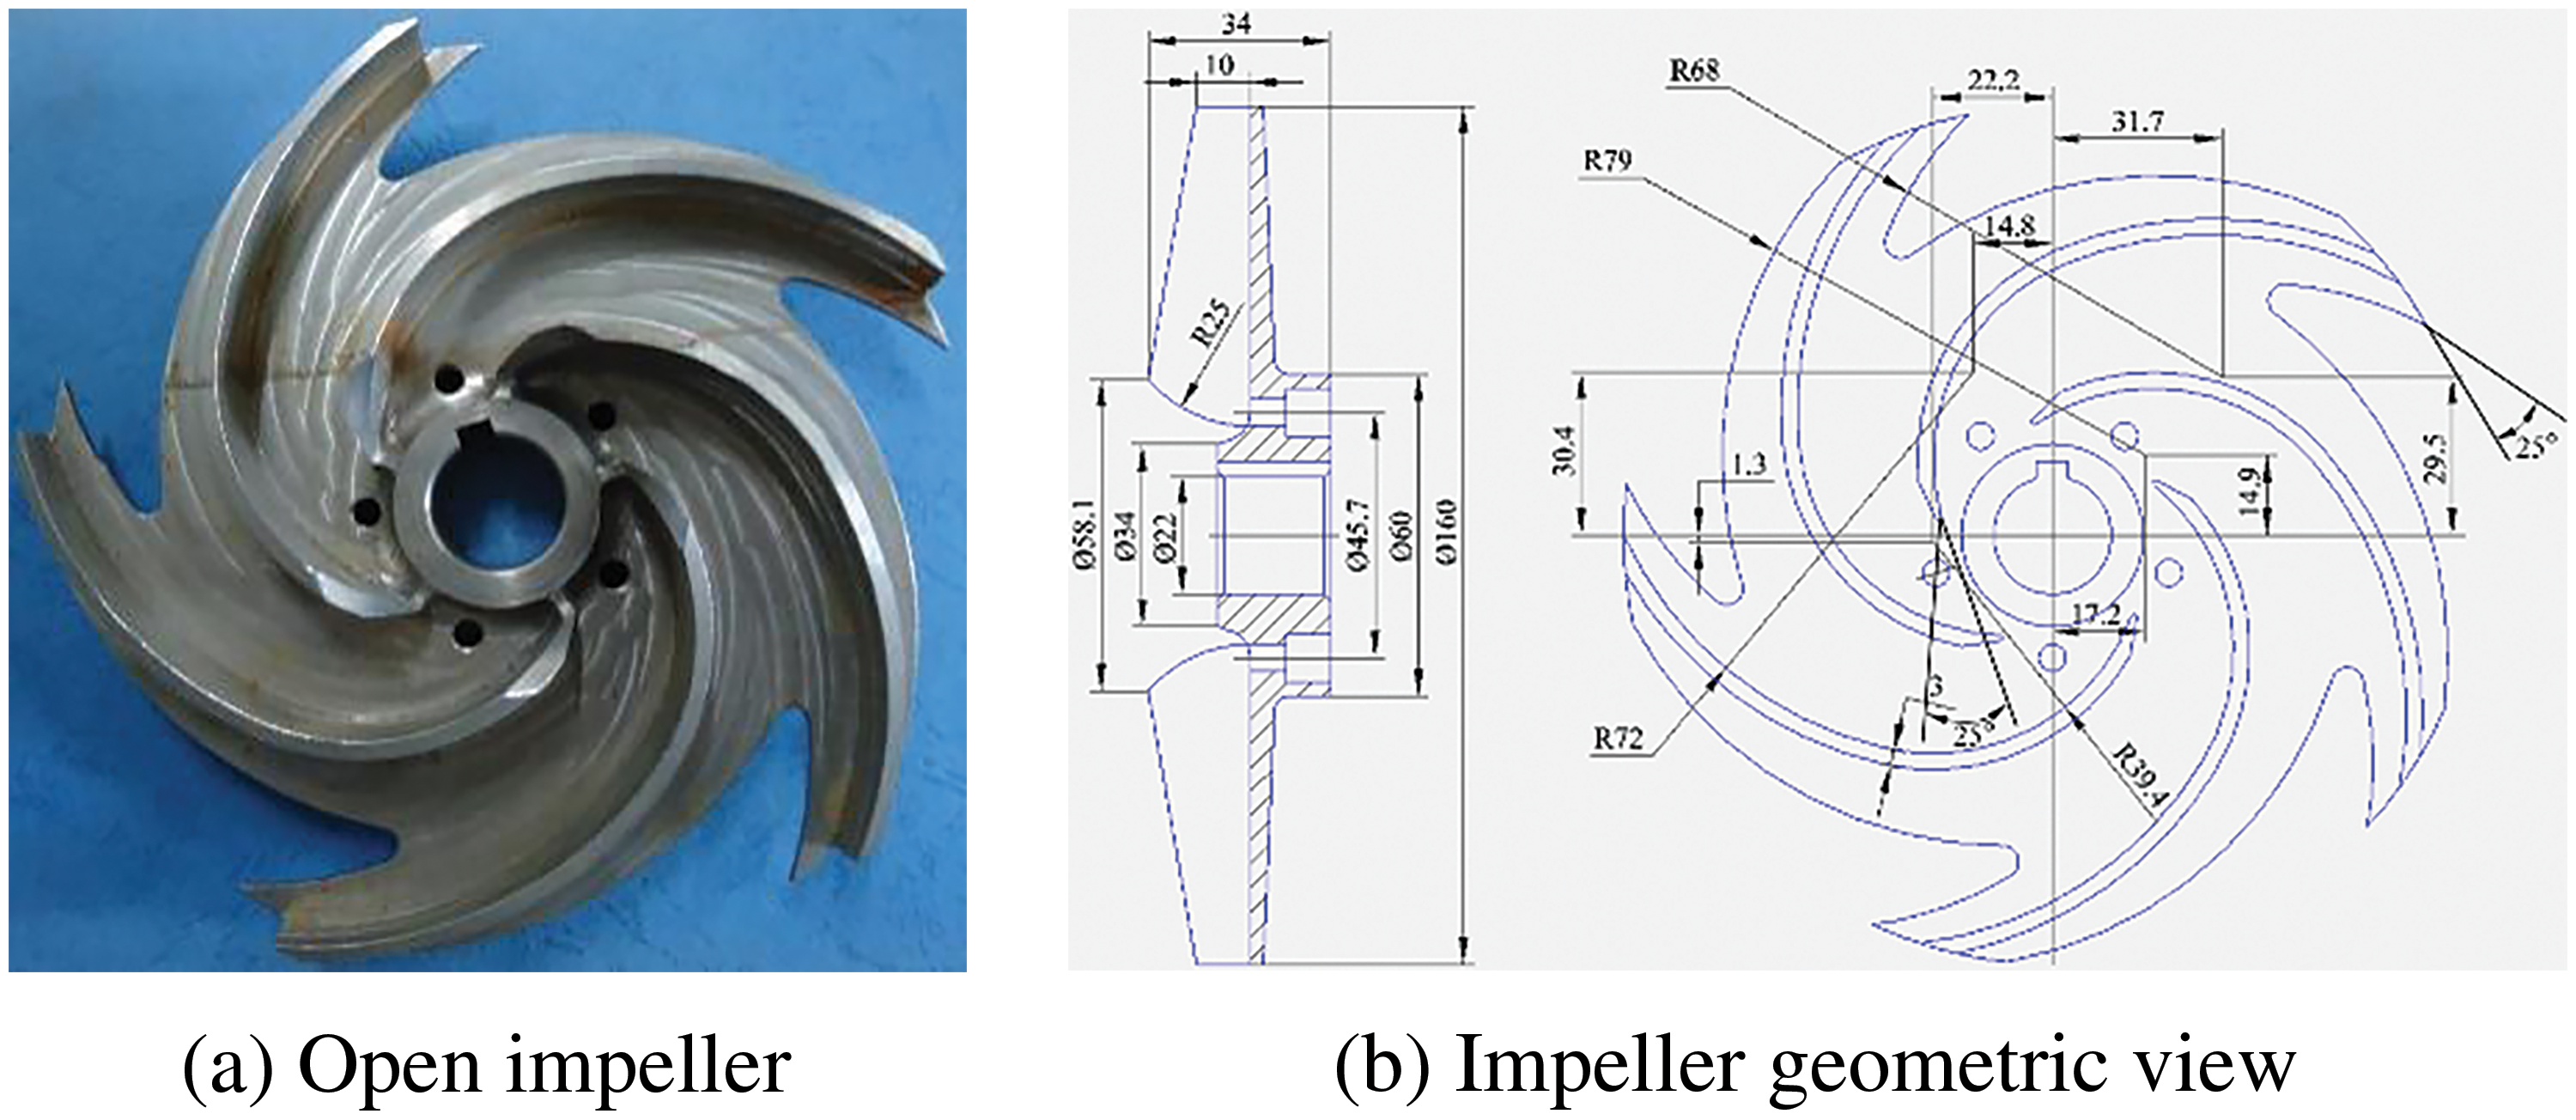
Figure 1: Impeller structure
Fig. 2 illustrates the experimental system of the centrifugal pump, which mainly consists of a water tank, pump unit, testing system, and circulation pipeline. The pump test setup is shown in Fig. 3, where the driving device of the test pump is an 80M2-4 three-phase asynchronous AC (Alternating Current) motor produced by Hangzhou Lijiang Electromechanical Equipment Co., Ltd. (China) with a rated power of 750 W. A JC0 torque-speed sensor produced by Hunan Xiangyi Power Testing Instruments Co., Ltd. (China) is installed between the test pump and the electric motor to measure instantaneous speed and torque, with a measurement range of 0~5 N·m, accuracy grade of 0.2, signal sampling time of 1 ms, and uncertainties of ±0.25% for both speed and torque. An OPTIFLUX2100C electromagnetic flowmeter produced by Guanghua Aimeite Instrument Co., Ltd. (Shanghai, China). is used to achieve instantaneous flow rate measurement, with a range of 0~30 m3/h, accuracy level of 0.5, flow rate measurement uncertainty of ±0.2%, and signal acquisition frequency of 1 kHz at full scale, up to 5 kHz maximum. WIKA S-10 pressure transmitters produced by WIKA (Frankfurt, Germany) are employed to measure instantaneous pressure at the inlet and outlet of the pump. The pressure sensors have ranges of −1~1 and 0~1.6 MPa, measuring accuracy less than 0.25%, and pressure testing uncertainties of ±0.1%. The pressure signal response time is less than 1 ms. The output signals of all physical quantities are 4~20 mA current signals, and data acquisition and processing are performed by the PCI8361BN data acquisition card. A frequency converter is added to control the speed increase of the motor by adjusting the input current. Two sets of three-jaw couplings are used to connect the motor and the torque-speed sensor, as well as the torque-speed sensor and the centrifugal pump under test. Each coupling is equipped with rubber elastic elements to ensure smooth operation at start-up without impact.
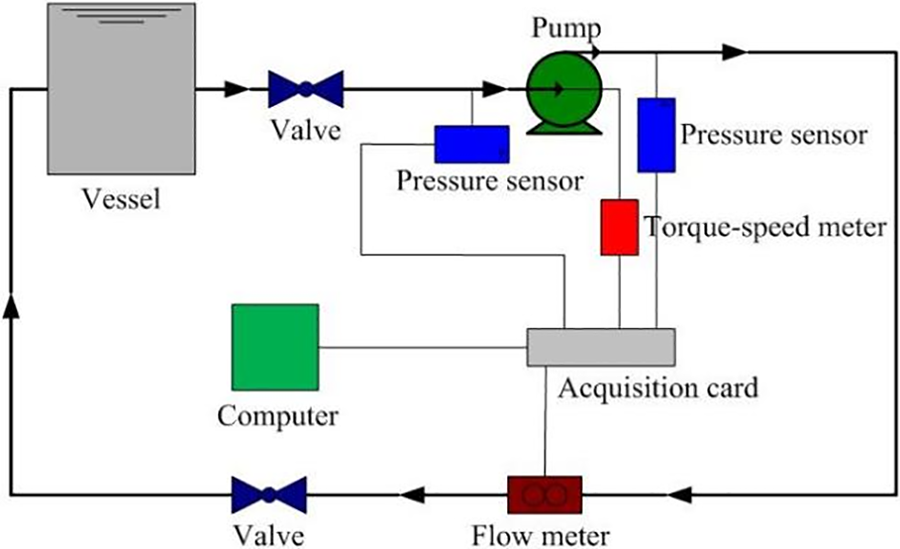
Figure 2: Centrifugal pump experimental system schematic
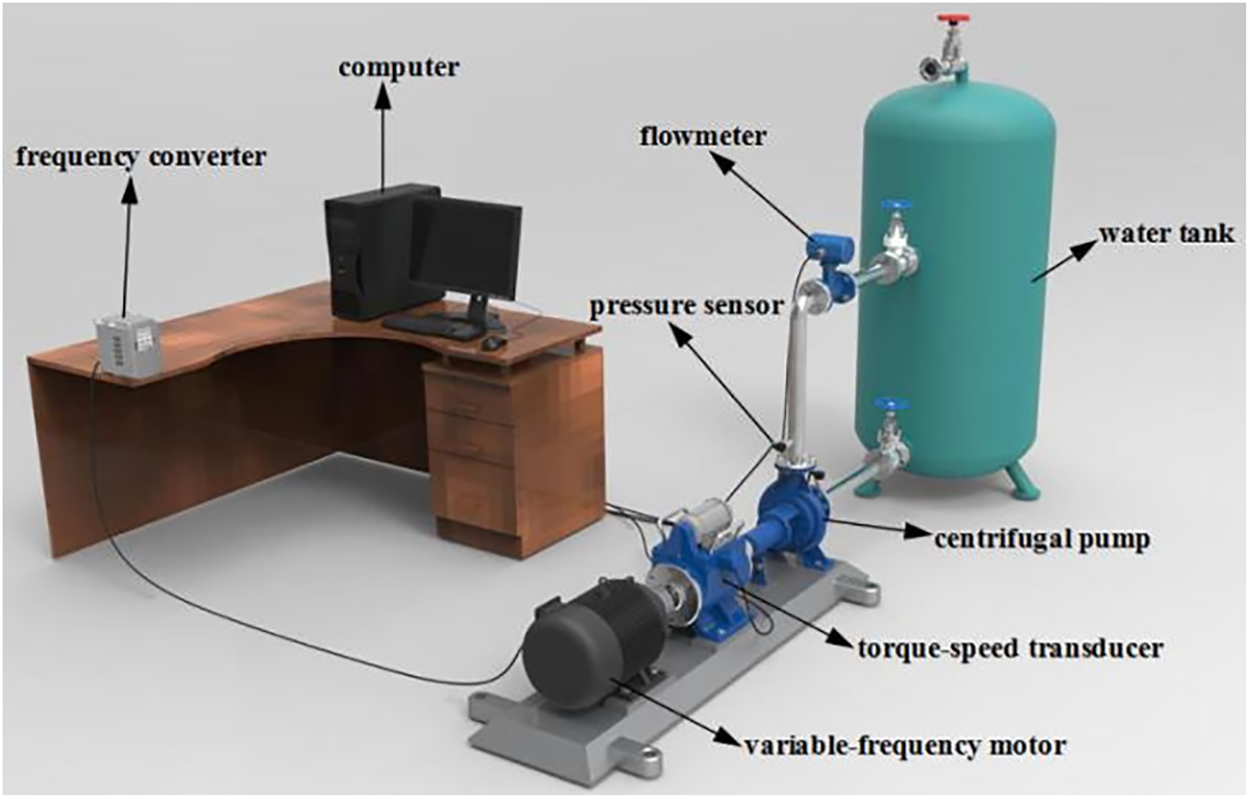
Figure 3: Centrifugal pump experimental system model diagram
3 Experimental Results and Analysis
The variation in impeller speed, flow rate, head, and shaft power performance parameters during the start-up transient condition under different outlet relative flow rates are depicted in Fig. 4.
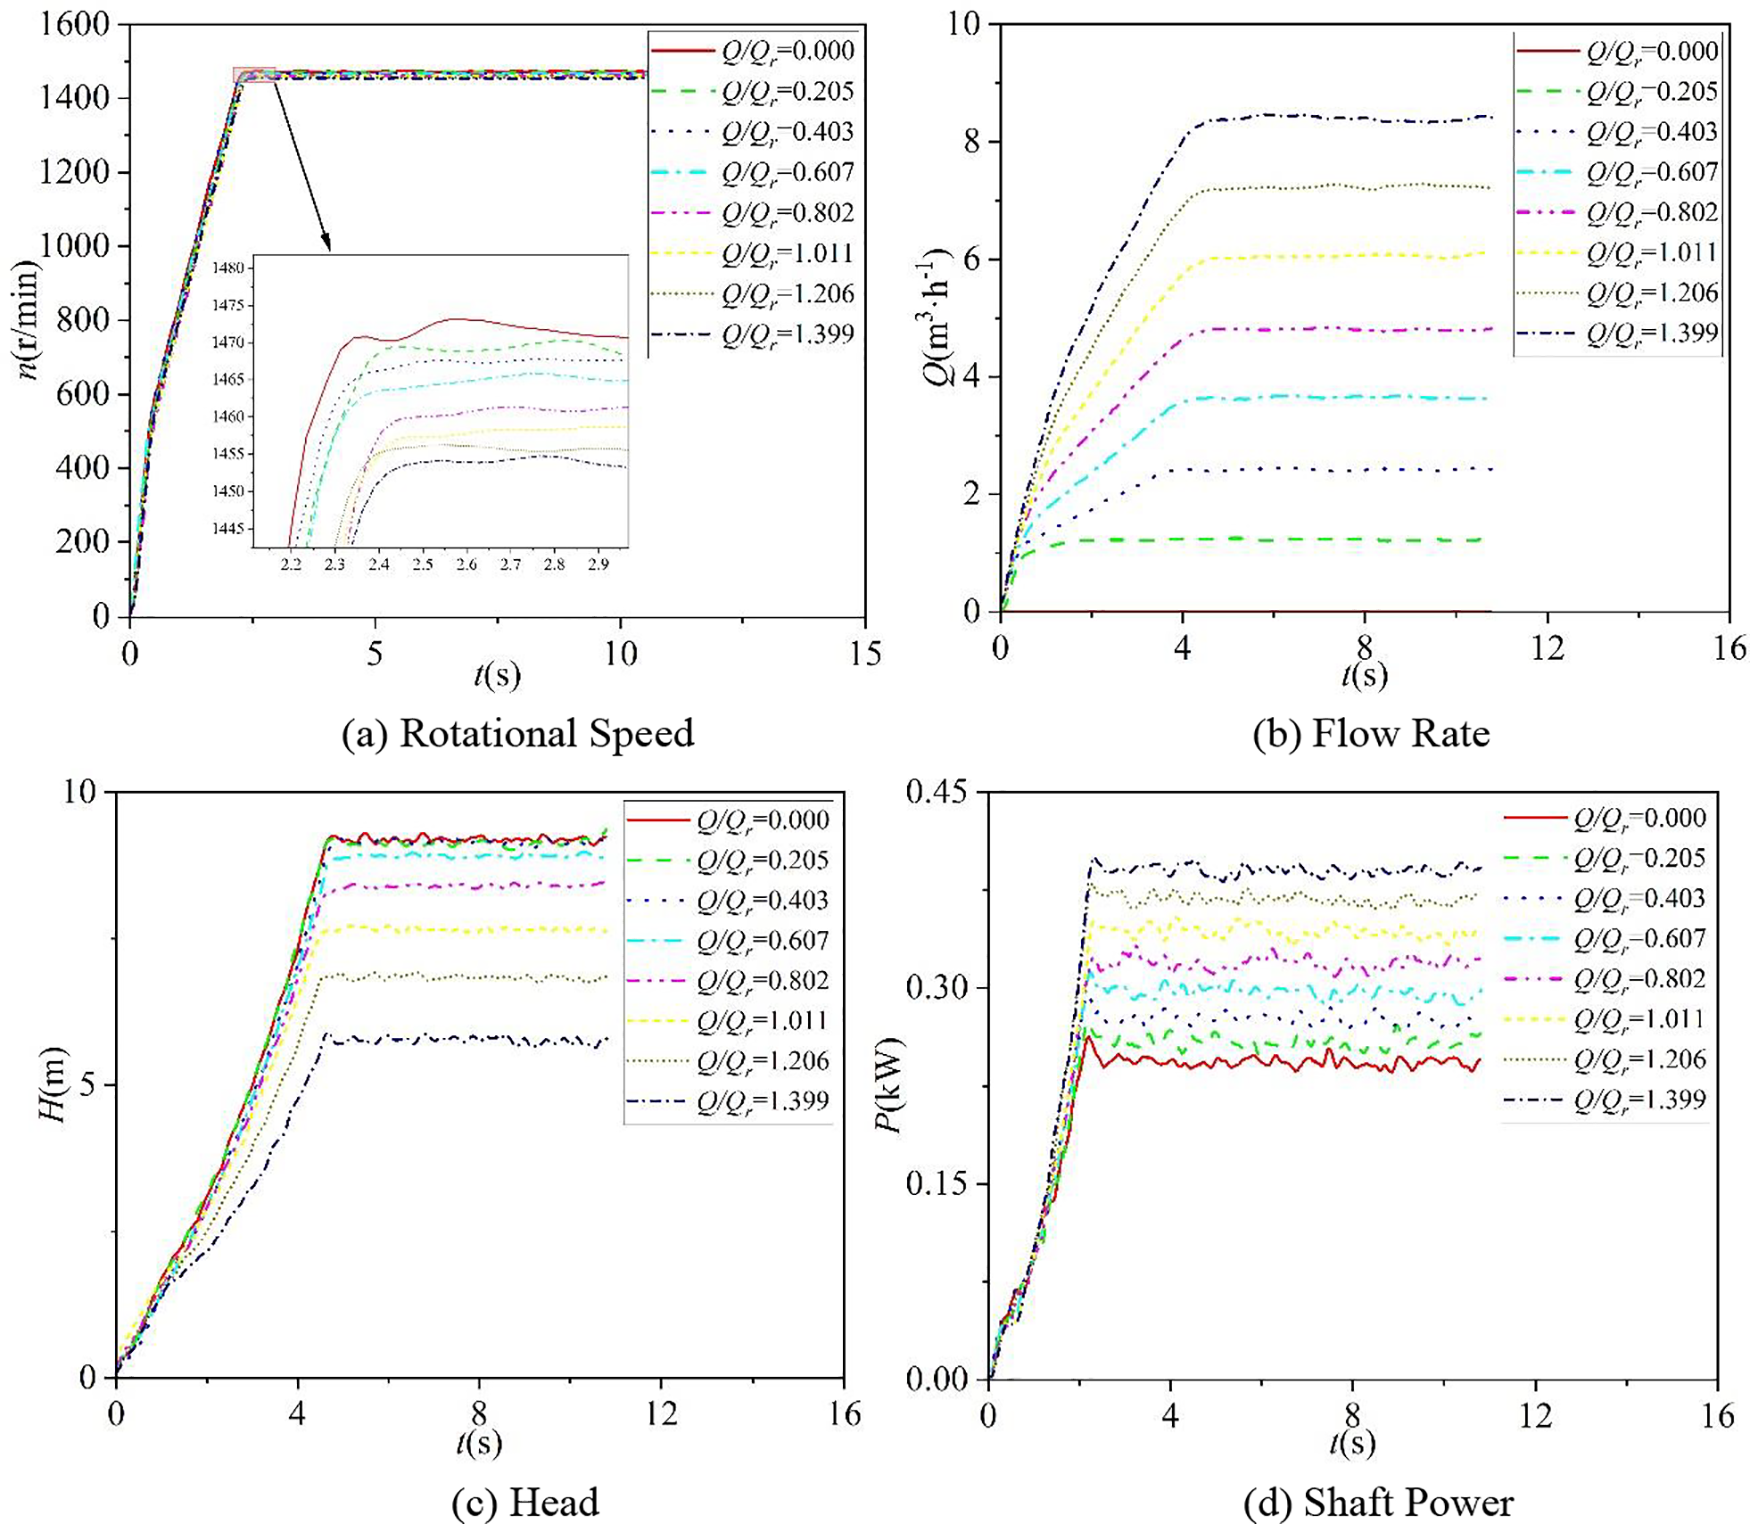
Figure 4: Experimental results of external characteristics during start-up process
For centrifugal pumps operating at a constant speed, the shaft power increases with the relative flow rate, resulting in a rise in torque on the motor’s output shaft. Theoretically, this would impact the speed rise characteristics during the motor’s start-up phase. However, experimental results from eight different start-up scenarios indicate minimal variation in speed rise patterns, with all reaching their respective stable speed values within a time range of 2.2 to 2.45 s. Notably, the highest stable speed value after start-up occurs at a relative flow rate of Q/Qr = 0.0, approximately 1472 rpm, while the lowest stable speed value occurs at a relative flow rate of Q/Qr = 1.399, approximately 1453 rpm. Furthermore, as the relative flow rate Q/Qr increases, the stable speed value after start-up decreases. This indicates that, for the current pump unit, the speed rise characteristics during start-up are primarily influenced by the instantaneous start-up characteristics of the motor itself, rather than heavily relying on the operating point of the pump.
It can be observed that, during a rapid increase in speed, the flow rate rises slowly in the initial stage of start-up, except when the relative flow rate Q/Qr = 0.205. After this initial slow rise, the flow rate increases rapidly, eventually stabilizing as the rate of increase slows down. The slow initial rise in flow rate during start-up is attributed to the stagnant water in the entire pipeline system before start-up.
The time it takes for the flow rate to reach its respective stable operating conditions when the relative flow rate is Q/Qr = 0.205, 0.403, 0.607, 0.802, 1.011, 1.206, and 1.399 is approximately 1.6, 3.9, 4.3, 4.5, 4.5, 4.6, and 4.5 s, respectively. It can be seen that, except for the case of a relative flow rate of Q/Qr = 0.205, rise time of flow rate significantly lags behind the speed rise process, and after a relative flow rate of Q/Qr = 0.607, the rise time of the flow rate exhibits a stable trend with the increase of relative flow rate. However, before a relative flow rate of 0.607, the rise time of the flow rate significantly increases with the increase of relative flow rate.
Under 8 different relative flow rate conditions, the final rise of head to its respective stable value is approximately 9.20, 9.12, 9.10, 8.90, 8.41, 7.66, 6.82, and 5.76 m, respectively, with a rise time ranging from 4.5 to 4.85 s. It can be observed that the pump model exhibits minimal occurrence of instability within the normal operating range, indicating high reliability and stability. Furthermore, the head gradually decreases as the relative flow rate increases.
Under eight different relative flow rate conditions, the shaft power eventually rises to its respective stable values of approximately 0.242, 0.257, 0.275, 0.295, 0.318, 0.341, 0.367, and 0.390 kW, with a rise time ranging from 2.2 to 2.5 s. It can be observed that the shaft power of the pump model increases approximately linearly. Except for the relative flow rates Q/Qr = 0.802 and 1.011, there is a phenomenon of shaft power impact before reaching the stable value. The corresponding maximum shaft power values are: 0.2686 kW (0.0), 0.2797 kW (0.205), 0.3000 kW (0.403), 0.3177 kW (0.607), 0.3865 kW (1.206), and 0.4043 kW (1.399). The power impact (difference between maximum shaft power and stable shaft power) is 0.0266 kW (0.0), 0.0227 kW (0.205), 0.0250 kW (0.403), 0.0227 kW (0.607), 0.0195 kW (1.206), and 0.0143 kW (1.399), respectively. Overall, as the relative flow rate increases, the power impact gradually decreases, and the moments when they reach their respective maximum values are all within the range of 2.2 to 2.5 s.
In summary, the entire start-up process of the centrifugal pump exhibits very significant transient behavior.
Fig. 5 displays the variations in impeller speed, flow rate, head, and shaft power performance parameters during transient shutdown conditions under various outlet relative flow rates.
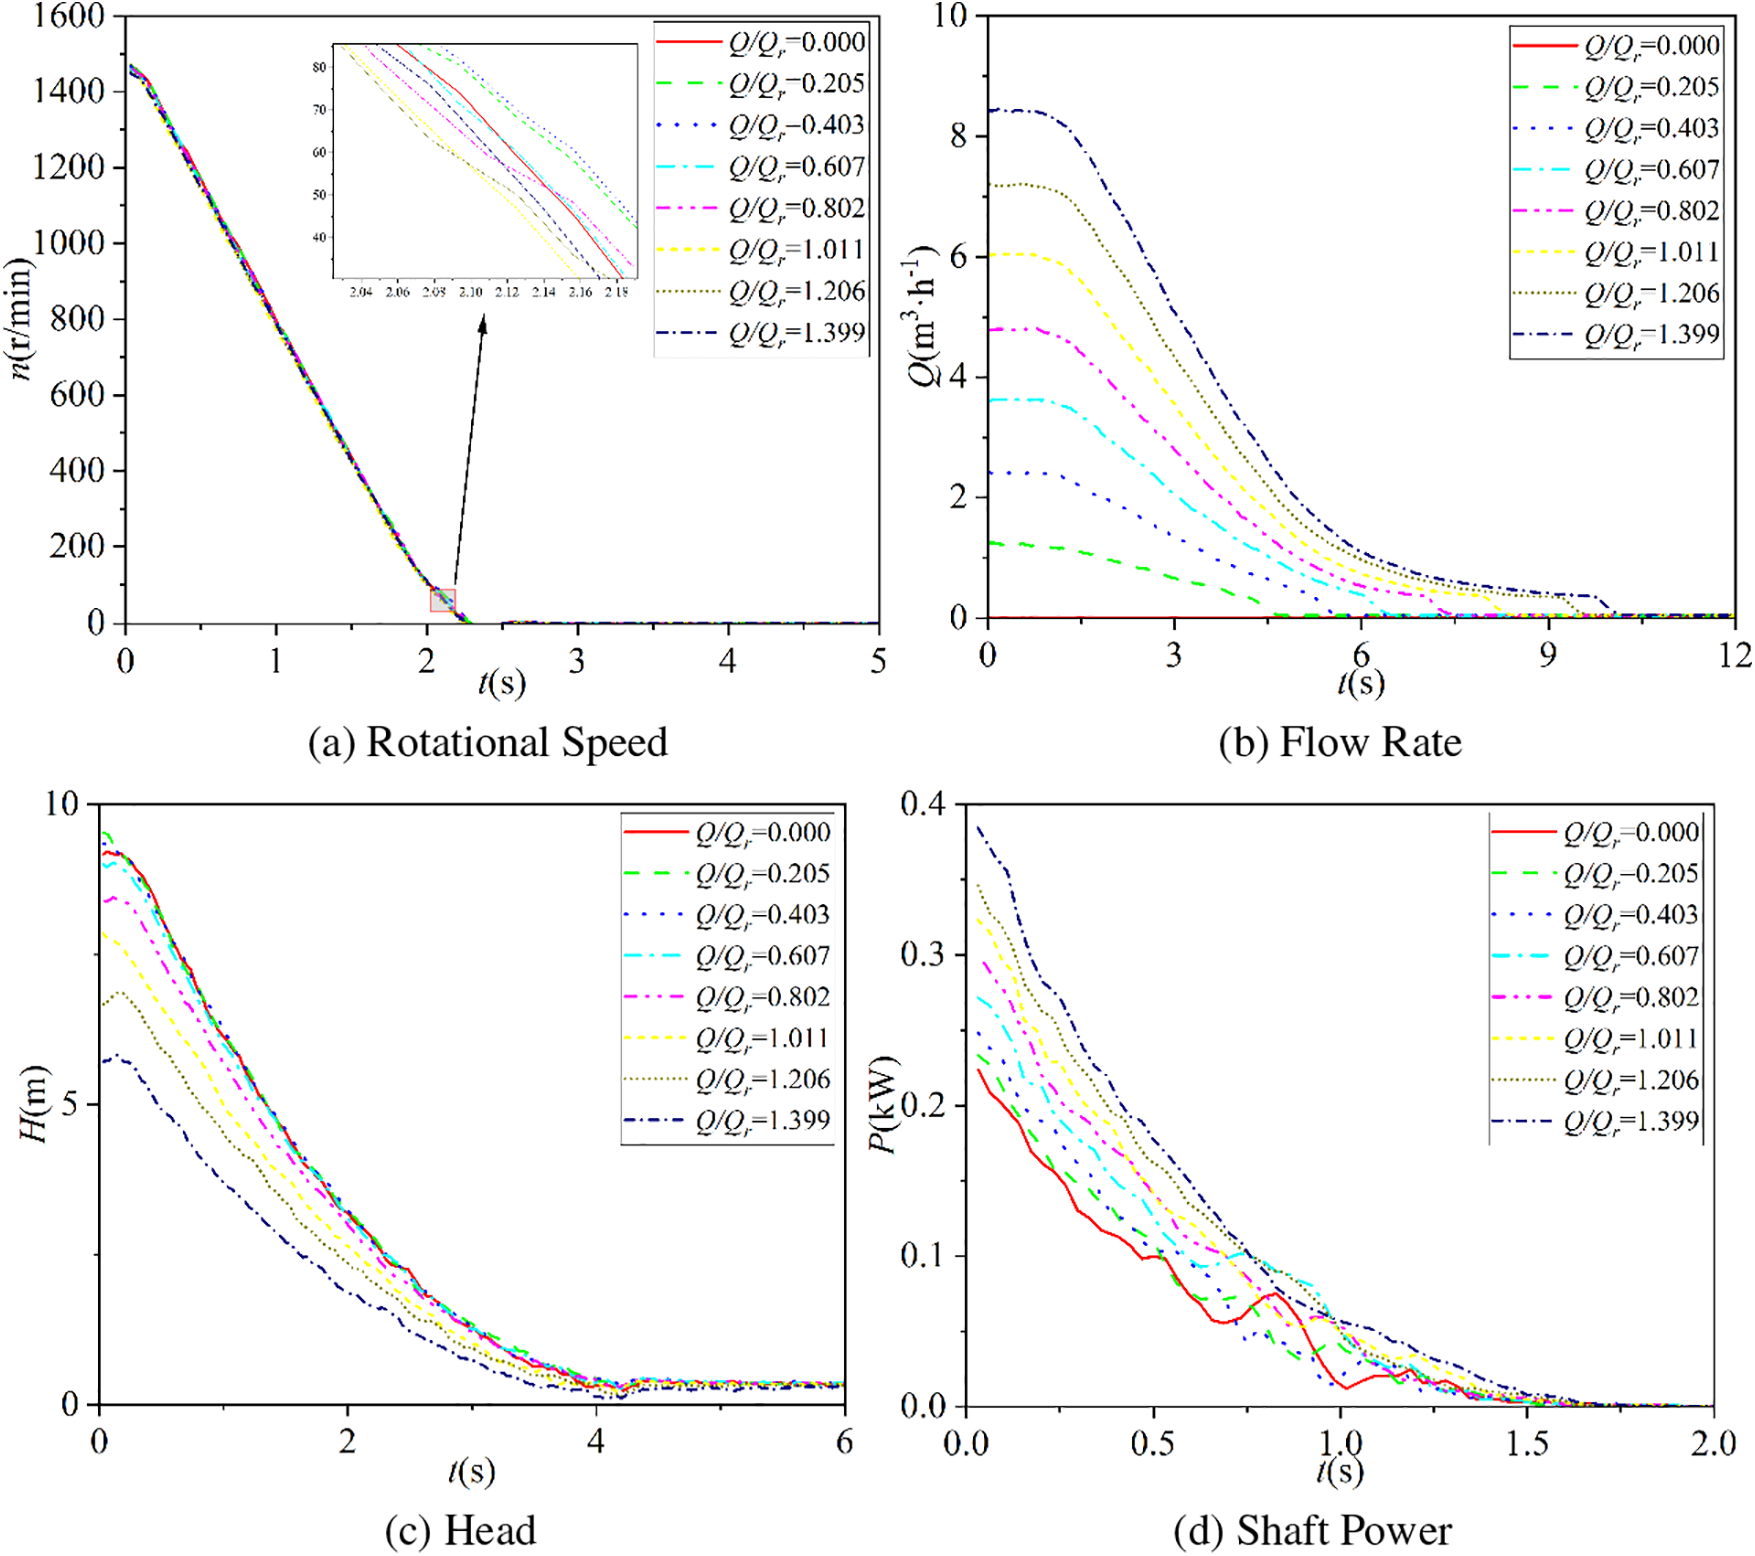
Figure 5: Experimental results of external characteristics during shutdown process
In centrifugal pumps operating at a constant rotational speed, the decrease in impeller speed during the shutdown process is relatively minor compared to its numerical value as the relative flow rate increases. The impeller speed decreases to zero after approximately 2.2 to 2.25 s, and the decreasing process remains consistent. This suggests that for this pump unit, the characteristic of impeller speed decrease during shutdown mainly depends on the instantaneous shutdown characteristic of the motor itself, rather than heavily relying on the operating point of the pump.
It can be observed that, except for the relative flow rates Q/Qr = 0.0 and 0.205, the flow rate does not immediately decrease at the beginning of the shutdown stage but rather begins to decrease slowly from the stable stage, then rapidly decreases, and finally decreases slowly again. The initial stability is due to the inertia of the flow in the entire pipeline system during shutdown. The moments when the flow rate reaches zero for relative flow rates Q/Qr = 0.205, 0.403, 0.607, 0.802, 1.011, 1.206, and 1.399 are approximately 4.64, 5.64, 6.53, 7.51, 8.51, 9.53, and 10.46 s, respectively.
Under the eight relative flow rate conditions, the head decreases to zero within a short period, approximately 3.8 to 4.1 s. The decrease in head does not seem to have a significant relationship with the relative flow rate.
Under the eight relative flow rate conditions, the shaft power consistently starts to decrease from the beginning of the shutdown stage, with a similar decrease time ranging from 1.1 to 1.4 s. This also indicates that there is no significant relationship between the decrease time of shaft power and the relative flow rate.
In conclusion, the variations in flow rate characteristics vary significantly under different relative flow rates, while the decrease characteristics of impeller speed, head, and shaft power are very similar.
3.3 Parameter Correlation Analysis
Based on Figs. 6–8, it is evident that the relative flow rate significantly influences the performance parameters of the centrifugal pump. Throughout this process, the relative flow rate steadily rises from 0.000 to 1.399, while the consistent rotational speed of the centrifugal pump decreases from 1472 to 1453 rpm. Furthermore, the consistent flow rate of the centrifugal pump rises with the increase relative flow rate, while the consistent head decreases. Specifically, the flow rate ranges from 0 to 8.393 m3/h, and the head changes from 9.20 to 5.76 m as the relative flow rate increases. The consistent shaft power also escalates as the relative flow rate rises, from 0.242 to 0.390 kW.
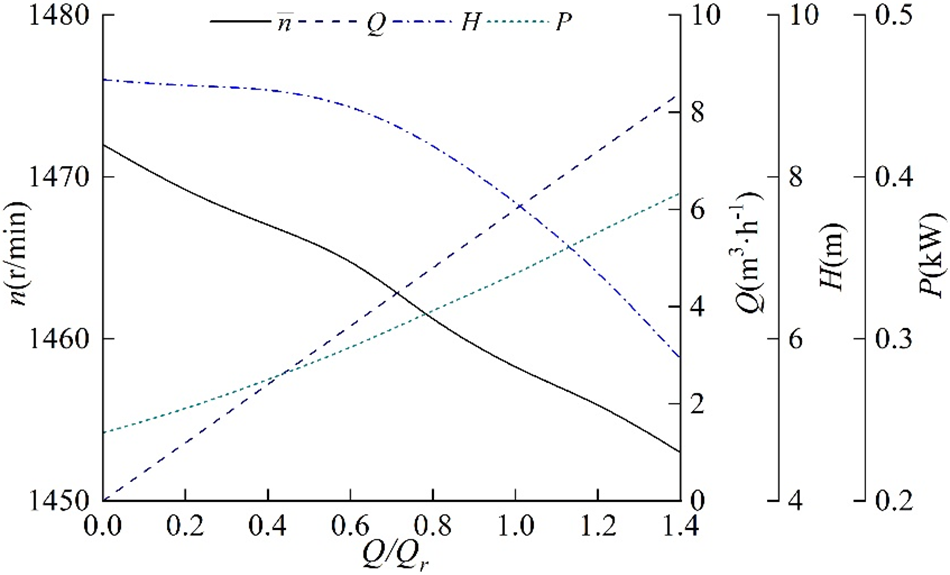
Figure 6: Stable values of performance parameters
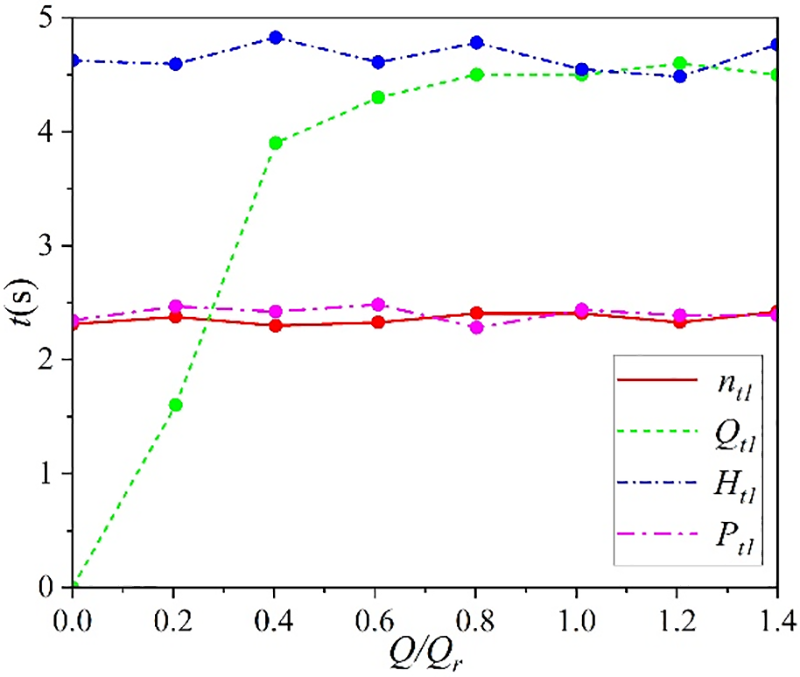
Figure 7: Stable time of performance parameters
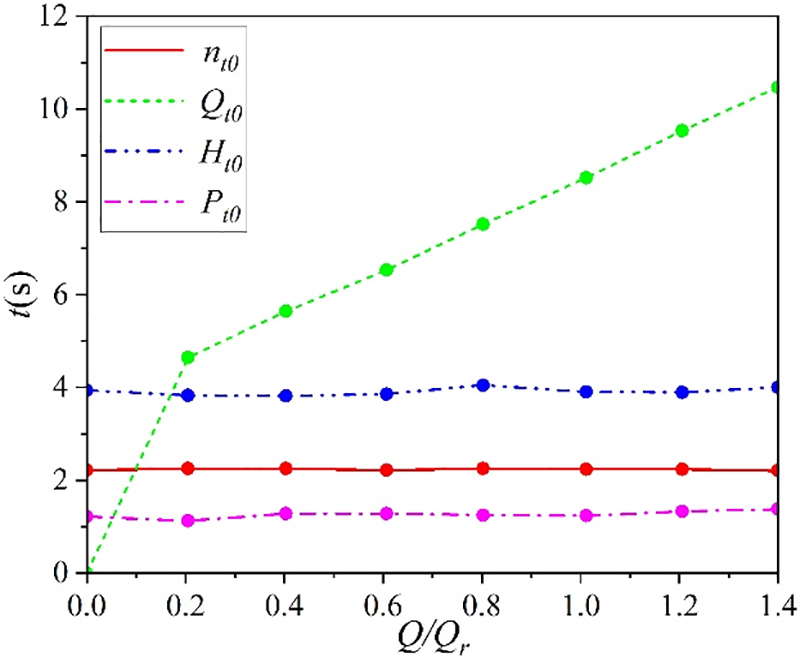
Figure 8: Zeroing time of performance parameters
Additionally, it is evident that the relative flow rate significantly impacts the stability and zeroing time of the centrifugal pump’s performance parameters. Notably, the stability period of the flow rate progressively increases, while the stability periods of rotational speed, head, and shaft power remain relatively constant. Moreover, the time required for each parameter to return to a stable shutdown state varies. Specifically, the zeroing time of flow rate notably extends with higher relative flow rate, reaching up to 10.468 s, whereas the zeroing time of shaft power is shortest, ranging approximately between 1.219 and 1.375 s.
Based on the aforementioned findings, it can be concluded that the performance parameters of the centrifugal pump fluctuate with the change in the relative flow rate. Specifically, the consistent rotational speed diminishes as the relative flow rate increases, while the consistent values of flow rate and shaft power exhibit an upward trend with the rise in relative flow rate. The consistent head value demonstrates a declining trend with the increase in relative flow rate. Furthermore, the stable time and zeroing time of each parameter vary. These findings contribute to a clearer comprehension of the operational mechanism of the centrifugal pump and the optimization of its performance through adjustments in the relative flow rate.
To mitigate the dimensional effects, normalization was applied to the relative flow rate, rotational speed, head, and shaft power. The normalized results are presented in Table 2. Each variable was scaled to a range between 0 and 1. The specific calculation formula is shown in Eq. (1).
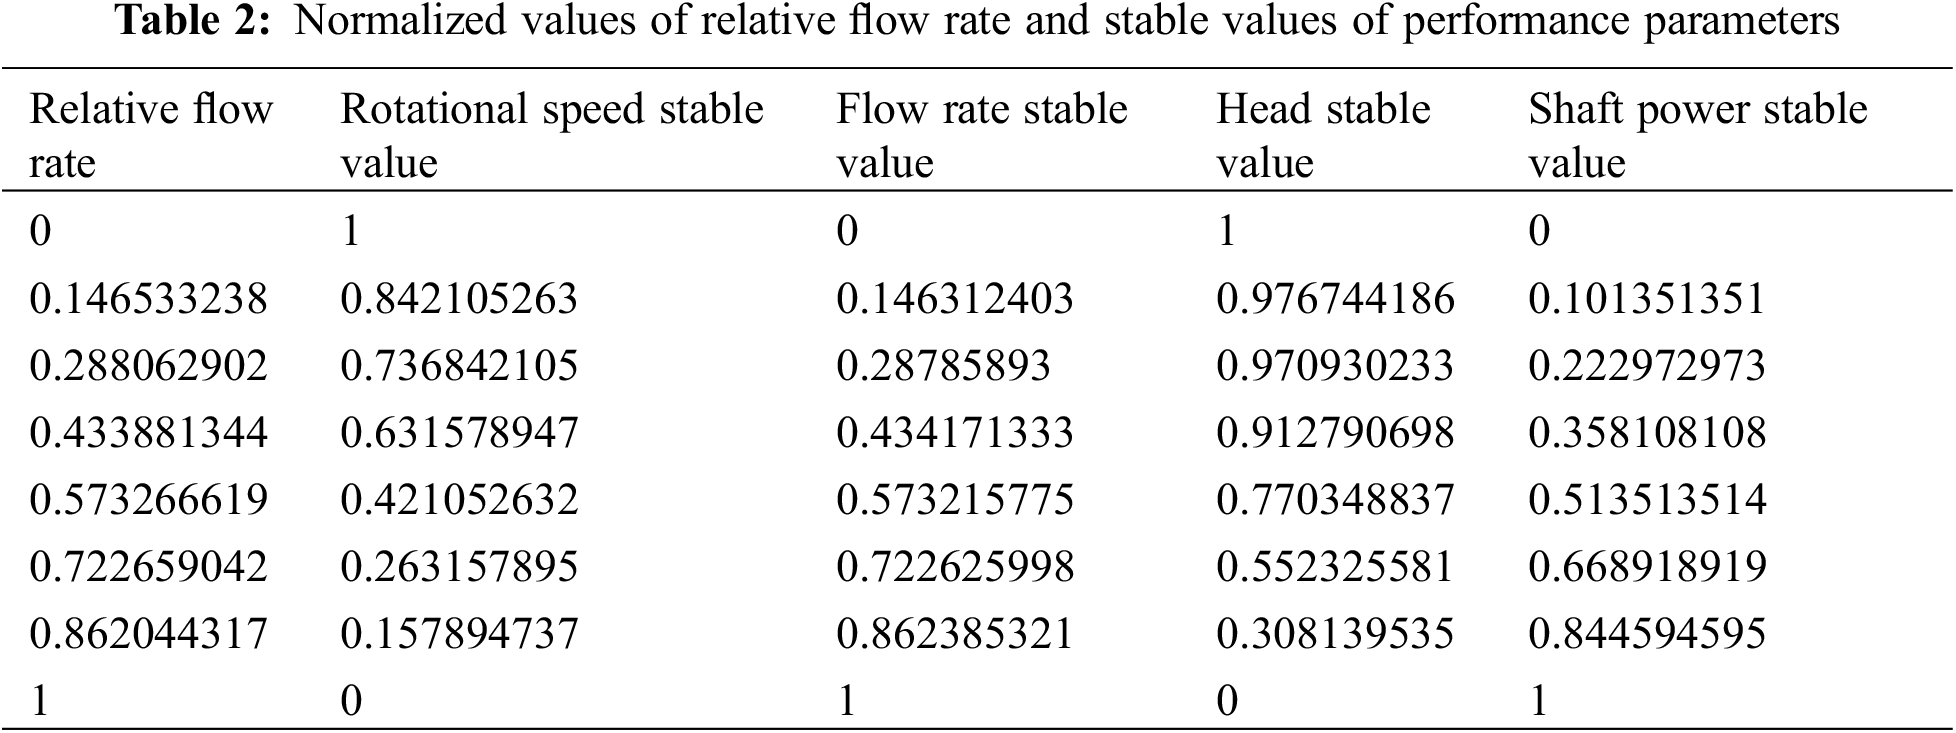
where Xi is the original data, Xi,norm is the normalized data, Xmax is the maximum value in the original data, and Xmin is the minimum value in the original data.
In order to analyze the correlation between variables more specifically, the Pearson correlation coefficient can be calculated to effectively measure their linear relationship. The Pearson correlation coefficient is a commonly used statistical measure to assess the degree of linear correlation between two variables.
The calculation formula for the Pearson coefficient is shown in Eq. (2), as follows:
In this context, r represents the Pearson correlation coefficient, X and Y represent the observed values of two variables,
In Fig. 9, the Pearson correlation coefficient figure presents the correlation coefficients between variables, aiding in assessing their degree of correlation.
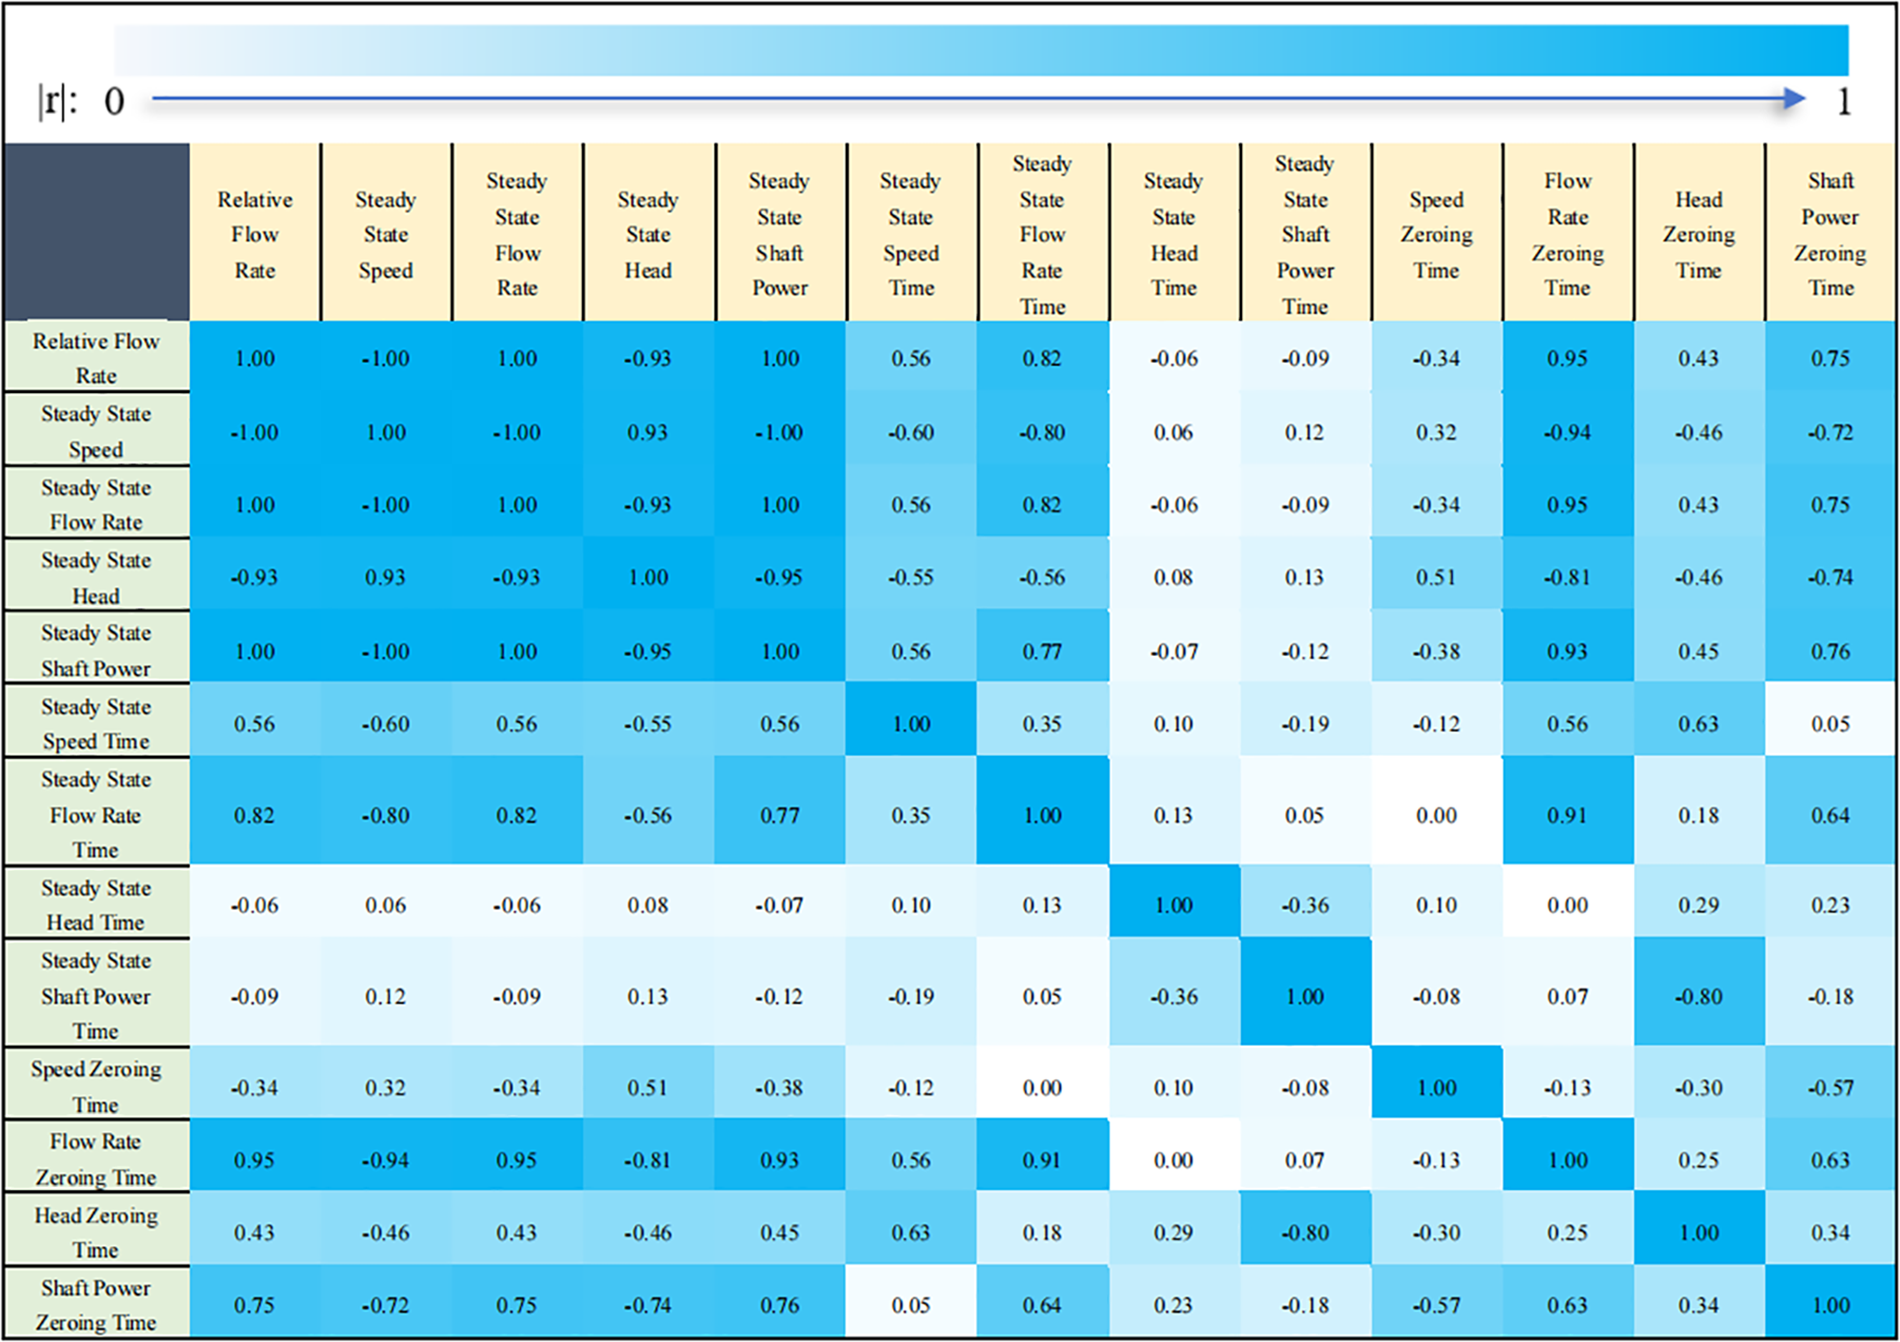
Figure 9: Pearson correlation coefficient figure
It is evident that each variable correlates positively with itself. Further analysis reveals the correlations among different variables. For example, there exists a strong positive correlation (correlation coefficient = 1.00) between relative flow and both flow stability and shaft power stability. This suggests that an increase in relative flow significantly leads to an increase in both flow stability and shaft power stability, and their relationship is linear. Similarly, there is a strong positive correlation (correlation coefficient = 0.93) between speed stability and head stability, indicating a linear relationship between an increase in speed stability and an increase in head stability. Conversely, there is a strong negative correlation (correlation coefficient = −0.95) between shaft power stability and head stability. This implies that an increase in shaft power stability results in a decrease in head stability, and vice versa.
Furthermore, the figure also presents the correlation coefficients between the stability time and zeroing time of each variable. For example, the correlation coefficients between head stability time and other variables are comparatively low, suggesting a weak relationship between them and the other variables. Conversely, head stability value, shaft power stability value, flow stability time, and flow zeroing time exhibit relatively high correlation coefficients (|r| greater than 0.8) with most variables, indicating a robust association between them and the majority of variables.
Calculate the relative error for the analysis of experimental errors.
where er represents the relative error.
In this analysis, the mean value replaces the actual value, and data collected after the flow stabilizes during the pump start-up are utilized for assessing the relative error. By performing calculations, we can determine the maximum relative error among the stabilized values for each curve, as illustrated in Table 3.
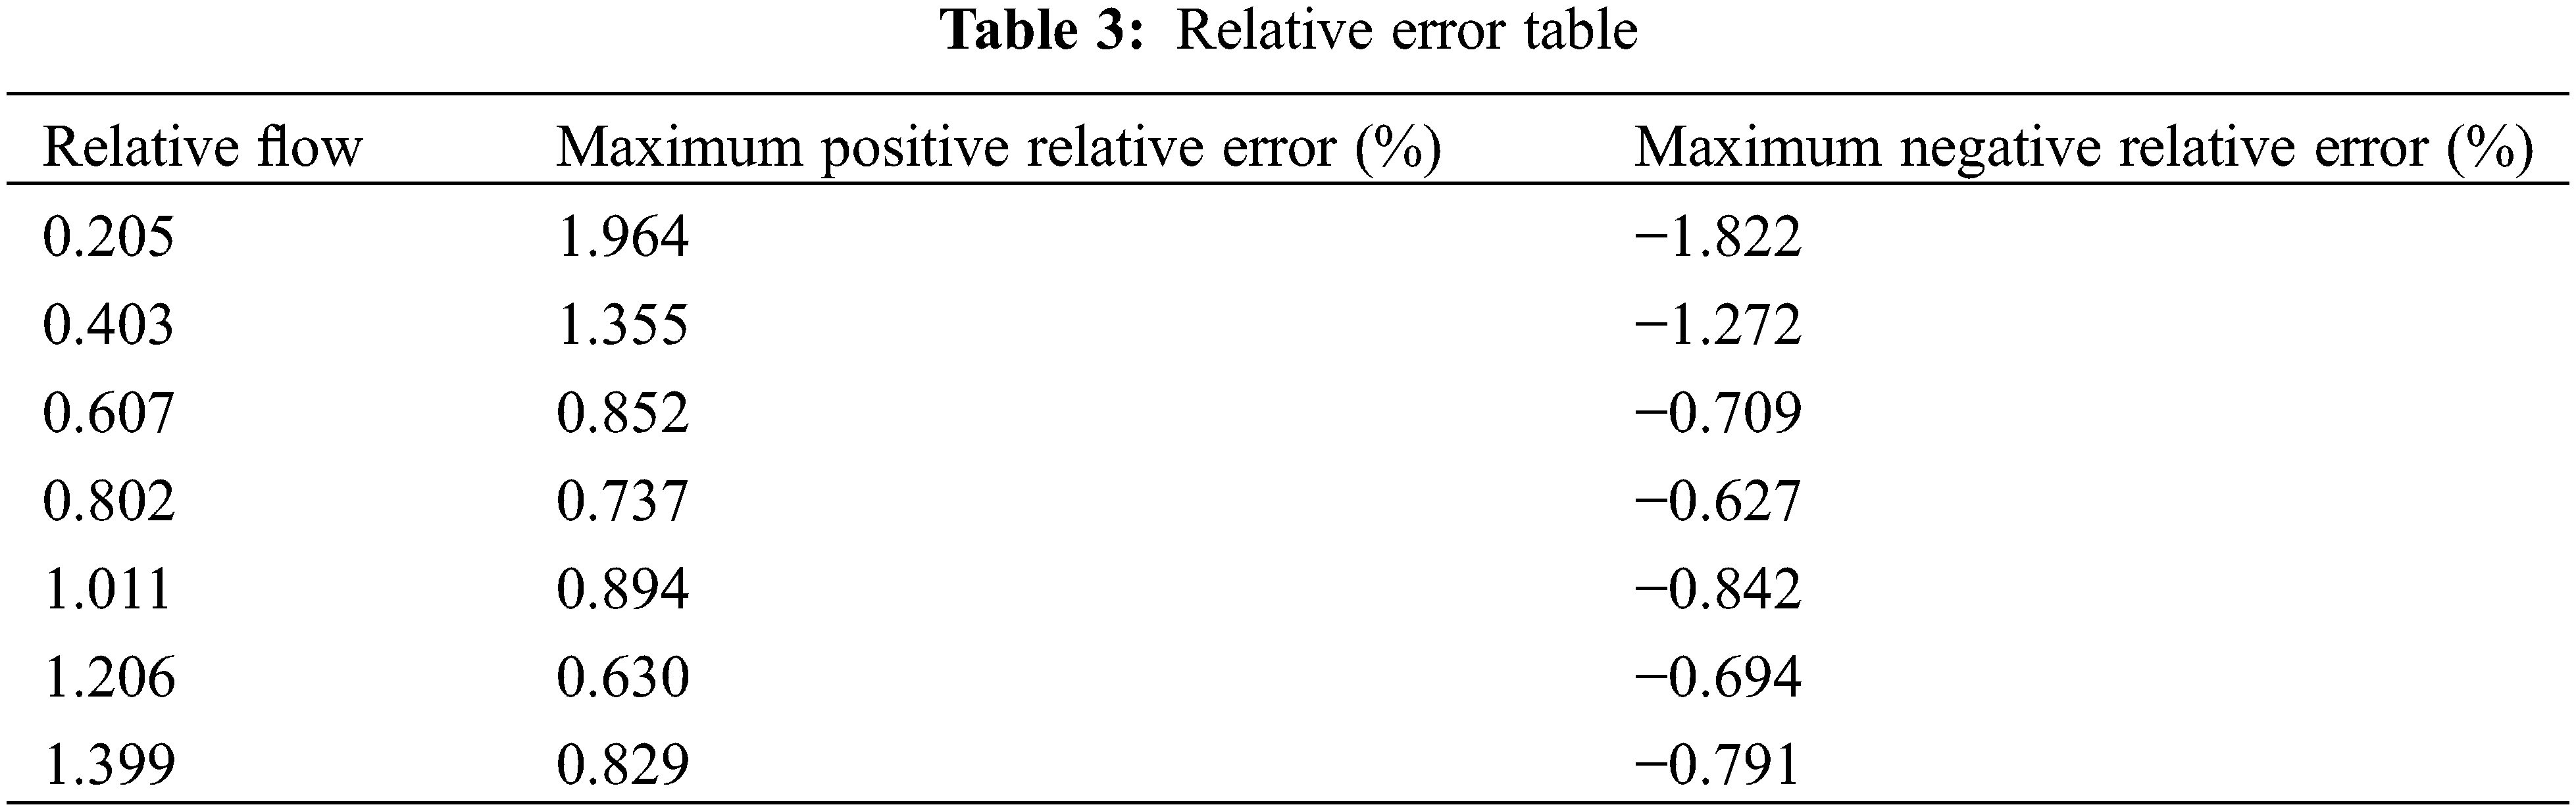
The maximum relative error occurs when the relative flow rate is 0.205, at which point the relative error is 1.964%. This indicates that the relative error is generally low, suggesting that the measured data is highly reliable.
In this study, experimental tests were conducted on the external characteristics of pump start-stop transient processes under 8 different valve opening conditions. However, numerical simulation analysis was not performed, resulting in a relatively simple and superficial numerical analysis and statistical methods applied to the experimental data. In future research, active efforts will be made to conduct numerical simulation analysis and delve deeper into the data. Regression analysis and other more complex statistical methods will be introduced in future plans to comprehensively understand the operational characteristics of the pump system. It is hoped that through such efforts in the future, more details of the pump under different operating conditions can be revealed, providing a more reliable reference basis for engineering practice, further promoting research and development in the related fields.
The main conclusions are as follows:
1) There are variations in the stabilization time and zeroing time of different parameters during the start-up and shutdown processes. The zeroing time for flow increases significantly with relative flow, reaching a maximum of 10.468 s, while the shaft power zeroing time is the shortest, ranging from approximately 1.219 to 1.375 s.
2) Research findings indicate that as valve opening increases, flow stabilization and zeroing time also increase significantly (|r| > 0.95), whereas the correlation between speed, power, head stabilization, and zeroing time and valve opening is relatively low (|r| < 0.6).
3) The initial flow rate rises slowly due to pipeline statics before start-up, and during shutdown, water flow inertia results in initially stable flow, followed by rapid decline, and ultimately a gradual descent.
The study has identified correlations among different variables, particularly concerning head, shaft power, and flow stability. Moreover, it offers a more precise insight into water conditions during start-up and shutdown phases, providing valuable reference data for pipeline system control and optimization.
Acknowledgement: None.
Funding Statement: The research was financially supported by Science and Technology Project of Quzhou (Grant Nos. 2023K256, 2023NC08), Zhejiang Provincial Natural Science Foundation of China (Grant No. LZY21E050001), and Hunan Province Key Field R&D Plan Project (Grant No. 2022GK2068).
Author Contributions: Study conception and design: Xiao Sun, Yuliang Zhang; data collection: Huifan Huang; analysis and interpretation of results: Lianghuai Tong, Xiaowei Xu; draft manuscript preparation: Xiaoqi Jia, Litao Ou. All authors reviewed the results and approved the final version of the manuscript.
Availability of Data and Materials: The data that support the findings of this study are available from the corresponding author upon reasonable request.
Conflicts of Interest: The authors declare that they have no conflicts of interest to report regarding the present study.
References
1. Zheng FC, Zhang XP, Chen TR, Huang B, Xu J, Wang GY. Strong transient characteristics in axial flow waterjet pump during rapid starting period with special emphasis on saddle zone. Ocean Eng. 2023;269:113506. doi:10.1016/j.oceaneng.2022.113506. [Google Scholar] [CrossRef]
2. Ahmed F, Eames I, Azarbadegan A, Moeendarbary E. Acoustics and vibrations in a complex piping network with pump startup-shutdown transients. Int J Mech Sci. 2022;227:107357. doi:10.1016/j.ijmecsci.2022.107357. [Google Scholar] [CrossRef]
3. Jin F, Luo Y, Bi H, Wang H, Wang Z, Lin K, et al. Transient simulation of reversible pump turbine during pump mode’s starting up. J Energy Storage. 2023;68:107678. doi:10.1016/j.est.2023.107678. [Google Scholar] [CrossRef]
4. Das D, Padmanabhan P. Study of pressure surge during priming phase of start transient in an initially unprimed pump-fed liquid rocket engine. Prog Propuls Power Res. 2022;11(3):353–75. doi:10.1016/j.jppr.2022.07.003. [Google Scholar] [CrossRef]
5. Uhlmann M, Bertsch SSB. Theoretical and experimental investigation of startup and shutdown behavior of residential heat pumps. IJR. 2012;35(8):2138–49. doi:10.1016/j.ijrefrig.2012.08.008. [Google Scholar] [CrossRef]
6. Rezghi A, Riasi A. Sensitivity analysis of transient flow of two parallel pump-turbines operating at runaway. Renew Energy. 2016;86:611–22. doi:10.1016/j.renene.2015.08.059. [Google Scholar] [CrossRef]
7. Dehghan BB, Aprile M, Pistocchini L, Toppi T, Motta M. Transient behavior assessments of a single-effect ammonia-water absorption heat pump system: development of an efficient experimentally validated numerical framework. Int J Heat Mass Tran. 2021;177:121252. doi:10.1016/j.ijheatmasstransfer.2021.121252. [Google Scholar] [CrossRef]
8. Wang W, Pavesi G, Pei J, Yuan S. Transient simulation on closure of wicket gates in a high-head Francis-type reversible turbine operating in pump mode. Renew Energy. 2020;145:1817–30. [Google Scholar]
9. Pagaimo MC, Fernandes JFP, Pérez-Sánchez M, López-Jiménez PA, Ramos HM, Branco PJC. Transient study of series-connected pumps working as turbines in off-grid systems. Energy Convers Manage. 2021;245:114586. [Google Scholar]
10. Kan K, Chen H, Zheng Y, Zhou D, Binama M, Dai J. Transient characteristics during power-off process in a shaft extension tubular pump by using a suitable numerical model. Renew Energy. 2021;164:109–21. [Google Scholar]
11. Fu S, Zheng Y, Kan K, Chen H, Han X, Liang X, et al. Numerical simulation and experimental study of transient characteristics in an axial flow pump during start-up. Renew Energy. 2020;146:1879–87. doi:10.1016/j.renene.2019.07.123. [Google Scholar] [CrossRef]
12. Nenkaew P, Tangthien C. A study of transient performance of a cascade heat pump system. Energy Proc. 2015;79:131–6. doi:10.1016/j.egypro.2015.11.498. [Google Scholar] [CrossRef]
13. Tian H, Gu X, Wang J, Tan G, Liang T, Cai G. The effect of pipeline length on the transient process of an electric pump during start-up of a hybrid rocket motor. Acta Astron. 2023;212:1–13. doi:10.1016/j.actaastro.2023.07.032. [Google Scholar] [CrossRef]
14. Chalghoum I, Elaoud S, Akrout M, Hadj Taieb E. Transient behavior of a centrifugal pump during starting period. Appl Acoust. 2016;109:82–9. doi:10.1016/j.apacoust.2016.02.007. [Google Scholar] [CrossRef]
15. Elaoud S, Hadj-Taïeb E. Influence of pump starting times on transient flows in pipes. Nucl Eng Des. 2011;241(9):3624–31. doi:10.1016/j.nucengdes.2011.07.039. [Google Scholar] [CrossRef]
16. Li Z, Xu L, Wang D, Li D, Li W. Simulation analysis of energy characteristics of flow field in the transition process of pump condition outage of pump-turbine. Renew Energy. 2023;219(1):119480. doi:10.1016/j.renene.2023.119480. [Google Scholar] [CrossRef]
17. Kim HS, Kim DH, Yoon SH. Transient modeling of a chemisorption heat pump using ammonia with expanded graphite–NaBr. Appl Therm Eng. 2023;234:121233. doi:10.1016/j.applthermaleng.2023.121233. [Google Scholar] [CrossRef]
18. Behroozi AM, Vaghefi M. Numerical investigation of water hammer due to transient in parallel pumps. Int J Civil Eng. 2021;19:1415–25. doi:10.1007/s40999-021-00640-w. [Google Scholar] [CrossRef]
19. Duplaa S, Coutier-Delgosha O, Dazin A, Roussette O, Caignaert G. Experimental study of a cavitating centrifugal pump during fast startups. J Fluids Eng. 2010;132(2):365–8. doi:10.1115/1.4000845. [Google Scholar] [CrossRef]
20. Ossai CI. Pump-off identification with time series analysis of transient water discharge rate. J Pet Sci Eng. 2019;181:106203. doi:10.1016/j.petrol.2019.106203. [Google Scholar] [CrossRef]
21. Roeder AA, Goyal A, Garimella S. Transient simulation of ammonia-water mixture desorption for absorption heat pumps. Int J Refrig. 2019;100:354–67. doi:10.1016/j.ijrefrig.2019.01.032. [Google Scholar] [CrossRef]
22. O’Reilly DI, Haghighi M, Flett MA, Sayyafzadeh M. Pressure and rate transient analysis of artificially lifted drawdown tests using cyclic pump off controllers. J Pet Sci Eng. 2016;139:240–53. doi:10.1016/j.petrol.2016.01.030. [Google Scholar] [CrossRef]
23. Liu S, Cao H, Chen Y, Ni S, Zhao G, Jiang C. Numerical examination of the dynamic evolution of fluctuations in cavitation and pressure in a centrifugal pump during startup. Machines. 2023;11(1):67. doi:10.3390/machines11010067. [Google Scholar] [CrossRef]
24. Fu X, Li D, Song Y, Wang H, Yang J, Wei X. Pressure fluctuations during the pump power-trip of a low-head pump-turbine with the co-closing of guide vane and ball valve. J Energy Storage. 2023;59:106470. doi:10.1016/j.est.2022.106470. [Google Scholar] [CrossRef]
25. Zhang YL, Zhu ZC, Li WG, Xiao JJ. Effects of viscosity on transient behavior of a low specific speed centrifugal pump in starting and stopping periods. IJFMR. 2018;45(1):1–20. doi:10.1615/InterJFluidMechRes.2017018920. [Google Scholar] [CrossRef]
26. Namazizadeh M, Gevari MT, Mojaddam M, Vajdi M. Optimization of the splitter blade configuration and geometry of a centrifugal pump impeller using design of experiment. J Appl Fluid Mech. 2020;13(1):89–101. doi:10.29252/jafm.13.01.29856. [Google Scholar] [CrossRef]
27. Kan K, Yang Z, Lyu P, Zheng Y, Shen L. Numerical study of turbulent flow past a rotating axial-flow pump based on a level-set immersed boundary method. Renew Energy. 2021;168:960–71. doi:10.1016/j.renene.2020.12.103. [Google Scholar] [CrossRef]
Cite This Article
 Copyright © 2024 The Author(s). Published by Tech Science Press.
This work is licensed under a Creative Commons Attribution 4.0 International License , which permits unrestricted use, distribution, and reproduction in any medium, provided the original work is properly cited.
 Downloads
 Citation Tools