
 Submit a Paper
 Propose a Special lssue
 Open Access
ARTICLE

Performance Evaluation of an Evaporative Cooling Pad for Humidification -Dehumidification Desalination
Advanced Systems Engineering Laboratory, National School of Applied Sciences, Ibn Tofail University, Kenitra, 14000, Morocco
* Corresponding Author: Aouatif Saad. Email:
(This article belongs to the Special Issue: Materials and Energy an Updated Image for 2023)
Fluid Dynamics & Materials Processing 2024, 20(10), 2323-2335. https://doi.org/10.32604/fdmp.2024.050611
Received 12 February 2024; Accepted 14 June 2024; Issue published 23 September 2024
 View Full Text
 Download PDF
Abstract
The perfect combination of renewable energy and desalination technologies is the key to meeting water demands in a cost-effective, efficient and environmentally friendly way. The desalination technique by humidification-dehumidification is non-conventional approach suitable for areas with low infrastructure (such as rural and decentralized regions) since it does not require permanent maintenance. In this study, this technology is implemented by using solar energy as a source of thermal power. A seawater desalination unit is considered, which consists of a chamber with two evaporators (humidifiers), a wetted porous material made of a corrugated cellulose cardboard and a condenser (dehumidifier). The evaporation system is tested with dry bulb temperature and relative air humidity data. The results of numerical simulations indicate that higher inlet air velocities (from 0.75 to 3 m/s) lead to a decrease in the ΔT, ΔRH, and effectiveness. With the air remaining within the evaporator for 30 cm, the temperature differential increases to 5.7°C, accompanied by a 39% rise in relative humidity contrast. These changes result in a significant enhancement in humidification efficiency, achieving a remarkable efficiency level of 78%. However, a wettability value of 630 m2/m3 leads to a smaller reduction of these parameters. Increasing the pad thickness, particularly to 0.3 m, improves performance by boosting ΔT, ΔRH, and effectiveness, especially for pads with a wettability of 630 m2/m3, for which superior performances are predicted by the numerical tests.Keywords
Nomenclature
| Re | Reynold’s Number |
| Pr | Prandtl Number |
| Nu | Nusselt Number |
| W sat | Specific humidity of saturated air, g/kg |
| W air | Specific humidity of air, kg/s |
| | Mass flow rate of air, kg/s |
| T1 | Inlet temperature, °C |
| T2 | Outlet temperature, °C |
| Tw1 | Wet bulb temperature, °C |
| W 2 | Outlet Specific humidity of air, g/kg |
| φ | Relative Humidity % |
| | Temperature difference, °C |
| Tair | Change in temperature, °C |
| Twater | Water temperature, °C |
| Cp | Specific heat at constant pressure, kJ/kg °C |
| η | Effectiveness % |
| V | Air Velocity, m/s |
| h | Heat transfer coefficient, W/m2°C |
| K | Mass transfer coefficient, kg/ m2-s |
| LHV | Latent heat of vaporization, J/kg |
| α | Wettability, m2/m3 |
| H | Length of packing, m |
| W | Width of packing, m |
| L | Depth of packing, m |
| Lc | Characteristic length, m |
| ν | Viscosity of the air, Pa-s |
| Vp/Le | Lewis number |
| Abbreviations | |
| RH | Relative humidity |
| DEC | Direct evaporative cooling |
| WBT | Wet bulb temperature |
| LHV | Latent heat of vaporization |
Even while there is a lot of water on Earth, most of it is brackish or saltwater, and there is little usable freshwater. Soft water is in short supply because of population and industrial growth, making the problem of water scarcity more urgent. The issue is made worse by the freshwater resources’ incapacity to meet the growing demand for water [1]. Where there is unrestricted access to brackish or salted water, such as coastal locations, desalination is an appropriate alternative. Unfortunately, fuel-powered desalination methods like multi-stage flash and reverse osmosis are too expensive to utilize in dryland agriculture [2]. The two main categories of desalination methods are membrane methods and thermal methods, which can be categorized according to the technology used. The associated desalination processes are typically expensive, energy-intensive, and may call for complex maintenance procedures [3].
In the sphere of water treatment, the humidification-dehumidification (HDH) desalination system is a very promising technology with enormous potential. By using low-grade waste heat sources, this creative system may produce fresh water with little energy input. The HDH system operates by first humidifying the brackish or seawater to be treated, then allowing the humid air to flow over a cooled surface like presented in Fig. 1.
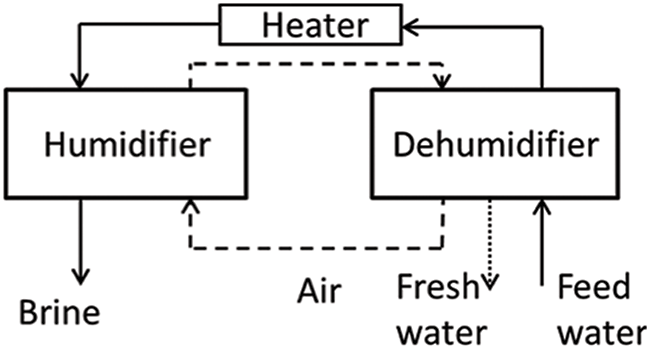
Figure 1: Humidification and dehumidification desalination process
The result is the condensation of water vapor, which creates pure freshwater. This approach offers a practical and long-lasting solution to problems with water scarcity, especially in places with restricted access to freshwater [4]. Evaporative cooling is a commonly used sustainable and energy-efficient technique that aims to reduce traditional energy usage globally. The HDH desalination system makes use of these concepts. It works by evaporating sensible heat to turn it into latent heat [5,6].
An evaporative cooling system called a Direct Evaporative Cooler (DEC) uses the air-cooling properties of water evaporation to provide natural cooling. DEC is an easy-to-use, reasonably priced cooling option that has gained popularity recently because of its ability to lower air conditioning energy use. Evaporative cooling has been investigated by a number of researchers [7–10]. A wetted material is passed through by hot, dry air in a DEC system, causing the water to evaporate and cooling the air. The area that needs cooling is subsequently filled with the cooled air. In contrast to indirect and regenerative evaporative systems, DEC systems are categorized as direct evaporative systems [11].
Because of its special qualities, which make it an effective and reasonably priced material for this use, cellulose is frequently employed as a humidifier in desalination systems. Natural and biodegradable, cellulose is derived from a range of renewable sources, including cotton and wood pulp. It is an effective medium for humidification and water evaporation due to its high surface area to volume ratio. Furthermore, cellulose is a good material for humidification because of its high water-holding capacity, which enables it to hold a lot of water and release it gradually over time. Since direct evaporative cooling systems may successfully cool things down while using less energy than typical cooling methods, there has been an increase in interest in using them for desalination in recent years [11]. Still, there is still much we do not know about using these cooling systems into HDH desalination procedures. This article gives a comprehensive investigation into the integration of a direct evaporative cooling system into an HDH desalination process, utilizing both theoretical analysis and numerical simulations. The study is to evaluate the cooling system’s performance in various scenarios, pinpoint the primary variables influencing its effectiveness, and recommend design enhancements. This study provides important insights into how the cooling mechanism affects the HDH desalination process by combining numerical simulations with theoretical analysis.
The cooling pad’s performance can be simulated via mathematical modeling, yielding performance parameters as outputs [3,4,12,13]. Using cellulosic cardboard, a mathematical model has been devised to address the shortcomings of the direct evaporative cooler. Several input parameters, including wettability values, pad thicknesses, air velocities, and diverse external meteorological variables, are assessed for this model. After that, the performance metrics that are produced are examined and assessed.
The article is organized as follows: The concept of direct evaporative cooling is introduced in Section 2, and Section 3 discusses mathematical modeling of this concept. The numerical simulations and results are shown in Section 4, along with a discussion that follows.
For the pad-end action, a numerical software was created to model mass and heat exchanges. The temperature, relative humidity, and efficiency of the air that leaves the pad following the evaporative cooling process were among the output factors that were connected mathematically using formulas.
The mathematical model used in this study was adapted from earlier research and included dynamic variable parameters, which let users enter data to maximize the effectiveness of the evaporative cooling system [4,12].
Fig. 2 shows the rectangular cross-section of the pad. The volume and total surface area of the pad are given by Eqs. (1) and (2), respectively. Additionally, the characteristic length Lc which is derived from the inverse of the wettability is found using Eq. (3). It is believed that the pad has been evenly wetted in order to analyze heat and mass transfer [14].
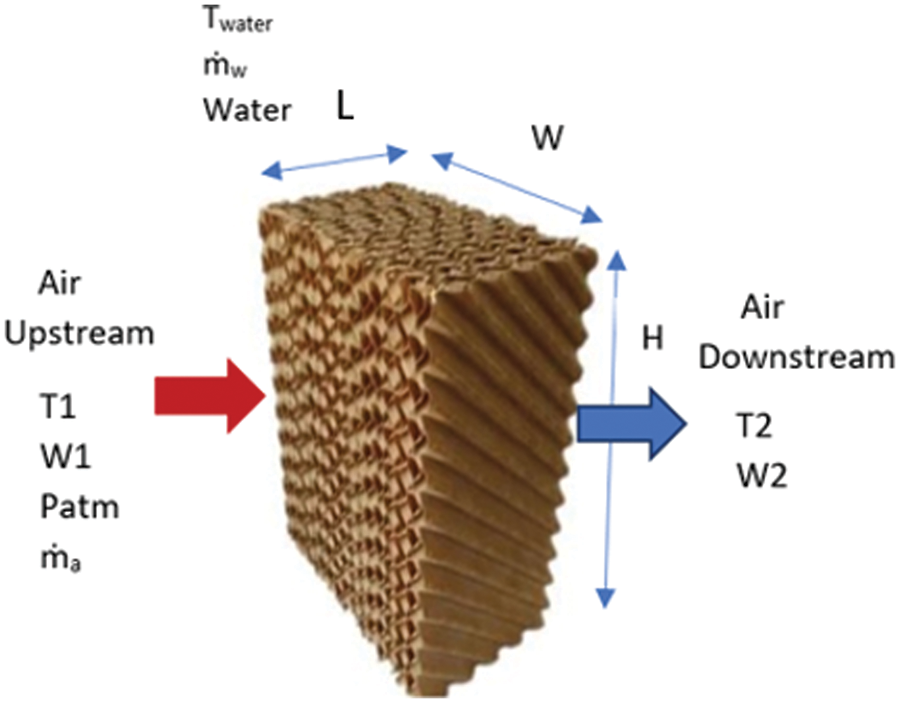
Figure 2: Cellulose pad characteristics
It is believed that the temperature at the water-air interface is constant. Assuming uniform soaking of the pad, the thermal properties for both water and air remain constant.
The formula for calculating the Reynolds number is expressed as follows [15]:
The formula for calculating the Prandtl number is expressed as follows [16]:
The formula for calculating the Nusselt number is expressed as follows [17,18]:
Eq. (10) can be used to represent the sensible heat exchange between the air and the water layer that is present on the porous material. Eq. (15), which is able to predict the air temperature after it passes through the colder T2, is obtained by integrating Eq. (10).
The evaporation of water is caused by the conversion of sensible heat into latent heat, which lowers air temperature and increases outlet humidity [8].
A mass balance analysis was conducted also for water vapor Eq. (16). Following substitutions and integration, it gives Eq. (22), which is utilized for estimating the air mixing ratio upon passing through plate
Replacing
The formula for calculating the relative humidity the expression of relative humidity derives from Antoine’s equation and expressed as follows [20]:
Avec
With the partial vapor pressure, expressed below:
An original mathematical approach was devised to anticipate η values in pad cooling systems by adopting heat and mass transfer equations originally proposed by [21].
MATLAB software was utilized to construct a numerical program that yielded the study’s results. By using this method, a thorough study of the system that took into consideration all pertinent parameters and situations could be performed.
The graphs show that when wettability increases, the system performs better. This improvement results from the wider wetting surface, which permits more water to enter the packing material’s flutes. As a result, both ΔT and ΔRH values further fall as a result of a slight increase in the amount of moisture that evaporates from the pad surface.
Throughout the course of the investigation, the material’s thickness, the water’s temperature in relation to the inlet air temperature, and the relative humidity of the air all stayed the same. The present study investigated three critical factors in an evaporative cooling system: thickness, wettability, and the fluctuation of air velocity V between 0.75 and 3 m/s. These findings concurred with those of [8].
3.1 The Impact of Air Velocity on the Performance of the Evaporation System
The system’s performance at three different wettability levels is shown in Fig. 3, which is consistent with the expected results. After evaluating the evaporator’s efficiency at three distinct air velocities, it was discovered that the higher value 3 m/s offered the least amount of cooling.
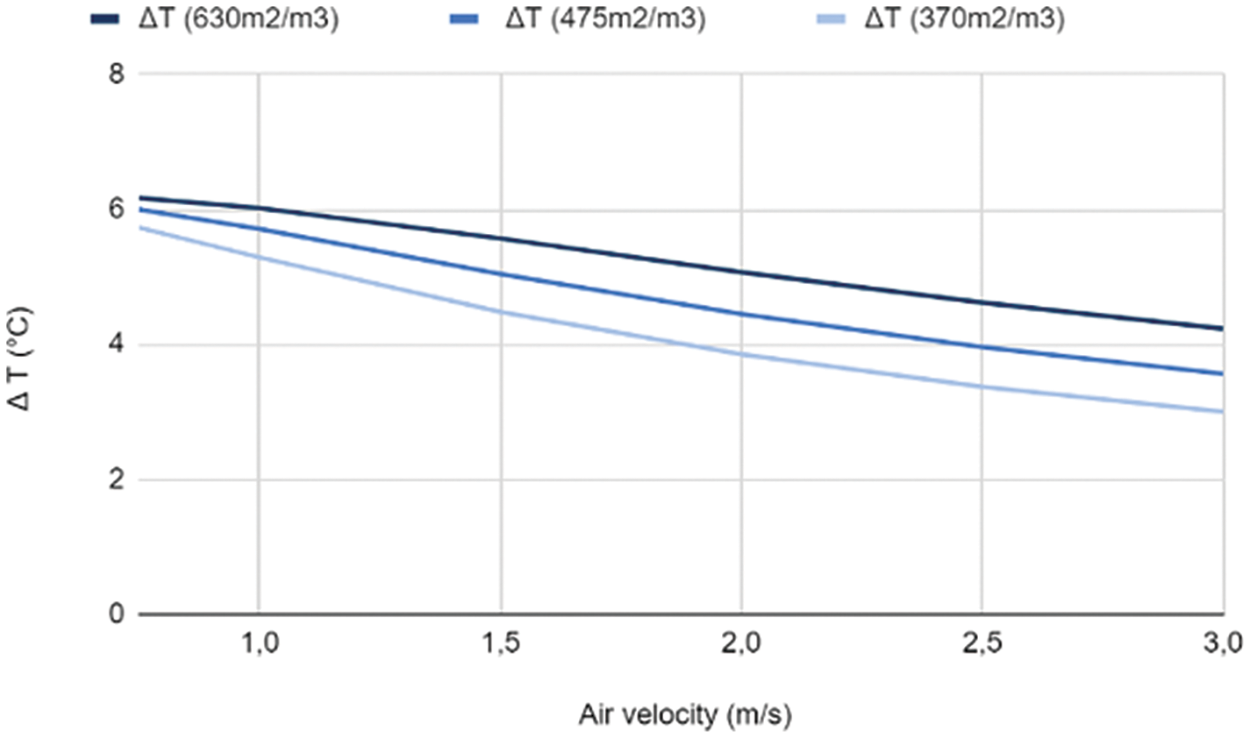
Figure 3: Variation of the temperature difference according to the variation of the air velocity with Twater = 25°C
In every instance, it was found that a rise in air velocity causes ΔT to drop. Moreover, as Fig. 4 illustrates, a greater air velocity raises the mass flow rate. Notably, it is evident that in every case that is studied, a rise in air velocity is correlated with a discernible fall in ΔT. Moreover, increasing air velocity causes the mass flow rate to rise noticeably. This is explained by the fact that the air moves over the pads more quickly, reducing contact and retention times and, in turn, mass and heat transfer rates. Lower ΔT and ΔRH values are the outcome of this drop in transfer rates since they cause less water to evaporate.
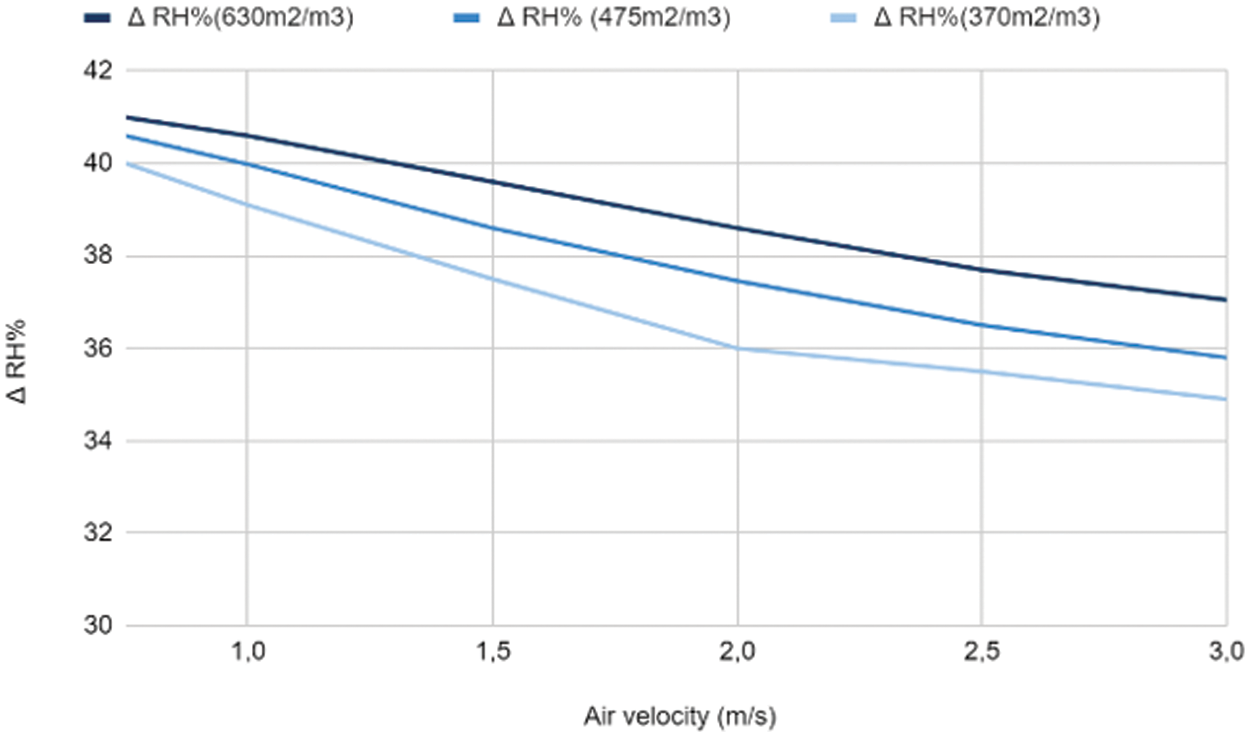
Figure 4: Variation of the relative humidity difference according to the variation of the air velocity with Twater = 25°C
Fig. 5 suggests that enhanced wettability correlates with increased efficiency. However, at higher air velocities, a notable increase in pressure drop is observed, which can lead to lower effectiveness despite the improved wettability. The graph in the figure illustrates the relationship between effectiveness and air flow rates. When WBT remains constant, an increase in air velocity leads to a decrease in effectiveness, primarily due to a corresponding reduction in ΔT.
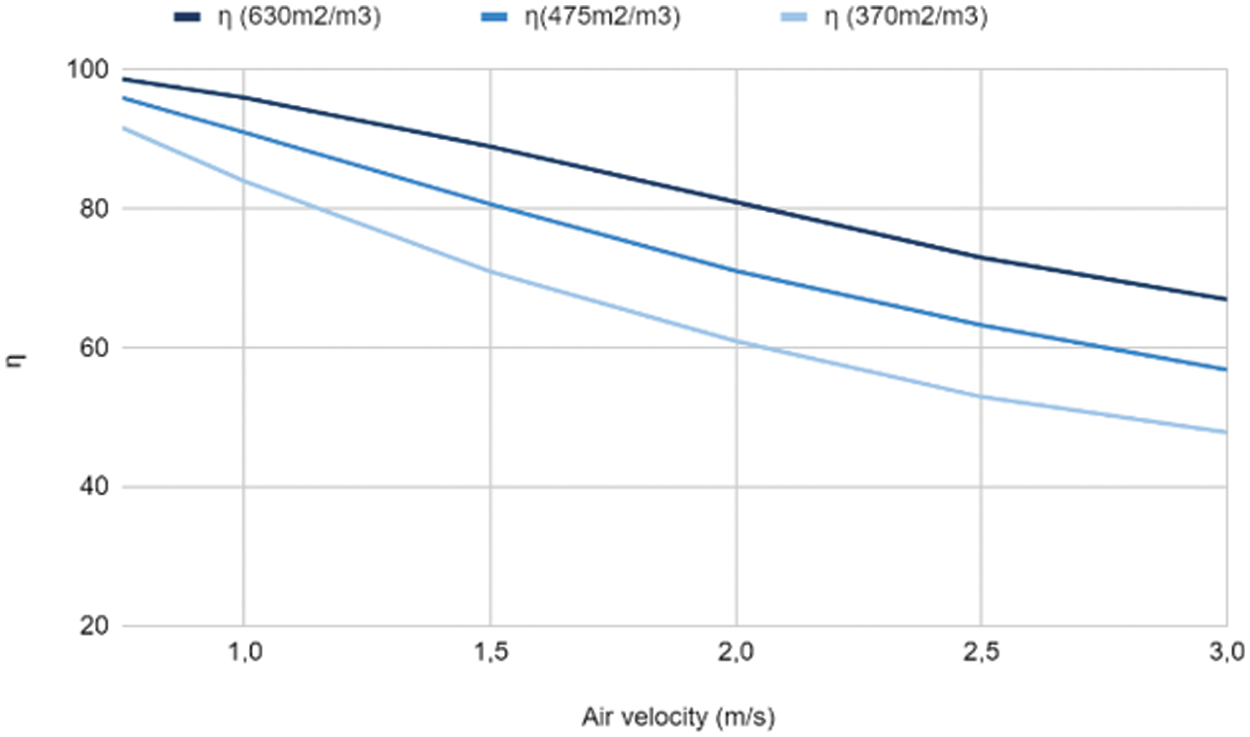
Figure 5: Variation of the effectiveness according to the variation of the air velocity with Twater = 25°C
3.2 The Impact of Thickness on the Performance of the Evaporation System
The Fig. 6 shows the effect of varying the pad thickness between 0.1 and 0.3 m while maintaining a constant air velocity, air temperature, water temperature and relative humidity on temperature difference.
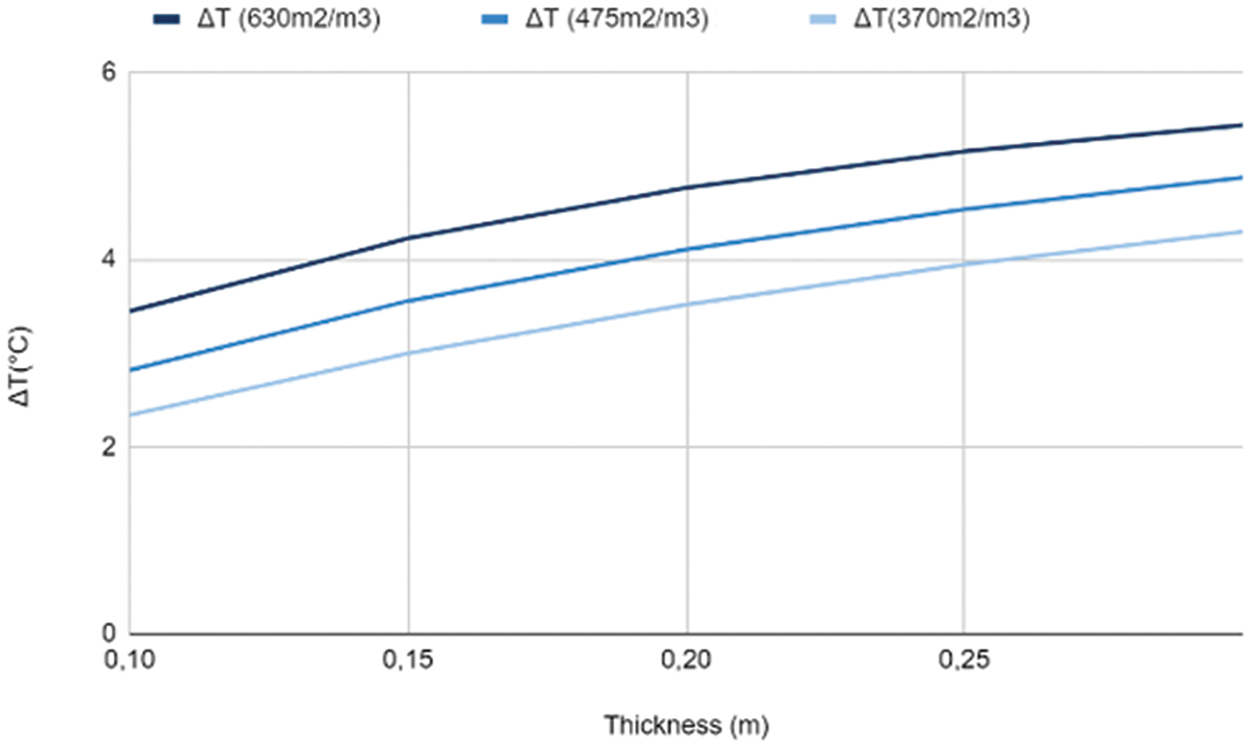
Figure 6: Variation of the temperature difference according to the variation of the thickness with Twater = 25°C
Higher values of ΔT and ΔRH are shown to be correlated with an increase in buffer thickness, as indicated by the data displayed in Figs. 6 and 7. These results imply that more humidity and more air cooling are caused by a thicker evaporator. The temperature difference grew to 5.7°C and the relative humidity difference reached 39% as the air moved through and spent 30 cm within the evaporator. This relationship can be explained by the fact that a thicker evaporator increases the amount of wetted surface area and so lengthens the time that air and material are in contact. As a result, more heat is transmitted from the air to the buffer, which causes the air to cool more quickly, and more water vapor evaporation raises the relative humidity of the air. Therefore, the evaporator’s thickness directly affects the system’s observed fluctuations in temperature and relative humidity during the evaporation process.
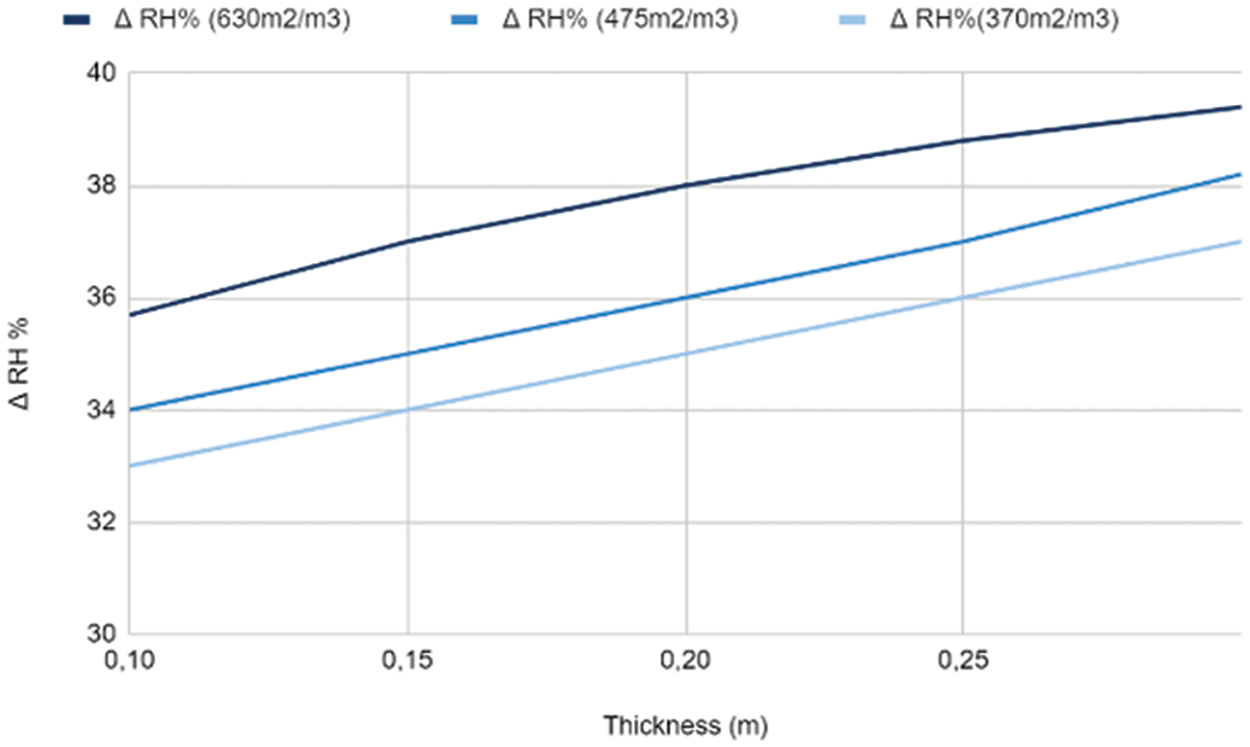
Figure 7: Variation of the relative humidity difference according to the variation of the thickness with Twater = 25°C
The graphical representation in Fig. 8 most likely illustrates how these modifications resulted in a significant increase in humidification efficiency, which reached 78%. It also demonstrates how thickening the evaporator can enhance its efficiency by promoting more efficient heat and mass transfer processes, maximizing air-material contact time, and enhancing thermal insulation qualities.
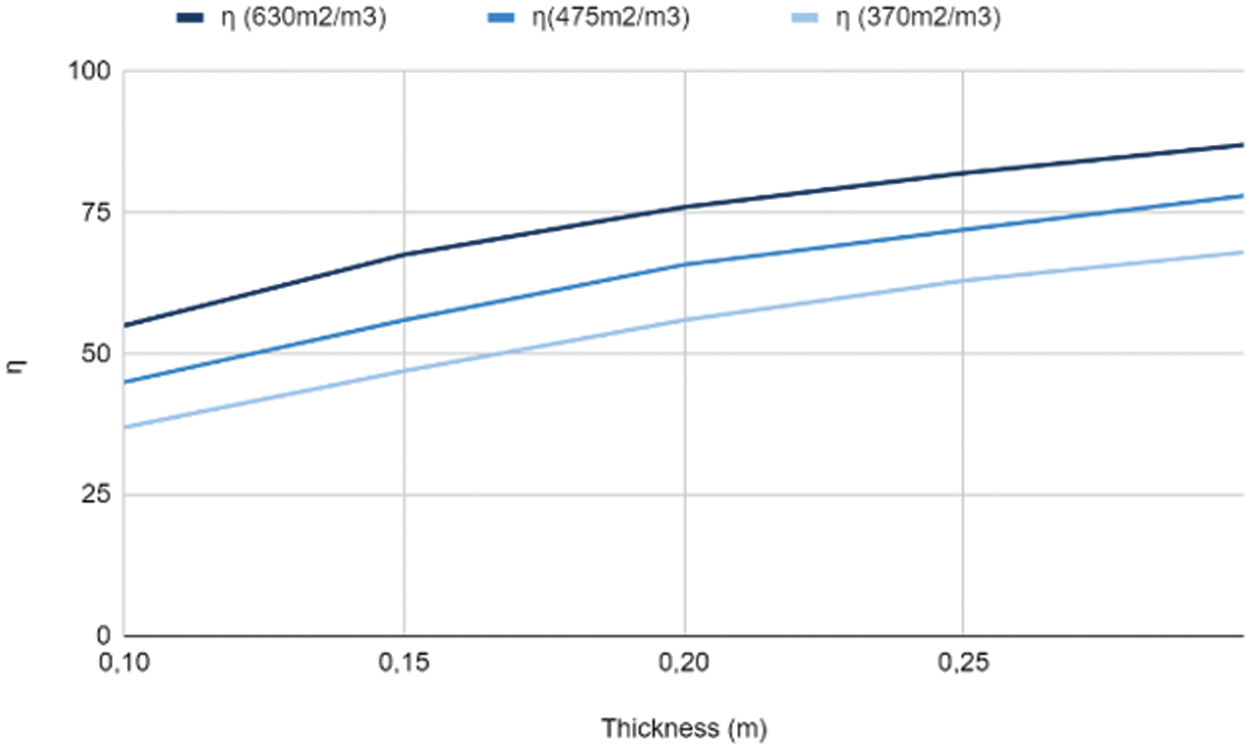
Figure 8: Variation of the effectiveness according to the variation of the thickness with Twater = 25°C
3.3 The Impact of the Pad Wettability on the Performance of the Evaporation System
The above graph sheds important light on the connection between the cellulose evaporator’s wetted surface area and the temperature of the air exit. The main finding is that the air temperature gradually drops throughout a thickness of 0.3 m (dx), which is correlated with an increase in the wetted surface area. This pattern suggests that the wetted surface area and evaporative cooling efficiency are directly correlated. In order to comprehend this phenomenon, one must examine the physics at play. Specifically, a greater wetted surface area facilitates closer contact between the air and the water, which in turn increases the heat transfer from the air to the water. The air is further cooled by this process, which encourages water evaporation.
Important information about the connection between the cellulose evaporator’s wetted surface area and air output temperature is provided by the graph. The main finding is that the wetted surface area increases in tandem with a gradual fall in air temperature across a thickness of 0.3 m (dx). This pattern suggests a clear correlation between the wetted surface area and evaporative cooling effectiveness. Consider the physics at play to further explain this phenomenon: more intimate contact between air and water is made possible by a bigger wetted surface area, which also improves heat transmission from the air to the water. The procedure encourages the evaporation of water, which further cools the air.
Fig. 9 shows three distinct curves as a function of the wetted surface area of the cellulosic cardboard evaporator reveals a meaningful relationship between the wetted surface area and the specific air outlet humidity. All three curves show the same pattern: the specific humidity of the air increases steadily as we move along a 0.3 m thickness (dx). To explain further, when there’s more wet surface on the cellulose cardboard, the air and water interact more. This prolonged contact enhances water evaporation, leading to a higher specific humidity in the air discharged from the system. As air passes through an evaporator with a greater wetted surface area, it gains the capacity to absorb more water vapor, yielding an air output that is significantly more humid.
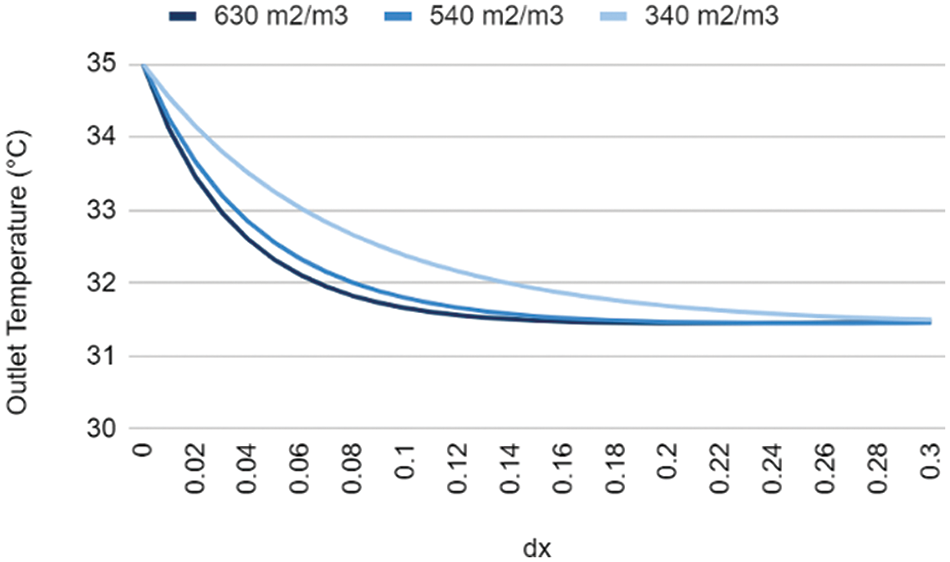
Figure 9: Impact of the pad wettability on the outlet temperature
More wetted surface area promotes better air-water interaction inside the cellulose cardboard according to Fig. 10. Water evaporation rises because of the longer contact duration, which increases heat transfer efficiency. As a result, air cools more efficiently without changing its saturation temperature. This optimizes the process’s efficiency since the air gets close to but stays below water vapor saturation.
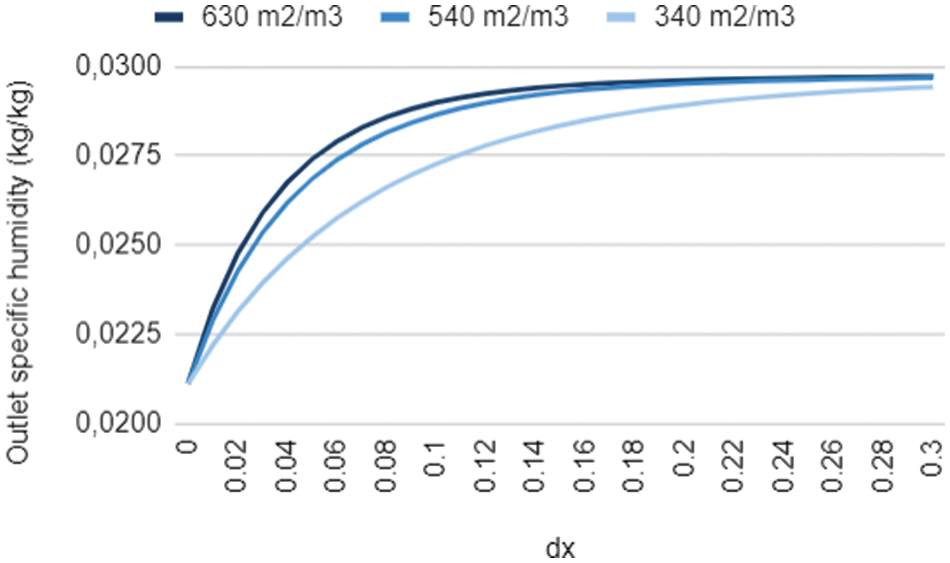
Figure 10: Impact of the pad wettability on the outlet specific humidity
The results findings in Fig. 11 suggest that a number of crucial components are needed for an evaporator to operate at a high efficiency. Using a material with a wide wetted surface area is crucial. Improved air-material contact makes it possible for effective heat and mass transfer processes to occur. It is important to keep the air velocity modest. Reduced residence durations within the evaporator due to high air velocities might restrict the efficiency of mass and heat transfer. Thus, optimizing efficiency requires managing the airflow to guarantee the ideal ratio of mixing to contact duration. One important factor is the evaporator’s thickness. A thicker evaporator permits the air in the system to remain there for longer, facilitating more complete heat and mass exchange. This highlights how crucial it is to choose a thickness that offers enough contact time while taking into account real-world limitations.
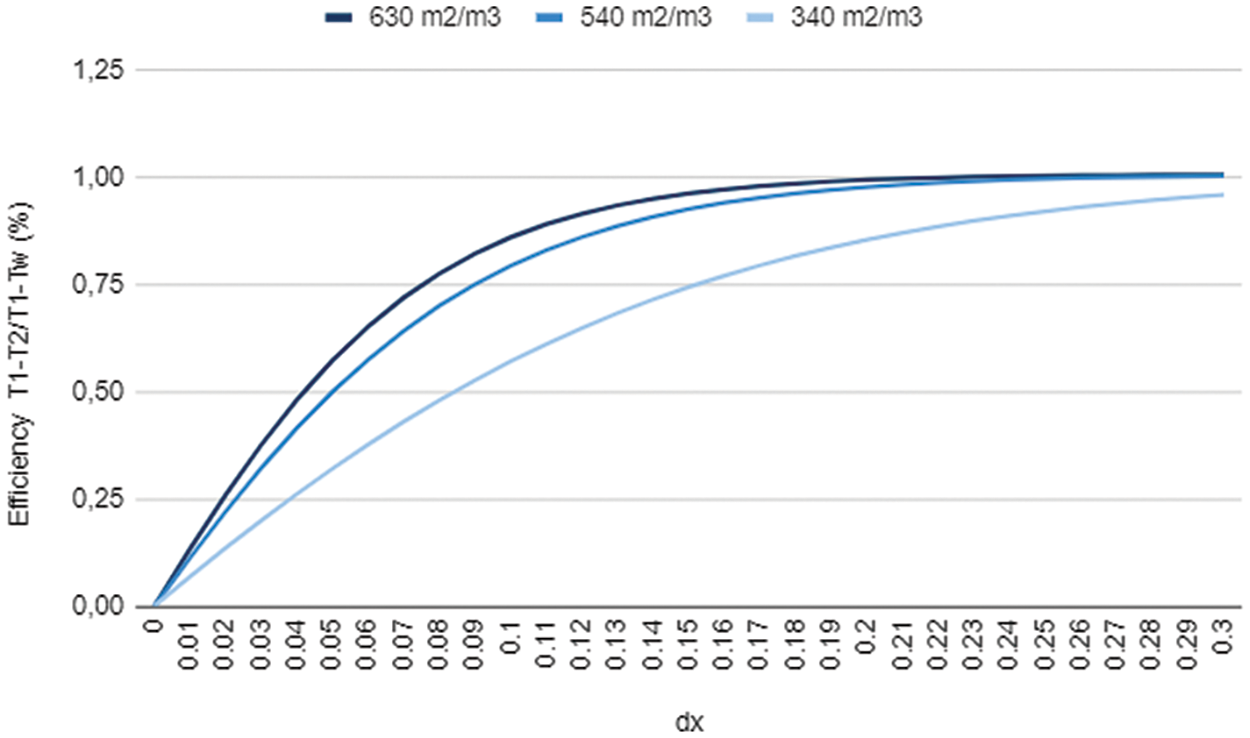
Figure 11: Impact of the pad wettability on the effectiveness
With the use of numerical simulation software, the performance of an evaporative cooling pad is examined in this study through an analysis of the mathematical model. The objective is to obtain a deeper comprehension of the functioning of the cooling pad and the ways in which its design parameters impact its efficacy. To comprehend the flow of heat and moisture in the cooling pad, we meticulously created a mathematical model. We are able to replicate different operating circumstances and examine the effects of various parameters, including water distribution, pad thickness, and airflow velocity, on the cooling efficiency by incorporating this model into a numerical simulation program. The purpose of this study is to offer insightful information about how to optimize evaporative cooling systems for improved efficiency and performance.
Both the temperature differential ΔT and the relative humidity difference ΔRH decreased as the incoming air speed increased. This indicates that the temperature or humidity of the air was dropping. Also, the cooling pad’s overall performance decreased when the air velocity was increased from 0.75 to 3 m/s. As anticipated, there were smaller drops in ΔT, ΔRH, and effectiveness when the cooling pad’s wettability value was 630 m2/m3.
The results of the study indicated that increasing the thickness of the cooling pad enhanced its performance, particularly at 0.3 m. We discovered that the temperature differential ΔT, relative humidity difference ΔRH, and effectiveness rose when we increased the thickness of the pad from 0.1 to 0.3 m. This was particularly true for the pad that had a 630 m2/m3 wettability. The temperature and humidity climbed to 39% and 5.7°C, respectively, when the air entered the evaporator and stayed inside for 0.3 m. Due to these modifications, the pad’s ability to humidify the air improved significantly, with a 78% humidification efficiency.
It was evident from numerical testing on three different cellulose pad wettability values that the wettability value of 630 m2/m3 performed exceptionally well. Increased efficiency and values of ΔT and ΔRH temperature and relative humidity differences showed this. The results of the investigation showed that performance improved with pad thickness, and this effect was particularly pronounced at 0.3 m. It was discovered that increasing the pad thickness increased efficiency, ΔT, and ΔRH, especially for the pad with a 630 m2/m3 wettability.
Using a material with a wide wetted surface area, keeping the air velocity moderate to maximize contact time, and making sure the evaporator is thicker for longer air residence time are all necessary to achieve high evaporator efficiency.
Acknowledgement: We would like to thank the Moroccan Ministry of Higher Education, Scientific Research, and Innovation and the OCP Foundation who funded this work through the APRD research program.
Funding Statement: This is funded by the Moroccan Ministry of Higher Education, Scientific Research, and Innovation and the OCP Foundation who funded this work through the APRD research program with one grant for the author Aouatif Saad, the rest of the authors received no specific funding for this study.
Author Contributions: The authors confirm contribution to the paper as follows: Study conception and design: Ibtissam El Aouni, Hicham Labrim, Elhoussaine Ouabida, Ahmed Ait Errouhi, Rachid El Bouayadi, Driss Zejli, Aouatif Saad; data collection: Ibtissam El Aouni, Hicham Labrim, Elhoussaine Ouabida, Ahmed Ait Errouhi, Rachid El Bouayadi, Driss Zejli, Aouatif Saad; analysis and interpretation of results: Ibtissam El Aouni, Hicham Labrim, Elhoussaine Ouabida, Ahmed Ait Errouhi, Rachid El Bouayadi, Driss Zejli, Aouatif Saad; draft manuscript preparation: Ibtissam El Aouni, Aouatif Saad. All authors reviewed the results and approved the final version of the manuscript.
Availability of Data and Materials: The datasets generated and analyzed during the current study are available from the corresponding author upon reasonable request. Due to privacy and confidentiality agreements, certain data may not be publicly accessible. For researchers interested in accessing the data, please contact Aouatif Saad. Email: saa.aouatif@uit.ac.ma.
Conflicts of Interest: The authors declare that they have no conflicts of interest to report regarding the present study.
References
1. Delyannis EE, Belessiotis V. Solar application in desalination: the Greek Islands experiment. Desalination. 1995;100:27–34. doi:10.1016/0011-9164(96)00006-9. [Google Scholar] [CrossRef]
2. Goosen MF, Al-Hinai H, Sablani SS. Capacity building strategies for desalination: activities, facilities, and educational programs in Oman. Desalination. 2001;141(2):181–90. doi:10.1016/S0011-9164(01)00402-7. [Google Scholar] [CrossRef]
3. Elimelech M, Phillip WA. The future of seawater desalination: energy, technology, and the environment. Science. 2011;333(6043):712–7. doi:10.1126/science.1200488. [Google Scholar] [PubMed] [CrossRef]
4. Santosh R, Lee HS, Kim YD. A comprehensive review on humidifiers and dehumidifiers in solar and low-grade waste heat powered humidification-dehumidification desalination systems. J Clean Prod. 2022;347:131300. doi:10.1016/j.jclepro.2022.131300. [Google Scholar] [CrossRef]
5. Munsamy M, Telukdarie A, Zhang W. Cleaner technology systems for surface finishing: evaporative coolers for close circuiting low temperature plating process. J Clean Prod. 2014;66:664–71. doi:10.1016/j.jclepro.2013.11.038. [Google Scholar] [CrossRef]
6. Xu L, Chen YP, Wu PH, Huang BJ. Humidification-dehumidification (HDH) desalination system with air-cooling condenser and cellulose evaporative pad. Water. 2020;12(1):142. doi:10.3390/w12010142. [Google Scholar] [CrossRef]
7. Damasceno LA, Yanagi Junior T. Assessment of evaporative cooling efficiency in greenhouses equipped with wetted porous plates. DYNA. 2017;84(203):118–25. doi:10.15446/dyna.v84n203.59564. [Google Scholar] [CrossRef]
8. Suranjan Salins S, Kumar S, Kartik RK, Reddy SK. Numerical analysis-based performance prediction in a direct evaporative cooler used for building cooling. J Building Performance Simul. 2022;15(2):237–50. doi:10.1080/19401493.2021.2025266. [Google Scholar] [CrossRef]
9. Khater EG. Performance of direct evaporative cooling system under Egyptian conditions. J Climatol Weather Forecast. 2014;2(1):1–9. [Google Scholar]
10. Moh TSY, Jin JJY, Wong LA, Tiong MC, Chan CK. Wind-induced evaporative cooling passive system for tropical hot and humid climate. Front Mech Eng. 2023;9:1069806. doi:10.3389/fmech.2023.1069806. [Google Scholar] [CrossRef]
11. Elgendy MA, Ramadan MR. Experimental investigation of a direct evaporative cooling system using a wetted membrane. Energy Buil. 2018;158:1–10. [Google Scholar]
12. Liu T, Pang H, He S, Zhao B, Zhang Z, Wang J, et al. Evaporative cooling applied in thermal power plants: a review of the state-of-the-art and typical case studies. Fluid Dyn Mater Proc. 2023;19(9). doi:10.32604/fdmp.2023.027239. [Google Scholar] [CrossRef]
13. Caruana R, De Antonellis S, Marocco L, Guilizzoni M. Modeling of indirect evaporative cooling systems: a review. Fluids. 2023;8(11):303. doi:10.3390/fluids8110303. [Google Scholar] [CrossRef]
14. Ali M, Yaqoob Z. Model-based performance comparison of different configurations of evaporative cooling systems in various climates of Pakistan. J Adv Res Fluid Mechan Thermal Sci. 2018;47(1):1–12. [Google Scholar]
15. Allahyarzadeh-Bidgoli A, Dezan DJ, Yanagihara JI. COP optimization of propane pre-cooling cycle by optimal Fin design of heat exchangers: efficiency and sustainability improvement. J Cleaner Prod. 2020;271:122585. doi:10.1016/j.jclepro.2020.122585. [Google Scholar] [CrossRef]
16. Raheem A, Siddique W, Farooqui ZH, Salameh T, Haq IU, Waheed K, et al. Performance evaluation of adding helical-screw tape inserts in parabolic solar trough collectors as a source of cleaner energy production. J Clean Prod. 2021;297:126628. doi:10.1016/j.jclepro.2021.126628. [Google Scholar] [CrossRef]
17. Wang X, Shen C, Liu L, Liu M, Gu H. Development of heat transfer correlation of turbulent forced convection in subchannels with rough surfaces based on CFD. Ann Nucl Energy. 2023;181:109542. doi:10.1016/j.anucene.2022.109542. [Google Scholar] [CrossRef]
18. Salhi JE, Salhi M, Amghar K, Zarrouk T, Salhi N. Analysis of the thermohydrodynamic behavior of a cooling system equipped with adjustable fins crossed by the turbulent flow of air in forced convection. Int J Energy Environ Eng. 2021;1:13. [Google Scholar]
19. Vance FH, Shoshin Y, van Oijen JA, de Goey LPH. Effect of Lewis number on premixed laminar lean-limit flames stabilized on a bluff body. Proc Combustion Inst. 2019;37(2):1663–72. doi:10.1016/j.proci.2018.07.072. [Google Scholar] [CrossRef]
20. Lambert MS, Miriam TT, Susan F. Marseken, Relative Humidity: Relative Humidity, Partial Pressure, Vapor Pressure, Hygrometer, Temperature, Dew Point, Antoine Equation, Goff-Gratch Equation, Solubility, Ideal Gas, Heat Index, Betascript Publishing; 2010 (In French). Available from: http://www.energieplus-lesite.be. [Accessed 2023]. [Google Scholar]
21. Yan SR, Moria H, Pourhedayat S, Hashemian M, Asaadi S, Dizaji HS, et al. A critique of effectiveness concept for heat exchangers; theoretical-experimental study. Int J Heat Mass Transfer. 2020;159:120160. doi:10.1016/j.ijheatmasstransfer.2020.120160. [Google Scholar] [CrossRef]
Cite This Article
 Copyright © 2024 The Author(s). Published by Tech Science Press.
This work is licensed under a Creative Commons Attribution 4.0 International License , which permits unrestricted use, distribution, and reproduction in any medium, provided the original work is properly cited.
 Downloads
 Citation Tools