 Open Access
ARTICLE
Stability and Thermal Property Optimization of Propylene Glycol-Based MWCNT Nanofluids
1 Faculty of Metallurgical and Energy Engineering, Kunming University of Science and Technology, Kunming, 650093, China
2 Faculty of Media and Information Engineering, Yunnan Open University, Kunming, 650093, China
* Corresponding Authors: Shan Qing. Email: ; Zhumei Luo. Email:
Fluid Dynamics & Materials Processing 2023, 19(9), 2399-2416. https://doi.org/10.32604/fdmp.2023.028024
Received 26 November 2022; Accepted 08 February 2023; Issue published 16 May 2023
Abstract
Propylene glycol-based MWCNT (multi-walled carbon nanotubes) nanofluids were prepared in the framework of a two-step method and by using a suitable PVP (polyvinyl pyrrolidone) dispersant. The BBD (Box-Behnken design) model was exploited to analyze 17 sets of experiments and examine the sensitivity of the absorbance to three parameters, namely the concentration of MWCNT, the SN ratio (mass ratio of carbon nanotubes to surfactants) and the sonication time. The results have revealed that, while the SN ratio and concentration of MWCNT have a strong effect on the absorbance, the influence of the sonication time is less important. The statistical method of analysis of variance (ANOVA) was further used to determine the F- and p-values of the model. Five experiments were run to validate this approach. Since sample 2 was found to display the greatest absorbance, it was selected for stability monitoring as well as thermal conductivity and viscosity measurements. This sample has been found to be stable; the viscosity decreased with increasing temperature; the addition of MWCNT nanoparticles was more effective in improving the thermal conductivity of propylene glycol than other methods in the literature. Moreover, the MWCNT nanofluid based on propylene glycol exhibited higher thermal conductivity at low temperatures.Keywords
Nomenclature
| PG | Propylene glycol |
| SN Ratio | The mass ratio of carbon nanotubes to surfactants |
| MWCNT | Multi-walled carbon nanotubes |
| CTAB | Cetyltrimethylammonium bromide |
| PVP | Polyvinyl pyrrolidone |
| SDBS | Sodium dodecyl benzene sulfonate |
| SDS | Sodium dodecyl sulphate |
| DDC | Distearyl dimethylammonium chloride |
| GA | Gum arabic |
| RSM | Response surface methodology |
| BBD | Box-Behnken design |
| DOE | Design of experiment |
| Y | Interpretation calculated response |
| | Independent variable under investigation |
| | Undetermined parameter |
| | Undetermined parameter |
| | Undetermined parameter |
| ζ | Residual |
| n | Number of independent variables |
| SS | Sum of squares |
| df | Degree of freedom |
| MS | Square mean |
| F-value | Testing statistic |
| p-value | The confidence interval of the p-value |
| | Variance in the response |
| AP | Adep precision |
| | Measured variable |
| F | Parameter calculated using measurable quantities |
| | Measurement error |
| UF | Error in introduced in calculating one parameter |
The Choi group [1] introduced the concept of nanofluids in 1995, and it is now extensively used in solar thermal conversion, power generation, heating, and cooling systems, microchannel heat transfer, and many other fields [2–6]. In conventional nanofluids, nanoparticles include metals like Cu, and Al, oxides like
While propylene glycol is rarely studied as an odorless, non-toxic, and biodegradable heat transfer medium [19], it can be used not only for heating or cooling cold buildings in cold areas [20–22] but also for advanced automotive antifreeze and many other aspects. However, alcohol-based liquids face fundamental limitations, like poor thermal conductivity. Therefore, nanofluids can overcome this defection by enhancing the thermal conductivity of the base fluid and increasing the heat transfer rate [23,24]. According to Maxwell’s theory [25], the thermal conductivity of a solid-liquid two-phase mixture has a great relationship with the thermal conductivity of solid particles. That is, the greater the thermal conductivity of the solid, the greater the thermal conductivity of the mixture. Compared with the commonly used spherical nanoparticles such as TiO2, CuO, Al2O3, and Fe3O4, carbon nanotubes have better heat transfer capability because of their unique cylindrical tubular structure, which can form pathways in solution [26–29], and it is feasible to add them as nanoparticles to alcohol-based liquids to improve thermal conductivity. Therefore, this paper’s research object is adding a propylene glycol-based MWCNT nanofluid with a unique tubular structure of carbon nanotubes to the propylene glycol-based solution.
Thermophysical properties of the nanofluids, such as thermal conductivity, and viscosity, are functions of nanofluid stability. Several studies have demonstrated that improving the stability of nanofluids can improve the thermal properties [30–33] and other properties [34] and that ultrasonic stirring [35], magnetic stirring, and surfactants are all methods to achieve this. Asadi et al. [36] investigated the effect of surfactants (CTAB, SDS, Oleic Acid) and sonication time on the stability of Mg(OH)2-water nanofluid over the different solid concentrations (0.1%, 0.2%, 0.4%, 0.8%, 1%, 1.5%, and 2%) and temperatures (25°C, 30°C, 35°C, 40°C, 45°C, 50°C). The results indicated that CTAB surfactant shows the best impact on the stability of the nanofluid applying 30-min sonication. Arun et al. [37] investigated the impact of nanofluid stabilization techniques on the stability and thermal conductivity of CeO2+MWCNT (80:20)/water-based hybrid nanofluid. Different kinds of charged surfactants, two anionics (sodium dodecyl benzene sulfonate (SDBS), sodium dodecyl sulphate (SDS)), two cationic (cetyltrimethylammonium bromide (CTAB), distearyl dimethylammonium chloride (DDC)), and two polymers (gum Arabic (GA), PVP (polyvinyl pyrrolidone)) have been added to the base fluid. The results of zeta potential analysis indicated that CTAB surfactant shows the best impact up to the 30th day. Zhai et al. [38] studied the effect of PVP (polyvinylpyrrolidone) and SDS (sodium dodecyl sulphate) surfactants on Al2O3–EG nanofluid. It was found that the highest stabilization and homogenization were obtained for PVP-used nanofluid. Xia et al. [39] experimentally investigated two kinds of surfactants—sodium dodecyl sulphate (SDS) and polyvinylpyrrolidone (PVP) on the stability and thermal conductivity of Al2O3/de-ionized water nanofluids. They found PVP to be a finer surfactant for improving stability more effectively. Therefore, in the first part of this paper, we will choose to compare the effects of the two dispersants, CTAB, and PVP, on the stability of propylene glycol-based MWCNT nanofluids.
Numerous techniques, including zeta potential measurement, agglomerate particle size analyzer, visual sedimentation, transmission electron microscopy, scanning electron microscopy, and ultraviolet-visible (UV-VIS) spectrophotometry, are classified to verify the dispersion of a nanosuspension. Among these methods, spectrophotometry analysis is the main important measurement numerically and visually. UV/Vis spectroscopy was used for assessing the stability of this paper due to its simplicity and effectiveness.
Design of experiments (DOE) is a tool to optimize the planning of experimental research [40]. The role of DOE is to estimate the effect of several variables separately, simultaneously, or as combinations. Response surface methodology (RSM) [41,42] is the product of a combination of mathematical methods, statistical analysis methods, and experimental design methods for modeling and analyzing the relationship between several input and response variables. The response surface method can be used to find the optimization region, build the response model of the optimization region, optimize or predict the response variables, and then optimize the experimental process and improve the performance of the response output. Emami et al. [43] optimized the removal efficiency and permeate flux behavior of Pb2+ aqueous solution in a nanofiltration process by response surface methodology (RSM), suggested model could predicate the removal efficiency and flux of Pb2+ in aqueous solution by using the nanofiltration process well [44]. RSM methods are used to predict MWCNT(30%)-TiO2 (70%)/SAE50 hybrid nano-lubricant. R2 in the proposed model by the RSM method for prediction of lnf was 0.9991, which shows the high accuracy of the correlation. The Box-Behnken Design [45] is a common design model. BBD has fewer design points, so they are less expensive to run. When it is impossible to experiment with the combination of factor levels represented by the vertices because the experiment is too expensive or because of practical constraints, this design shows its unique advantages, which can reduce the cost and time of conducting experiments. In summary, in this experiment, firstly, the dispersant that can better improve the stability of carbon nanotube nanofluid was experimentally selected. Then the parameters affecting the absorbance (SN ratio, carbon nanotube mass concentration, sonication time) were investigated using the BBD model.
There are few studies related to nanofluids using propylene glycol as a base fluid. In a temperature range of 20°C to 80°C, Dong et al. [46] investigated graphene nanofluids based on 60 wt% propylene glycol and 40% deionized water. Using a 60:40 mixture of propylene glycol and water as the base fluid, Satti et al. [47] analyzed five spherical nanoparticle nanofluids at −30°C to 90°C. There are few kinds of literature related to the study of non-spherical nanoparticles using propylene glycol as the base fluid, and there are relatively fewer studies related to nanofluids using 100% propylene glycol as the base fluid. In this paper, we choose 100% propylene glycol as the base fluid for the study of propylene glycol-based MWCNT nanofluids. After exploring the effects of two different dispersants on the stability of nanofluids, we chose the response surface methodology to conduct a more in-depth analysis of the factors affecting the stability of propylene glycol-based MWCNT nanofluids. In studying the influence of each parameter on nanofluid stability, both MWCNT concentration and MWCNT to dispersant mass ratio (SN ratio) are chosen as two different influencing factors in this paper, which can explore the relationship between MWCNT to dispersant mass ratio under different nanoparticle concentration conditions. After the optimization results are obtained, five sets of experiments will be used in this paper to verify the accuracy of the optimization results, and samples with higher stability will be selected to measure their viscosity and thermal conductivity, and it is worth noting that considering the practical applications, the thermal conductivity of the samples at lower temperatures outside the measurement range of most studies will be measured in this paper.
In summary, stability experiments were conducted in the second part of this paper, and the visual sedimentation method and UV spectrophotometer method were used to verify and compare the effects of two dispersants on the stability of nanofluids, and suitable dispersant was selected for the third part of the experiments. In the third part, the response surface methodology (RSM) was used to investigate the influence of three influencing factors on the stability of propylene glycol-based MWCNT nanofluids and the interaction between the three influencing factors, and the BBD model was used to optimize the stability of propylene glycol-based MWCNT nanofluids and to experimentally validate the optimization results. In the fourth part, stability tests and viscosity and thermal conductivity measurements at low temperatures are performed for the validation experiments in the third part.
2.1 Selection of Experimental Materials and Apparatus
Materials: multi-walled carbon nanotubes (10–20 nm in diameter and 10–30 um in length, purity ≥99.9%) (MWCNT); 1,2-propanediol (analytical purity); two surfactants, Cetyltrimethylammonium Bromide (CTAB) and polyvinyl pyrrolidone (PVP), are cheap and accessible, and it is also possible to improve the stability.
Equipment: Electronic analytical balance (AR2140 type); Ultrasonic cleaner (KQ-300GDV); Magnetic stirrer (HH-2 type); UV spectrophotometer.
Our nanofluid is based on a non-toxic, non-odorous, green, propylene glycol, and the nanoparticles are MWCNT with good thermal conductivity. As for the preparation of surfactant-added nanofluids, the well-known two-step method is used, which involves adding dispersants (CTAB, PVP) to 0.05% MWCNT nanofluids before stirring magnetically for 15 min and ultrasonically for 2 h, then, removing the beaker.
2.3.1 Visual Sedimentation Method
The sedimentation photographs at different time intervals for CTAB and PVP-added nanofluids are shown in Figs. 1a, 1b. Fig. 1a shows the initial state, and an obvious comparison can be seen in Fig. 1b after seven days. The nanoparticle of the nanofluid with CTAB dispersant is completely precipitated after seven days, indicating limited stability, while the nanofluid with PVP dispersant is not significantly different from the initial state. The sedimentation experiment results on nanofluids show that the propylene glycol-based MWCNT nanofluid with PVP may be more stable.
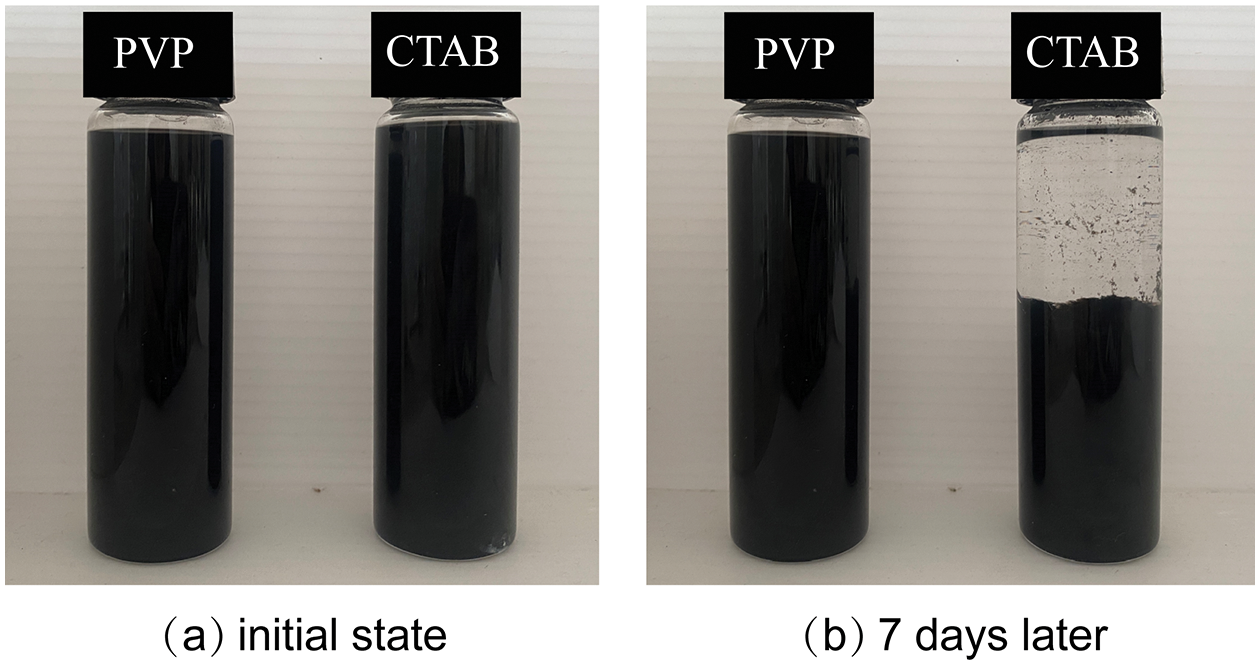
Figure 1: Sedimentation photography of MWCNT nanofluids with different dispersants
2.3.2 UV Spectrophotometer Measurement Method
Since the visual sedimentation method can only qualitatively analyze part of the stability experiments of nanofluids, this paper further quantifies the effect of two surfactants on nanofluid stability using the UV spectrophotometer measurement method. The absorbance reflects the concentration of the upper part of the sample. The higher the concentration of the upper part of the sample, the higher the absorbance and the more stable the suspension.
The absorbance of nanofluids with CTAB and PVP for seven days is shown in Fig. 2. The absorbance of CTAB-added propylene glycol-based MWCNT nanofluid decreased by 36.2 percent after seven days, while the absorbance of PVP-added nanofluid decreased by 9.2 percent after seven days. The decrease in absorbance of CTAB-added nanofluid was more significant and faster than that of PVP-added nanofluid.
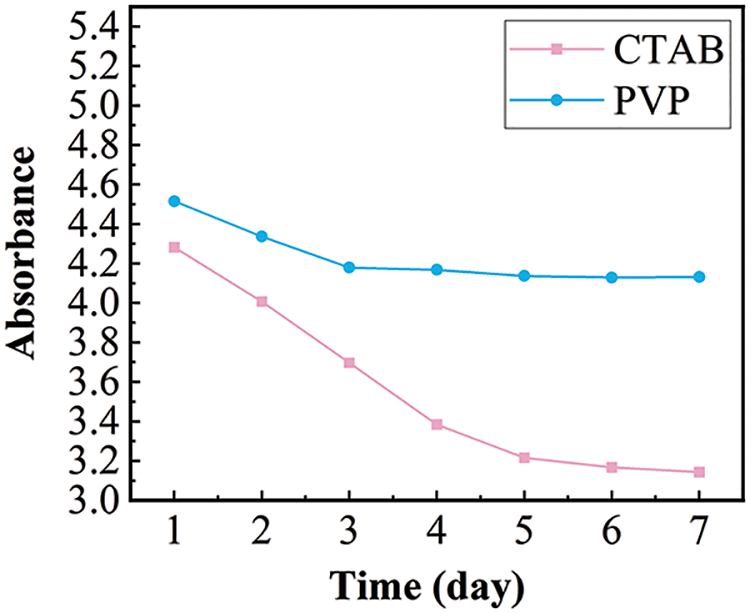
Figure 2: Absorbance of MWCNT nanofluids with different dispersants
Combining sedimentation and absorbance measurements, propylene glycol-based MWCNT nanofluid with PVP showed better stability, so PVP was selected as the dispersant for the experiments in Part III.
3 Surface Response Method for Optimizing the Stability of Nanofluids
3.1 Experimental Setup and Experimental Results
Using Response Surface Methodology (RSM), one can reduce the number of experiments and generate more informative data, study how several factors interact, and optimize test conditions to improve performance. And identifying the influencing factors is the first step. We selected carbon nanotube mass concentration (concentration range 0.05%–0.1%), SN ratio, i.e., MWCNT and dispersant mass ratio (range 0.5–2), and sonication time as influencing factors. Many studies [48,49] have shown that increasing sonication time has a positive effect on nanofluid stability, but the range of studies is generally between 0–1.5 h, so the sonication time range selected for this study was 2–3 h. We optimized the nanofluid preparation conditions using the response surface method, which used absorbance as the response value. This experiment used the Box-Behnken Design (BBD) of the Response Surface Method. The Design-Expert software generated the test form based on the data entered. Follow the interactive trial protocol and get the results. The test protocols and test results are shown in Table 1.

BBD is one of the most commonly used response surface designs. By statistically analyzing the experimental data, an approximate functional relationship can be identified between the design variables and response factors, the second-order multivariate equation used in this study is as follows:
where: Y is the calculated response;
3.2 Results and Regression Analysis
Design-Expert found the following relationship between absorbance and variables based on multiple quadratic regression.
The variance analysis results of Eq. (2) are listed in Table 2. The F-value indicates the significance of the whole fitted regression equation, and a larger F-value means that the equation is more significant, and the fit is better. Model F-value was 47.95, showing significance. p-value less than 0.0001 indicates that the model error is less than 0.01%, which is statistically highly significant. (Lack of fit) p = 0.3232 > 0.05, not significant, indicates that the loss of relevant factors in the optimization test process has a negligible result, and the model has high reliability. After ANOVA, the order of the three influencing factors on the absorbance was A(MWCNT concentration) > B(SN ratio) > C(sonication time). MWCNT concentration and SN ratio had a more significant effect on absorbance, and sonication time had no significant effect on absorbance within the experimental range (2–3 h).

The relationship between the actual and predicted values of the optimization test is shown in Fig. 3. The points in Fig. 3 are the experimental data of absorbance, basically distributed on the straight line of the predicted values. This indicates that the fit is high, and the prediction of the response surface optimization model is accurate and reliable; As shown in Table 3, correlation coefficient
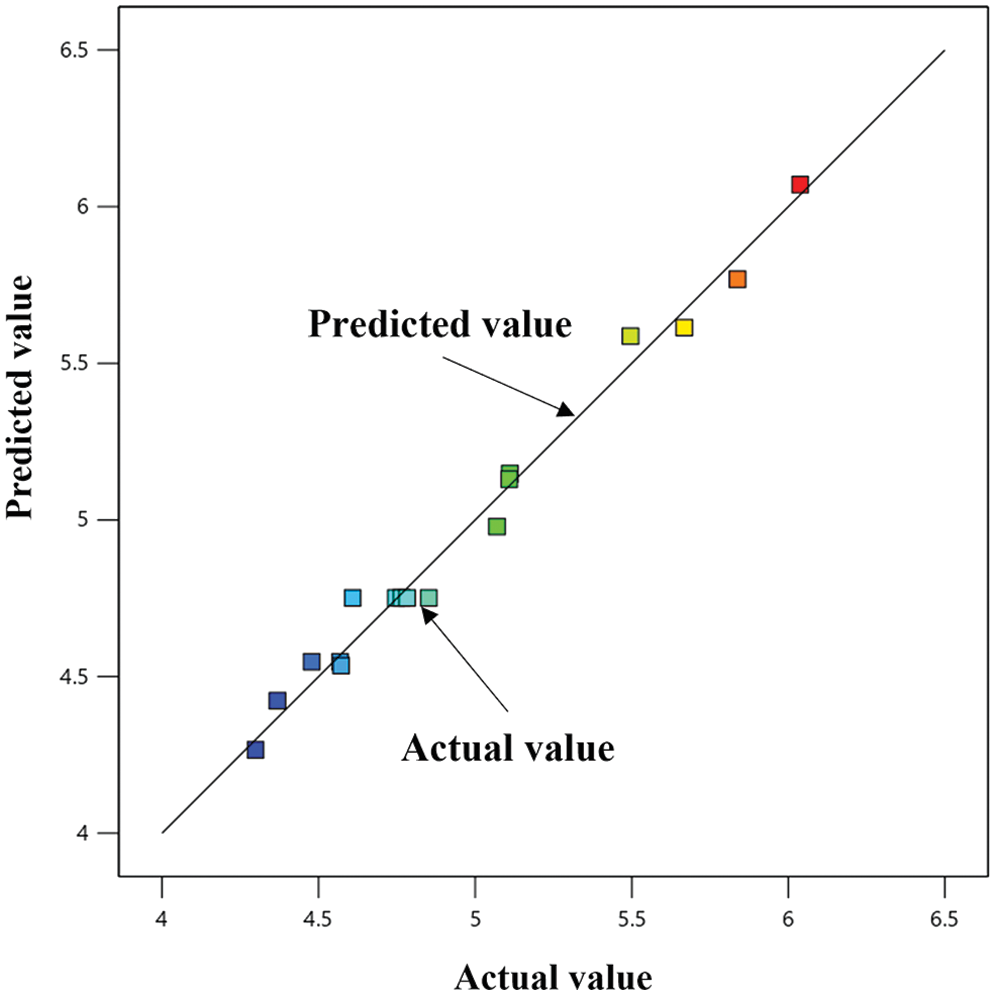
Figure 3: Fitted graph of experimental data

3.3 Analysis of Parameters on Responses
Fig. 4 shows the single-factor effects of MWCNT nanoparticle concentration, SN ratio, and sonication duration between 2 and 3 h on absorbance. According to Fig. 4a, absorbance increases with MWCNT nanoparticle concentration and reaches the maximum value when the MWCNT concentration reaches 0.1% of the maximum value in the experimental range. Fig. 4b shows the effect of sonication time on absorbance, from which it can be seen that the line tends to be horizontal in the experimental range, and it is known that sonication time within 2 to 3 h has no significant effect on absorbance. Fig. 4c shows the effect of the SN ratio on absorbance. In the experimental range, as the ratio of MWCNT to PVP addition becomes larger, the absorbance becomes smaller.
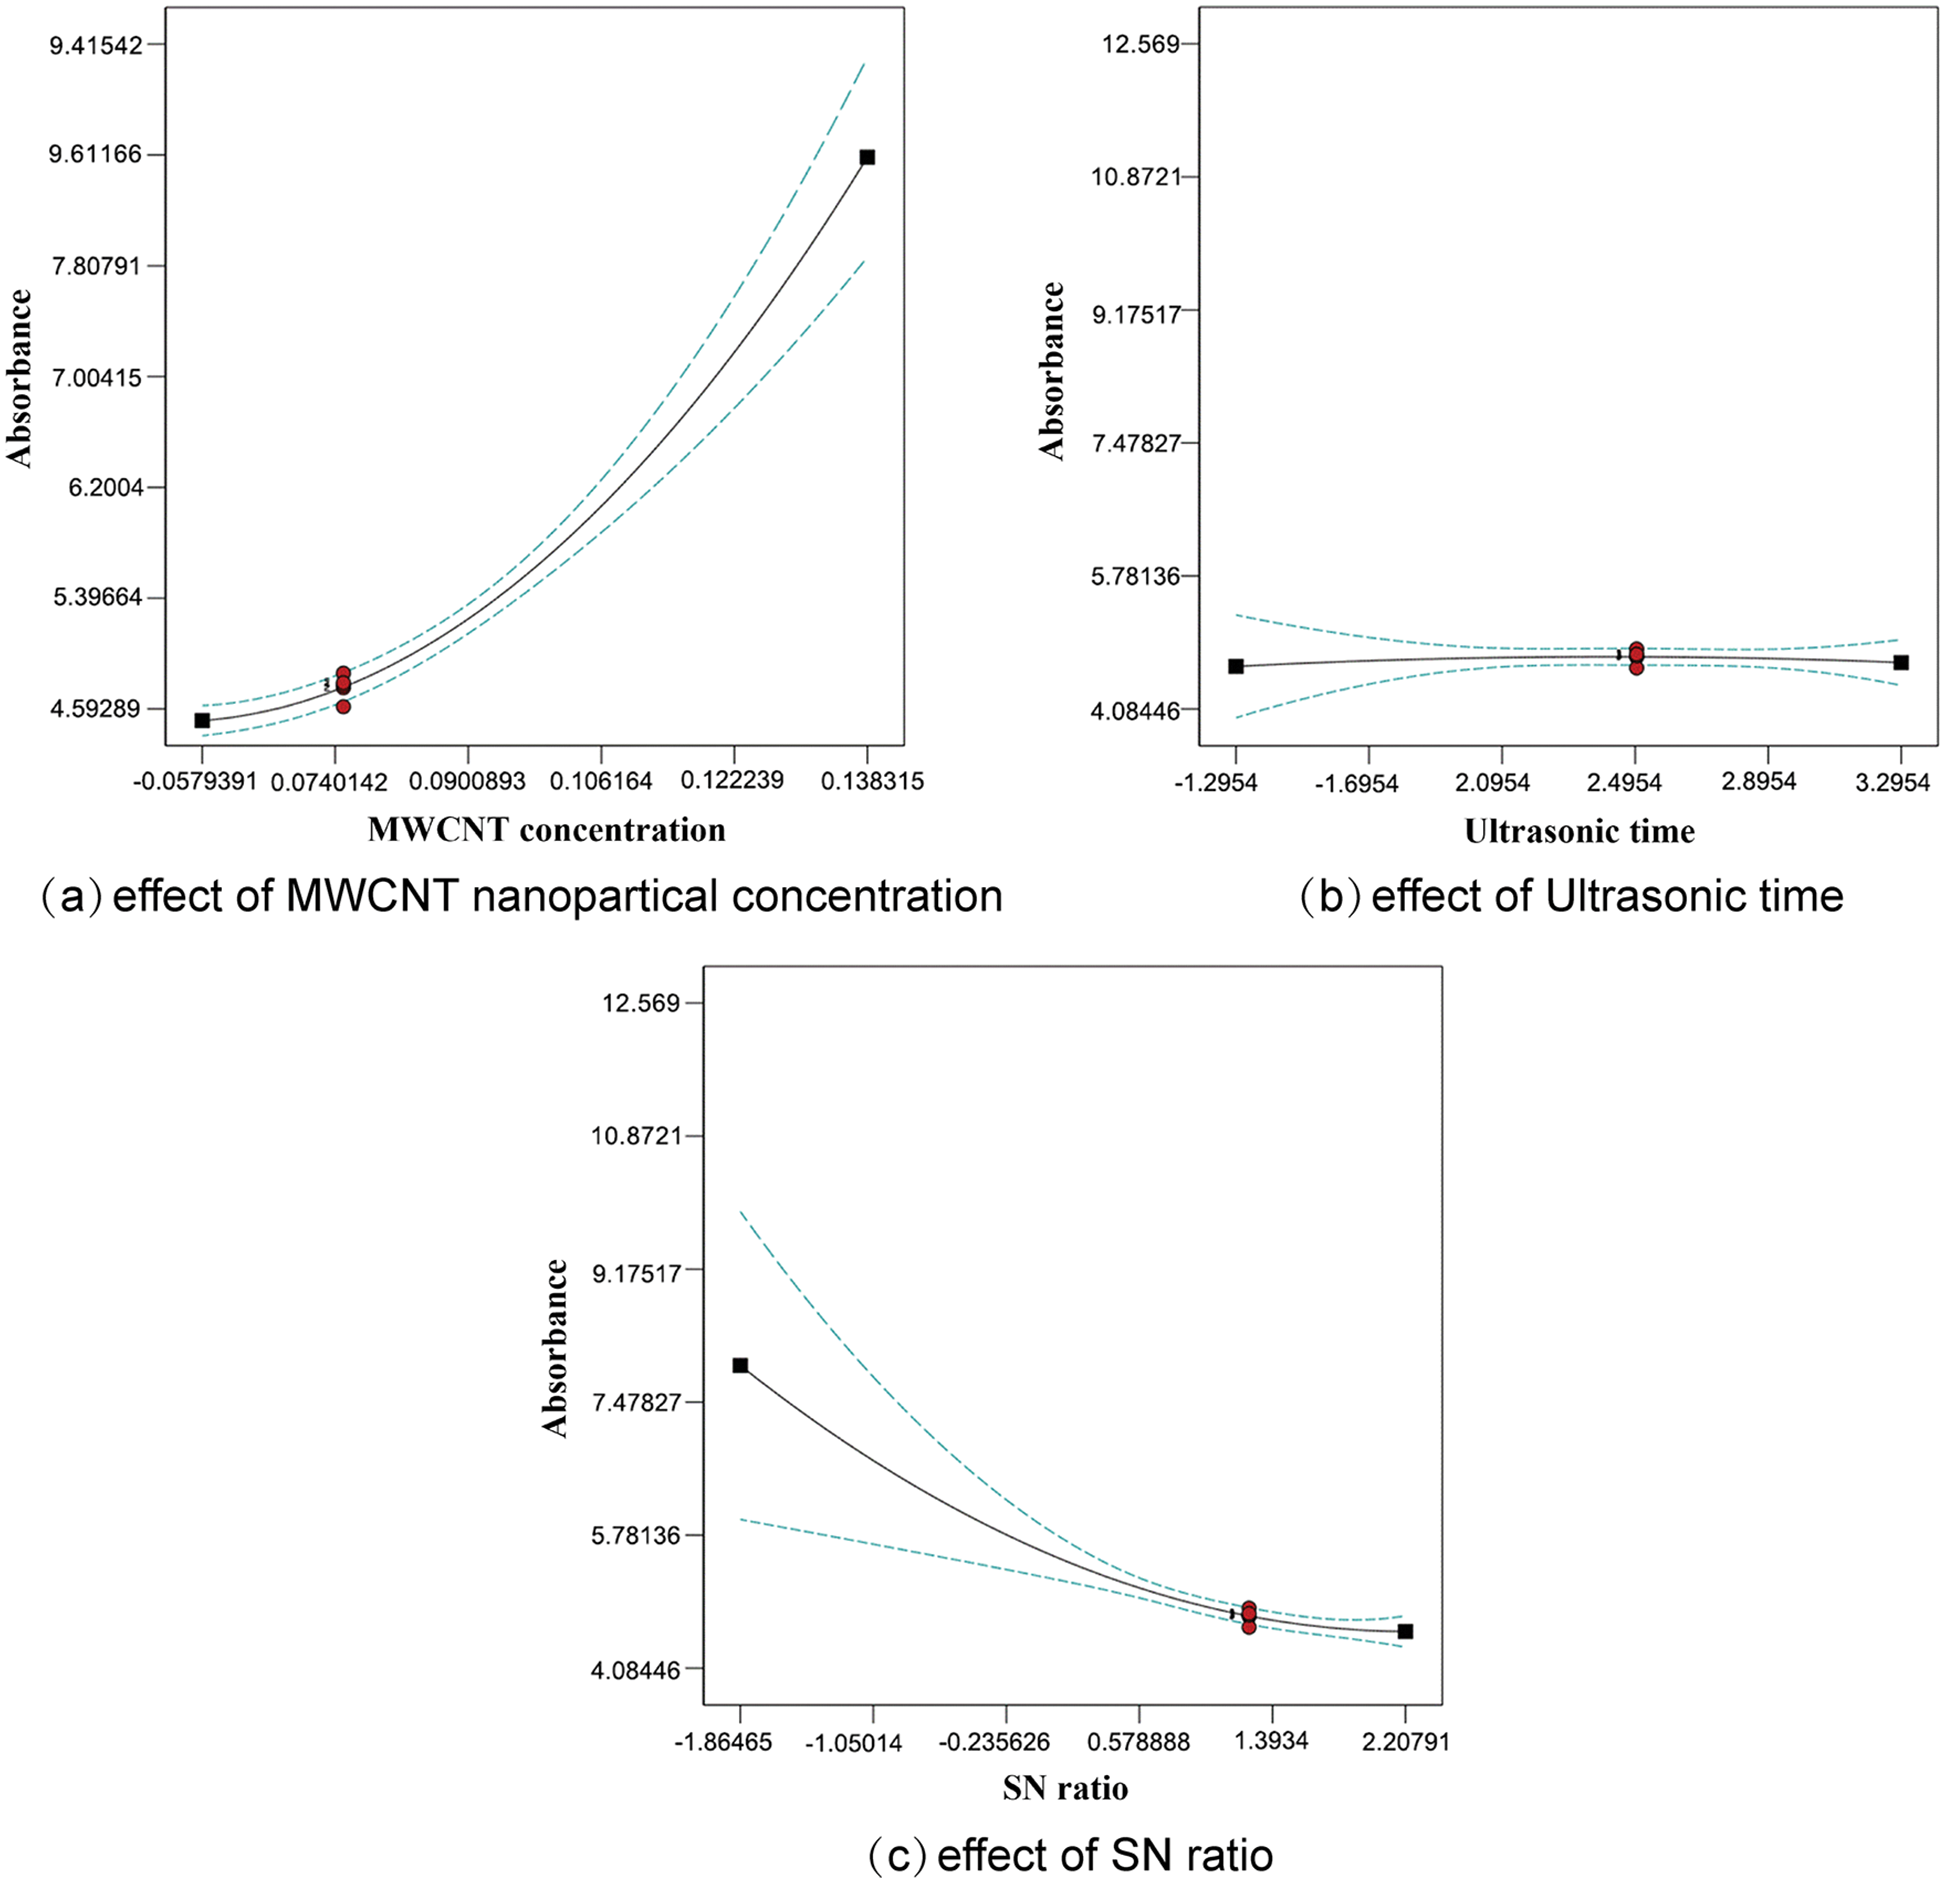
Figure 4: Effect of single factor on absorbance
The ANOVA results showed that the effect size of the interaction is: AB > AC > BC. The interaction between MWCNT concentration and SN ratio is shown in Fig. 5a, and it can be seen that the curves are not parallel, and there is a tendency for the curves of different SN ratios to intersect under the variation of MWCNT concentration, indicating a non-significant interaction between AB; The interaction plot between MWCNT concentration and sonication time is shown in Fig. 5b The curves for different ultrasonic times are almost parallel, and the interaction between the two is smaller than the interaction between AB; The interaction between SN ratio and ultrasonic time is shown in Fig. 5c. The two curves almost overlap, and the interaction between BC is smaller than that between AC, i.e., AB > AC > BC, which is consistent with the above conclusion.
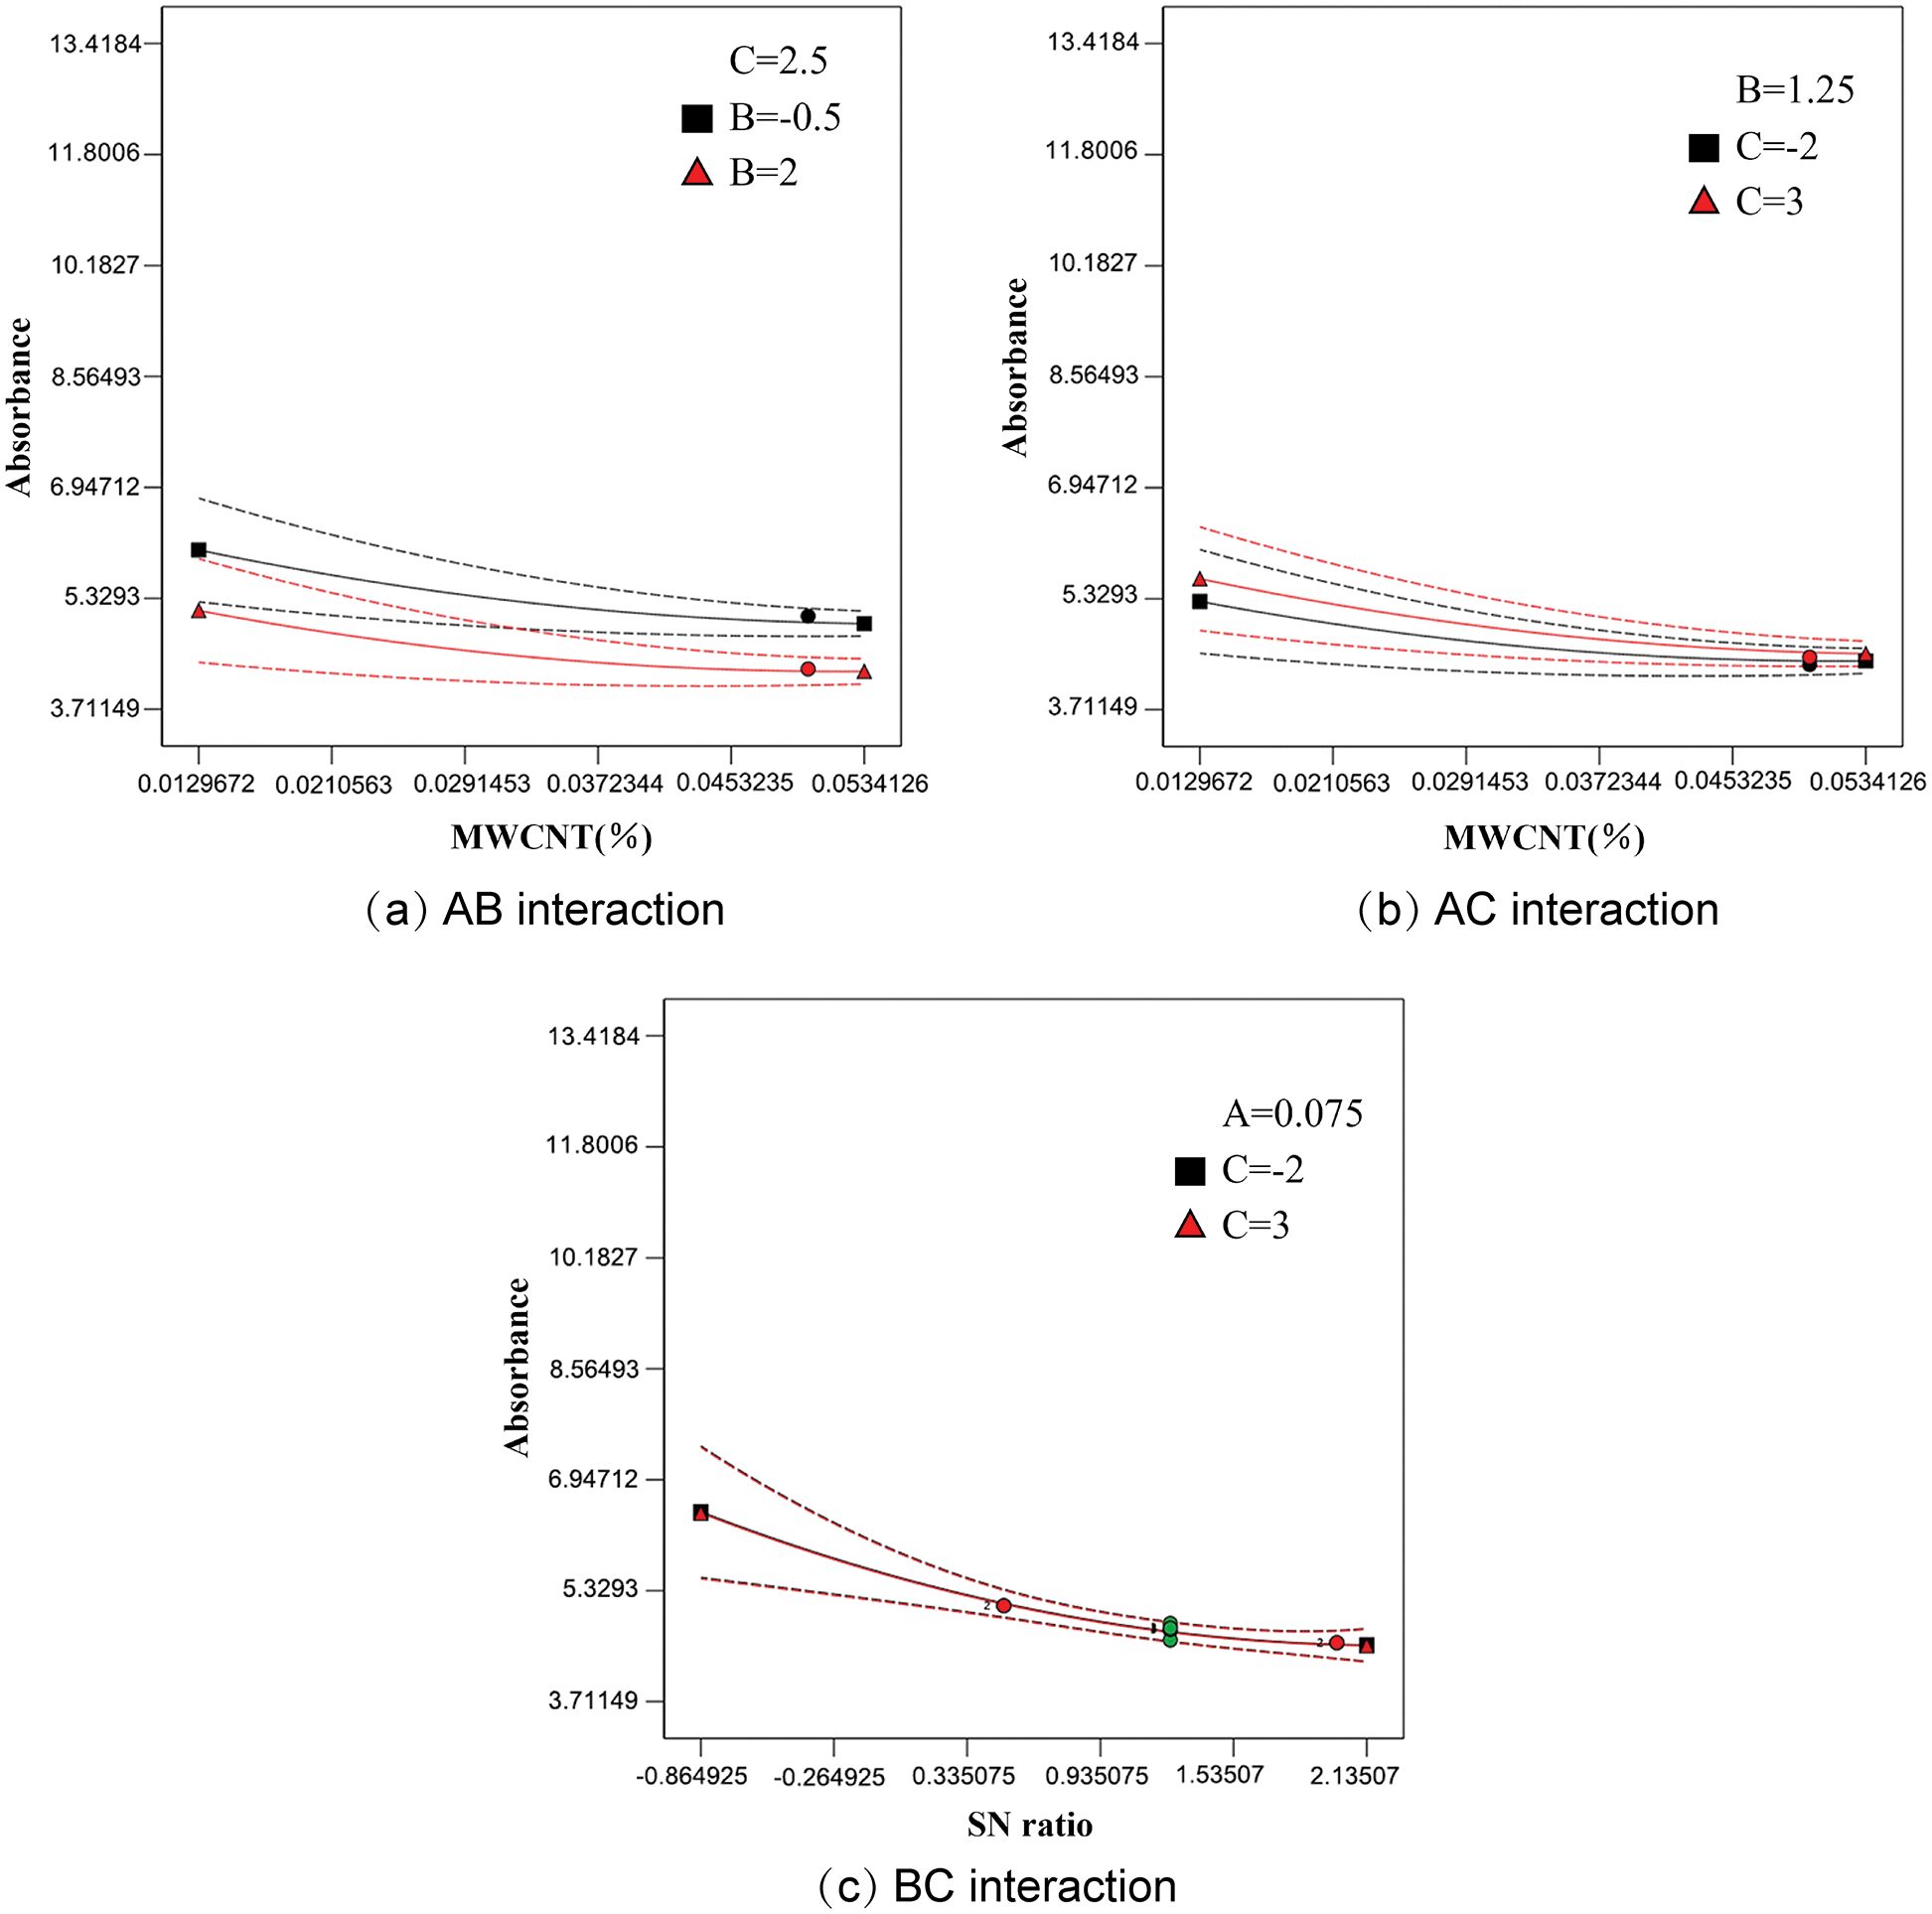
Figure 5: The interaction between the factors
A contour plot of the interaction between factors on absorbance simulated from the model regression equation shows the response surface in Figs. 6a–6c, where the colour shade represents the absorbance size, and blue to red indicates the increase in absorbance. In response surface graphical analysis, an elliptical contour indicates an interaction between the two factors, while a circular shape indicates a little interaction between the two factors. MWCNT concentration and SN ratio are plotted in Fig. 6a. The elliptical shape of the contour lines indicates that there is some interaction between the two. Fig. 6b shows the response surface of MWCNT concentration and sonication time. As can be seen from the figure, when the MWCNT concentration was kept constant, the sonication time had no significant effect on the absorbance, and the absorbance became larger with the increase of MWCNT concentration. Fig. 6c shows the response surface of ultrasonic time and SN ratio. Again, the sonication time has no significant effect on the absorbance. In the studied range, absorbance increases with decreasing SN ratio and obtains a maximum of 0.5. In line with the above findings.
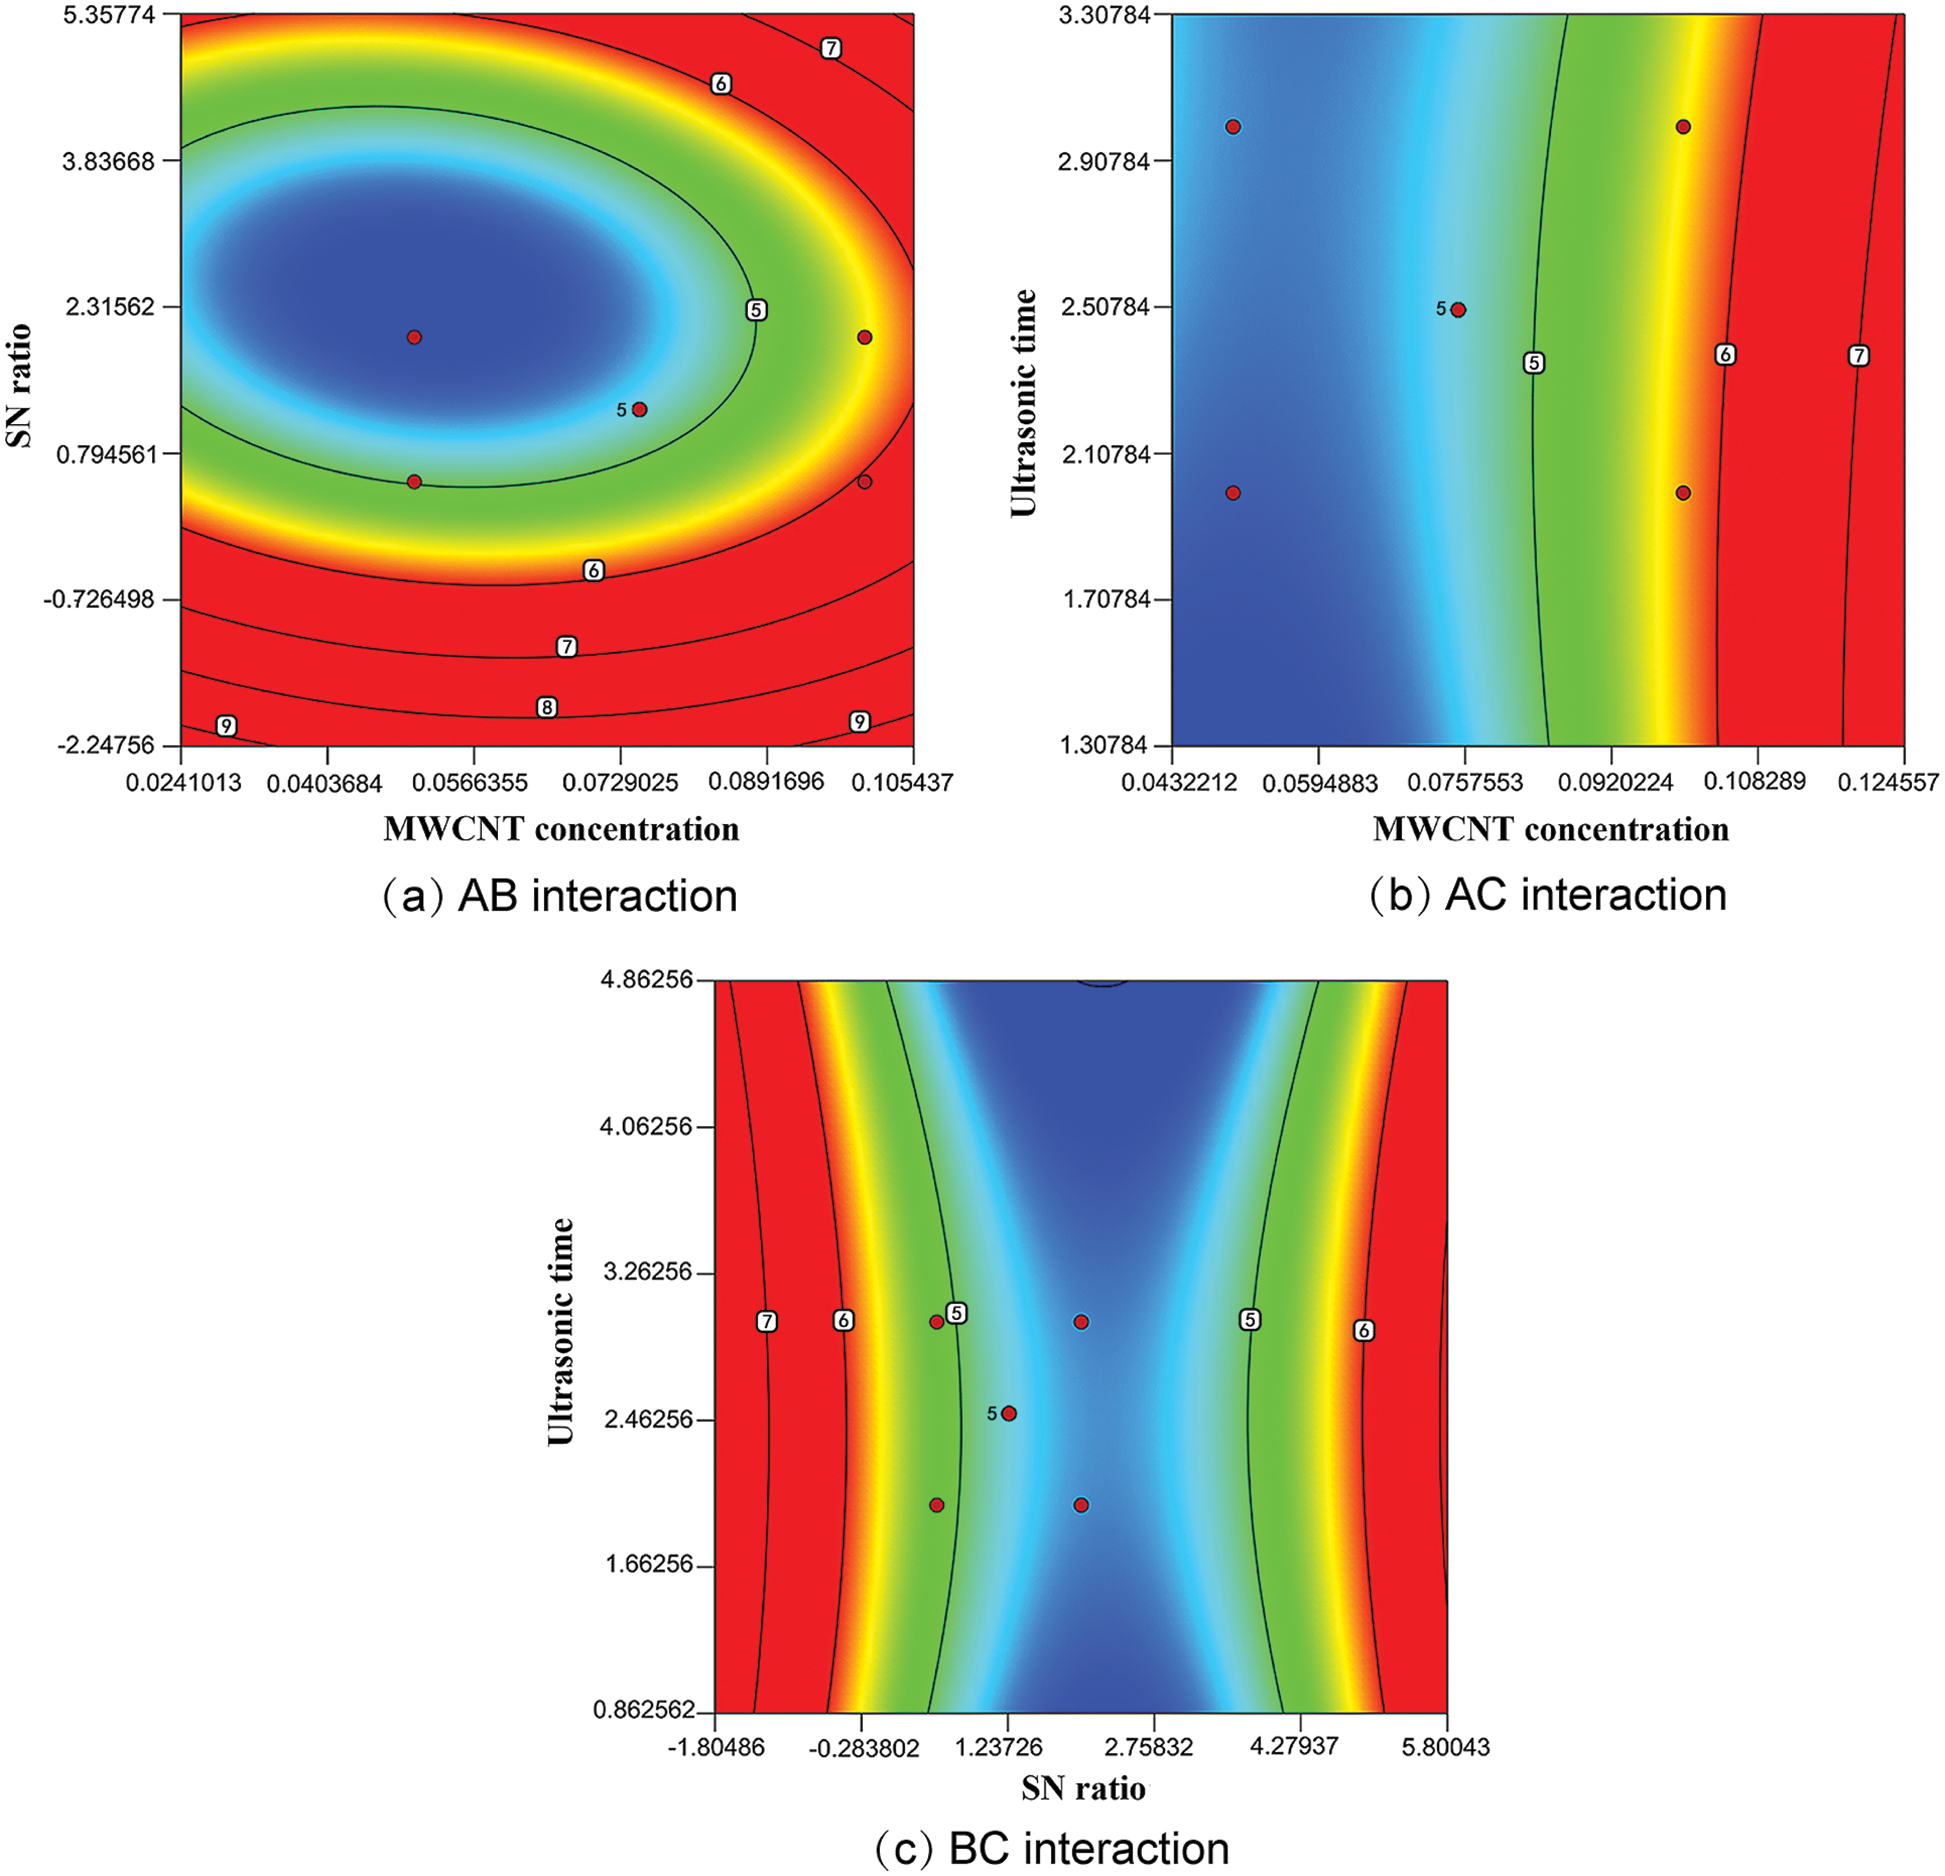
Figure 6: Absorbance contour plot under the interaction of factors
To optimize the stability of propylene glycol-based carbon nanotube nanofluids, numerical optimization with Design-Expert was used to determine the optimum parameters: MWCNT concentration of 0.1%, SN ratio of 0.5, sonication time of 2.5 h, and a predicted absorbance value of 6.071. In order to verify these results, we conducted several sets of experiments under these conditions. Here are the results.
Table 4 shows that the average experimental value of 6.14, which is less different from the predicted value under optimal conditions, in which the error between them is only

Since the absorbance of sample 2 was the largest, it was chosen to monitor the stability over seven days. Fig. 7 shows the change in absorbance of sample 2 in seven days. Throughout seven days, the absorbance decreased less and remained above 6, and sample 2 remained stable.
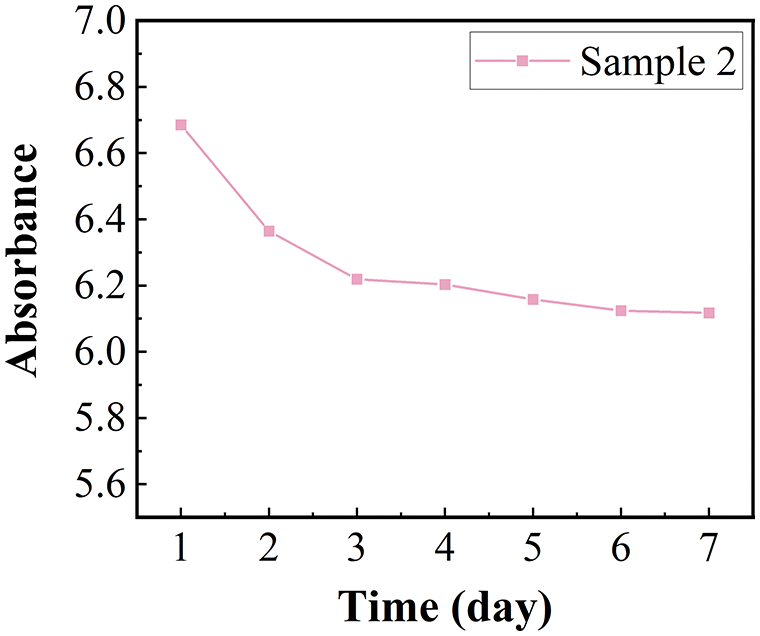
Figure 7: Absorbance for sample 2 in 7 days
Thermal conductivity is evaluated using a constant thermal analyzer of Hot Disk TPS 3500. Dynamic viscosity is measured by a viscometer (Type of SCYN1302, China). All the measurements are made within the temperature variation of ±1°C and taken at least three times to calculate the mean value. The uncertainty of dynamic viscosity and thermal conductivity measurements is determined as follows [50,51]:
where,
Figs. 8 and 9 compare the viscosity and thermal conductivity of pure PG, sample 2, and 0.1% MWCNT nanofluid (The preparation conditions were the same as sample 2 except that no dispersant was added).
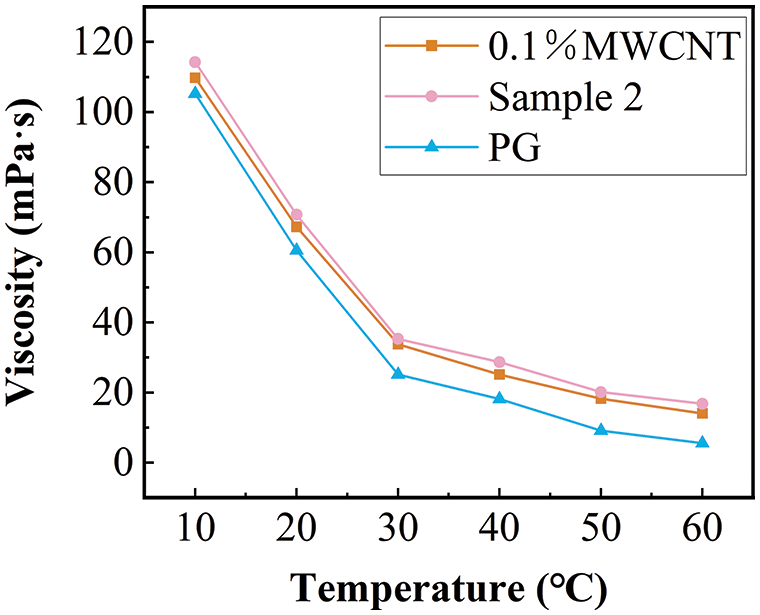
Figure 8: The comparison of the viscosity of sample 2 with base fluid and 0.1% propylene glycol-based MWCNT nanofluid
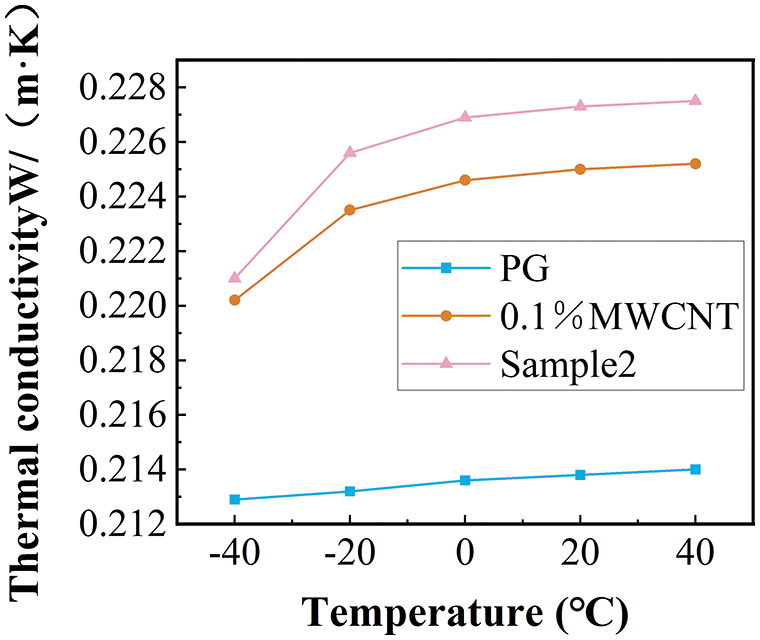
Figure 9: The comparison of the conductivity of sample 2 with base fluid and 0.1% propylene glycol-based MWCNT nanofluid
The viscosity decreases gradually with the increase in temperature. The addition of nanoparticles increases the viscosity of the base fluid. The viscosity growth rate of sample 2 relative to 0.1wt % propylene glycol MWCNT nanofluid increased with the increase in temperature, and the maximum increase was 19.5% within the measurement range (Fig. 8). Fig. 9 shows a comparison of the measured results of thermal conductivity. The 0.1% propylene glycol-based MWCNT nanofluid showed a significant increase in thermal conductivity compared to the PG. Fig. 10 shows the comparison of the enhancement of thermal conductivity enhancement in other related research [52]. At the same temperature, the thermal conductivity of 1% mass concentration propylene glycol-based Al2O3 nanofluid increased by less than 4%, and the thermal conductivity of 1% mass concentration propylene glycol-based TiO2 nanofluid increased by less than 1% compared with the pure base fluid. In contrast, the thermal conductivity of the nanofluid studied in this paper with a mass concentration of only 0.1% increased by 5.23 percent. Adding MWCNT nanoparticles to the propylene glycol base fluid proved to be more beneficial than adding TiO2 and Al2O3 nanoparticles in improving the thermal conductivity of the PG. Overall higher enhancement of thermal conductivity at low temperatures. The thermal conductivity of sample 2 was increased by a maximum of 1.02% compared to the 0.1% MWCNT nanofluid. The addition of dispersants not only improves nanofluid stability but also improves the thermal conductivity of nanofluids.
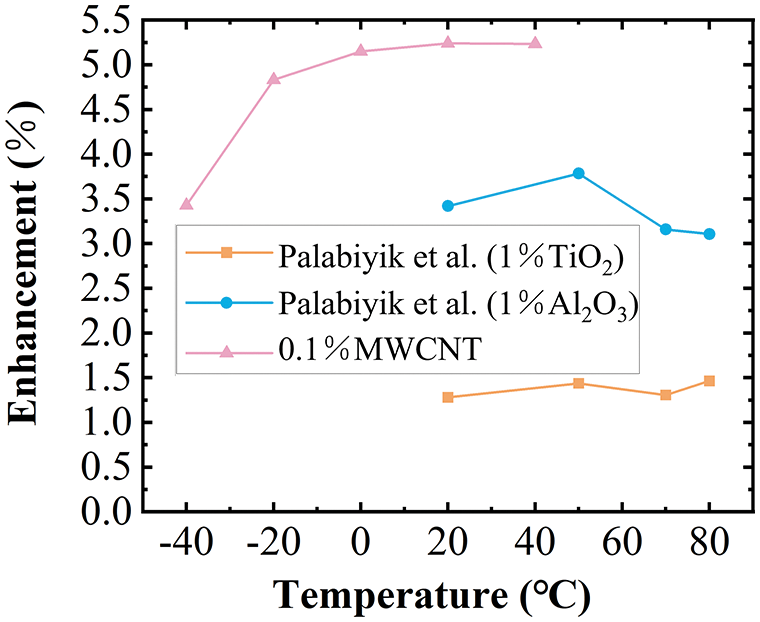
Figure 10: Validation of experimental results of enhanced thermal conductivity with previous studies
Propylene glycol-based MWCNT nanofluids were produced in two steps, and their stability was assessed by adding CTAB and PVP. The comparison found that PVP has a better ability to improve stability than CTAB, and PVP will be used in the following parts. A statistical approach with RSM coupled with ANOVA was utilized to forecast the absorbance of propylene glycol-based MWCNT nanofluids. The main results of the current study are as below:
• BBD model is simple and efficient. Results of ANOVA on the proposed experiments by BBD confirmed that the maximum absorbance occurs when the concentration of MWCNT is at its high level, the SN ratio is at its low level, there was some interaction between the two compared to other, and the sonication time has less influence on absorbance between 2–3 h.
• Also, it was found that the R-squared (R2) and adjusted R-squared (R2-adj) were 0.9840 and 0.9635, respectively, reflecting the accuracy of the developed model with the RSM model. ANOVA method showed that the results obtained with the developed correlation are significant.
• Optimization results was checked with additional five sets of experiments, and the error did not exceed 0.11 percent, showing the model can predict the absorbance of propylene glycol-based MWCNT nanofluids. The results confirmed that the model could predict with a high accuracy level. The stability of sample 2 with higher absorbance was monitored and performed well within seven days.
• Sample 2 viscosity study showed that the nanofluid viscosity decreased with increasing temperature. At the same temperature, the viscosity of sample 2 is larger than 0.1% MWCNT nanofluid, and the viscosity of 0.1% MWCNT nanofluid is larger than PG, and the rate of increase as the temperature rises.
• The addition of MWCNT nanoparticles was found to be more effective in improving the thermal conductivity of PG by comparing it with other related literature. And the nanofluid has a better ability to improve thermal conductivity at low temperatures. The comparison of the thermal conductivity of sample 2% and 0.1% MWCNT illustrates that adding a dispersant is conducive to improving the stability of the sample and the thermal conductivity.
Funding Statement: This research is financially supported by the National Natural Science Foundation of China under Contract (No. 51966005).
Conflicts of Interest: The authors declare that they have no conflicts of interest to report regarding the present study.
References
1. Choi, S. U., Eastman, J. A. (1995). Enhancing thermal conductivity of fluids with nanoparticles. Argonne, IL (USAArgonne National Lab (ANL). [Google Scholar]
2. Khanafer, K., Vafai, K. (2018). A review on the applications of nanofluids in solar energy field. Renewable Energy, 123(34), 398–406. https://doi.org/10.1016/j.renene.2018.01.097 [Google Scholar] [CrossRef]
3. Mostafazadeh, A., Toghraie, D., Mashayekhi, R., Akbari, O. A. (2019). Effect of radiation on laminar natural convection of nanofluid in a vertical channel with single-and two-phase approaches. Journal of Thermal Analysis and Calorimetry, 138(1), 779–794. https://doi.org/10.1007/s10973-019-08236-2 [Google Scholar] [CrossRef]
4. Mashayekhi, R., Khodabandeh, E., Akbari, O. A., Toghraie, D., Bahiraei, M. et al. (2018). CFD analysis of thermal and hydrodynamic characteristics of hybrid nanofluid in a new designed sinusoidal double-layered microchannel heat sink. Journal of Thermal Analysis and Calorimetry, 134(3), 2305–2315. https://doi.org/10.1007/s10973-018-7671-3 [Google Scholar] [CrossRef]
5. Arasteh, H., Mashayekhi, R., Goodarzi, M., Motaharpour, S. H., Dahari, M. et al. (2019). Heat and fluid flow analysis of metal foam embedded in a double-layered sinusoidal heat sink under local thermal non-equilibrium condition using nanofluid. Journal of Thermal Analysis and Calorimetry, 138(2), 1461–1476. https://doi.org/10.1007/s10973-019-08168-x [Google Scholar] [CrossRef]
6. Xiao, J. B., Yan, H. J., Schubert, M., Unger, S., Liu, L. et al. (2019). Effect of nozzle geometry on pressure drop in submerged gas injection. Journal of Central South University, 26(8), 2068–2076. https://doi.org/10.1007/s11771-019-4154-z [Google Scholar] [CrossRef]
7. Gallego, A., Cacua, K., Herrera, B., Cabaleiro, D., Pineiro, M. M. et al. (2020). Experimental evaluation of the effect in the stability and thermophysical properties of water-Al2O3 based nanofluids using SDBS as dispersant agent. Advanced Powder Technology, 31(2), 560–570. https://doi.org/10.1016/j.apt.2019.11.012 [Google Scholar] [CrossRef]
8. Chopkar, M., Sudarshan, S., Das, P. K., Manna, I. (2008). Effect of particle size on thermal conductivity of nanofluid. Metallurgical and Materials Transactions A, 39, 1535–1542. https://doi.org/10.1007/s11661-007-9444-7 [Google Scholar] [CrossRef]
9. Aberoumand, S., Jafarimoghaddam, A. (2017). Experimental study on synthesis, stability, thermal conductivity and viscosity of Cu-engine oil nanofluid. Journal of the Taiwan Institute of Chemical Engineers, 71(8), 315–322. https://doi.org/10.1016/j.jtice.2016.12.035 [Google Scholar] [CrossRef]
10. Aberoumand, S., Jafarimoghaddam, A., Moravej, M., Aberoumand, H., Javaherdeh, K. (2016). Experimental study on the rheological behavior of silver-heat transfer oil nanofluid and suggesting two empirical based correlations for thermal conductivity and viscosity of oil based nanofluids. Applied Thermal Engineering, 101(1), 362–372. https://doi.org/10.1016/j.applthermaleng.2016.01.148 [Google Scholar] [CrossRef]
11. Bazdar, H., Toghraie, D., Pourfattah, F., Akbari, O. A., Nguyen, H. M. et al. (2020). Numerical investigation of turbulent flow and heat transfer of nanofluid inside a wavy microchannel with different wavelengths. Journal of Thermal Analysis and calorimetry, 139(3), 2365–2380. https://doi.org/10.1007/s10973-019-08637-3 [Google Scholar] [CrossRef]
12. Fazeli, I., Sarmasti Emami, M. R., Nazeri, M. H. (2021). Comparing the effect of single and mixture surfactants on the improvement in stability and thermal conductivity of CuO nanofluid: An experimental study. Journal of Thermal Analysis and Calorimetry, 146(2), 967–980. [Google Scholar]
13. Li, X., Chen, Y., Mo, S. P., Jia, L. S., Shao, X. F. (2014). Effect of surface modification on the stability and thermal conductivity of water-based SiO2-coated graphene nanofluid. Thermochimica Acta, 595, 6–10. https://doi.org/10.1016/j.tca.2014.09.006 [Google Scholar] [CrossRef]
14. Sarsam, W. S., Amiri, A., Zubir, M. N. M., Yarmand, H., Kazi, S. N. et al. (2016). Stability and thermophysical properties of water-based nanofluids containing triethanolamine-treated graphene nanoplatelets with different specific surface areas. Colloids and Surfaces A–Physicochemical and Engineering Aspects, 500, 17–31. https://doi.org/10.1016/j.colsurfa.2016.04.016 [Google Scholar] [CrossRef]
15. Esfahani, M. R., Languri, E. M., Nunna, M. R. (2016). Effect of particle size and viscosity on thermal conductivity enhancement of graphene oxide nanofluid. International Communications in Heat and Mass Transfer, 76, 308–315. https://doi.org/10.1016/j.icheatmasstransfer.2016.06.006 [Google Scholar] [CrossRef]
16. Saidur, R., Kazi, S. N., Hossain, M. S., Rahman, M. M., Mohammed, H. A. (2011). A review on the performance of nanoparticles suspended with refrigerants and lubricating oils in refrigeration systems. Renewable & Sustainable Energy Reviews, 15(1), 310–323. https://doi.org/10.1016/j.rser.2010.08.018 [Google Scholar] [CrossRef]
17. Celen, A., Cebi, A., Aktas, M., Mahian, O., Dalkilic, A. S. et al. (2014). A review of nanorefrigerants: Flow characteristics and applications. International Journal of Refrigeration-Revue Internationale Du Froid, 44(1), 125–140. https://doi.org/10.1016/j.ijrefrig.2014.05.009 [Google Scholar] [CrossRef]
18. Zhai, Y., Li, L., Xuan, Z., Ma, M., Wang, H. (2022). Experimental performance evaluation and artificial-neural-network modeling of ZnO-CuO/EG-W hybrid nanofluids. Fluid Dynamics & Materials Processing, 18(3), 629–646. https://doi.org/10.32604/fdmp.2022.017485 [Google Scholar] [CrossRef]
19. Satti, J. R., Das, D. K., Ray, D. R. (2016). Measurements of densities of propylene glycol-based nanofluids and comparison with theory. Journal of Thermal Science and Engineering Applications, 8(2), 021021. https://doi.org/10.1115/1.4032671 [Google Scholar] [CrossRef]
20. Vajjha, R. S., Das, D. K. (2009). Experimental determination of thermal conductivity of three nanofluids and development of new correlations. International Journal of Heat and Mass Transfer, 52(21–22), 4675–4682. https://doi.org/10.1016/j.ijheatmasstransfer.2009.06.027 [Google Scholar] [CrossRef]
21. Vajjha, R. S., Das, D. K., Mahagaonkar, B. M. (2009). Density measurement of different nanofluids and their comparison with theory. Petroleum Science and Technology, 27(6), 612–624. https://doi.org/10.1080/10916460701857714 [Google Scholar] [CrossRef]
22. ASHRAE (2009). Physical properties of secondary coolants (brines). ASHRAE Handbook. American Society of Heating Refrigerator and Air Conditioning Engineers, Inc. [Google Scholar]
23. Shah, S. N. A., Shahabuddin, S., Sabri, M. F. M., Salleh, M. F. M., Ali, M. A. et al. (2020). Experimental investigation on stability, thermal conductivity and rheological properties of rGO/ethylene glycol based nanofluids. International Journal of Heat and Mass Transfer, 150, 118981. https://doi.org/10.1016/j.ijheatmasstransfer.2019.118981 [Google Scholar] [CrossRef]
24. Izadkhah, M. S., Erfan-Niya, H., Heris, S. Z. (2019). Influence of graphene oxide nanosheets on the stability and thermal conductivity of nanofluids. Journal of Thermal Analysis and Calorimetry, 135(1), 581–595. https://doi.org/10.1007/s10973-018-7100-7 [Google Scholar] [CrossRef]
25. Maxwell, J. C. (1873). A treatise on electricity and magnetism, vol. 1. Oxford: Clarendon Press. [Google Scholar]
26. Omrani, A. N., Esmaeilzadeh, E., Jafari, M., Behzadmehr, A. (2019). Effects of multi walled carbon nanotubes shape and size on thermal conductivity and viscosity of nanofluids. Diamond and Related Materials, 93(12), 96–104. https://doi.org/10.1016/j.diamond.2019.02.002 [Google Scholar] [CrossRef]
27. Asadi, A., Alarifi, I. M., Ali, V., Nguyen, H. M. (2019). An experimental investigation on the effects of ultrasonication time on stability and thermal conductivity of MWCNT-water nanofluid: Finding the optimum ultrasonication time. Ultrasonics Sonochemistry, 58(6), 104639. https://doi.org/10.1016/j.ultsonch.2019.104639 [Google Scholar] [PubMed] [CrossRef]
28. Dalkılıç, A. S., Yalçın, G., Küçükyıldırım, B. O., Öztuna, S., Akdoğan Eker, A. et al. (2018). Experimental study on the thermal conductivity of water-based CNT-SiO2 hybrid nanofluids. International Communications in Heat and Mass Transfer, 99(2), 18–25. https://doi.org/10.1016/j.icheatmasstransfer.2018.10.002 [Google Scholar] [CrossRef]
29. Ebrahimi, S. (2022). Thermal conductivity of water base Ni-np@MWCNT magnetic nanofluid. Materials Research Bulletin, 150(6348), 111781. https://doi.org/10.1016/j.materresbull.2022.111781 [Google Scholar] [CrossRef]
30. Xie, H., Wang, J., Xi, T., Liu, Y. (2002). Thermal conductivity of suspensions containing nanosized SiC particles. International Journal of Thermophysics, 80, 571–580. https://doi.org/10.1023/A:1015121805842 [Google Scholar] [CrossRef]
31. Aparna, Z., Michael, M., Pabi, S. K., Ghosh, S. (2019). Thermal conductivity of aqueous Al2O3/Ag hybrid nanofluid at different temperatures and volume concentrations: An experimental investigation and development of new correlation function. Powder Technology, 343, 714–722. https://doi.org/10.1016/j.powtec.2018.11.096 [Google Scholar] [CrossRef]
32. Cakmak, N. K., Said, Z., Sundar, L. S., Ali, Z. M., Tiwari, A. K. (2020). Preparation, characterization, stability, and thermal conductivity of rGO-Fe3O4-TiO2 hybrid nanofluid: An experimental study. Powder Technology, 372, 235–245. https://doi.org/10.1016/j.powtec.2020.06.012 [Google Scholar] [CrossRef]
33. Poongavanam, G. K., Panchabikesan, K., Murugesan, R., Duraisamy, S., Ramalingam, V. (2019). Experimental investigation on heat transfer and pressure drop of MWCNT-solar glycol based nanofluids in shot peened double pipe heat exchanger. Powder Technology, 345(3), 815–824. https://doi.org/10.1016/j.powtec.2019.01.081 [Google Scholar] [CrossRef]
34. Said, Z., Abdelkareem, M. A., Rezk, H., Nassef, A. M. (2019). Fuzzy modeling and optimization for experimental thermophysical properties of water and ethylene glycol mixture for Al2O3 and TiO2 based nanofluids. Powder Technology, 353(9), 345–358. https://doi.org/10.1016/j.powtec.2019.05.036 [Google Scholar] [CrossRef]
35. Asadi, A., Alarifi, I. M. (2020). Effects of ultrasonication time on stability, dynamic viscosity, and pumping power management of MWCNT-water nanofluid: An experimental study. Scientific Repprts, 10(1), 15182. https://doi.org/10.1038/s41598-020-71978-9 [Google Scholar] [PubMed] [CrossRef]
36. Asadi, A., Asadi, M., Siahmargoi, M., Asadi, T., Gholami Andarati, M. (2017). The effect of surfactant and sonication time on the stability and thermal conductivity of water-based nanofluid containing Mg(OH)2 nanoparticles: An experimental investigation. International Journal of Heat and Mass Transfer, 108, 191–198. https://doi.org/10.1016/j.ijheatmasstransfer.2016.12.022 [Google Scholar] [CrossRef]
37. Tiwari, A. K., Pandya, N. S., Said, Z., Öztop, H. F., Abu-Hamdeh, N. (2021). 4S consideration (synthesis, sonication, surfactant, stability) for the thermal conductivity of CeO2 with MWCNT and water based hybrid nanofluid: An experimental assessment. Colloids and Surfaces A, 610, 125918. https://doi.org/10.1016/j.colsurfa.2020.125918 [Google Scholar] [CrossRef]
38. Zhai, Y., Li, L., Wang, J., Li, Z. (2019). Evaluation of surfactant on stability and thermal performance of Al2O3-ethylene glycol (EG) nanofluids. Powder Technology, 343, 215–224. https://doi.org/10.1016/j.powtec.2018.11.051 [Google Scholar] [CrossRef]
39. Xia, G., Jiang, H., Liu, R., Zhai, Y. (2014). Effects of surfactant on the stability and thermal conductivity of Al2O3/de-ionized water nanofluids. International Journal of Thermal Sciences, 84, 118–124. [Google Scholar]
40. Sánchez, N., Martínez, M., Aracil, J. (1997). Selective esterification of glycerine to 1-glycerol monooleate. 2. Optimization studies. Industrial & Engineering Chemistry Research, 36(5), 1529–1534. [Google Scholar]
41. Wilkinson, L. (2010). Systat. Wiley Interdisciplinary Reviews: Computational Statistics, 2(2), 256–257. [Google Scholar]
42. Lucas, J. M. (2010). Response surface methodology: Process and product optimization using designed experiments. Taylor & Francis. [Google Scholar]
43. Emami, M. R. S., Amiri, M. K., Zaferani, S. P. G. (2021). Removal efficiency optimization of Pb2+ in a nanofiltration process by MLP-ANN and RSM. Korean Journal of Chemical Engineering, 38(2), 316–325. https://doi.org/10.1007/s11814-020-0698-8 [Google Scholar] [CrossRef]
44. Esfe, M. H., Kiannejad, M., Esfande, S., Emami, M. R. S., Toghraie, D. (2022). Influence of different parameters on the rheological behavior MWCNT (30%)-TiO2 (70%)/SAE50 hybrid nano-lubricant using of response surface methodology and artificial neural network methods. Arabian Journal of Chemistry, 15(12), 104285. [Google Scholar]
45. Box, G. E., Behnken, D. W. (1960). Some new three level designs for the study of quantitative variables. Technometrics, 2(4), 455–475. https://doi.org/10.1080/00401706.1960.10489912 [Google Scholar] [CrossRef]
46. Dong, F., Wan, J. S., Feng, Y. K., Wang, Z. M., Ni, J. (2021). Experimental study on thermophysical properties of propylene glycol-based graphene nanofluids. International Journal of Thermophysics, 42(4), 46. https://doi.org/10.1007/s10765-021-02798-w [Google Scholar] [CrossRef]
47. Satti, J. R., Das, D. K., Ray, D. (2017). Investigation of the thermal conductivity of propylene glycol nanofluids and comparison with correlations. International Journal of Heat and Mass Transfer, 107(6), 871–881. https://doi.org/10.1016/j.ijheatmasstransfer.2016.10.121 [Google Scholar] [CrossRef]
48. Mahbubul, I. M., Elcioglu, E. B., Saidur, R., Amalina, M. A. (2017). Optimization of ultrasonication period for better dispersion and stability of TiO2-water nanofluid. Ultrasonics Sonochemistry, 37(1), 360–367. https://doi.org/10.1016/j.ultsonch.2017.01.024 [Google Scholar] [PubMed] [CrossRef]
49. Sandhya, M., Ramasamy, D., Sudhakar, K., Kadirgama, K., Harun, W. S. W. (2021). Ultrasonication an intensifying tool for preparation of stable nanofluids and study the time influence on distinct properties of graphene nanofluids–A systematic overview. Ultrasonics Sonochemistry, 73(8–9), 105479. https://doi.org/10.1016/j.ultsonch.2021.105479 [Google Scholar] [PubMed] [CrossRef]
50. Zhang, H., Qing, S., Zhai, Y., Zhang, X., Zhang, A. (2021). The changes induced by pH in TiO2/water nanofluids: Stability, thermophysical properties and thermal performance. Powder Technology, 377, 748–759. https://doi.org/10.1016/j.powtec.2020.09.004 [Google Scholar] [CrossRef]
51. Lei, J., Luo, Z., Qing, S., Huang, X., Li, F. (2022). Effect of surfactants on the stability, rheological properties, and thermal conductivity of Fe3O4 nanofluids. Powder Technology, 399(4), 117197. https://doi.org/10.1016/j.powtec.2022.117197 [Google Scholar] [CrossRef]
52. Palabiyik, I., Musina, Z., Witharana, S., Ding, Y. (2011). Dispersion stability and thermal conductivity of propylene glycol-based nanofluids. Journal of Nanoparticle Research, 13(10), 5049–5055. https://doi.org/10.1007/s11051-011-0485-x [Google Scholar] [CrossRef]
Cite This Article
 Copyright © 2023 The Author(s). Published by Tech Science Press.
This work is licensed under a Creative Commons Attribution 4.0 International License , which permits unrestricted use, distribution, and reproduction in any medium, provided the original work is properly cited.


 Submit a Paper
 Propose a Special lssue
 View Full Text
 Download PDF
 Downloads
 Citation Tools