
 Submit a Paper
 Propose a Special lssue
 Open Access
ARTICLE

A Darcy-Law Based Model for Heat and Moisture Transfer in a Hill Cave
1 College of Energy and Building Environment, Guilin University of Aerospace Technology, Guilin, 541004, China
2 College of Mechanical and Electrical Engineering, Guilin University of Aerospace Technology, Guilin, 541004, China
* Corresponding Author: Dongliang Zhang. Email:
(This article belongs to the Special Issue: Computational Mechanics and Fluid Dynamics in Intelligent Manufacturing and Material Processing)
Fluid Dynamics & Materials Processing 2023, 19(9), 2345-2359. https://doi.org/10.32604/fdmp.2023.027084
Received 13 October 2022; Accepted 08 February 2023; Issue published 16 May 2023
 View Full Text
 Download PDF
Abstract
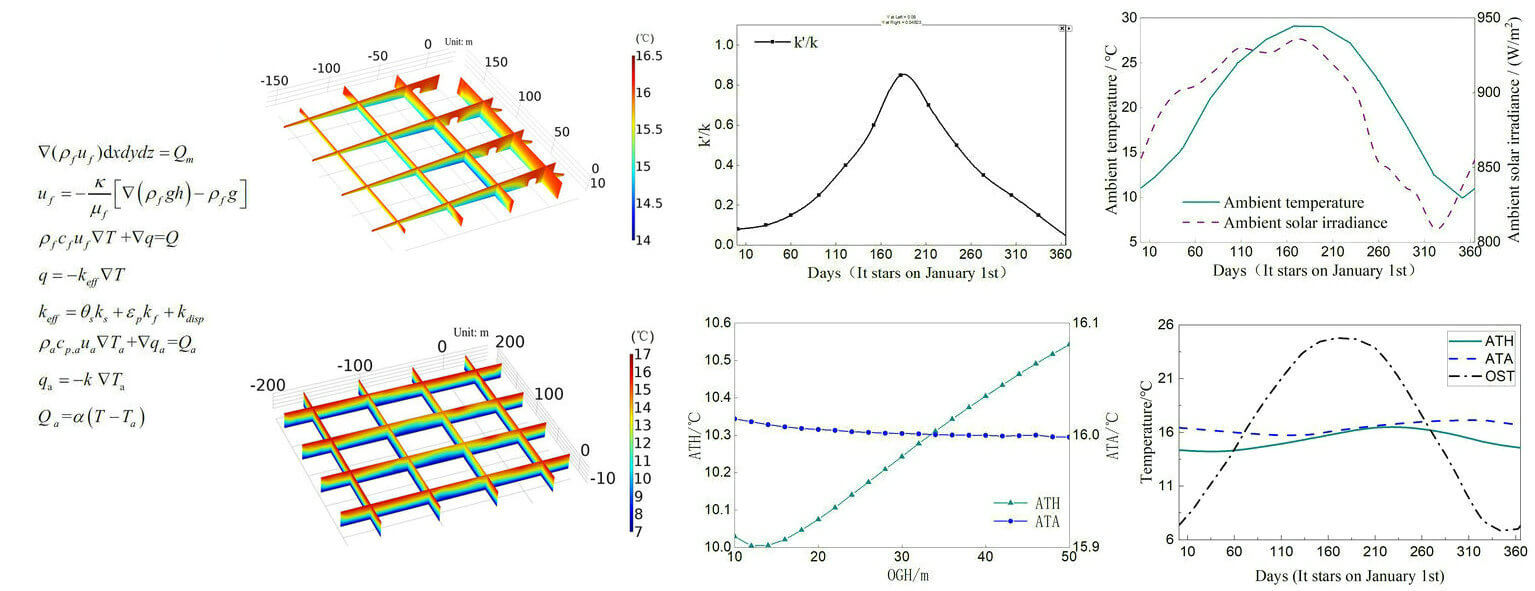
A hill can be regarded as an environmental carrier of heat. Water, rocks and the internal moisture naturally present in such environment constitute a natural heat accumulator. In the present study, the heat and moisture transfer characteristics in a representative hill cave have been simulated via a method relying on the Darcy’s law. The simulations have been conducted for both steady and unsteady conditions to discern the influence of permeability and geometric parameters on the thermal and moisture transfer processes. The reliability of the simulation has been verified through comparison of the numerical results with the annual observation data. As revealed by the numerical findings, the internal temperature of the hill accumulator is proportional to the permeability, outside surface temperature, overground height, underground constant temperature layer depth, and underground temperature of the hill, and it is inversely proportional to the horizontal size of the hill. Moreover, in the considered case, the order of magnitude of the permeability of the hill is contained in the range 10−15–10−13, and displays a certain sensitivity to the rainwater seepage.Graphic Abstract
Keywords
Abbreviations
| OST | Outside surface temperature of the hill |
| OGH | Overground height |
| UGT | Underground temperature |
| UGD | Underground depth |
| HS | Horizontal sizes |
| HIT | Internal temperature of the hill |
| RSR | Rainwater seepage rate |
| MLS | Mass flow of seepage |
| ATHA | Average temperature of the hill (including the underground part) or the air in the cave |
| ATH | Average temperature of the hill (including the underground part) |
| ATA | Average temperature of the air in the cave |
| TAR | Temperature of the air-rock interface |
| UGCTD | Underground constant temperature layer depth |
| Nomenclature | |
| cf | Specific heat capacity of rainwater, J/(kg⋅K) |
| cp,a | Specific heat capacity of air at constant pressure, J/(kg⋅K) |
| g | Acceleration of gravity, m/s² |
| h | Seepage pressure, mH2O |
| k | Air conductivity, W/(m⋅K) |
| kdisp | Conductivity caused by diffusion, W/(m⋅K) |
| keff | Equivalent thermal conductivity of the hill, W/(m⋅K) |
| kf | Conductivity of rainwater, W/(m⋅K) |
| ks | Conductivity of rock and soil in the hill, W/(m⋅K) |
| Q | Heat source of the hill, including the heat from the boundary by the way of conduction and convection, internal pressure work and viscous dissipation of the hill, W/m2 |
| Qa | Heat source of the air, including the convection heat transfer between the air and the rock wall in the cave and the heat exchange between the open boundary of the cave and the outside air, W/m2 |
| Qm | Rainwater flow flux, kg/s |
| q | Conduction heat flux in the hill (including rainwater in it), W/m |
| qa | Heat flux in the air, W/m |
| T | Temperature of the hill (including the rainwater in it), K |
| Ta | Air temperature, K |
| ua | Air velocity, m/s |
| uf | Rainwater flow rate, m/s |
| α | Convective coefficient between the air and the rock wall in the cave, W/(m2⋅K) |
| εp | The porosity of the hill |
| κ | Rainwater permeability, m2 |
| κ′ | Actual flow permeability, m2 |
| μf | Dynamic viscosity of the rainwater, Pa⋅s |
| θs | Volume fraction of rock and soil in the hill |
| ρa | Air density, kg/m3 |
| ρf | Rainwater density, kg/m3 |
Up to now, the research and application of geothermal energy were mainly concentrated in the medium-temperature range from 20°C to 90°C, and the research or application of low temperature below 20°C and high temperature above 100°C was rare. Aliyu et al. [1–5] carried out theoretical and practical research on numerical simulation of convective heat transfer between underground water and rock and soil based on considering seepage flow in fractures, and carried out numerical simulation research on thermo-hydro-mechanical multi-field coupling, the mathematical model of seepage flow was established and the partial differential equations were solved. Liu et al. [6–9] mainly focused on fracture seepage characteristics and permeability under different water saturation, prediction of deep thermal reservoir temperature and calculation of thermal energy reserves, all of which served for geothermal development. Varnosfaderani et al. [10–15] investigated the impacts of climate change on unsaturated porous media through the coupled thermo-hydro-mechanical analysis by leveraging a discrete fracture model. It has been received ideal effect that geothermal energy was applied in heat pump systems. The efficiency of heat pump system usually tends to decline as time goes on for the accumulation of extensive and concentrated heat [16–20]. It was inconvenient to construct a geothermal system in building intensive city, then the application of geothermal energy was restricted. The studies on hill thermal energy were focus on preventing thermal damage in mines and tunnels in the last few years [21–24]. The research on the development and utilization of hill heat energy was rare, which was mainly related to the inconvenience of engineering application caused by the distance of most cities from the hill, and the low thermal efficiency of power generation. This paper served for the application and development of geothermal energy at low temperature, taking the low-temperature hill in the town as the research object, and aimed to study its permeability and heat transfer characteristics at low temperature.
In recent years, the global climate problem had become increasingly severe. It has always been the focus of research how to realize the green and efficient utilization of various energy sources. The interior of the hill was warm in winter and cool in summer, as the sizable volume of the hill was concerned, hill was a considerable green heat accumulator that nature gave us as gift. There was water in hill, rock soil and its internal moisture in the hill constituted natural heat accumulator together. It was expected reduce carbon emissions and achieve the goal of “carbon peak” that the effective use of hill heat energy. Karst landforms were widely distributed in Guilin. Hill and its covering plants played an important role in air temperature control of the heat island city. The ground temperature under or near the forest and water was significantly lower than the ground temperature in the sunlight, and the effect of forest was more obvious than water [25–29]. Most of the hill in Guilin was mainly composed of limestone, and caves were common in the hill. The air temperature inside the cave was maintained at 15°C∼20°C and the relative humidity of the air inside the cave was above 90% all year round. It was slightly dripping from the top ceiling of the cave in spring and summer, and attached with crystalline salt on the side wall of the cave in autumn and winter. In the hot summer, the coolness could be felt within 100 meters near the entrance of the cave. In recent years, many caves had been excavated artificially. These natural and artificial caves were gradually used to hide wine or catering services. With the increase of the number of caves used the air temperature inside the cave increased, but the air temperature in the cave was still very comfortable without air conditioning. Guilin had unique geographical conditions for the application of this natural source. The steady temperature field at mean annual temperature and the permeability range of the hill were obtained by means of numerical simulation in this paper, and the reliability of the conclusion was confirmed by the comparing of the annual transient simulation data with the annual observation data. It could provide a basis for the later research on the hill’s heat storage mechanism, underground heat source, heat storage and engineering utilization value, in order to use this stored low-temperature thermal energy in refrigeration, air conditioning, heat pump, etc., explore a new way of energy saving and emission reduction.
The average altitude of Guilin was 150 m, and it belongs to the sub-tropical monsoon climate. The annual average temperature was 19.3°C, the lowest monthly average temperature (January) was 7.9°C, the highest monthly average temperature (August) was 32.8°C, and the average annual rainfall was 1900∼2000 mm in Guilin [29].
In this paper, finite element analysis CFD software was used for modeling and study the viscous dynamics of incompressible fluids [30]. The dependent variables were pressure and temperature, with quadratic discretization for pressure and linear discretization for temperature. Finite difference method was adopted for time, and the time step was set to 1 day. The solutions were described in space and time scales based on the independent variables x, y, z and τ.
A small low-temperature cave hill in Guilin City was taken as an example in order to study the thermal and humidity transfer characteristics of low-temperature hill. The overground part of the hill was rule of shape, with the maximum length and width in horizontal of 214 and 180 m, respectively, and with the maximum height of 18 m. The maximum height of the hillside below the vertical cliff was 7 m. There was a long cave at the foot of the hill. The depth of the cave was 160 m, the width was 8 m, and the maximum height of the arch section was 7 m. As the cave deepens, it was tilted slightly toward the interior of the hill. The distance of 20 m was extended to each of the four directions in horizontal at the food of the hill, as well as to the underground of the hill. The model of the hill was constructed and it was shown in Fig. 1. The volume of the cave was 8.393 × 10³ m3, and the volume of the overground hill was 2.878 × 10⁵ m3. In order to improve the quality of the mesh for simulation, a rounded corner with the radius of 1 m was made at the sharp corner of the model.
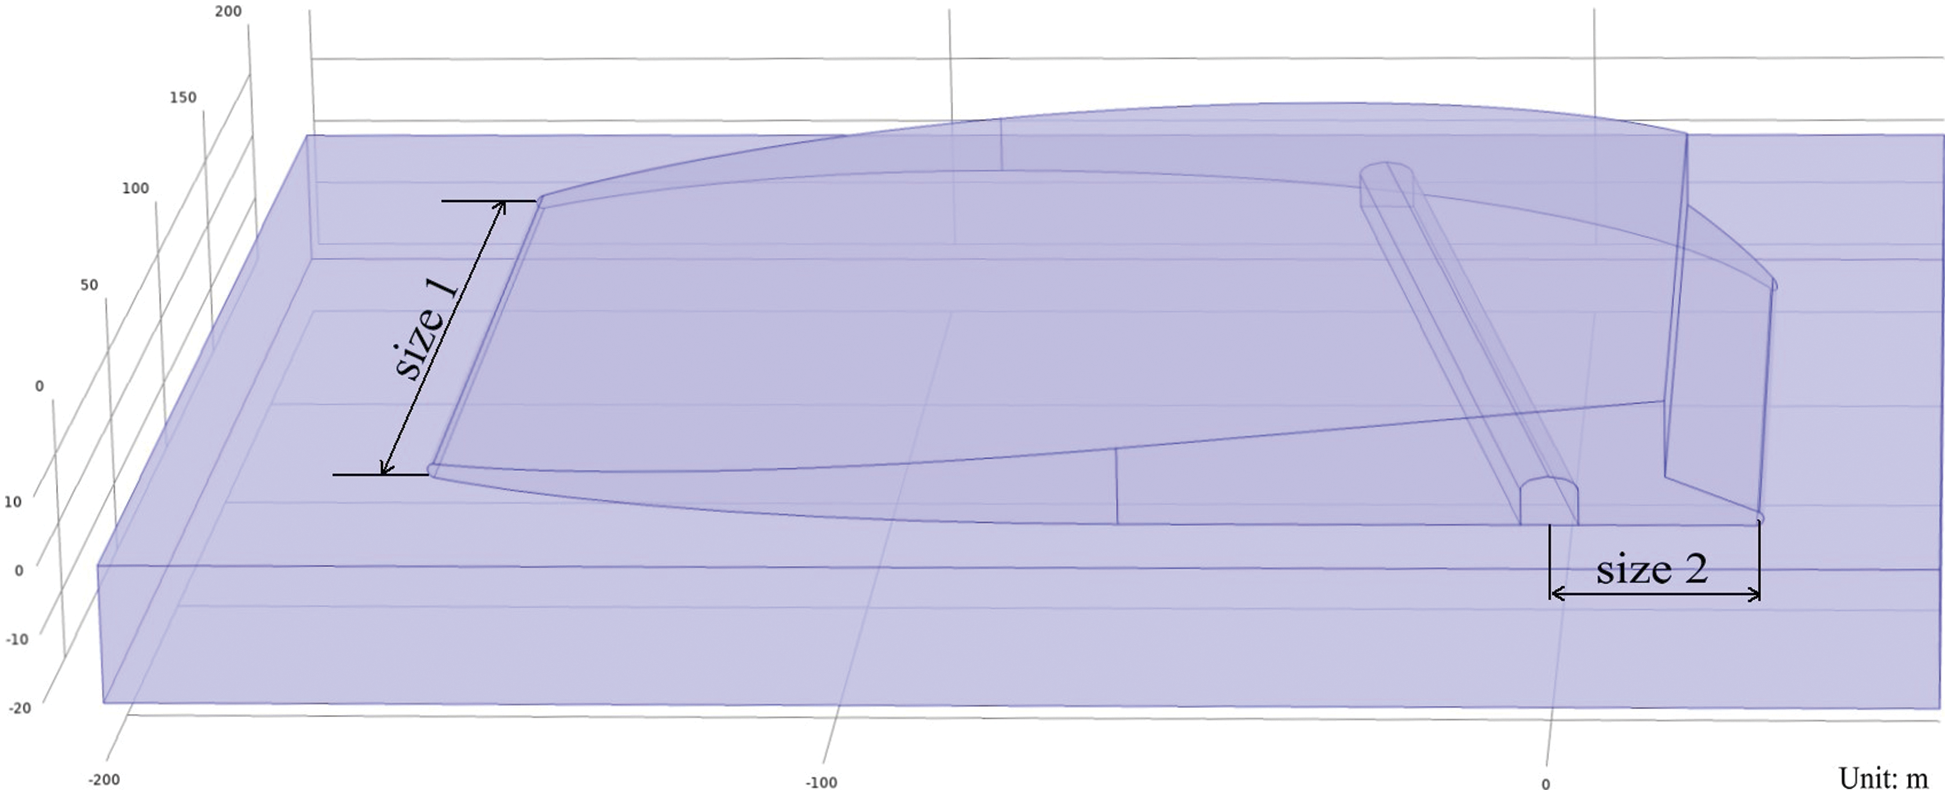
Figure 1: Geometric model of the hill
The studying of the temperature field in the hill should not only consider the heat transfer of rock and soil, but also consider the seepage influence of rainwater. The air temperature in the cave was mainly affected by the hill temperature field.
The seepage field of rainwater was modeled by Darcy’s law, which was driven by gravity only. The mathematical model of hill heat transfer was based on the theory of local heat equilibrium of conduction (the temperature of the water, rock and soil in the hill were equal), the equivalent thermal conductivity of the hill was calculated by weighted arithmetic average algorithm, and there was no internal heat source in the whole model. Convective heat transfer was carried out between the wall and the air in the cave.
The formulas of rainwater seepage field were as follows:
The formulas of hill heat transfer field were as follows:
The formulas of air heat transfer field in the cave were as follows:
In the preliminary subdivision, the hill was divided into 1440993 tetrahedral meshes (including the underground part), with an average mesh skewness mass of 0.6585 and a minimum mesh skewness mass of 0.1953. The cave was divided into 279731 tetrahedrons, with an average mesh skewness mass of 0.6557 and a minimum mesh skewness mass of 0.2155. The adaptive and error estimation grids were set, the derivative order of stability estimation was 2, the maximum mesh refinement number was 5, the maximum coarsing factor was 5, and the element number growth factor was 1.7. After 3 times of self-adaptation, the fine solution was obtained.
2.4 Boundary Conditions Setting
The underground temperature (UGT) at the underground depth (UGD) of 20 m was set to be 7°C; the outside surface (including the flat ground around the hill) temperature of the hill (OST) was set to be 16.1°C; The surrounding temperature was set to be 20°C; the four vertical planes underground were adiabatic no-flow boundaries; the convective coefficient between the air and the rock wall in the cave was set to be 10 W/(m2⋅K). The OST was slightly lower than the average annual temperature of Guilin, since the plants growing on the hill shielding heat from the sun and the water in the hill absorbing heat when evaporating.
The seepage physical field was unidirectional coupled with the hill heat transfer physical field, and the hill heat transfer physical field was bidirectional coupled with the air heat transfer physical field. Let’s assume that the whole model was homogeneous. Then the density, conductivity and specific heat capacity of the rock-soil in the hill were set respectively to be 2643 kg/m3, 3.0 W/(m⋅K) and 837.4 J/(kg⋅K).
3.1 Simulation of Rainwater Seepage Physical Field
The seepage field of rainwater under the action of gravity was simulated and the diagram of seepage flow was shown in Fig. 2. The direction of rainwater flow near the cave was slightly diverted.
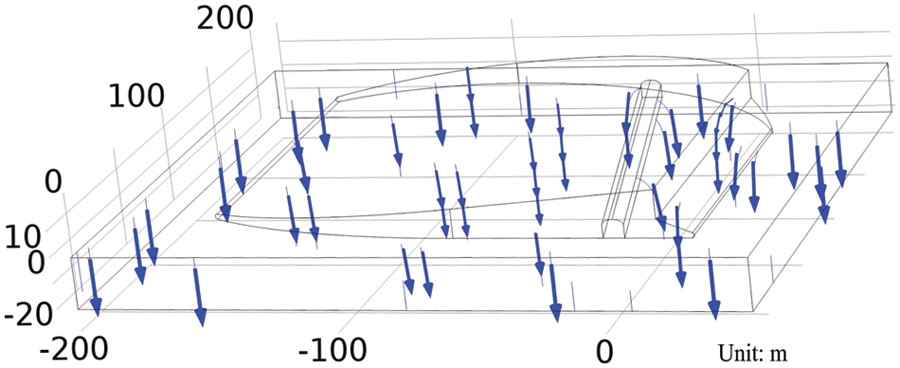
Figure 2: Diagram of seepage flow
The simulation data showed that the rainwater seepage rate (RSR) and the mass flow of seepage (MLS) were directly proportional to the rock-soil permeability. When the permeability was 6.5 × 10⁻¹⁵ m2, the average RSR was 4.22 × 10⁻⁸ m/s. The MLS was about 2.14 kg/s, the value was equal to the difference between the average annual rainfall and the amount of water transpiration and evaporation in Guilin [26]. When the permeability was 5 × 10⁻¹⁶ m2, the average RSR was 3.19 × 10⁻⁹ m/s, and the MLS was about 0.16 kg/s.
In steady state, the variation of RSR and MLS with the porosity was almost constant. When the permeability was 5.5 × 10⁻¹⁵ m2 and the porosity varied from 0.001 to 0.2, the average RSR remains almost 3.49 × 10⁻⁸ m/s, and the MLS changed negatively from 1.794 to 1.796 kg/s.
3.2 Simulation of Hill Temperature Physical Field
Steady-state heat transfer simulation was carried out for the hill containing rainwater inside. When the permeability of the hill was set to be 6.5 × 10⁻¹⁵ m2, the MLS was about 2.14 kg/s. The cross-section temperature contours of the hill were shown in Fig. 3. It can be seen from the figure that the higher the height of the hillside, the larger the area of the cold zone in the vertical section. The internal temperature of the hill (HIT) around the cave was greatly affected by the air in the cave. The heat transfer between the air and the rock wall in the cave had a significant influence on the hill temperature field about 20 meters on either side of the cave.
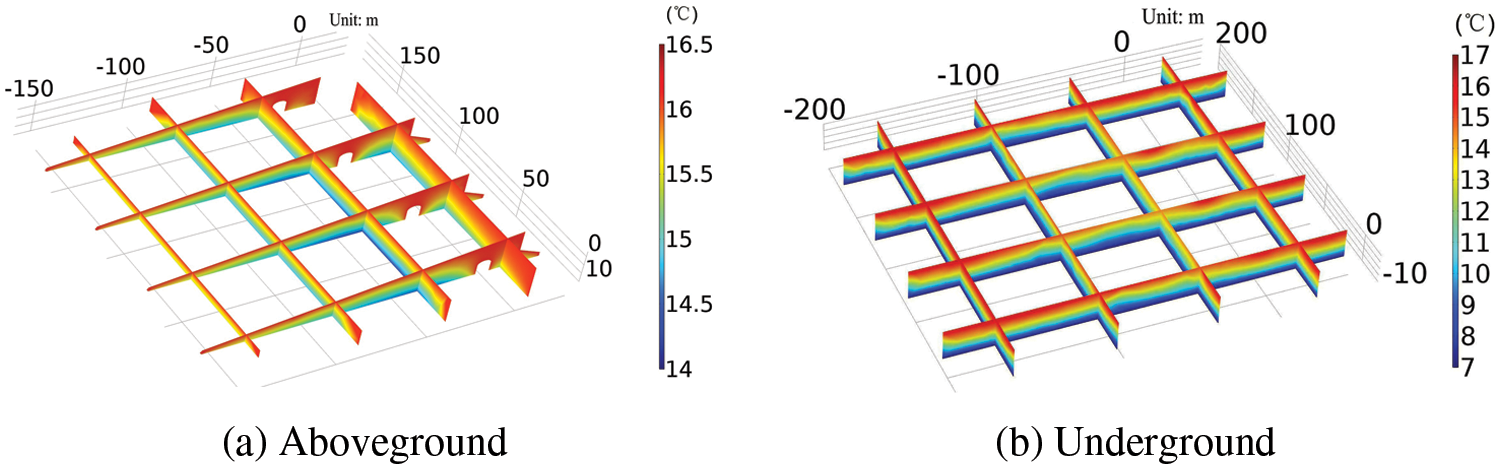
Figure 3: Cross-section temperature contours of the hill
3.3 Simulation of Air Temperature Physical Field
When the permeability was 6.5 × 10⁻¹⁵ m2, the cross-section temperature contours of the air in the cave was shown in Fig. 3. The figure showed that the air temperature of 10 m deep inside the cave had been almost stable, which was basically consistent with what was observed when there was no obvious sense of blowing at the entrance of the cave. It can also be seen from Fig. 4 that the air at the top was hotter than at the bottom in the cave, and the air temperature at the ground corner on both sides was the lowest, which was unfavorable to develop natural convection heat transfer. It showed that the main way of heat transfer between the air and the rock wall in the cave was conduction, for the conduction heat transfer included in convective heat transfer, and the air temperature would change slightly.
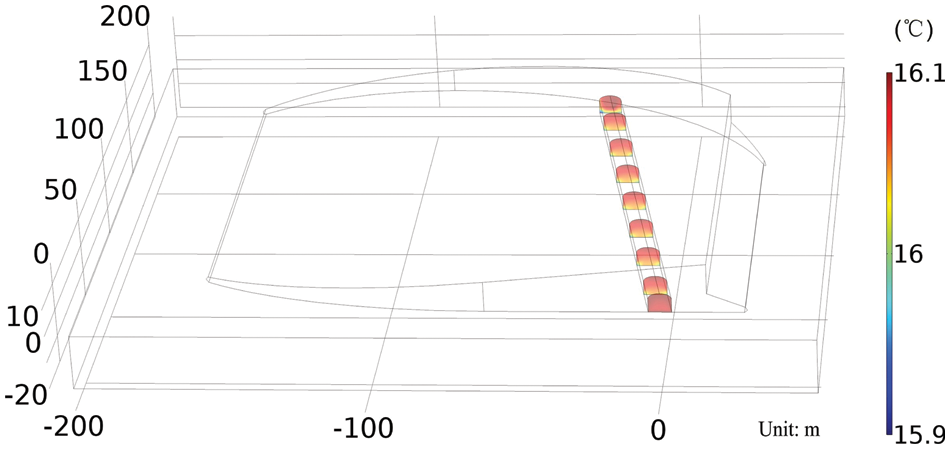
Figure 4: Cross-section temperature contours of the air in the cave
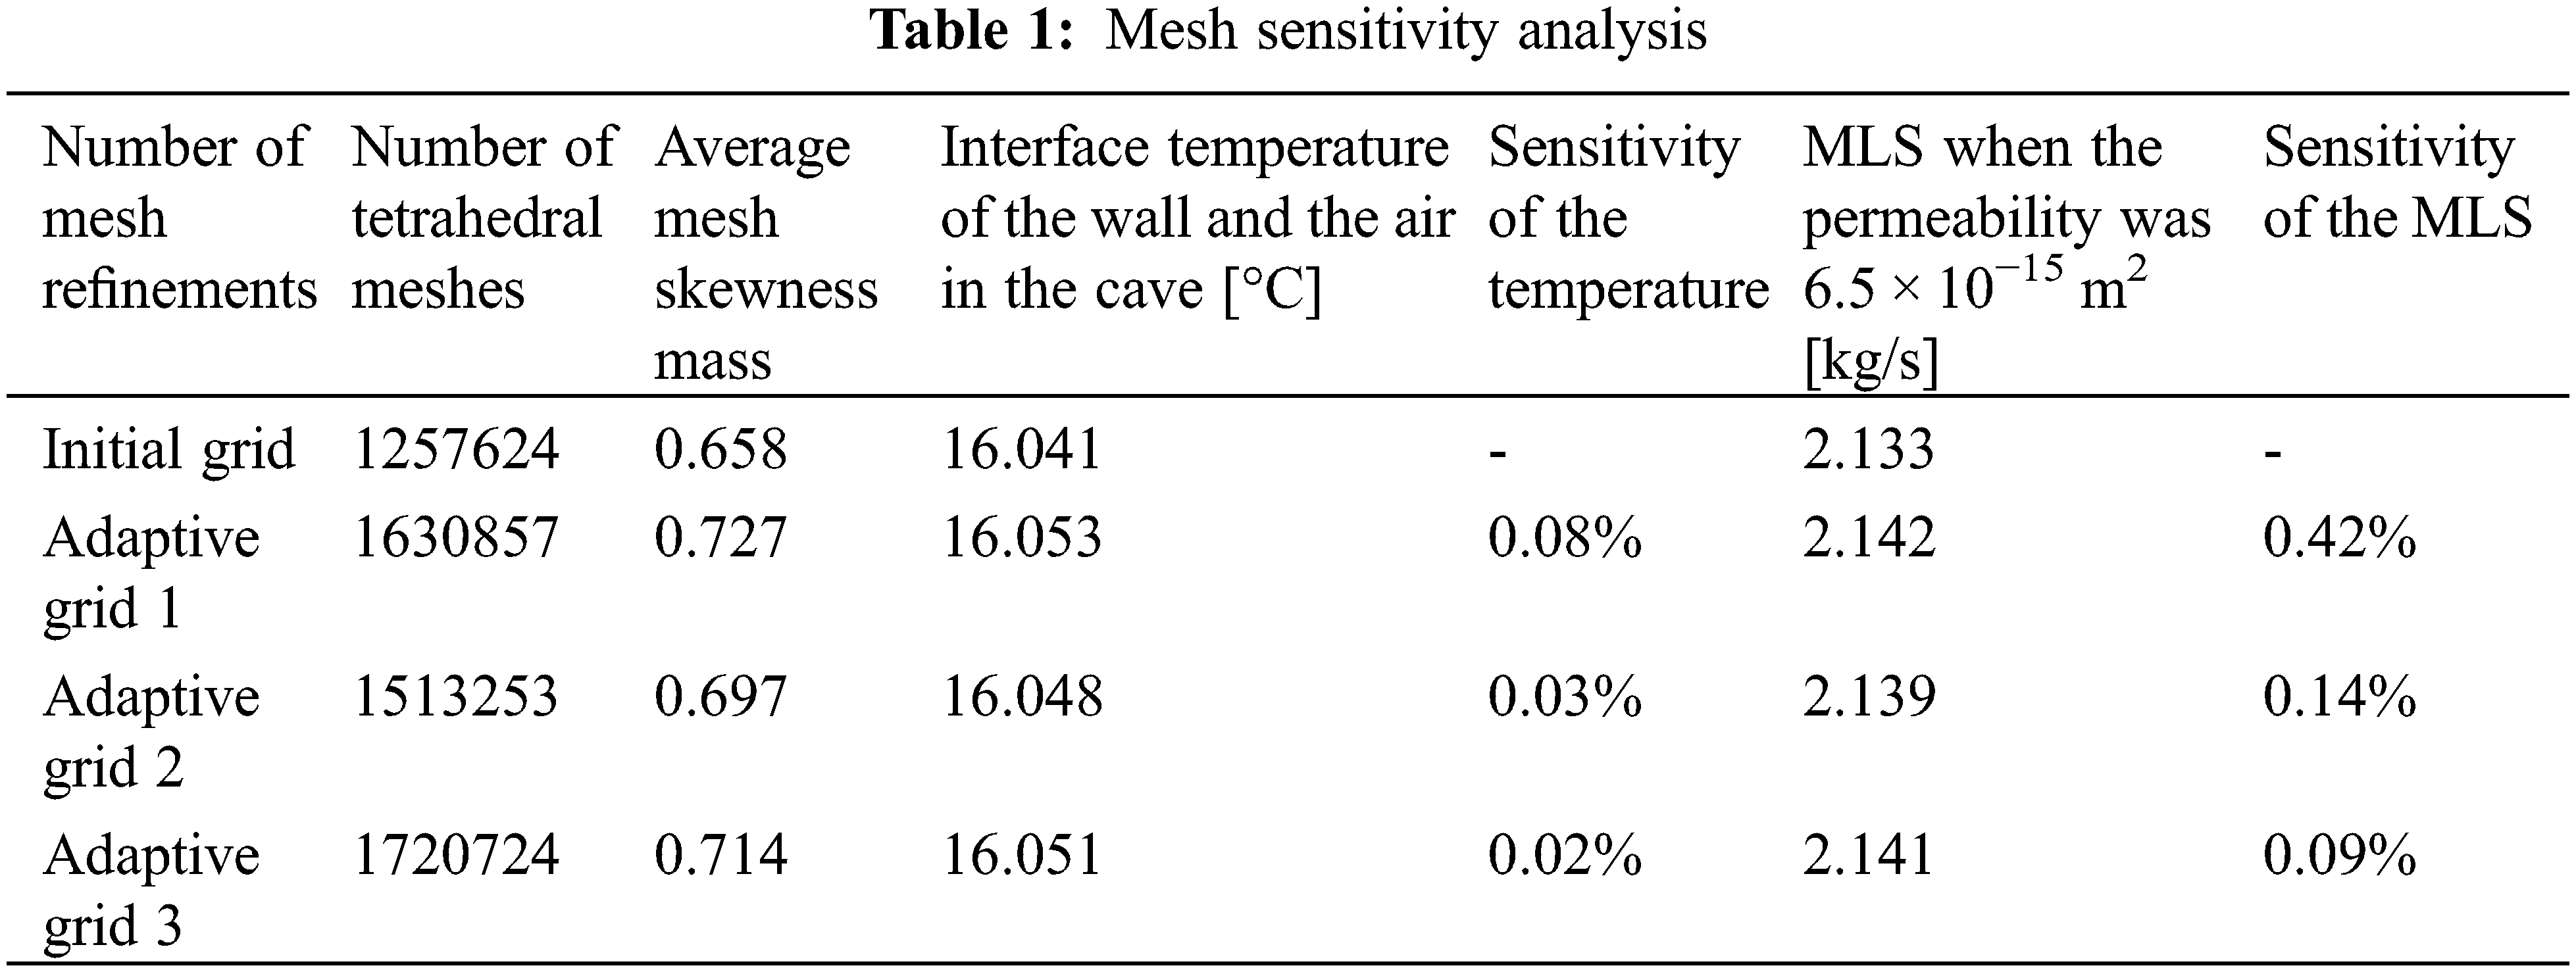
The calculation results of the model were checked. The temperature value and heat flow value at the interface of the wall and the air in the cave in the domain of the hill were consistent with the temperature value and heat flow value at the interface of the wall and the air in the cave in the domain of the air, and their average values were 16.05°C and 2.5 × 10⁻¹⁵ W/m2, respectively, which indicated that the coupling is correct and the model was reliable.
The results of three times of adaptive grid calculation were compared and analyzed, as shown in Table 1. The sensitivity of adaptive grid 3 was less than 0.1%.
4.1 Simulation of Permeability
The relationship between the average temperature of the hill (including the underground part) or the air in the cave (ATHA) and the permeability was shown in Fig. 5. the average temperature of the hill (including the underground part) (ATH) increased with the increase of the permeability, and the increase trended slows down as the permeability increasing. When the permeability was low, the ATH was affected by the permeability significantly. When the permeability was greater than 4.0 × 10⁻¹⁴ m2, the ATH was stable basically. The influence of the permeability on the average temperature of the air in the cave (ATA) was not obvious. When permeability was greater than 1.0 × 10⁻¹⁴ m2, the ATA was almost stable.
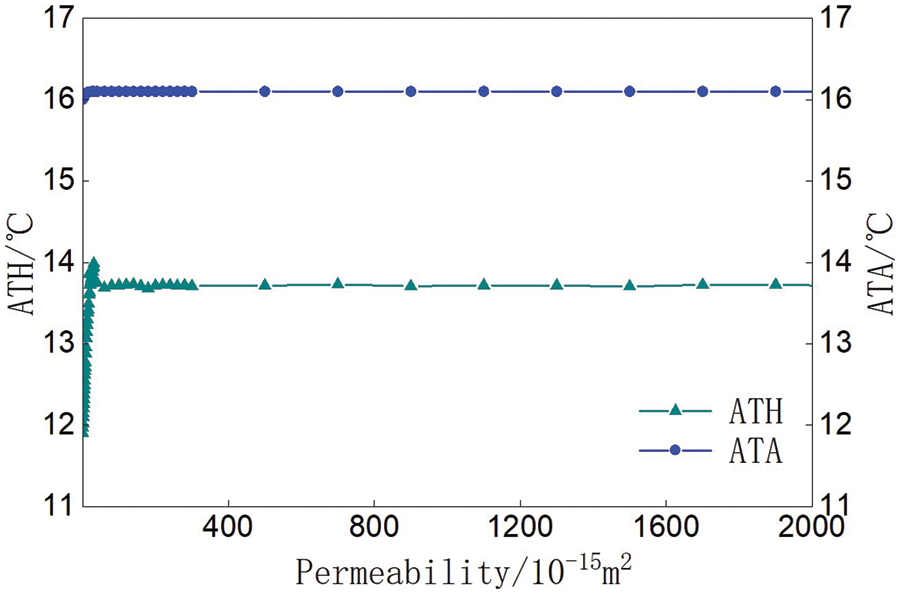
Figure 5: Relationship between the ATHA and permeability
4.2 Simulation of Outside Surface Temperature (OST)
When the permeability was 5.5 × 10⁻¹⁵ m2, the relationship between the ATHA and the OST was shown in Fig. 6. The ATHA increased linearly with the increase of the OST. When the OST varied from 3°C to 45°C, the ATH increased 25.02°C, the ATA increased 1.27°C (equivalent to the annual change of the ATA), and the temperature of the air-rock interface (TAR) increased 1.35°C. When the OST was about 25°C, the ATH was approximately equal to the ATA.
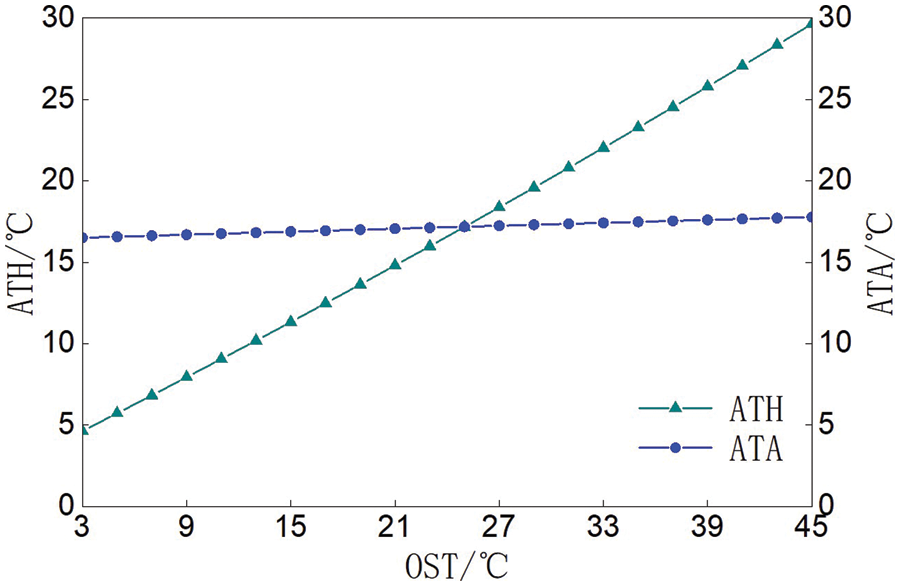
Figure 6: Relationship between the ATHA and OST
4.3 Simulation of Underground Temperature (UGT)
When the permeability was 5.5 × 10⁻¹⁵ m2, the ATHA increased nearly linearly with the UGT at the underground depth (UGD) of 20 m. The relationship between the ATHA and the UGT was shown in Fig. 7. When the UGT at the UGD of 20 m changed from 3°C to 15°C, the ATH increased 4.58°C, the ATA increased 0.07°C, and the TAR increased 0.08°C. The temperature difference between the ATA and the ATH decreased with the increase of the UGT.
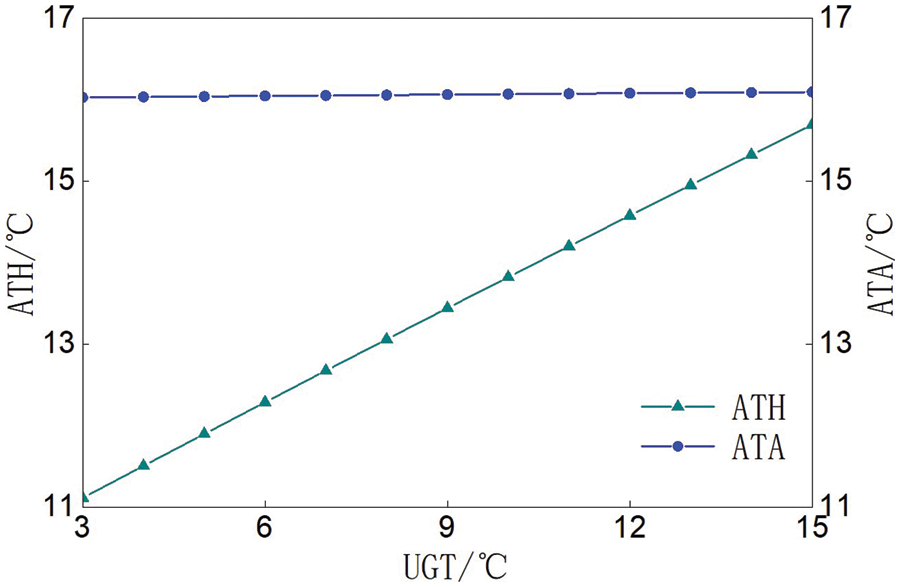
Figure 7: Relationship between the ATHA and UGT at the UGD of 20 m
4.4 Simulation of Overground Height (OGH)
When the permeability was 5.5 × 10⁻¹⁵ m2, the ATH decreased slightly at first and then increased slowly with the increase of the OGH of the main peak (the height of the cliff remained unchanged), which was mainly caused by the change of the volume and external area of the hill when the OGH increased. The ATA decreased slightly with the increase of the OGH. The relationship between the ATHA and the OGH was shown in Fig. 8.
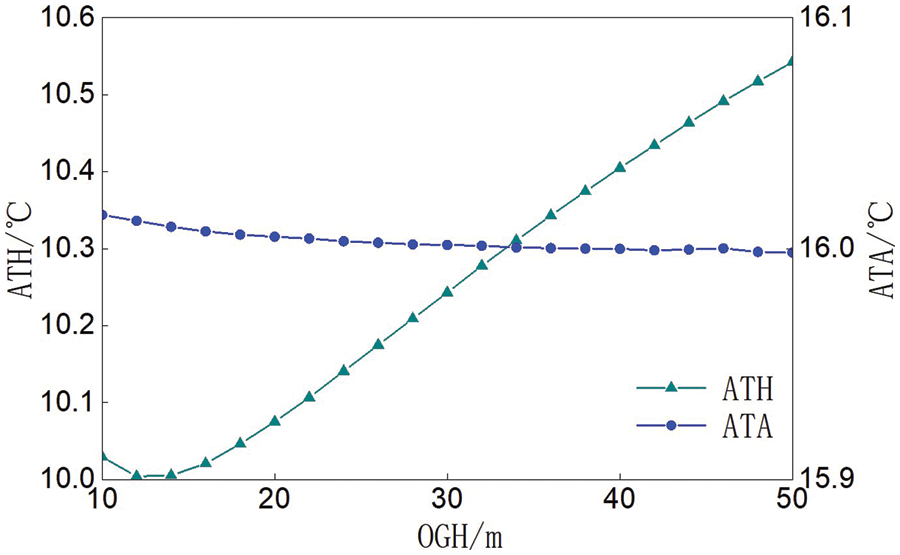
Figure 8: Relationship between the ATHA and OGH
4.5 Simulation of Underground Constant Temperature Layer Depth (UGCTD)
The ATH was obviously affected by the UGCTD. The relationship between the ATHA and the UGCTD was shown in Fig. 9. When the permeability was 5.5 × 10⁻¹⁵ m2 and the bottom UGT was kept at 7°C, the ATH was gradually increased and then the increasing trend gradually slowed down with the decrease of the UGCTD. The change of the ATA with the UGCTD was not obvious.
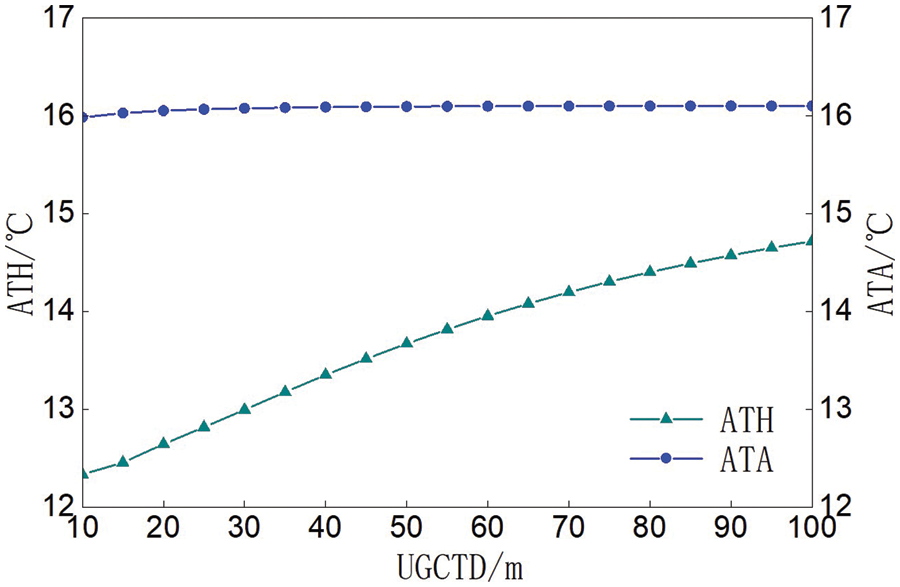
Figure 9: Relationship between the ATHA and UGCTD
4.6 Simulation of Horizontal Sizes (HS)
The maximum height of the hillside below the vertical cliff was changed to 15 m, then the height difference between the cliff and the main peak was 3 m. The permeability was set to be 5.5 × 10⁻¹⁵ m2.
The width on the side of the cliff (size 1) and the length of the straight edge on the left side of the hill (size 2) was changed, as shown in Fig. 10, in the meanwhile kept a 40 m-long geotechnical domain at the end of the cave. The relationship between the ATHA and the HS (size 1 and size 2) was shown in Fig. 10. With the increase of size 1, the ATHA decreased, and the ATH decreased faster than the ATA. When size 2 was between 50 and 110 m, the ATH fluctuated in a very small range. When size 2 was about 110 m, the ATH dropped obviously. When size 2 was greater than 120 m, the ATH decreased slowly. The steep drop in the cave was related to the significant change of volume ratio between the hill and the cave and the heat storage of the hill. The ATA was not affected by size 2 significantly.
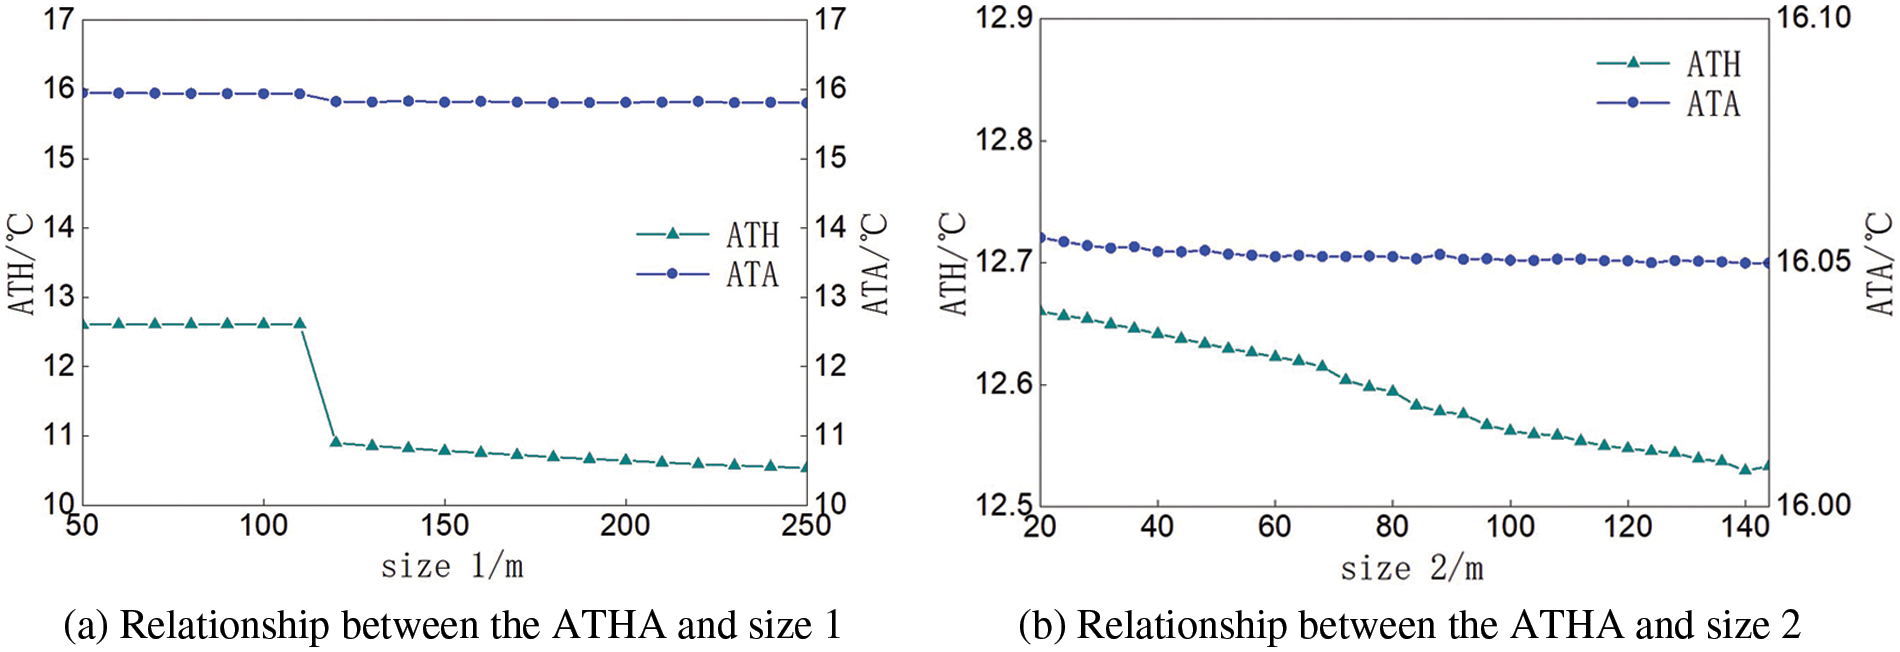
Figure 10: Relationship between the ATHA and HS
5 Analysis and Verification of the Permeability
It played an important role of the hill permeability, and it would be important in the study of heat and humidity transfer law and cold storage capacity of low-temperature hill in the further. The determination of the hill permeability was one of the research purposes of this paper.
5.1 Analysis of the Permeability
According to meteorological data, the average annual rainfall in Guilin was 1900∼2000 mm [29], and the average annual mass flow of the rainwater was 3.393 kg/s. Some of this flow was evaporated by plant transpiration, and some was evaporated into the air through the outside surface of the hill. If the mass flow of plant transpiration was 1 mmol/(m2⋅s) [28] (about 1.01 kg/s), and the total transpiration and evaporation was 2.1 mm/d [31] (about 1.36 kg/s), the mass flow of evaporation through the outside surface of the hill would be 0.35 kg/s. Assuming that other water was percolated by the hill, the MLS was about 2.04 kg/s, and the permeability was about 6.2 × 10⁻¹⁵ m2 through linear interpolation according to the simulated data.
According to the reference, the rainfall in Guilin from April to August was about 70.32% of the annual rainfall [29]. The time when the water mark seeped out from the cave wall was about early June, and the time when the water mark became dry out was about early October by observation. During these four months, the water seeped down from the top of the hill into the cave, the calculated average RSR was about 1.25 × 10⁻⁶ m/s, and the permeability was about 1.86 × 10⁻¹³ m2 through linear interpolation according to the simulated data.
According to the above analysis, the permeability of the hill ranged from 10−15 to 10−13, which could provide data support for future studies.
5.2 Verification of the Permeability
In order to verify the reliability of the permeability range, the year-round transient simulation was carried out under the conditions that the geometric model, mathematical model, grid setting and boundary conditions of the cave hill were kept constant. The annual environmental parameters used for the simulation were showed in Fig. 11, and the data in the figure were depend on the annual related data at 10 a.m. in Guilin.
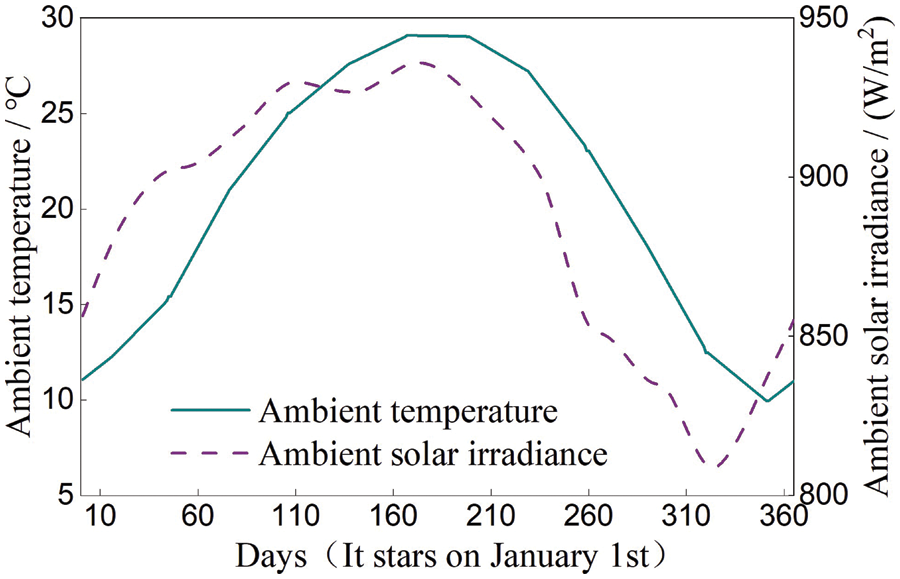
Figure 11: Simulation settings about annual environment parameters
The UGCTD was set as 30 m and the bottom UGT was 5°C, the convective heat transfer coefficient between the outside surface of the hill and the surrounding air was 10 W/(kg⋅K), and assume that the proportion of solar radiation energy through trees and leaves absorbed by the hill surface was 3%. The heat dissipation by evaporation of the water in the hill was equivalent to the convective heat transfer coefficient between the hill outside surface and the surrounding air, which was set as −15 W/(kg⋅K). Considering the inhomogeneity of annual rainfall in Guilin and the unsaturated seepage water content in the hill, it was assumed that the permeability changed with seasons, in order to meet the annual seepage flow consistent with the actual situation. The proportion between the actual flow permeability adopted in the simulation κ′ and the permeability κ was shown in Fig. 12, with κ set at 5.0 × 10⁻¹⁴ m2.
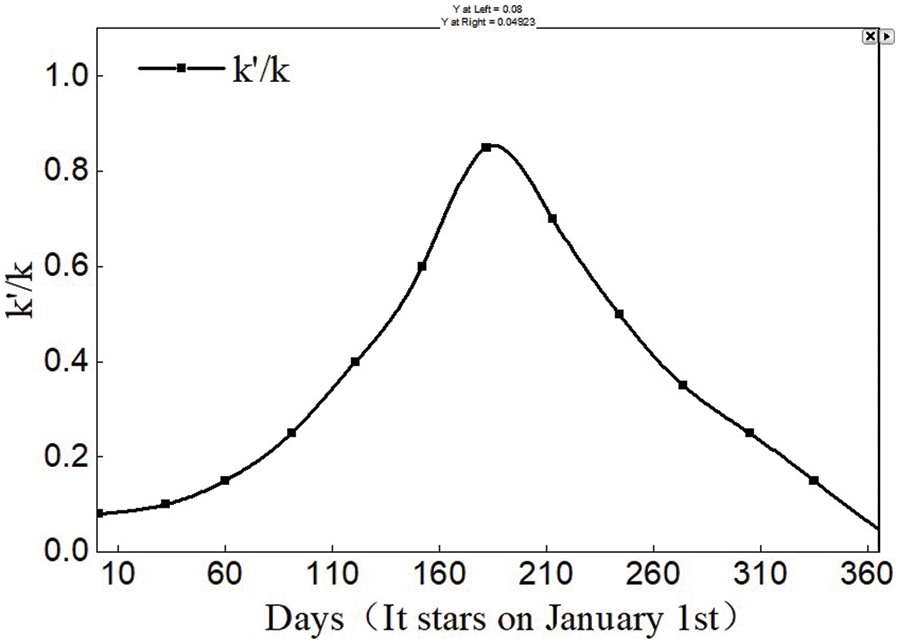
Figure 12: Permeability settings and their interpolation
The transient simulation was carried out four times periodically, and it began on October 01. Because of the poor accuracy and stability of the early data, the data of the first three months were removed. The data were taken from January 01, and three consecutive periods of simulated data were used for analysis. The mean and variance values of the three periods were calculated respectively for the ATH and other parameters. The annual variation of parameters such as ATH, ATA, OST, and the amount of seepage were shown in Figs. 13 and 14.
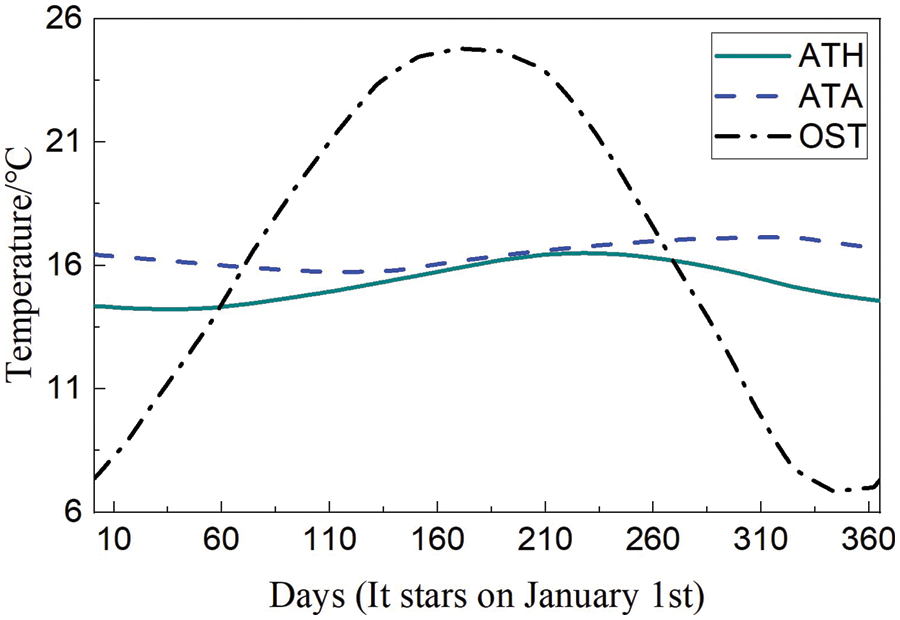
Figure 13: Annual variation of the ATH, OST and ATA based on transient simulation
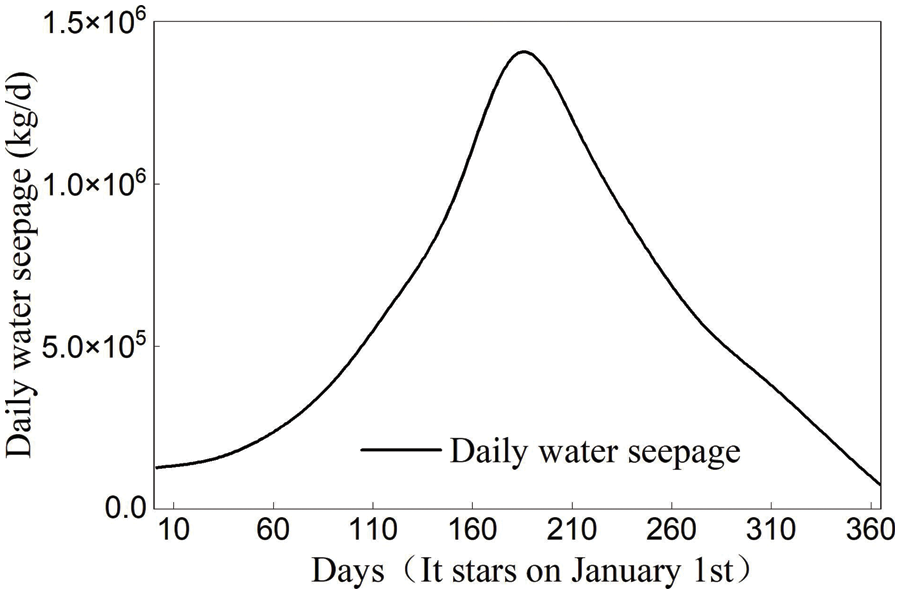
Figure 14: Annual variation of daily water seepage based on transient simulation
The annual average water seepage was obtained to be 2.18 × 10⁸ kg/y by integrating the daily water seepage for the whole year. This data was basically consistent with the MLS of 2.04 kg/s mentioned above, which showed that the permeability range was reasonable.
Hill as a natural accumulator contains many pollutions free heat. Through the parameterized steady and unsteady simulation research of the thermal and moisture transfer characteristics of the cave hill in low temperature in Guilin, and the comparison with the perennial rainfall and air temperature in the cave, the following conclusions were obtained:
(1) The internal temperature of the hill accumulator was proportional to the permeability, outside surface temperature (OST), overground height (OGH), underground constant temperature layer depth (UGCTD) and underground temperature (UGT) of the hill. Among these parameters, the permeability, OST, UGCTD and UGT had significant influence on the internal temperature of the hill accumulator, while the OGH has little influence.
(2) The internal temperature of the hill accumulator was inversely proportional to the horizontal sizes (HS) of the hill under steady-state conditions, and the influence was greater.
(3) The order of magnitudes of the permeability of the represented hill was 10−15∼10−13, which was basically consistent with the relevant physical property parameters of limestone [32], and it was in the range of poor permeability.
(4) The numerical range of the permeability, the influencing factors of the internal temperature of the hill and the changes trend obtained could be used to estimate the average internal temperature of the cave hill in Guilin, which could be used for further research on the mechanism of the hill heat accumulator, underground heat source, amount of heat storge, engineering utilization and the regulating effect on surrounding microclimate.
(5) Due to the weak heat transfer between the wall and the air in the cave, it was not suitable for taking heat from the air in the cave of low-temperature hill when large-scale engineering heat utilization. The traditional solid thermal application method of drilling and distributing pipes in the hill which was costly and prone to problems. The flexible heat exchangers which exchange heat with the wall in the cave might be the best choice.
(6) Because the specific heat capacity of water is greater than that of limestone, there will be a constant temperature layer at a certain depth under the hill, and the liquid and gaseous water have good heat transfer and transport performance, water drenching operations could be carried out to improve the heat utilization performance when the temperature of the hill changes greatly after development of the project.
(7) The ATH in arid season was greatly affected by the ambient temperature. When studying thermal and moisture transfer characteristics of rainy season, a relatively large permeability should be adopted, while when studying thermal and moisture transfer characteristics of long-term or arid season, a relatively small permeability should be adopted.
(8) Water evaporation in the medium or high temperature hill would be greater than that in the low-temperature hill under the same conditions. In fact, the actual flow permeability κ′ should be reduced appropriately.
Funding Statement: The authors received no specific funding for this study.
Conflicts of Interest: The authors declare that they have no conflicts of interest to report regarding the present study.
References
1. Aliyu, M. D., Archer, R. A. (2021). A thermo-hydro-mechanical model of a hot dry rock geothermal reservoir. Renewable Energy, 176, 475–493. https://doi.org/10.1016/j.renene.2021.05.070 [Google Scholar] [CrossRef]
2. Aliyu, M. D., Archer, R. A. (2021). Numerical simulation of multifracture HDR geothermal reservoirs. Renewable Energy, 164, 541–555. https://doi.org/10.1016/j.renene.2020.09.085 [Google Scholar] [CrossRef]
3. Aliyu, M. D., Archer, R. A. (2020). Thermo-hydro-mechanical model of multifracture HDR geothermal reservoirs. GRC Transactions, 44, 403–428. [Google Scholar]
4. Xu, C. S., Dong, S. Q., Wang, H., Wang, Z. H., Xiong, F. (2021). Modelling of coupled hydro-thermo-chemical fluid glow through rock fracture networks and its applications. Geosciences, 11(4), 153. https://doi.org/10.3390/geosciences11040153 [Google Scholar] [CrossRef]
5. Xu, H., Cheng, J., Zhao, Z., Lin, T., Liu, G. et al. (2021). Coupled thermo-hydromechanical-chemical modeling on acid fracturing in carbonatite geothermal reservoirs containing a heterogeneous fracture. Renewable Energy, 172, 145–157. https://doi.org/10.1016/j.renene.2021.03.023 [Google Scholar] [CrossRef]
6. Liu, G., Zhou, C., Rao, Z., Liao, S. (2021). Impacts of fracture network geometries on numerical simulation and performance prediction of enhanced geothermal systems. Renewable Energy, 171, 492–504. https://doi.org/10.1016/j.renene.2021.02.070 [Google Scholar] [CrossRef]
7. Wang, Z., Xu, C., Dowd, P. A. (2019). Perturbation solutions for flow in a slowly varying fracture and the estimation of its transmissivity. Transport in Porous Media, 128, 97–121. https://doi.org/10.1007/s11242-019-01237-7 [Google Scholar] [CrossRef]
8. Dong, S. Q., Lv, W. Y., Xia, D. L., Wang, S. J., Du, X. Y. et al. (2020). An approach to 3D geological modeling of multi-scaled fractures in tight sandstone reservoirs. Oil & Gas Geology, 41(3), 627–637. [Google Scholar]
9. Frampton, A., Hyman, J. D., Zou, L. (2019). Advective transport in discrete fracture networks with connected and disconnected textures representing internal aperture variability. Water Resources Research, 55(7), 5487–5501. https://doi.org/10.1029/2018WR024322 [Google Scholar] [CrossRef]
10. Varnosfaderani, A. M., Haghighi, E. M., Gatmiri, B., Na, S. (2021). Investigation of climate change on unsaturated porous media via a discrete thermo-hydro-mechanical model. Applied Sciences, 11(16), 7617–7639. https://doi.org/10.3390/app11167617 [Google Scholar] [CrossRef]
11. Arson, C., Gatmiri, B. (2010). Numerical study of a thermo-hydro-mechanical damage model for unsaturated porous media. Annals of Solid and Structural Mechanics, 1(2), 59–78. https://doi.org/10.1007/s12356-010-0009-x [Google Scholar] [CrossRef]
12. Fang, H. Y., Chaney, R. C. (2016). Introduction to environmental geotechnology. Boca Raton, FL, USA: CRC Press. [Google Scholar]
13. Wu, W., Li, X., Charlier, R., Collin, F. (2004). A thermo-hydro-mechanical constitutive model and its numerical modelling for unsaturated soils. Computers and Geotechnics, 31(2), 155–167. https://doi.org/10.1016/j.compgeo.2004.02.004 [Google Scholar] [CrossRef]
14. Amarisiri, A., Shannon, B., Kodikara, J. (2014). Numerical modelling of desiccation cracking in a restrained ring test. Canadian Geotechnical Journal, 51(1), 67–76. https://doi.org/10.1139/cgj-2012-0408 [Google Scholar] [CrossRef]
15. Varnosfaderani, A. M., Gatmiri, B., Haghighi, E. M. (2017). A model for moisture and heat flow in fractured unsaturated porous media. International Journal for Numerical and Analytical Methods in Geomechanics, 41(6), 828–858. https://doi.org/10.1002/nag.2577 [Google Scholar] [CrossRef]
16. FascÌ, M. L., Lazzarotto, A., Acuna, J., Claesson, J. (2019). Analysis of the thermal interference between ground source heat pump systems in dense neighborhoods. Science and Technology for the Built Environment, 25(8), 1069–1080. https://doi.org/10.1080/23744731.2019.1648130 [Google Scholar] [CrossRef]
17. Fu, C., Zhao, X. (2020). Study on energy efficiency evaluation and influencing factors of ground source thermal energy management system operation. Thermal Science, 24(5), 3319–3227. https://doi.org/10.2298/TSCI191208123F [Google Scholar] [CrossRef]
18. Dongellini, M., Valdiserri, P., Naldi, C., Morini, G. L. (2020). The role of emitters, heat pump size, and building massive envelope elements on the seasonal energy performance of heat pump-based heating systems. Energies, 13(19), 5098–5111. https://doi.org/10.3390/en13195098 [Google Scholar] [CrossRef]
19. Loreti, L., Valdiserri, P., Garai, M. (2016). Dynamic simulation on energy performance of a school. Energy Procedia, 101, 1026–1033. https://doi.org/10.1016/j.egypro.2016.11.130 [Google Scholar] [CrossRef]
20. Gornov, V. F., Peskov, N. V., Vasilyev, G. P., Kolesova, M. V. (2016). Modelling of thermal behavior of borehole heat exchangers of geothermal heat pump heating systems. MATEC Web of Conferences, 77, 6009–6013. https://doi.org/10.1051/matecconf/20167706009 [Google Scholar] [CrossRef]
21. Yan, S. (2012). The investigation on heat and mass transfer of moisture soil intermittent store and exothermic process. Dalian University of Technology, China. [Google Scholar]
22. Zhao, Z. H., Xu, H. R., Liu, F., Wei, S. C., Zhang, W. et al. (2021). Preliminary prediction of temperature field and thermal damage in Zheduoshan region along Sichuan-Tibet railway. Geoscience, 35(1), 180–187. [Google Scholar]
23. Xue, Z. Z., Sun, S. S., Xu, H. W., Wang, T. Q., Ma, M. H. (2020). Study on exploitation and utilization of geothermal energy in mines and traffic tunnels. Technology Innovation and Application, 31, 58–59. [Google Scholar]
24. Zhu, H. L., Liu, J. X., Chang, D. Q., Chu, Y., Cao, X. M. et al. (2020). Experimental study on deep mine geothermal hazard control based on heat pump and power heat pipe. Metal Mine, 523, 101–107. https://doi.org/10.19614/j.cnki.jsks.202001013 [Google Scholar] [CrossRef]
25. Rybach, L., Wilhelm, J., Gorhan, H. (2003). Geothermal use of tunnel waters-a Swiss speciality. Proceedings of the International Geothermal Conference, pp. 14–17. Reykjavík, Iceland. [Google Scholar]
26. Daosheng, H. (2013). Extraction and analysis of spatial information of surface thermal field in Karst City. Guangxi Normal University, Nanning, Guangxi, China. [Google Scholar]
27. Xu, H. (2011). Analysis on urban heat island effect based on the dynamics of urban surface biophysical descriptors. Shengtai Xuebao/Acta Ecologica Sinica, 31(14), 3890–3901. [Google Scholar]
28. Li, W., Wu, G., Yu, L. J., Liu, Y., Xia, K. et al. (2007). Comparative studies on transpiration characteristics of Vitex negundo at different geomorphological positions at Guilin karst experimental site. Journal of Wuhan Botanical Research, 25(3), 316–319. [Google Scholar]
29. China Weather [2022-05-20]. http://www.weather.com.cn/cityintro/101300501.shtml [Google Scholar]
30. Bathe, K. J. (2006). Finite element procedures. Germany: Klaus-Jurgen Bathe. [Google Scholar]
31. Lin, W. J., Dong, H., Wang, G. L., Su, Z. (2009). Regional evapotranspiration estimation in Hebei plain based on remote sensing. Remote Sensing for Natural Resources, 20(1), 86–90. [Google Scholar]
32. Xu, W. S., Zhao, P. R., Nie, P. F., Wang, X. D. (2008). Porosity-permeability interrelation of limestone and dolomite reservoirs. Oil Gas Geology, 29, 806–811. [Google Scholar]
Cite This Article
 Copyright © 2023 The Author(s). Published by Tech Science Press.
This work is licensed under a Creative Commons Attribution 4.0 International License , which permits unrestricted use, distribution, and reproduction in any medium, provided the original work is properly cited.
 Downloads
 Citation Tools