
 Submit a Paper
 Propose a Special lssue
 Open Access
ARTICLE

Spray Effect on the Thermal Performances of a Dry Cooling Tower
1 Research Institute of Intelligent Energy Technology, Shandong Hetong Information Technology Co., Ltd., Jinan, 250013, China
2 Information Office, Jinan Heating Group Co., Ltd., Jinan, 250011, China
3 Information Office, Jinan Energy Investment Holding Co., Ltd., Jinan, 250098, China
4 Shandong Engineering Laboratory of High-Efficiency Energy Conservation and Energy Storage Technology & Equipment, School of Energy and Power Engineering, Shandong University, Jinan, 250061, China
* Corresponding Author: Suoying He. Email:
Fluid Dynamics & Materials Processing 2023, 19(9), 2289-2304. https://doi.org/10.32604/fdmp.2023.026707
Received 21 September 2022; Accepted 17 January 2023; Issue published 16 May 2023
 View Full Text
 Download PDF
Abstract
Pre-cooling the inlet air of a dry cooling tower by means of a spray can improve the tower performance during periods of high temperature. To study the spray effect on the thermal performance of natural draft dry cooling towers (NDDCTs), in this study 3-D numerical simulations of such a process have been conducted using Fluent 16.2 (a two-way coupled Eulerian-Lagrangian approach). The considered NDDCT is 120 m high and only half system is simulated due to its structural symmetry. Three different spray strategies have been investigated at a typical crosswind speed of 4 m/s, which is the most frequent wind speed. The results have shown that: (1) The three implemented spray strategies can improve the thermal performance of the studied NDDCT with a varying degree of success. In one case, the heat rejection rate can be increased by 35.2%, and the tower outlet water temperature can be decreased by 2.1°C when compared with the no spray case; (2) To improve the thermal performance of the NDDCT using a small amount of water, the design of the spray pre-cooling system must include more nozzles on the windward and fewer or even no nozzles on the leeward sides of the NDDCT.Graphic Abstract
Keywords
Nomenclature
| CD | Droplet resistance coefficient |
| Cp | Specific heat capacity, J/(kg⋅K) |
| D | Diameter, m |
| Df | Diffusion coefficient, m2/s |
| E | Internal energy, J/kg |
| Ed | Energy of droplets, J/kg |
| F | Force, N |
| g | Gravitational acceleration, m/s2 |
| h | Heat and mass transfer coefficients |
| hi | Specific enthalpy of i, J/kg |
| hfg | Latent heat of water evaporation, J/kg |
| J | Diffusion flux, kg/(m2⋅s) |
| k | Resistance coefficient |
| ka | Air thermal conductivity, W/(m⋅K) |
| m | Mass, kg |
| Q | Heat transfer, W |
| Se | Energy source term, W/m3 |
| Sd | Droplet surface area, m2 |
| Sm | Mass source term, kg/(m3⋅s) |
| Smo | Momentum source term, kg/(m2⋅s2) |
| T | Temperature, K |
| v | Velocity, m/s |
| Vcell | Calculation unit volume, m3 |
| Y | Mass fraction of substance |
| z | Height, m |
| δ | Average strain tensor, 1/s |
| μ | Viscosity, kg/(m⋅s) |
| ρ | Density, kg/m3 |
| Φ | Viscous dissipation, W/m3 |
A cooling tower is the key component of thermal power plants, its performance affects the operating efficiency of served power plants [1,2]. A dry cooling tower can save about 90% of water consumption when compared with a wet cooling tower, and thus, dry cooling is promising for areas with abundant coal and insufficient water [3]. A Natural draft dry cooling tower (NDDCT) is a typical type of dry cooling tower applied in thermal power plants. A NDDCT has the advantage of no fan loss when compared with a mechanical draft cooling tower [4]. Usually, the thermal performance of a NDDCT is lower than that of a wet cooling tower. This is because the cooling limit of a dry cooling tower is the dry-bulb temperature of ambient air while the cooling limit of a wet cooling tower is the wet-bulb temperature of ambient air.
To improve the thermal performance of a NDDCT during periods of high temperature, many scholars have proposed various methods such as dry-wet hybrid cooling and evaporative pre-cooling of the inlet air of the tower. He [5] pointed out that evaporative pre-cooling can effectively improve the thermal performance of a NDDCT and it can be divided into wet media pre-cooling and spray pre-cooling. Malli et al. [6] experimentally evaluated the cooling performance of fibrous media in a subsonic wind tunnel, and the experimental results showed that the cooling efficiency of fibrous media decreases with the increase in wind speed. Dogramaci et al. [7] investigated the cooling performance of a new wet media made of eucalyptus fibers. The highest values of cooling efficiency of the wet media are 71% and 57% at the wind speed of 0.1 and 0.3 m/s, respectively. He et al. [8] demonstrated the feasibility of wet media pre-cooling for application in a NDDCT. Subsequently, He et al. [9,10] carried out an experimental study on the performance of trickle media and film media. They obtained correlations for the cooling efficiency and pressure drop of two types of wet media. He et al. and Zhang et al. [11,12] also compared the thermal performance and water consumption of a wet cooling tower, a pre-cooled NDDCT with wet media and a NDDCT. Their results showed that the water consumption of the pre-cooled NDDCT with wet media could result in savings of approximately 70% when compared with the wet cooling tower. Meanwhile, the heat rejection rate of the pre-cooled NDDCT with wet media could be increased by 46% in hottest month when compared with the NDDCT. Although wet media pre-cooling could improve the thermal performance of the NDDCT, the pressure drop introduced by the media reduces the airflow of the tower and then impairs the heat rejection rate. The trade-off between the wet medium cooling effect and the pressure drop should be balanced. To this end, Yan et al. [13,14] proposed a novel 100 mm media + 100 mm gap + 100 mm media arrangement of wet media. They found that the pressure drop of the 300 mm medium-gap-medium is lower than that of a normal medium at the thickness of 300 mm and is close to that of a normal medium at the thickness of 200 mm within tested air speed range, and the cooling effectiveness of the 300 mm medium-gap-medium is higher than that of a normal medium at 200 mm but is lower than that of a normal medium at 300 mm. Unlike wet medium cooling, spray pre-cooling technology has the advantages of low-pressure loss, low cost, and convenient maintenance. The spray pre-cooling system is usually arranged at the entrance of a cooling tower [15], and uses the latent heat of water evaporation to cool the inlet air of the tower thereby, increasing the temperature difference between air and cooling water inside the heat exchanger of the tower.
Studies about spray pre-cooling of a NDDCT have been carried out by many researchers. Sadafi et al. [16,17] demonstrated that the cooling efficiency of a spray pre-cooling system with saline water increases by 8% when compared with a spray pre-cooling system with pure water. Furthermore, they studied the spray pre-cooling system using six nozzles and found that the cooling performance of a tower is increased by 2.9% under optimal nozzle design. Alkhedhair et al. [18,19] conducted an experimental study in a wind tunnel with a cross-section of 1 × 1 m2 and a length of 5.2 m. They found that evaporative pre-cooling performance is favorable at low air velocity and small droplet diameter. They further developed a novel simulation approach for a hollow cone nozzle using experimentally measured spray characteristics and proved that the simulation results are in good agreement with the experimental measurements. Liu et al. [20] found that the performance of two-nozzle spray cooling is affected by the nozzle distance and ambient condition. They suggested that the nozzles should be reasonably arranged in practical application with the consideration of cooling uniformity, cooling temperature drop, and the cooling affected areas.
The spray pre-cooling system could improve the thermal performance of a NDDCT during periods of high temperature, but crosswind will change airflow field of the tower. Du Preez et al. [21] conducted a numerical simulation to investigate the effect of crosswind on the performance of a NDDCT and found that the deterioration effect of crosswind on the NDDCT’s performance varies with wind speed. Al-Waked et al. [22] carried out a simulation study on a Hammond NDDCT and found that crosswind affects the airflow inside and outside the tower to a large extent. Goodarzi [23] reported that the cooling efficiency of a NDDCT might decrease to 75% in the range of moderate to high wind-velocity conditions, and Goodarzi proposed a new exit configuration for tower stack to reduce the throttling effect of deflected plume. Goodarzi’s new exit configuration improves the cooling efficiency of the tower up to 9% at a wind speed of 10 m/s. Ahmadikia et al. [24] presented that the heat rejection rate of a NDDCT sprayed with 50 kg/s water flowrate is increased by 4% when compared with no spray condition at a crosswind of 10 m/s.
Literature review found that crosswind will change airflow field inside and outside the tower, and therefore, the nozzle design of the spray pre-cooling system under crosswind will be different from windless conditions. It is necessary to investigate the nozzle design of spray pre-cooling system under typical crosswind, especially under the most frequent wind speed. To this end, a 3-D model of a spray pre-cooled NDDCT was implemented using Fluent 16.2. The airflow field and temperature field of the NDDCT under typical crosswind with and without nozzle spray were compared. Further, the effects of three spray strategies on the thermal performance of the NDDCT under typical crosswind were extensively explored. This study could provide guidance for the engineering design of a spray pre-cooled NDDCT.
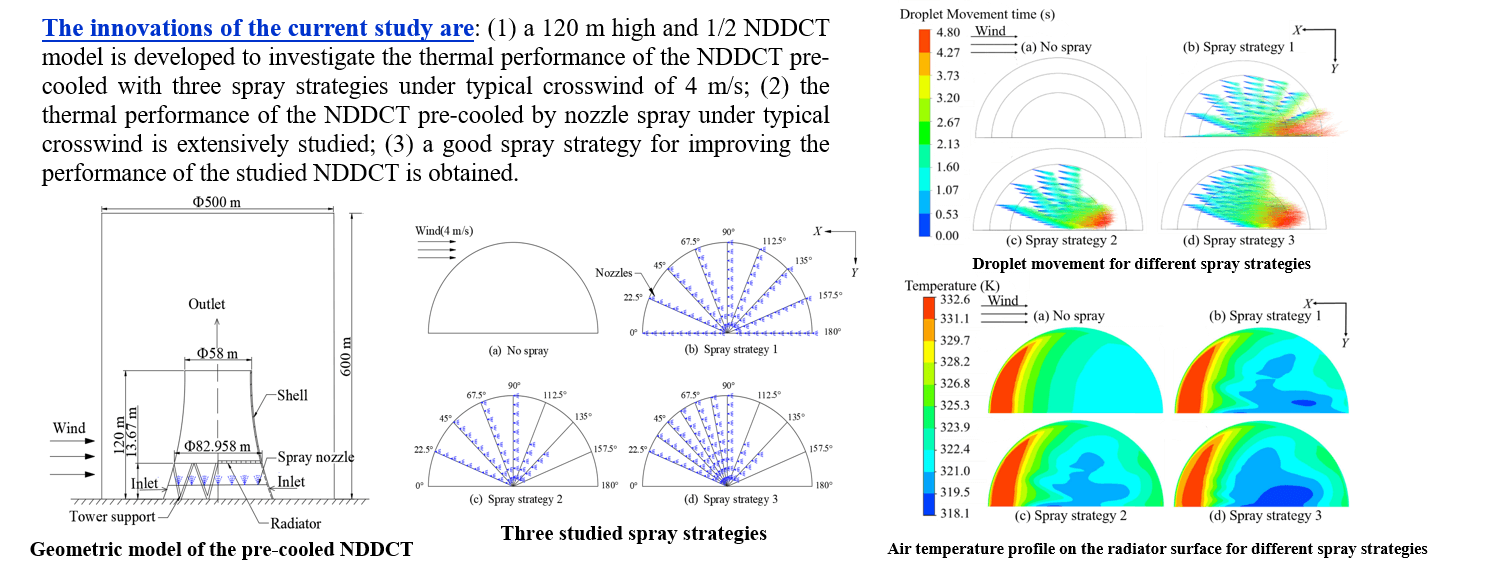
The innovations of the current study are: (1) A 120 m high and 1/2 NDDCT model is developed to investigate spray effect on the thermal performance of the NDDCT pre-cooled by nozzle spray under typical crosswind of 4 m/s; (2) The thermal performance of the NDDCT pre-cooled with three spray strategies under typical crosswind is extensively studied, including droplet movement, air temperature distribution, the heat rejection performance of the tower, air ventilation performance of the tower and the outlet water temperature of the tower; (3) A good spray strategy for improving the performance of the studied NDDCT is obtained.
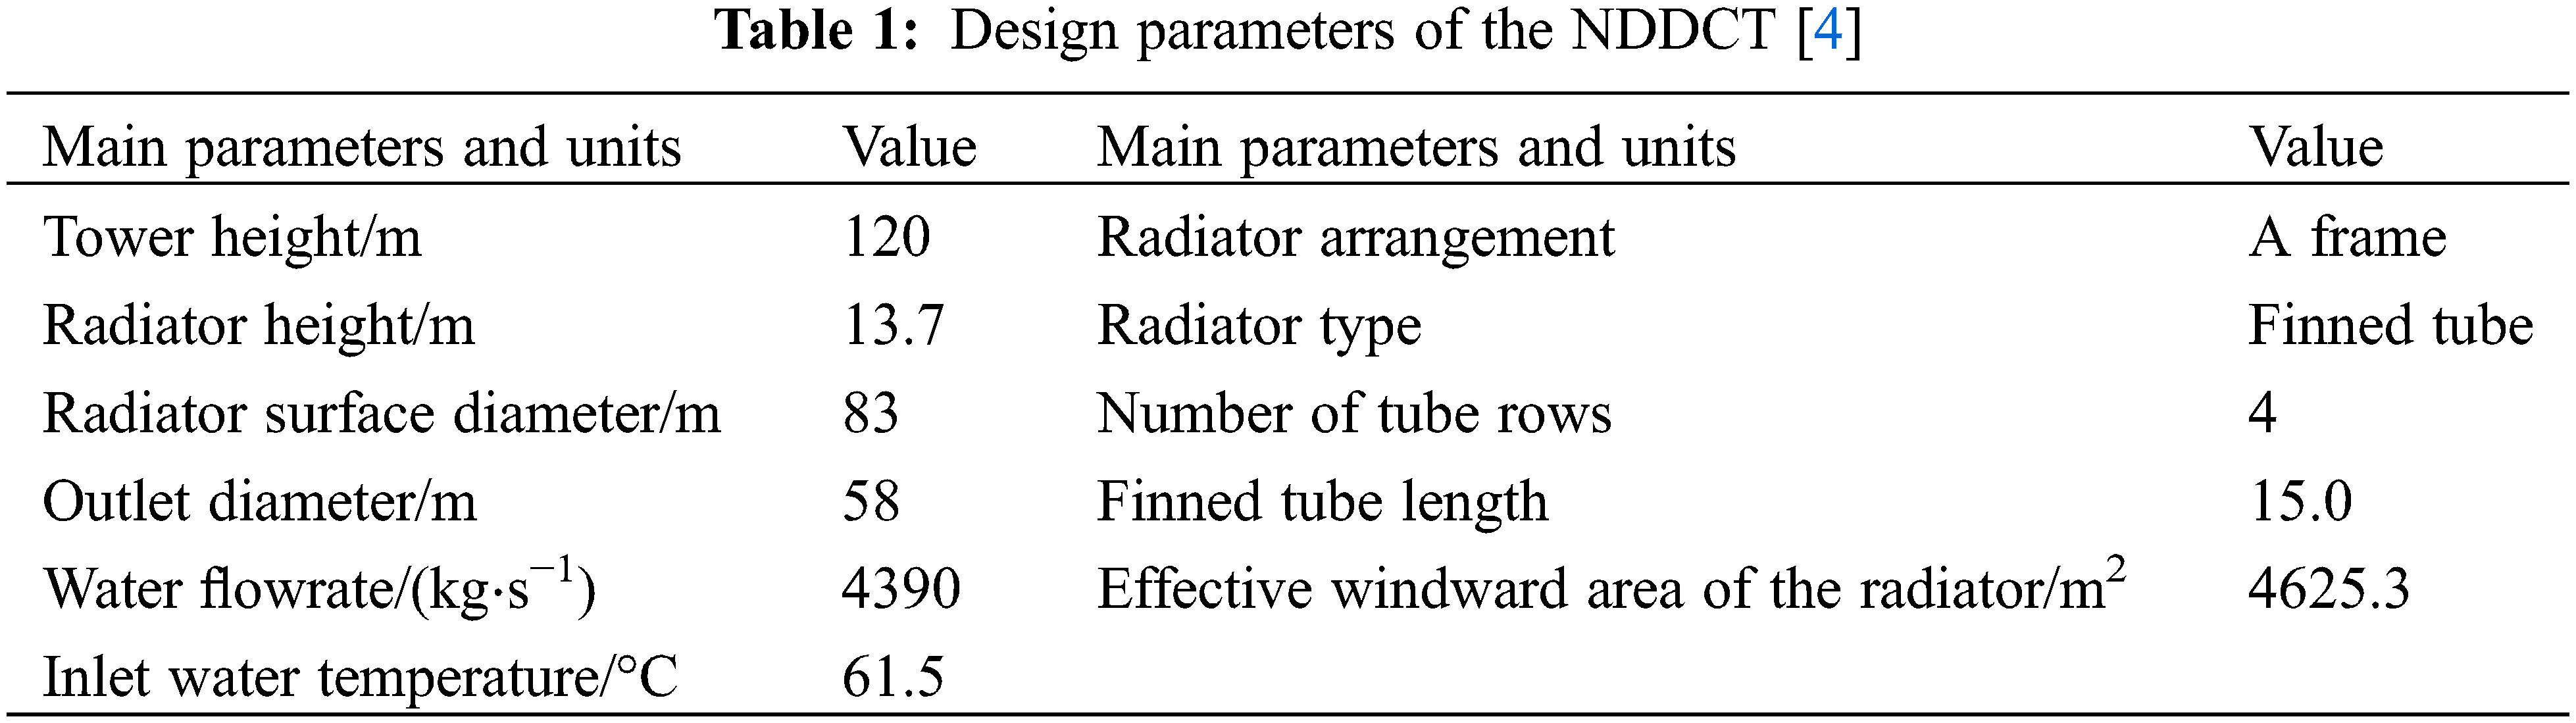
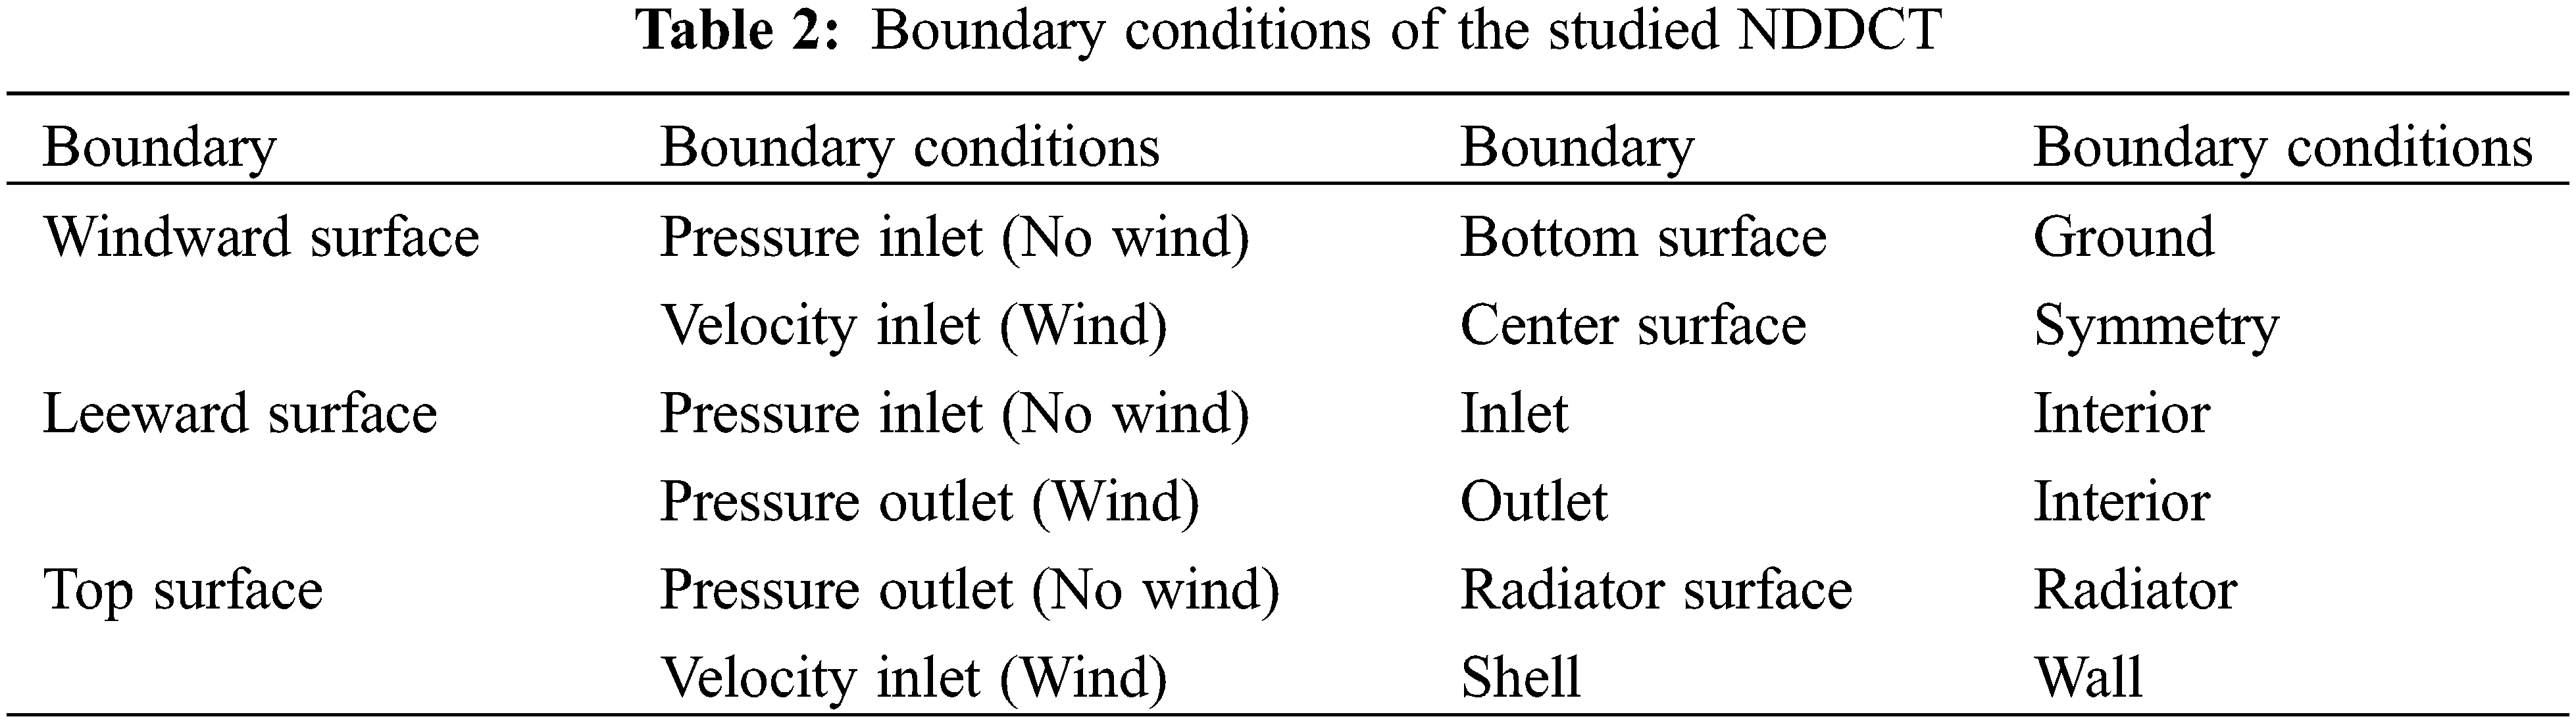
The geometric model of the studied NDDCT is shown in Fig. 1. Table 1 summarizes the main structure and design parameters of the NDDCT model. The simulation zone was set as a space with a height of 600 m and a diameter of 500 m since external airflow affected the air flow and heat exchange process inside the NDDCT. In this study, the direction of the crosswind is shown in Fig. 1. A half tower model was used for research as the airflow field of the tower was symmetry along the stable crosswind direction. Table 2 gives the boundary conditions of the studied NDDCT model.
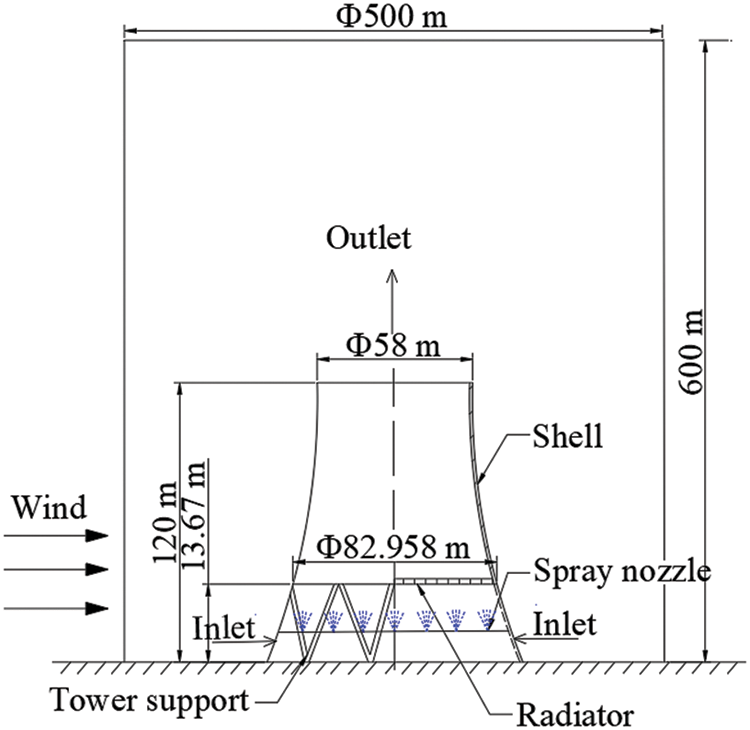
Figure 1: Geometric model of the NDDCT pre-cooled with nozzle spray under crosswind
In the spray pre-cooled NDDCT, the spray pre-cooling system was arranged at the air inlet zone of the NDDCT. Water was injected from the nozzles as fine droplets, the droplets then exchanged heat and mass with air. The spray cooling model in the Fluent software was used to simulate the spray pre-cooling process.
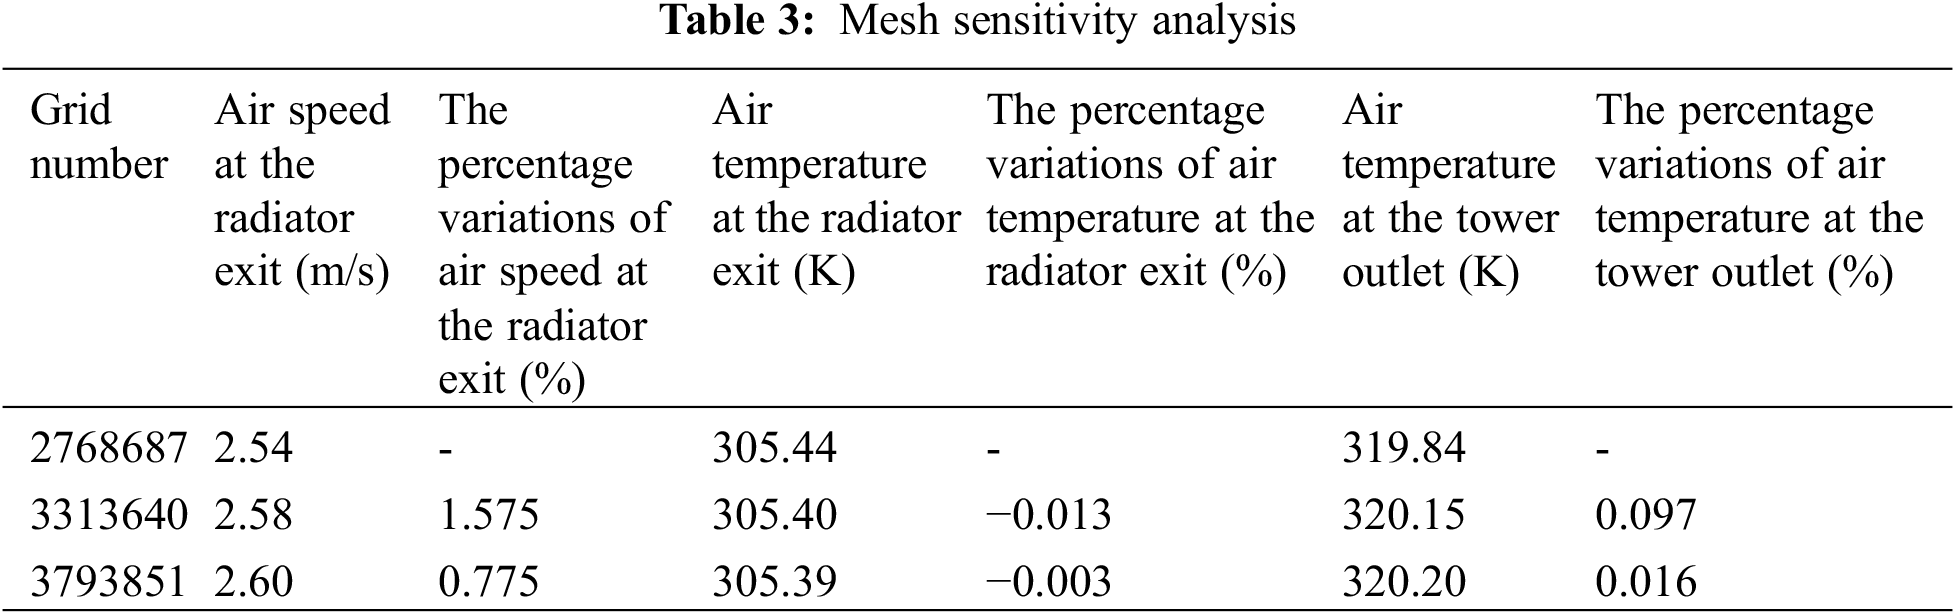
A structured grid was used to do mesh generation. The operating conditions used for the grid refinement study were: ambient air temperature of 40°C, inlet water temperature of 61.5°C, and circulating water at a flowrate of 4390 kg/s. Three grid numbers were studied and the results are listed in Table 3. As shown in Table 3, the increase in the grid number from 3313640 to 3793851 would not make a big difference in the representative variables (i.e., air speed at the radiator exit, air temperature at the radiator exit, air temperature at the tower outlet). Finally, the grid number of 3313640 was selected for further simulation with the consideration of both computational accuracy and time.
The Eulerian-Lagrangian method was used to describe the motion of the two-phase flow in the spray evaporative cooling process. In the Eulerian-Lagrangian method, air was the continuous phase and was described by the Eulerian method while water droplet was the discrete phase and was described by the Lagrangian method. Different methods can be adopted to describe the interaction between continuous and discrete phases in turbulent flow [25,26], including the one-way coupling method, the two-way coupling method and the four-way coupling method. The two-way coupling method was used in this paper because the volume fraction of water droplets was less than 10%. The SIMPLE method was used to solve the pressure-velocity coupling scheme. The pressure was discretized by the standard scheme, and the second-order upwind scheme was used to discretize and to solve pressure.
2.3.1 The Governing Equations of Continuous Phase
In the Eulerian-Lagrangian method, the air was the continuous phase which was treated as a steady, incompressible ideal gas, and of turbulent flow. Dry air was simplified to be composed of 77% nitrogen and 23% oxygen, and wet air was simplified to be composed of nitrogen, oxygen, and water vapor. Air flow field was described by the Reynolds-averaged Navier-Stokes conservation equations (RANS) combined with the standard k-ε model to represent the turbulence effects [27]. The terms of mass, momentum, and energy source of the droplets were added to the governing equation to consider the influence of water droplets on air. In the Eulerian framework, the governing equation of air is:
where ρ is density, kg/m3; vi and vj are air velocity components, m/s; Sm is mass source term, kg/(m3⋅s); g is gravitational acceleration, m/s2; P is pressure, Pa; μ is aerodynamic viscosity, kg/(m⋅s); δ is average strain tensor, 1/s; Smo is momentum source term, kg/(m2⋅s2); E is internal energy, J/Kg; hi′ is specific enthalpy of i′, J/kg; Ji′ is diffusion flux of i′, kg/(m2⋅s); ka is air thermal conductivity, W/(m⋅K); T is continuous phase temperature, K; Φ is viscous dissipation, W/m3; Se is energy source term, W/m3; Yj is mass fraction of j.
The source terms Sm, Smo, Se were calculated from the Lagrangian framework by the alternate process through volume averaging method and then incorporated into the Eulerian airflow RANS equations. For every computational cell, the volume averaged source terms were computed by collecting the influence of the droplets within the computational cell. Thus, the influence of droplets on the surrounding airflow was recognized. Volume-averaged source term of each cell was calculated by synthesizing the effects of droplets passing through the cells as:
where Vcell is cell volume, m3; md is mass of a single droplet, kg; Vd is droplet velocity, m/s; Ed is total energy of a single droplet, J/kg, including kinetic energy, potential energy, and internal energy. Q is the heat transfer, W. The change of total energy was mainly caused by the heat transfer (i.e., sensible heat and latent heat), and the changes of other energy were ignored in the current study. The heat transfer Q can be calculated by Eq. (8) [28].
2.3.2 The Governing Equations of Discrete Phase
In the process of spray evaporative cooling, particle size, temperature, speed, and trajectory of the spray droplets were different. Due to a huge number of droplets, “droplet group” was introduced as the research object to decrease computational time. Each droplet group represented a certain water flowrate. In addition, it was assumed that all the droplets in each droplet group had the same characteristics and followed the same evaporation laws, thus the discrete phase was solved for all the droplet groups.
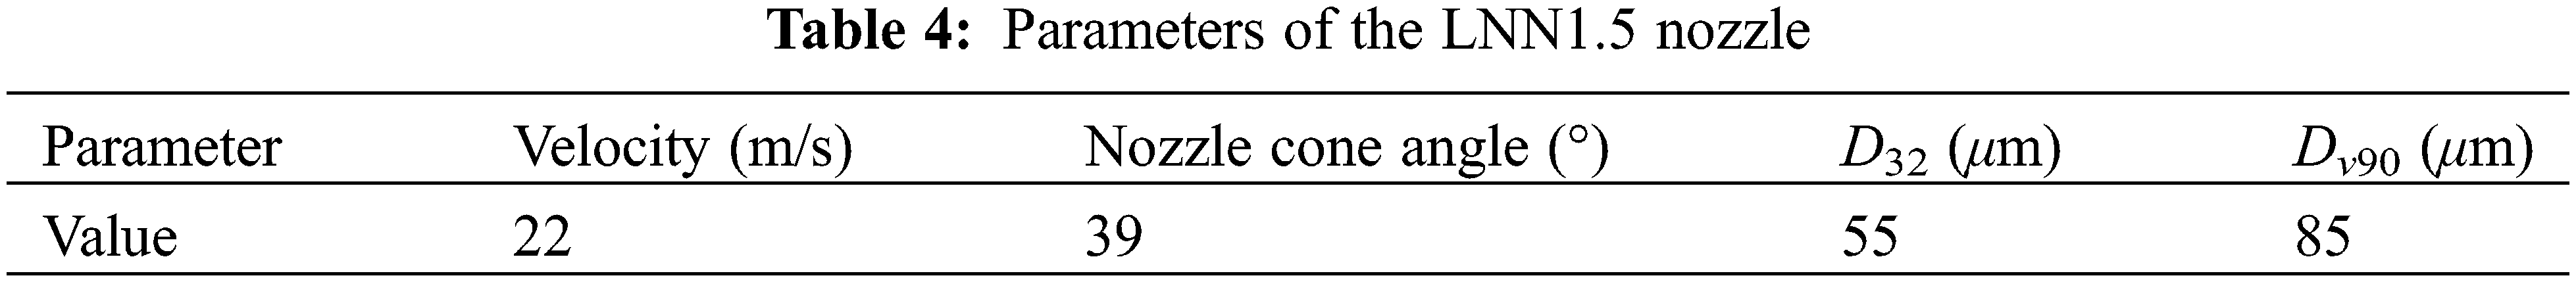
A hollow cone nozzle produces finer droplets when compared with a full cone nozzle. Furthermore, the evaporation process is accelerated because the contact area between air and water droplets is enlarged. In view of its excellent performance for cooling the air, a LNN1.5 commercial hollow cone nozzle was used during simulation. The parameters of the LNN1.5 nozzle are listed in Table 4, and the water flowrate of single nozzle spray was 0.2 kg/s [29]. During the simulation process, droplet size distribution was determined by the Rosin-Rammler distribution function, whose functional relationship is:
where YD is mass fraction of droplets; Dd is droplet diameter, μm; and Dm is the Rosin-Rammler average droplet diameter, μm (as for the LNN1.5 nozzle, Dm = 63.5 μm, n = 3.14).
The water droplets were treated as droplet parcels during the simulation because of the huge number of water droplets in the spray cooling system. The “parcel” represented a fraction of the total water mass flowrate. Each parcel included water droplets with identical properties (i.e., diameter, velocity, trajectory, and temperature). Zhang et al. [30] studied three parcels’ numbers of 200, 400 and 600 for a LNN1.5 nozzle, and revealed that the deviation of the mean dry-bulb temperature of outlet air with the 200 parcels was less than 1% when compared with the 400 and 600 parcels. Thus, “200” droplet parcels were used in this study to save computational time. The governing equations of droplets are:
where hC is convective heat transfer coefficient, W/(m2⋅K); hD is convective mass transfer coefficient, m/s, which can be calculated by the empirical correlations [31,32]:
where mw is mass flow rate of droplet, kg/s; Cp is specific heat capacity, J/(kg⋅K); ΔTd is droplet temperature drop, K; Sd is droplet surface area, m2; Ta is air temperature, K; Td is droplet temperature, K; md is droplet mass, kg; hfg is latent heat of water evaporation, J/kg; D is droplet diameter, m; Nu is Nusselt number, Nu= hCD/ka; ReD is droplet Reynolds number, ReD = ρa(v − Vd)D/μ; Pr is Prandtl number, Pr = μcp/ka; Sh is Schwood number, Sh = hDD/Df; Df is diffusion coefficient, m2/s; Sc is Schmidt number Sc = μ/ρDf.
In the Lagrangian framework, the droplet motion follows Newton’s second law, and the trajectory of a droplet can be obtained by integrating the droplet motion equation. To simplify calculation, assuming that droplet had its own velocity and was spherical, the equation of the motion of a single droplet is:
where t is time, s; FD is resistance, N; Fg is gravity, N; CD is droplet resistance coefficient [33]; ρa is air density, kg/m3; Vr is relative velocity of droplet, m/s; μ is aerodynamic viscosity, kg/(m⋅s).
2.3.3 The Governing Equations of Radiators
The radiator was used to describe the radiator of the NDDCT. The radiator was treated as a surface with resistance coefficient and heat transfer coefficient. The empirical correlations for the resistance coefficient and heat transfer coefficient of the radiator are [4]:
where k is resistance coefficient; h is heat transfer coefficient, W/(m2⋅K).
2.4 Boundary Conditions of Crosswind
As shown in Table 2, windward surface was set as the velocity inlet in the computational domain. The crosswind speed at different heights can be calculated as [34]:
where vw is crosswind speed, m/s; zref is reference height, which is 10 m; vwref is wind speed at reference height, m/s; z is height, m; α is wind shear index, which is 0.2 according to the environment [35].
A same NDDCT model with the reference [4] was implemented to validate the CFD model under windless conditions. The heat exchanger was located horizontally at the tower inlet cross section. Besides, the tower dimensions are shown in Table 1. The model was validated under these conditions: ambient air temperature was 15.6°C, inlet water temperature of the radiator was 61.5°C, and circulating water flow rate was 4390 kg/s. Fig. 2 reports the simulation results and experimental results published in the reference [4]. Relative errors of air temperature, air velocity at the tower outlet and heat rejection rate of the tower are 0.45%, 0.23% and 0.59%, respectively. Therefore, the model is reliable and can be used for further simulation.
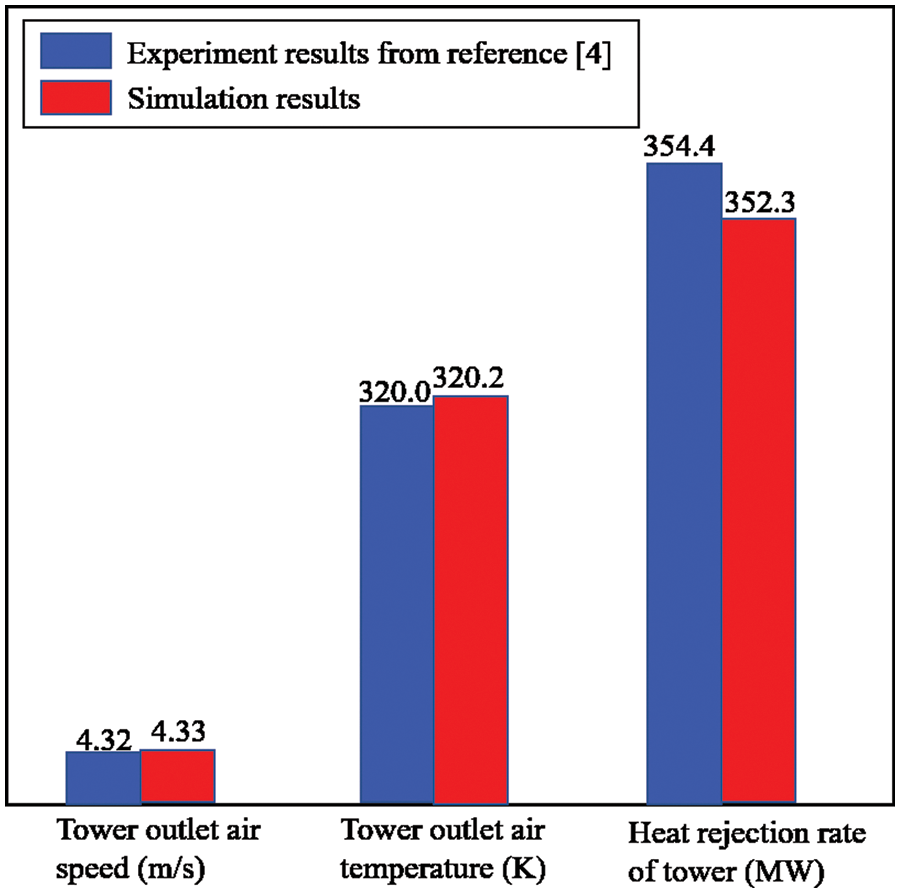
Figure 2: Model validation
Spray pre-cooling the inlet air is proposed to improve the thermal performance of a NDDCT during periods of high temperature, this paper intends to conduct research under typical high ambient temperatures. Therefore, air temperature of 40°C, relative humidity of 40% and crosswind speed of 4 m/s (which was the most frequent wind speed) were selected for simulation [35].
Spray water flowrate required to fully saturate the airflow of the half tower was calculated as 16.0 kg/s. Therefore, nine branch lines were evenly arranged in the half tower as shown in Fig. 3. The angular space between two contiguous branch lines was 22.5°. The nozzle space on each branch line was 4 m and therefore, 10 nozzles were arranged on each branch line. The two branch lines of 0° and 180° sprayed half of the corresponding water flowrate since the tower was simulated as a symmetry.
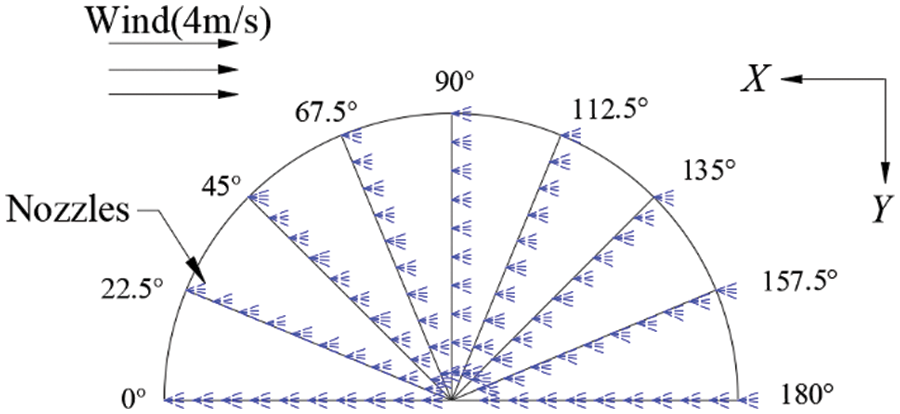
Figure 3: Schematic diagram of nozzle arrangement
3.1 Analysis of Air Flow Field and Temperature Field
Figs. 4 and 5 show the mass fraction of water vapor and air temperature distribution at the radiator surface before and after spray, respectively. Fig. 4a shows that the mass fraction of the water vapor on the whole radiator surface is uniform without spray, and its value is 0.01867. Fig. 4b shows that the mass fraction of the water vapor on the whole radiator surface is increased by the spray, and the mass fraction of the water vapor on leeward side is higher than that on windward side.
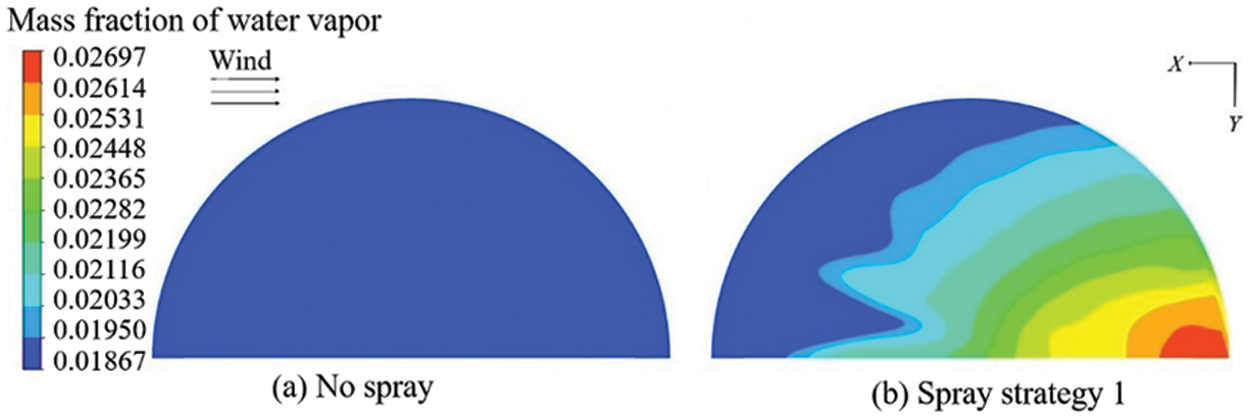
Figure 4: The mass fraction of water vapor on the radiator surface
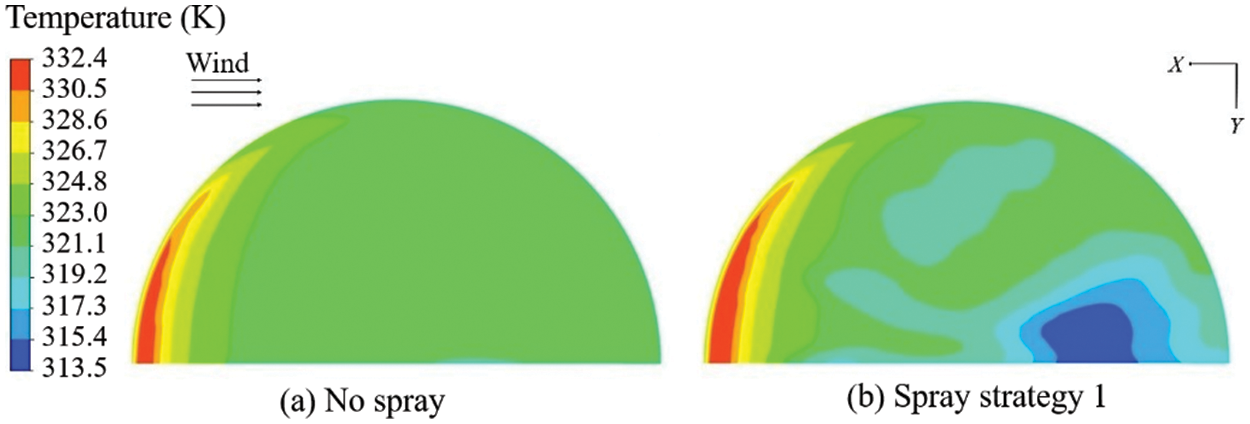
Figure 5: The air temperature profile on the radiator surface
Fig. 5a shows that the air temperature distribution on windward side is higher than that on leeward side at no spray condition, which is because flow vortices and backflows exist on the windward side. Fig. 5b shows that the air temperature is decreased to a certain extent after spray, and the air temperature drops more sharply at the area where a high mass fraction of water vapor exists. This is reasonable as high mass fraction of water vapor means that there is more water evaporation and a good cooling effect.
Fig. 6 shows the movement of spray droplets for spray strategy 1. The water droplets move to the leeward side due to crosswind, and some of the spray droplets are even blown out of the tower. The spray droplets blown out of the tower will not participate in heat exchange and will not improve the thermal performance of the NDDCT. Therefore, we need to adjust spray strategy to avoid the blowing out of droplets.
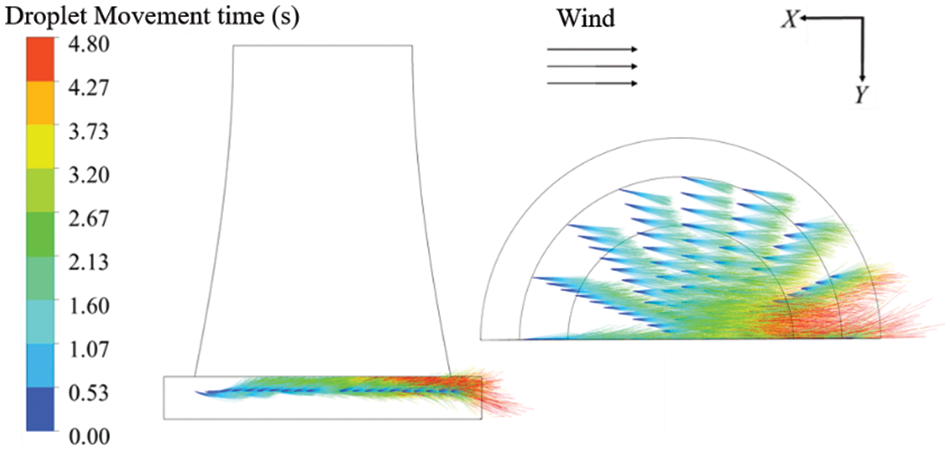
Figure 6: Water droplet movement for spray strategy 1
3.2 Thermal Performance of the NDDCT
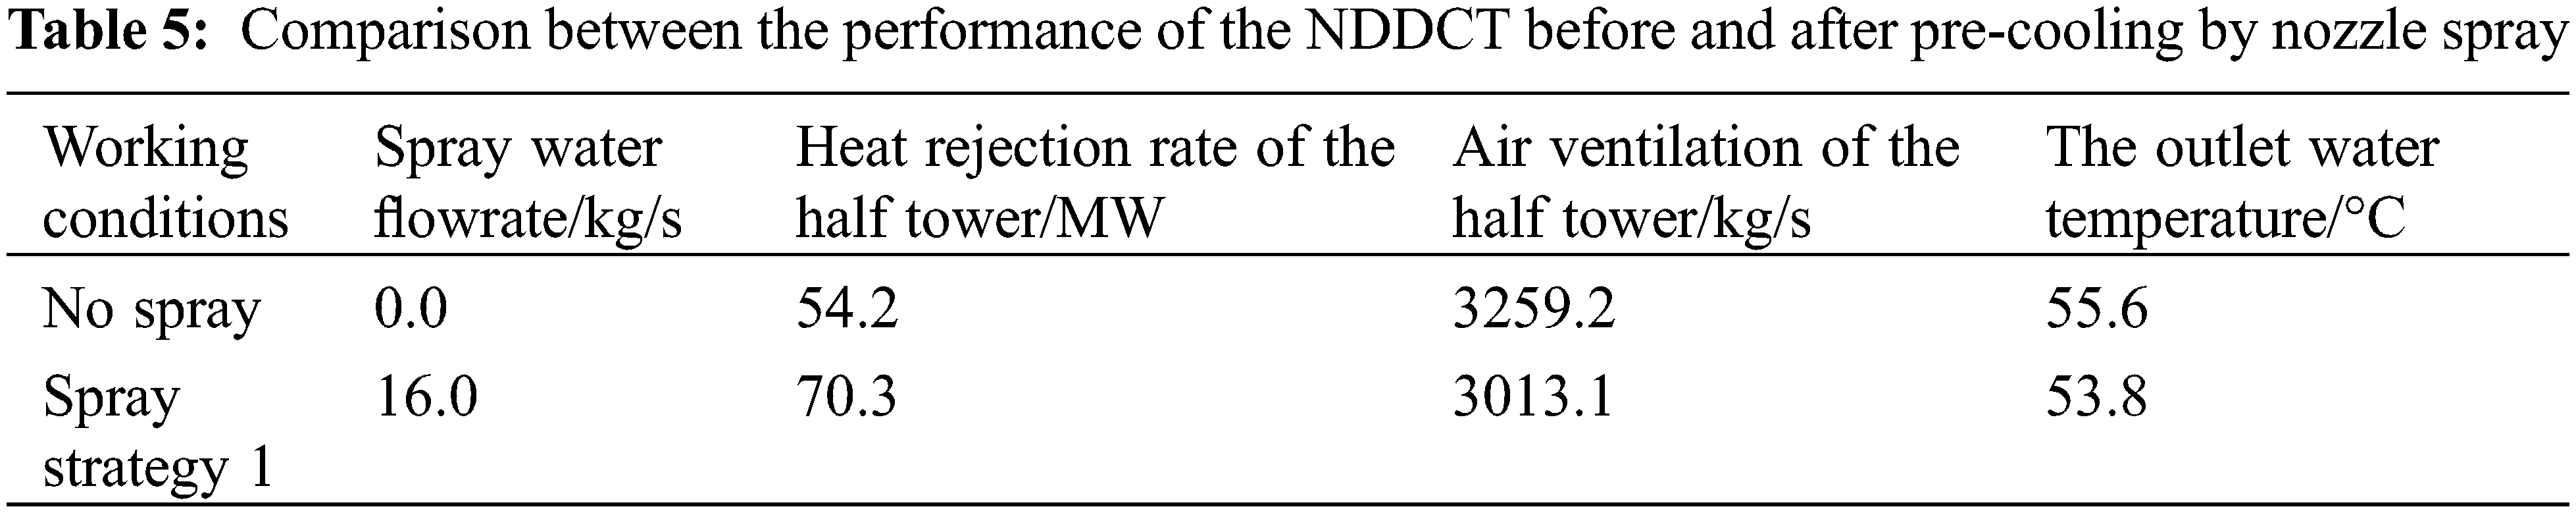
Table 5 presents the thermal performance of the NDDCT before and after pre-cooling by nozzle spray. The inlet air of the NDDCT is cooled and humidified by nozzle spray, and therefore the air ventilation of the half tower is decreased from 3259.2 to 3013.1 kg/s with a reduction of 7.6%, the heat rejection rate of the half tower is increased from 54.2 to 70.3 MW with an increment of 29.7%, and the outlet water temperature is decreased from 55.6°C to 53.8°C with a temperature reduction of 1.8°C. In conclusion, the thermal performance of the NDDCT is improved by pre-cooling the inlet air of the tower.
3.3 Investigation on Spray Strategies
Fig. 6 shows that some of spray droplets are blown out of the tower due to crosswind. The spray droplets blown out of the tower will not participate in heat exchange and will not improve the thermal performance of the NDDCT. This will result in invalid evaporation and waste of water resources. Therefore, we need to adjust the spray strategy to avoid the blowing out of the water droplets. As mentioned above, the air temperature distribution on windward side is higher than that on leeward side as shown in Fig. 5. Therefore, we can arrange more nozzles on the windward side. To this end, spray strategies 2 and 3 are proposed as shown in Fig. 7.
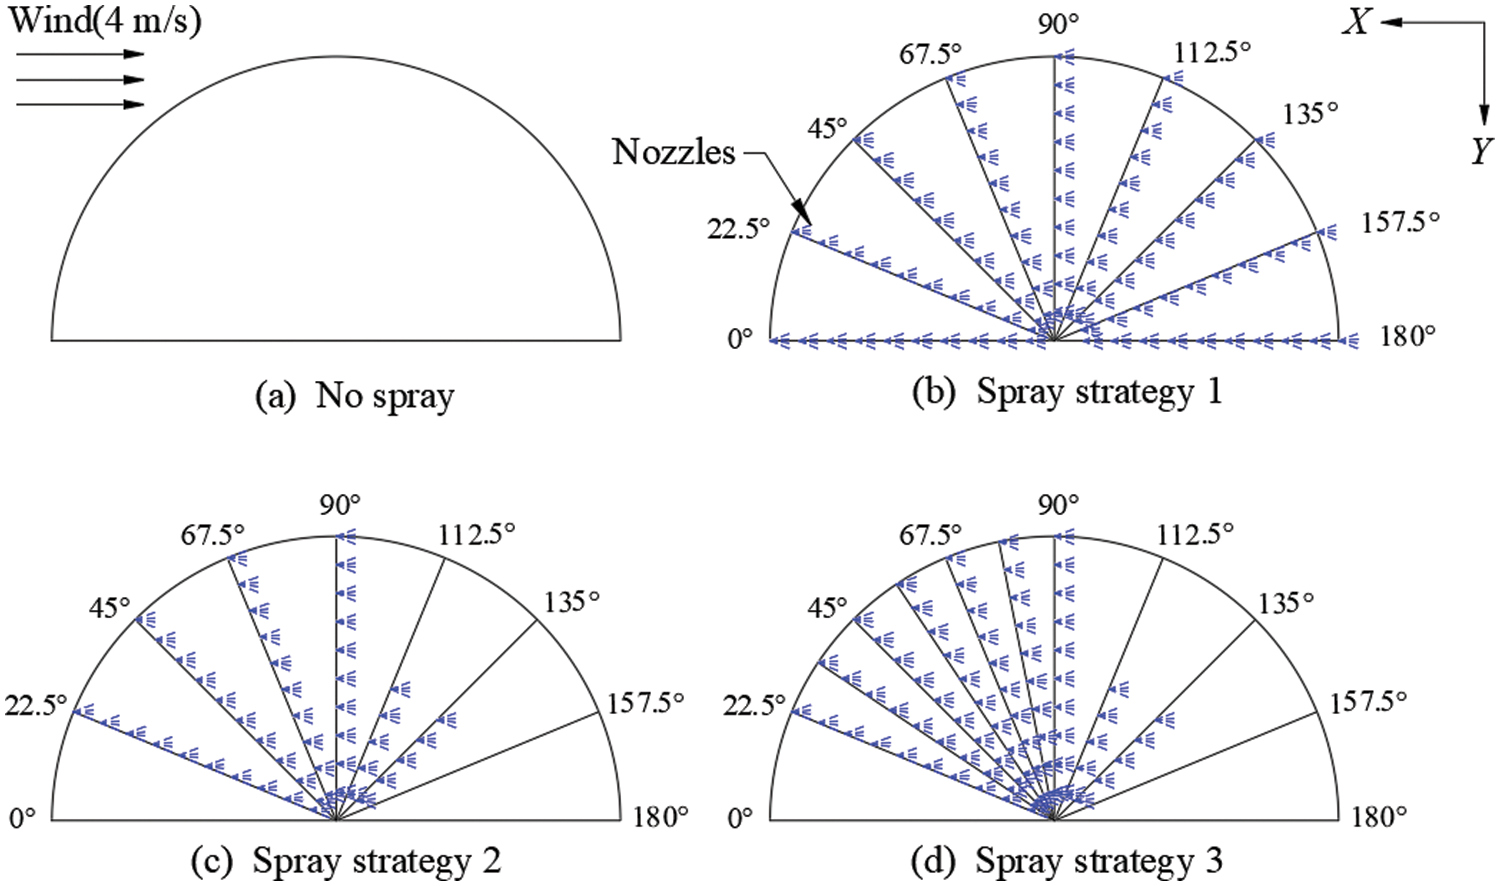
Figure 7: Schematic diagram of the three studied spray strategies
Spray strategy 2 is a case that all spray nozzles on the branch lines of 0°, 157.5° and 180° are closed while spray nozzles on the branch lines of 112.5° and 135° are partly closed. Specifically, the spray nozzles on the branch lines of 112.5° and 135° at the radiuses of 21.5∼41.5 m are closed while the nozzles at the radiuses of 0∼21.5 m are open. For such a case, the spray water flowrate is reduced from 16 to 10 kg/s.
In spray strategy 3, all spray nozzles on the branch lines of 0°, 157.5° and 180°, and spray nozzles on the branch lines of 112.5° and 135° at the radiuses of 21.5∼41.5 m are moved to the branch lines of 33.75°, 56.25° and 78.75°. For such a case, the spray water flowrate is still 16 kg/s.
Fig. 8 shows that the water droplets at spray strategies 2 and 3 are not blown out of the tower under crosswind conditions. This means that spray strategies 2 and 3 can prevent the blowing out of spray droplets and can make full use of water evaporation to cool the radiator of the tower. Besides, spray affected area of spray strategy 3 is larger than that of spray strategy 2.
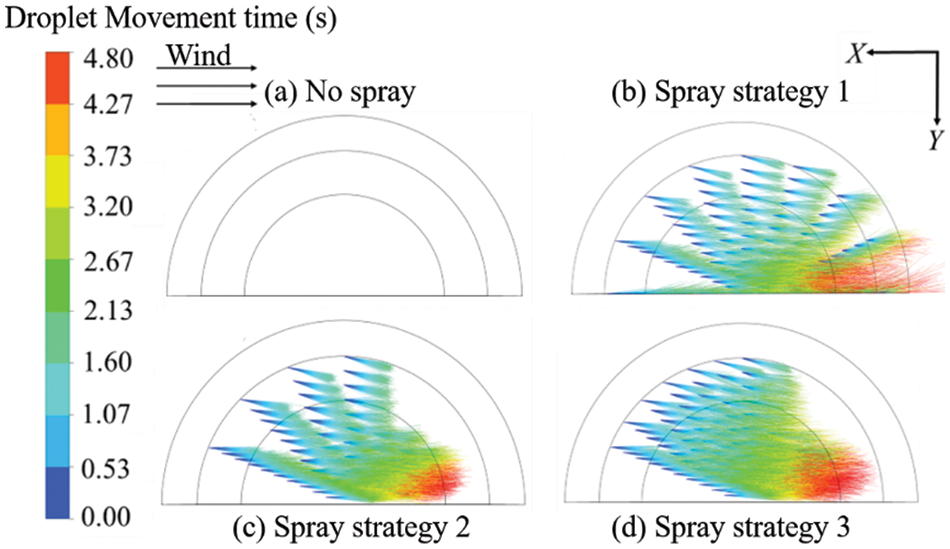
Figure 8: Droplet movement for different spray strategies
Fig. 9 shows the air temperature profile on the radiator surface at different spray strategies. Spray strategies 1, 2 and 3 decrease the air temperature on the radiator surface, and the air temperature drop by spray strategy 3 is more significant than for spray strategies 1 and 2.
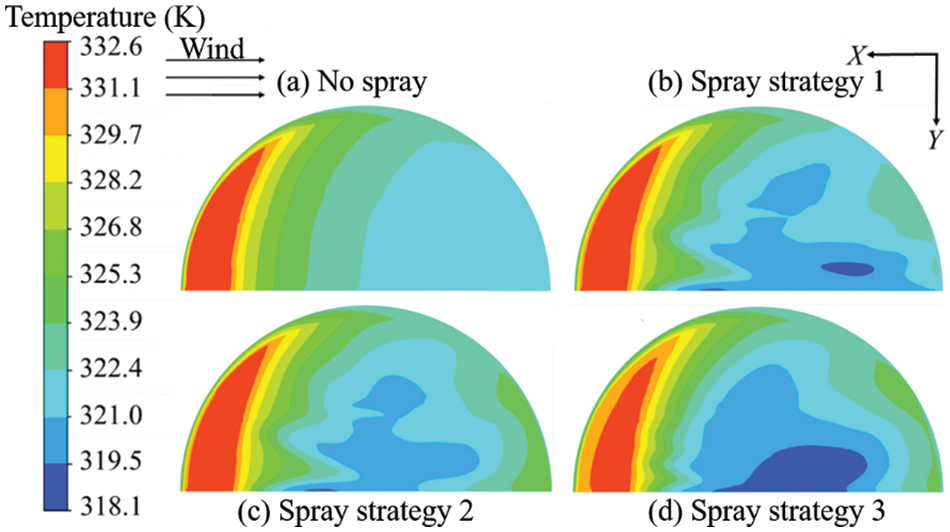
Figure 9: Air temperature profile on the radiator surface for different spray strategies
To further evaluate the improvement in the performance of the NDDCT per unit spray water flowrate, the heat rejection increment per unit spray water flowrate is introduced as Eq. (21). A high value of the heat rejection increment per unit spray water flowrate means that one can obtain a high increment in the heat rejection rate of the NDDCT at a given spray water flowrate.
where Δq is the increment in heat rejection rate of a NDDCT, MW; mw is spray water flowrate, kg/s; Δ ˙q is heat rejection increment per unit spray water flowrate, MJ/kgwater.
Table 6 compares the thermal performance of the NDDCT for different spray strategies. For spray strategy 1, the heat rejection rate of the half NDDCT is increased from 54.2 to 70.3 MW with an increment of 29.7%, the air ventilation of the half NDDCT is decreased from 3259.2 to 3013.1 kg/s with a reduction of 7.6%, and the outlet water temperature is decreased from 55.6°C to 53.8°C with a temperature reduction of 1.8°C when compared with no spray case. For spray strategy 2, the heat rejection rate of the half NDDCT is increased from 54.2 to 66.7 MW with an increment of 23.1%, the air ventilation of the half NDDCT is decreased from 3259.2 to 3041.9 kg/s with a reduction of 6.7%, and the outlet water temperature of the tower is decreased from 55.6°C to 54.2°C with a temperature reduction of 1.4°C when compared with no spray case. For spray strategy 3, the heat rejection rate of the half NDDCT is increased from 54.2 to 73.3 MW with an increment of 35.2%, the air ventilation of the half NDDCT is decreased from 3259.2 to 2972.3 kg/s with a reduction of 8.8%, and the outlet water temperature is decreased from 55.6°C to 53.5°C with a temperature reduction of 2.1°C when compared with no spray case.
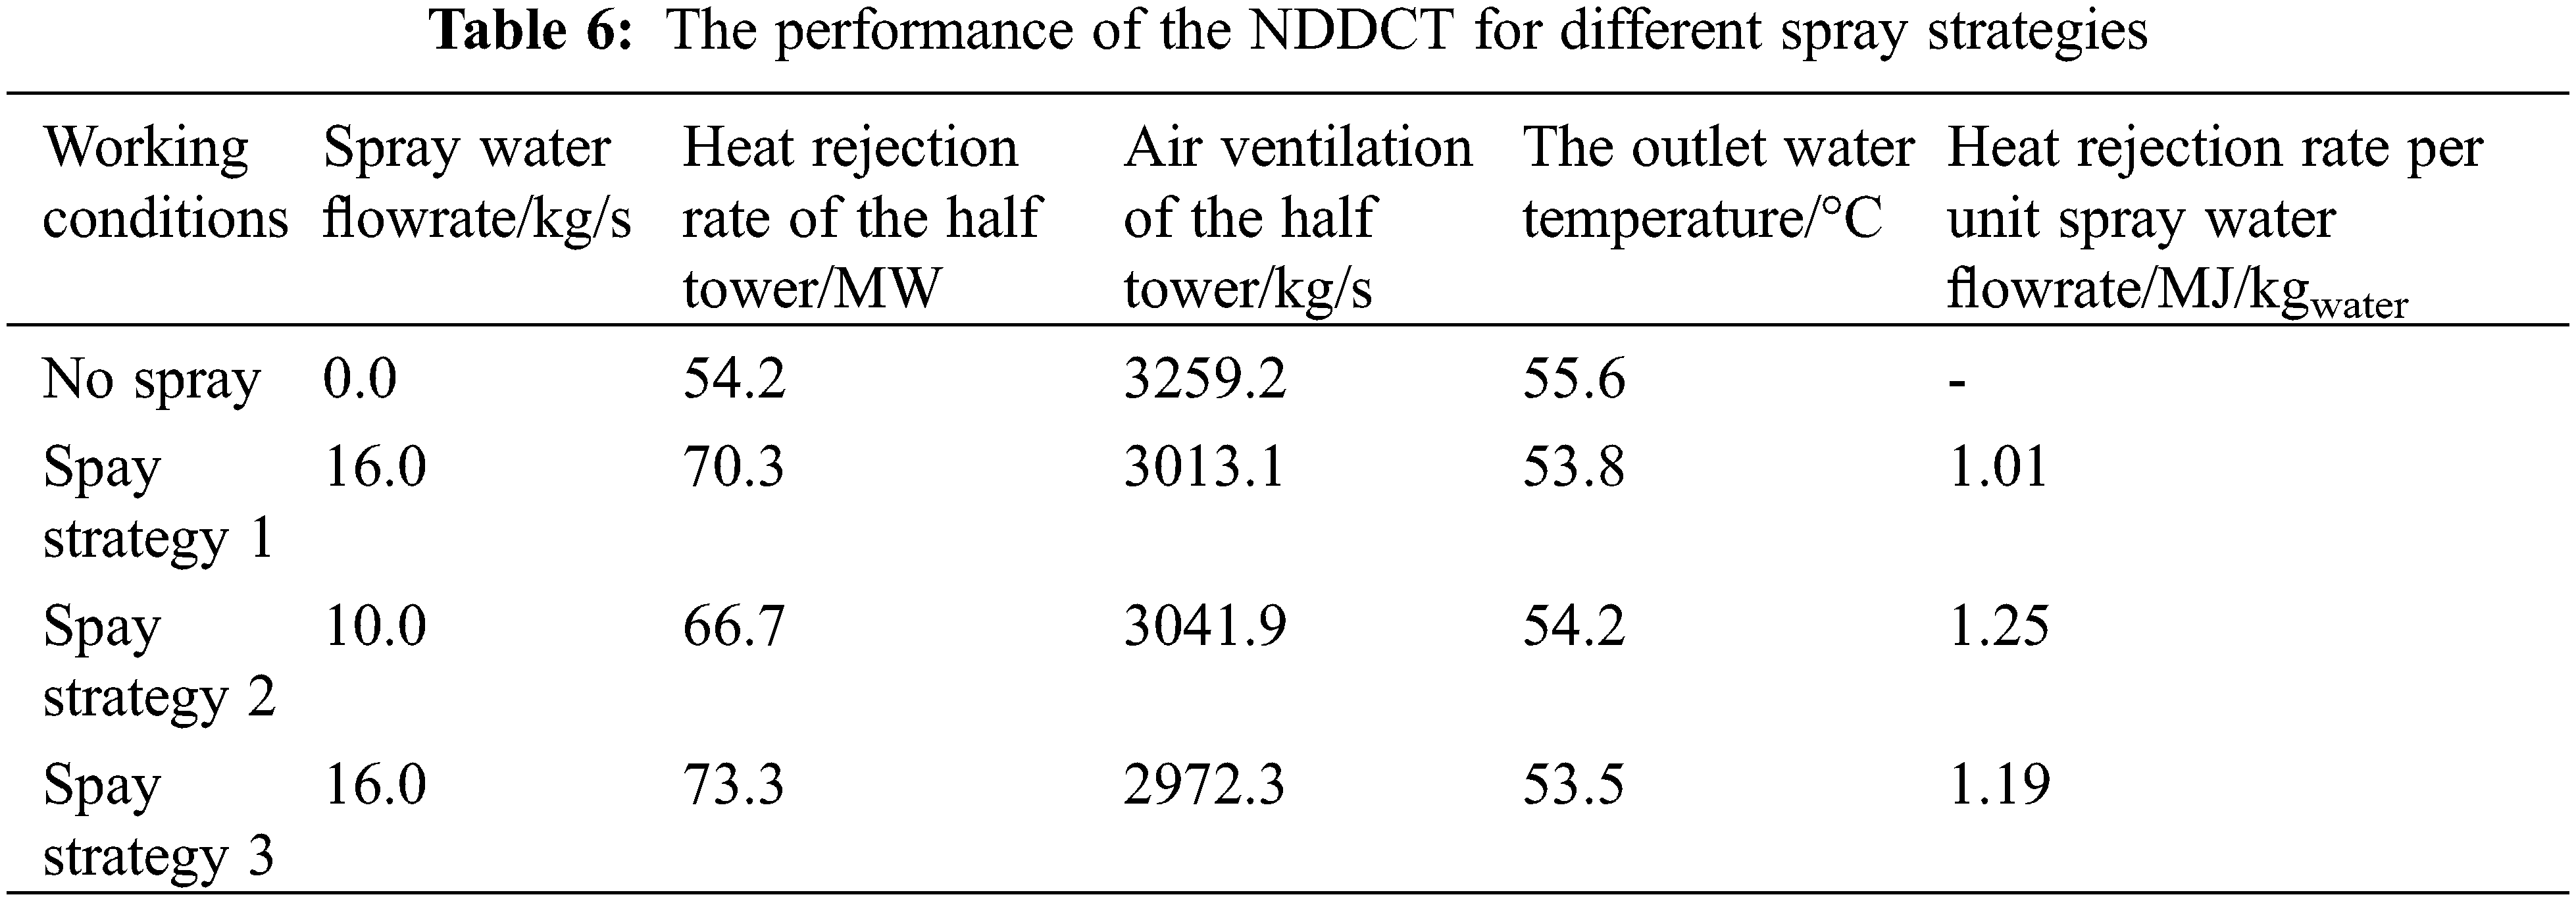
In terms of the heat rejection increment per unit spray water flowrate, spray strategy 2 has highest value, followed by spray strategy 3 and lowest for spray strategy 1. On the one hand, the spray water flowrate for spray strategy 1 is the same as spray strategy 3. Besides, spray strategy 3 has higher heat rejection rate when compared with spray strategy 2. This is because some spray droplets are blown out of the tower due to crosswind at spray strategy 1. The spray droplets blown out of the tower will not participate in heat exchange and will not improve the thermal performance of the NDDCT. This will result in invalid evaporation and waste of water resources. Therefore, the heat rejection rate per unit spray water flowrate by spray strategy 3 is higher than that of spray strategy 1. On the other hand, spray strategy 2 closes some nozzles and the spray water flowrate is reduced by 37.5% when compared with spray strategies 1 and 3. Spray strategy 3 sprays more water when compared with spray strategy 2, and makes the low-temperature area on the radiator surface more concentrated. As a result, spray strategy 3 has a lower outlet water temperature and higher heat rejection rate when compared with spray strategy 2. Therefore, increasing the spray water flowrate can improve the heat rejection rate of the NDDCT, but it is not recommended to increase the spray water flowrate indefinitely.
In this paper, a 3-D model of a spray pre-cooled NDDCT with a tower height of 120 m was implemented. The thermal performance of the NDDCT pre-cooled with three spray strategies under typical crosswind was extensively studied. The following conclusions can be drawn:
(1) All the studied spray strategies improve the thermal performance of the 120 m high NDDCT. The thermal performance values of the NDDCT pre-cooled with spray strategies 1, 2 and 3 are increased by 29.7%, 23.1% and 35.2% (i.e., the heat rejection rates of the NDDCT are increased from 54.2 to 70.3, 66.7 and 73.3 MW), respectively when compared with no spray case. The values of the outlet water temperature of the NDDCT are decreased by 1.8°C, 1.4°C and 2.1°C (i.e., the values of the outlet water temperature are decreased from 55.6°C to 53.8°C, 54.2°C and 53.5°C), respectively.
(2) Spray strategy 3 has the highest heat rejection performance of the studied NDDCT when compared with spray strategies 1 and 2. If one pursues the high improvement of tower performance without consideration of the water consumption, spray strategy 3 is recommended; if one pursues the improvement of tower performance with conditions of limited water availability/high water price, then spray strategy 2 is recommended as its heat rejection increment per unit water flowrate is high. Spray strategy 3 has the characteristics of arranging more nozzles on the windward side and fewer or even no nozzles on the leeward side of the NDDCT.
Acknowledgement: The authors would like to thank the reviewers and editors for their useful suggestions for the improvement in the quality of our manuscript.
Funding Statement: This work was supported by the Shandong Provincial Science and Technology SMEs Innovation Capacity Improvement Project (2022TSGC2018), the Shandong Natural Science Foundation (Grant No. ZR2022ME008), the Shenzhen Science and Technology Program (KCXFZ20201221173409026), the “Young Scholars Program of Shandong University” (YSPSDU, No. 2018WLJH73), the Open Project of State Key Laboratory of Clean Energy Utilization, Zhejiang University (Program Number ZJUCEU2020011) and the Shandong Natural Science Foundation (Grant No. ZR2021ME118).
Conflicts of Interest: The authors declare that they have no conflicts of interest to report regarding the present study.
References
1. Bahadori, A. (2016). Cooling tower and cooling water circuits. In: Essentials of oil and gas utilities, Amsterdam, The Netherlands: Elsevier. [Google Scholar]
2. Ayoub, A., Gjorgiev, B., Sansavini, G. (2018). Cooling towers performance in a changing climate: Techno-economic modeling and design optimization. Energy, 160, 1133–1143. https://doi.org/10.1016/j.energy.2018.07.080 [Google Scholar] [CrossRef]
3. Islam, M. T., Huda, N., Saidur, R. (2019). Current energy mix and techno-economic analysis of concentrating solar power (CSP) technologies in Malaysia. Renewable Energy, 140, 789–806. https://doi.org/10.1016/j.renene.2019.03.107 [Google Scholar] [CrossRef]
4. Kroger, D. G. (2004). Air-cooled heat exchangers and cooling towers: Thermal-flow performance evaluation and design. Tulsa, USA: Pennwell Corporation. [Google Scholar]
5. He, S. Y. (2015). Performance improvement of the NDDCTs using wetted-medium evaporative pre-cooling (Ph.D. Thesis). The University of Queensland, Brisbane, Australia. [Google Scholar]
6. Malli, A., Seyf, H. R., Layeghi, M., Sharifian, S., Behravesh, H. (2011). Investigating the performance of cellulosic evaporative cooling pads. Energy Conversion and Management, 52, 2598–2603. https://doi.org/10.1016/j.enconman.2010.12.015 [Google Scholar] [CrossRef]
7. Dogramaci, P. A., Riffat, S., Gan, G., Aydın, D. (2019). Experimental study of the potential of eucalyptus fibers for evaporative cooling. Renewable Energy, 131, 250–260. https://doi.org/10.1016/j.renene.2018.07.005 [Google Scholar] [CrossRef]
8. He, S. Y., Gurgenci, H., Guan, Z. Q., Alkhedhair, A. (2013). Pre-cooling with munters media to improve the performance of natural draft dry cooling towers. Applied Thermal Engineering, 53(1), 67–77. https://doi.org/10.1016/j.applthermaleng.2012.12.033 [Google Scholar] [CrossRef]
9. He, S. Y., Guan, Z. Q., Gurgenci, H., Hooman, K., Lu, Y. S. et al. (2015). Experimental study of the application of two trickle media for inlet air pre-cooling of natural draft dry cooling towers. Energy Conversion and Management, 89, 644–654. https://doi.org/10.1016/j.enconman.2014.10.031 [Google Scholar] [CrossRef]
10. He, S. Y., Guan, Z. Q., Gurgenci, H., Hooman, K., Lu, Y. S. et al. (2014). Experimental study of film media used for evaporative pre-cooling of air. Energy Conversion and Management, 87, 874–884. https://doi.org/10.1016/j.enconman.2014.07.084 [Google Scholar] [CrossRef]
11. He, S. Y., Gurgenci, H., Guan, Z. Q., Hooman, K., Zou, Z. et al. (2016). Comparative study on the performance of natural draft dry, pre-cooled and wet cooling towers. Applied Thermal Engineering, 99, 103–113. https://doi.org/10.1016/j.applthermaleng.2016.01.060 [Google Scholar] [CrossRef]
12. Zhang, G. H., He, S. Y., Zhang, Z. Y., Xu, Y., Wang, R. (2017). Economic analyses of natural draft dry cooling towers pre-cooled using wetted media. Procedia Engineering, 205, 423–430. https://doi.org/10.1016/j.proeng.2017.10.393 [Google Scholar] [CrossRef]
13. Yan, M. X., He, S. Y., Li, N., Huang, X., Gao, M. (2021). Experimental investigation on a novel arrangement of wet medium for evaporative cooling of air. International Journal of Refrigeration, 124, 64–74. https://doi.org/10.1016/j.ijrefrig.2020.12.014 [Google Scholar] [CrossRef]
14. Zhang, Q., He, S. Y., Cheng, J., Zhao, B., Wu, X. H. et al. (2022). Numerical simulation of evaporative cooling process in a medium-gap-medium arrangement. International Journal of Thermal Sciences, 179, 107700. https://doi.org/10.1016/j.ijthermalsci.2022.107700 [Google Scholar] [CrossRef]
15. Miao, J. Y., He, S. Y., Lu, Y. W., Wu, Y. T., Wu, X. H. et al. (2021). Comparison on cooling performance of pre-cooled NDDCTs using nozzles spray and wet medium. Case Studies in Thermal Engineering, 27, 101274. https://doi.org/10.1016/j.csite.2021.101274 [Google Scholar] [CrossRef]
16. Sadafi, M. H., Jahn, I., Hooman, K. (2015). Cooling performance of solid containing water for spray assisted dry cooling towers. Energy Conversion and Management, 91, 158–167. https://doi.org/10.1016/j.enconman.2014.12.005 [Google Scholar] [CrossRef]
17. Sadafi, M. H., Jahn, I., Hooman, K. (2016). Nozzle arrangement effect on cooling performance of saline water spray cooling. Applied Thermal Engineering, 105, 1061–1066. https://doi.org/10.1016/j.applthermaleng.2016.01.078 [Google Scholar] [CrossRef]
18. Alkhedhair, A., Guan, Z., Jahn, I., Gurgenci, H., He, S. (2015). Water spray for pre-cooling of inlet air for natural draft dry cooling towers-experimental study. International Journal of Thermal Sciences, 90, 70–78. https://doi.org/10.1016/j.ijthermalsci.2014.11.029 [Google Scholar] [CrossRef]
19. Alkhedhair, A., Guan, Z., Jahn, I., Gurgenci, H., He, S. et al. (2016). Numerical simulation of water spray in natural draft dry cooling towers with a new nozzle representation approach. Applied Thermal Engineering, 98, 924–935. https://doi.org/10.1016/j.applthermaleng.2015.10.118 [Google Scholar] [CrossRef]
20. Liu, Y. X., He, S. Y., Zhang, Z. Y., Yan, M. X., Wang, R. et al. (2020). Numerical simulation on the influence of two-nozzle distance on evaporative cooling performance. Proceedings of the CSEE, 40(15), 4910–4919. [Google Scholar]
21. Du Preez, A. F., Kröger, G. D. (1993). Effect of wind on performance of a dry-cooling tower. Heat Recovery Systems and CHP, 13(2), 139–146. https://doi.org/10.1016/0890-4332(93)90033-R [Google Scholar] [CrossRef]
22. Al-Waked, R., Behnia, M. (2004). The performance of natural draft dry cooling towers under crosswind: CFD study. International Journal of Energy Research, 28(2), 147–161. https://doi.org/10.1002/(ISSN)1099-114X [Google Scholar] [CrossRef]
23. Goodarzi, M. (2010). A proposed stack configuration for dry cooling tower to improve cooling efficiency under crosswind. Journal of Wind Engineering and Industrial Aerodynamics, 98, 858–863. https://doi.org/10.1016/j.jweia.2010.08.004 [Google Scholar] [CrossRef]
24. Ahmadikia, H., Soleimani, M., Gholami, E. (2013). Simultaneous effects of water spray and crosswind on performance of natural draft dry cooling tower. Thermal Science, 17(2), 443–455. https://doi.org/10.2298/TSCI110510134A [Google Scholar] [CrossRef]
25. Elgobashi, S. (2006). An updated classification map of particle-laden turbulent flows. IUTAM Symposium on Computational Approaches to Multiphase Flow, pp. 3–10. Netherlands. [Google Scholar]
26. Sirignano, W. A. (2010). Fluid dynamics and transport of droplets and sprays. New York: Cambridge University Press. [Google Scholar]
27. Launder, B. E., Spalding, D. B. (1972). Lectures in mathematical models of turbulence. London: Academic Press. [Google Scholar]
28. Cai, C., Liu, H., Jia, M., Yin, H., Xie, R. et al. (2020). Numerical investigation on heat transfer of water spray cooling from single-phase to nucleate boiling region. International Journal of Thermal Sciences, 151, 106258. https://doi.org/10.1016/j.ijthermalsci.2019.106258 [Google Scholar] [CrossRef]
29. Zhang, X. Y. (2018). Study on spray cooling optimization for indirect dry cooling units (Master Thesis). Shandong University, China. [Google Scholar]
30. Zhang, Z. Y., He, S. Y., Yan, M. X., Gao, M., Shi, Y. T. et al. (2020). Numerical study on the performance of a two-nozzle spray cooling system under different conditions. International Journal of Thermal Sciences, 152, 106291. https://doi.org/10.1016/j.ijthermalsci.2020.106291 [Google Scholar] [CrossRef]
31. Ranz, W. E., Marshall, W. R. (1952). Evaporation from drops, part I. Chemical Engineering Progress, 48(3), 141–146. [Google Scholar]
32. Ranz, W. E., Marshall, W. R. (1952). Evaporation from drops, part II. Chemical Engineering Progress, 48(4), 173–180. [Google Scholar]
33. Alkhedhair, A., Gurenci, H., Jahn, I., Guan, Z. Q., He, S. Y. (2013). Numerical simulation of water spray for pre-cooling of inlet air in the NDDCTs. Applied Thermal Engineering, 61(2), 416–424. https://doi.org/10.1016/j.applthermaleng.2013.08.012 [Google Scholar] [CrossRef]
34. Xu, B. Q., Wu, T. T., Li, W. H. (2014). Screening of calculation methods for wind shear exponent. Transactions of the Chinese Society of Agricultural Engineering, 30(16), 188–194. [Google Scholar]
35. Gong, X., Zhu, R., Li, Z. C. (2018). Study of near-surface wind shear exponents of different regions in China. Meteorological Monthly, 44(9), 1160–1168. [Google Scholar]
Cite This Article
 Copyright © 2023 The Author(s). Published by Tech Science Press.
This work is licensed under a Creative Commons Attribution 4.0 International License , which permits unrestricted use, distribution, and reproduction in any medium, provided the original work is properly cited.
 Downloads
 Citation Tools