
 Submit a Paper
 Propose a Special lssue
 Open Access
ARTICLE

Analysis of the Lost Circulation Problem
1 CNOOC Research Institute, Beijing, 100101, China
2 College of Petroleum Engineering, China University of Petroleum, Qingdao, 266580, China
* Corresponding Authors: Kuan Liu. Email: ; Yuqiang Xu. Email:
Fluid Dynamics & Materials Processing 2023, 19(6), 1721-1733. https://doi.org/10.32604/fdmp.2023.025578
Received 20 July 2022; Accepted 11 October 2022; Issue published 30 January 2023
 View Full Text
 Download PDF
Abstract
The well-known “lost circulation” problem refers to the uncontrolled flow of whole mud into a formation. In order to address the problem related to the paucity of available data, in the present study, a model is introduced for the lost-circulation risk sample profile of a drilled well. The model is built taking into account effective data (the Block L). Then, using a three-dimensional geological modeling software, relying on the variation function and sequential Gaussian simulation method, a three-dimensional block lost-circulation risk model is introduced able to provide relevant information for regional analyses.Keywords
The Ledong block in South China Sea (considered as a reference case in the present work, hereafter simply referred to as ‘Block L’) has the characteristics of ultra-high temperature and high pressure, narrow density window and strong uncertainty of geological information. Underground engineering is complex and multiple, drilling risk is prominent, and construction is difficult. Due to the small number of drilled wells, little analysis data can be provided. How to carry out a regional analysis on the complexity of lost circulation in Block L is an important problem to be solved urgently.
Lost circulation is a common type of accident in drilling [1]. When the lost circulation is serious, it often causes accidents such as blowout or well collapse and sticking, which can cause several problems that could lead to increasing the non-productive time (NPT) and drilling cost [2]. Especially in the drilling process of deep and ultra-deep fractured formations, lost circulation very easy to occur, which will cause serious formation damage and significant economic losses [3]. Even if lost circulation materials are used for plugging in time, instability and damage will occur under the complex environment of high temperature and high in-situ pressure, which results in a failure to reach the plugging rate and the expected fracture plugging effect [4]. Therefore, if the lost circulation risk of the block can be mastered before drilling, other serious and complex accidents can be effectively avoided. At present, there are many methods for evaluating lost circulation, such as the risk evaluation method of drilling engineering based on wellbore stability criterion [5], the method based on geostatistical method [6], and the method based on neural network models to predict lost circulation [7,8]. However, the above methods cannot intuitively grasp the distribution of lost circulation risk in the block. Therefore, this paper presents a regional analysis method of lost circulation risk based on a three-dimensional model.
2 Regionalization Description Method of Lost Circulation Risk in Block L
2.1 Regionalization Characteristics of Lost Circulation Risk
The lost circulation risk is affected by the combined action of drilling mud density, formation pressure and wave impedance, so the lost circulation risk can be regarded as their function of these, and the lost circulation risk can be analyzed and discussed as a variable. At the same time, lost circulation risk has three main characteristics related to regionalization analysis, and thus, it is reasonable and feasible to regard lost circulation risk as a regionalization variable [9].
The correlation and interaction ability of lost circulation risk are limited to a certain range. There is no correlation between the lost circulation risks of faraway blocks nor blocks of different types, as they will not affect each other. In this case, the lost circulation risk of a well that is far away from distribution is used to predict the lost circulation risk of a well to be drilled, and the error is large. So the scope of lost circulation risk is limited by the overall scope of the block or connected block space.
2.1.2 Different Degrees of Continuity
Stratigraphy and structure are not completely discrete and unrelated. For any block, the strata have extensibility in all directions, for example, each horizon has the property of continuous variation with spatial position. However, the strata also have mutagenicity. The continuous ductility of a formation can make the lost circulation have continuous ductility; the formation mutation will also induce the risk of lost circulation mutation. Therefore, the lost circulation of two adjacent wells at a certain depth may be relatively close or even identical, but yet may also have great differences. Thus, the lost circulation has continuity with the change of spatial position, and yet also contains distinct variability.
Since the lost circulation has both continuity and variability, and formation lithology and fluid properties are anisotropic, the risk of lost circulation is also anisotropic.
2.2 Regionalization Description Algorithm
Geostatistics takes spatial regionalization variables as objects to study spatial parameters with structure, randomness, dependence, and correlation [10,11]. Based on geostatistics, this paper presents two algorithms for regionalized description of lost circulation risk. One is the variation function which can describe the randomness and structure of spatial distribution of regionalized variables [12], and the other is sequential Gaussian simulation which is suitable for random simulation of the spatial distribution of continuous variables [13].
The variation function is a measure that describes the spatial variation of parameters such as attributes with distance [14,15]. It mainly represents the scale of spatial position variation of attribute parameters, that is, half of the variance of increment of
Commonly used sequential indicator simulations, such as sequential Gaussian simulation, need to use variation function to characterize the change of attribute parameters in space.
2.2.2 Sequential Gaussian Simulation Method
Sequential Gaussian simulation is a stochastic simulation method which uses Gaussian probability theory and sequential simulation algorithm to generate spatial distribution of continuous variables [16,17]. It is one of the most widely used stochastic modeling methods for continuous geological variables. Its basic idea is to conduct a sequential simulation of conditional data subject to normal distribution [18], construct a Gaussian function according to the known data, and treat each value of the regionalized random variable
2.3 Risk Regionalization Description Process
When building the regional lost circulation risk model, sufficient supporting data is needed to ensure that each geological layer of the built model is fine enough, but it is not advisable to only rely on the data of lost circulation collated from well history data. Therefore, first, the lost circulation risk sample evaluation method is used to quantitatively evaluate the lost circulation risk of the drilled wells in the block, to obtain the probability profile of the drilled risk samples, which provides rich data support for the construction of the later models. Then, the geological modeling software, Petrel, is used to build the lost circulation risk model of the block by layers and groups, and then the risk is analyzed regionally [20].
3 Block L Lost Circulation Risk Sample Evaluation Method
In view of the uncertainty of deep formation information and the difficulty of quantitative evaluation of downhole engineering risk, the evaluation method of lost circulation risk samples in Block L is proposed. Firstly, the drilling mud density and fracture pressure at fracture are obtained according to the measured points when the lost circulation occurs. Then, based on the well-drilling geodetic coordinates and combined with the SEG-Y seismic body in the block, a three-dimensional wave impedance model is built, and the wave impedance data of single well drilled are extracted from the model according to the well trajectory. Then according to the measured point of lost circulation, based on drilling mud density, fracture pressure and wave impedance, the relationship between the three and the risk of lost circulation is obtained. Finally, the drilling mud density, fracture pressure and wave impedance in the whole drilling process are substituted into the relational expression to obtain the lost circulation risk sample data of the whole well section. The specific process is shown in Fig. 1.
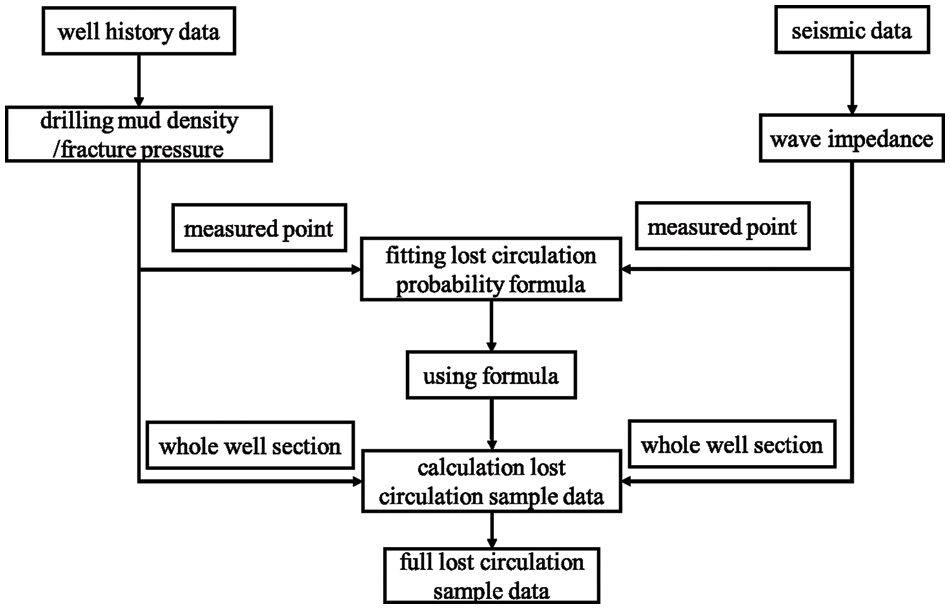
Figure 1: Flow chart of lost circulation risk sample calculation
3.2.1 Statistics of Lost Circulation in Block
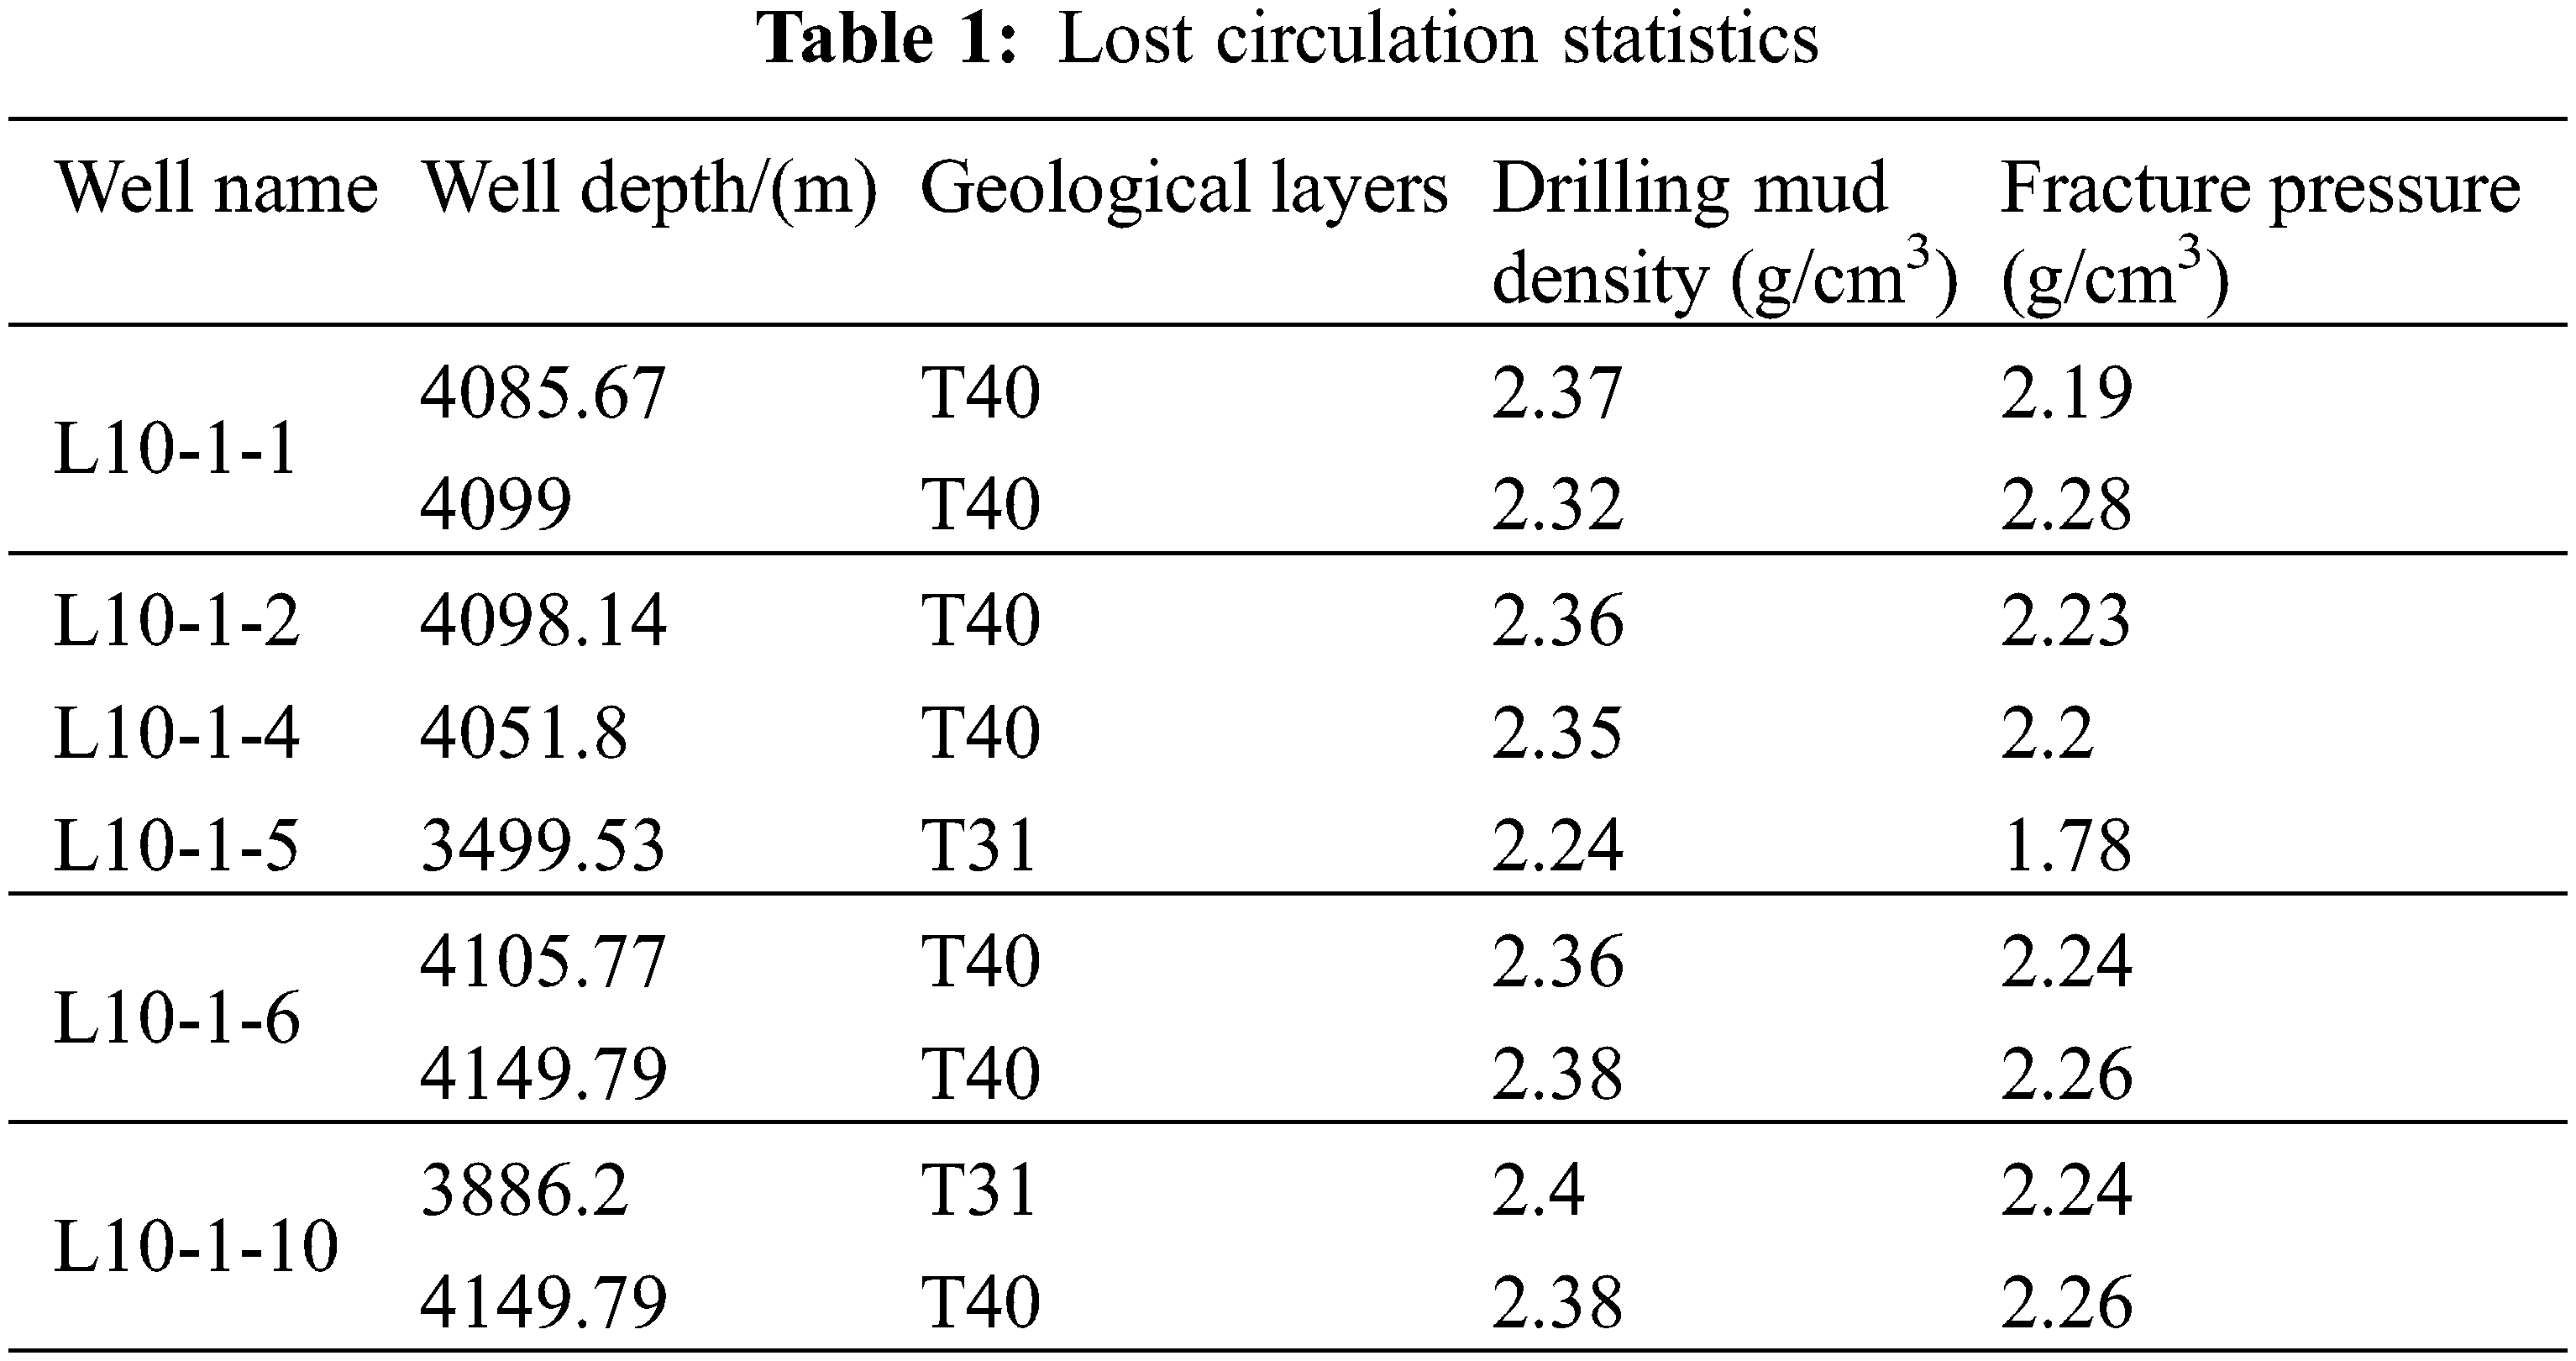
Obtained from the statistics of well history data, the statistics of lost circulation in Block L is presented in Table 1.
3.2.2 Extraction of Drilled Wave Impedance
Wave impedance is an important physical property of rock formations, which can be obtained from synthesizing seismic, logging, and other multi-information [21]. It can accurately reflect the relationship between changes in lithology [22] and effectively characterize the formation’s properties [23]. Therefore, the change of wave impedance can provide a reference and basis for lost circulation [24]. The three-dimensional wave impedance model can be produced by the geological modeling software Petrel, and the wave impedance can be extracted from the elaborated three-dimensional wave impedance model. An example of d the wave impedance model is shown in Fig. 2. The extracted well-drilling wave impedance is shown in Fig. 3.
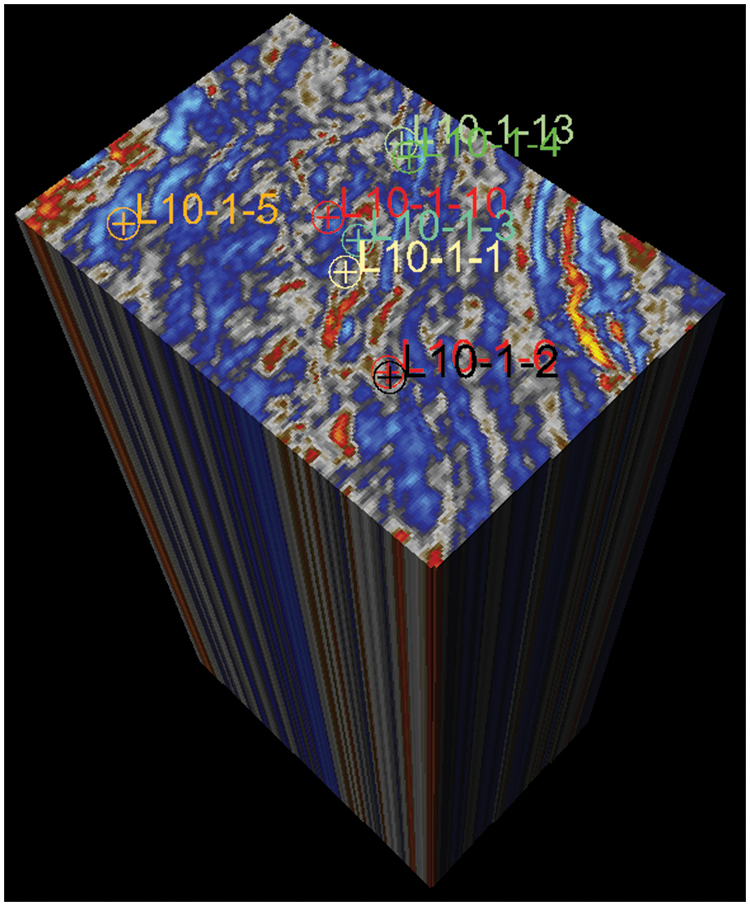
Figure 2: 3D wave impedance model
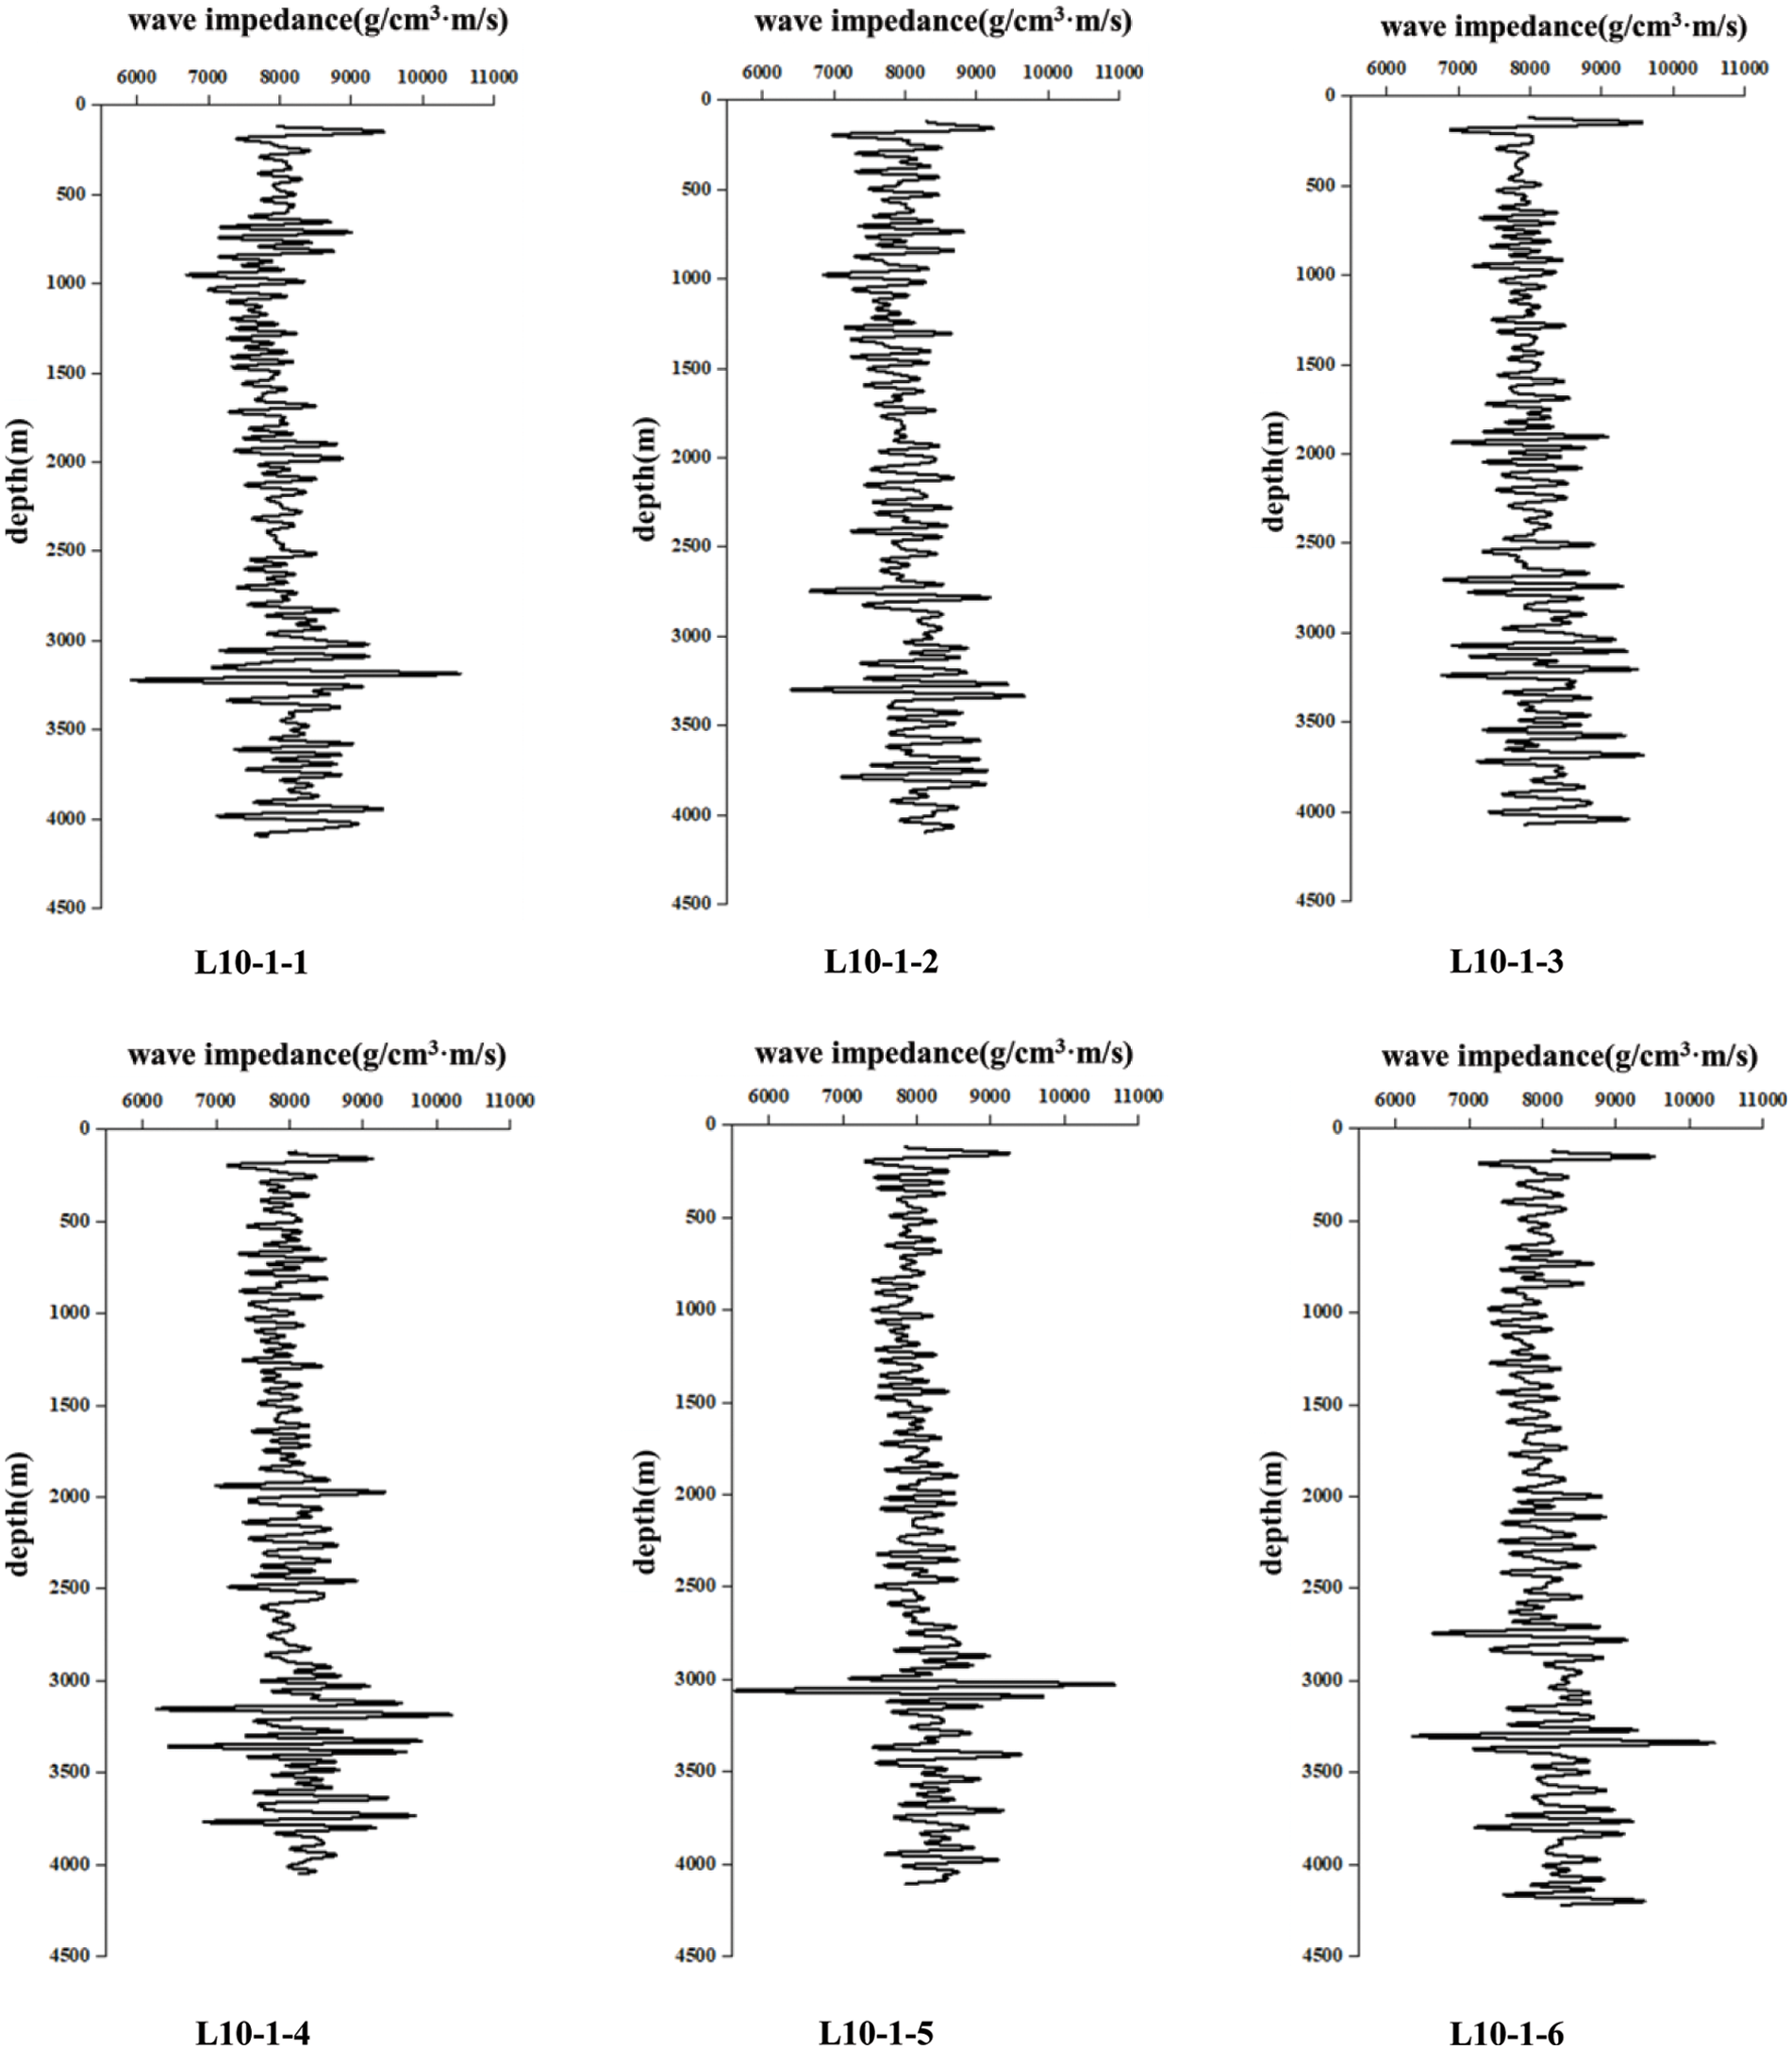
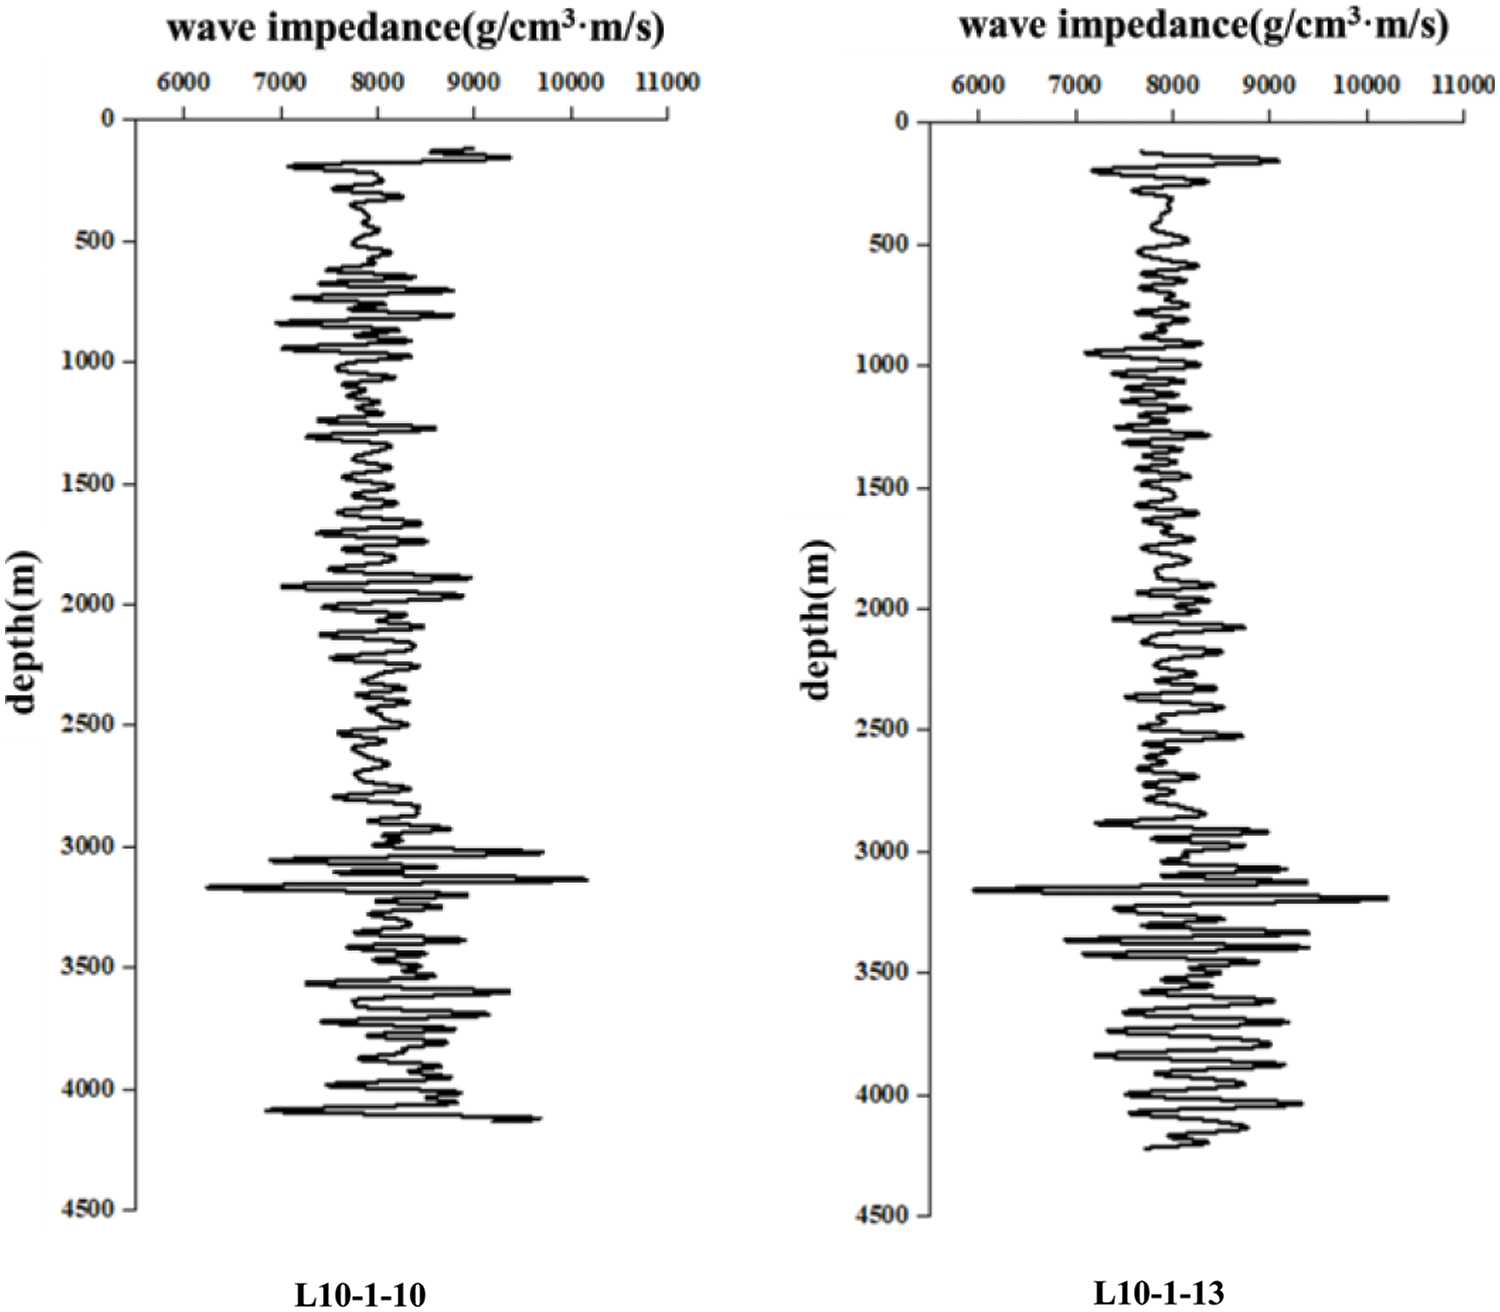
Figure 3: Wave impedance of eight drilled wells
3.3 Development of a Formula for Lost Circulation Risk Evaluation
According to the statistics and analysis of occurrence of lost circulation during drilling of wells in Block L, it is determined that the type of lost circulation occurring in the block is fracturing lost circulation, that is, the drilling fluid column pressure is greater than the formation fracture pressure, which makes the open formation rupture and induces the lost circulation caused by the induced fracture [25]. According to the statistical drilling mud density, fracture pressure and extracted wave impedance, the following equation is proposed for calculating the risk probability of lost circulation in Block L:
where:
By substituting the drilling mud density, fracture pressure and wave impedance data of eight drilled wells into Eq. (2), the lost circulation risk sample profiles of eight drilled wells can be obtained, as shown in Fig. 4.
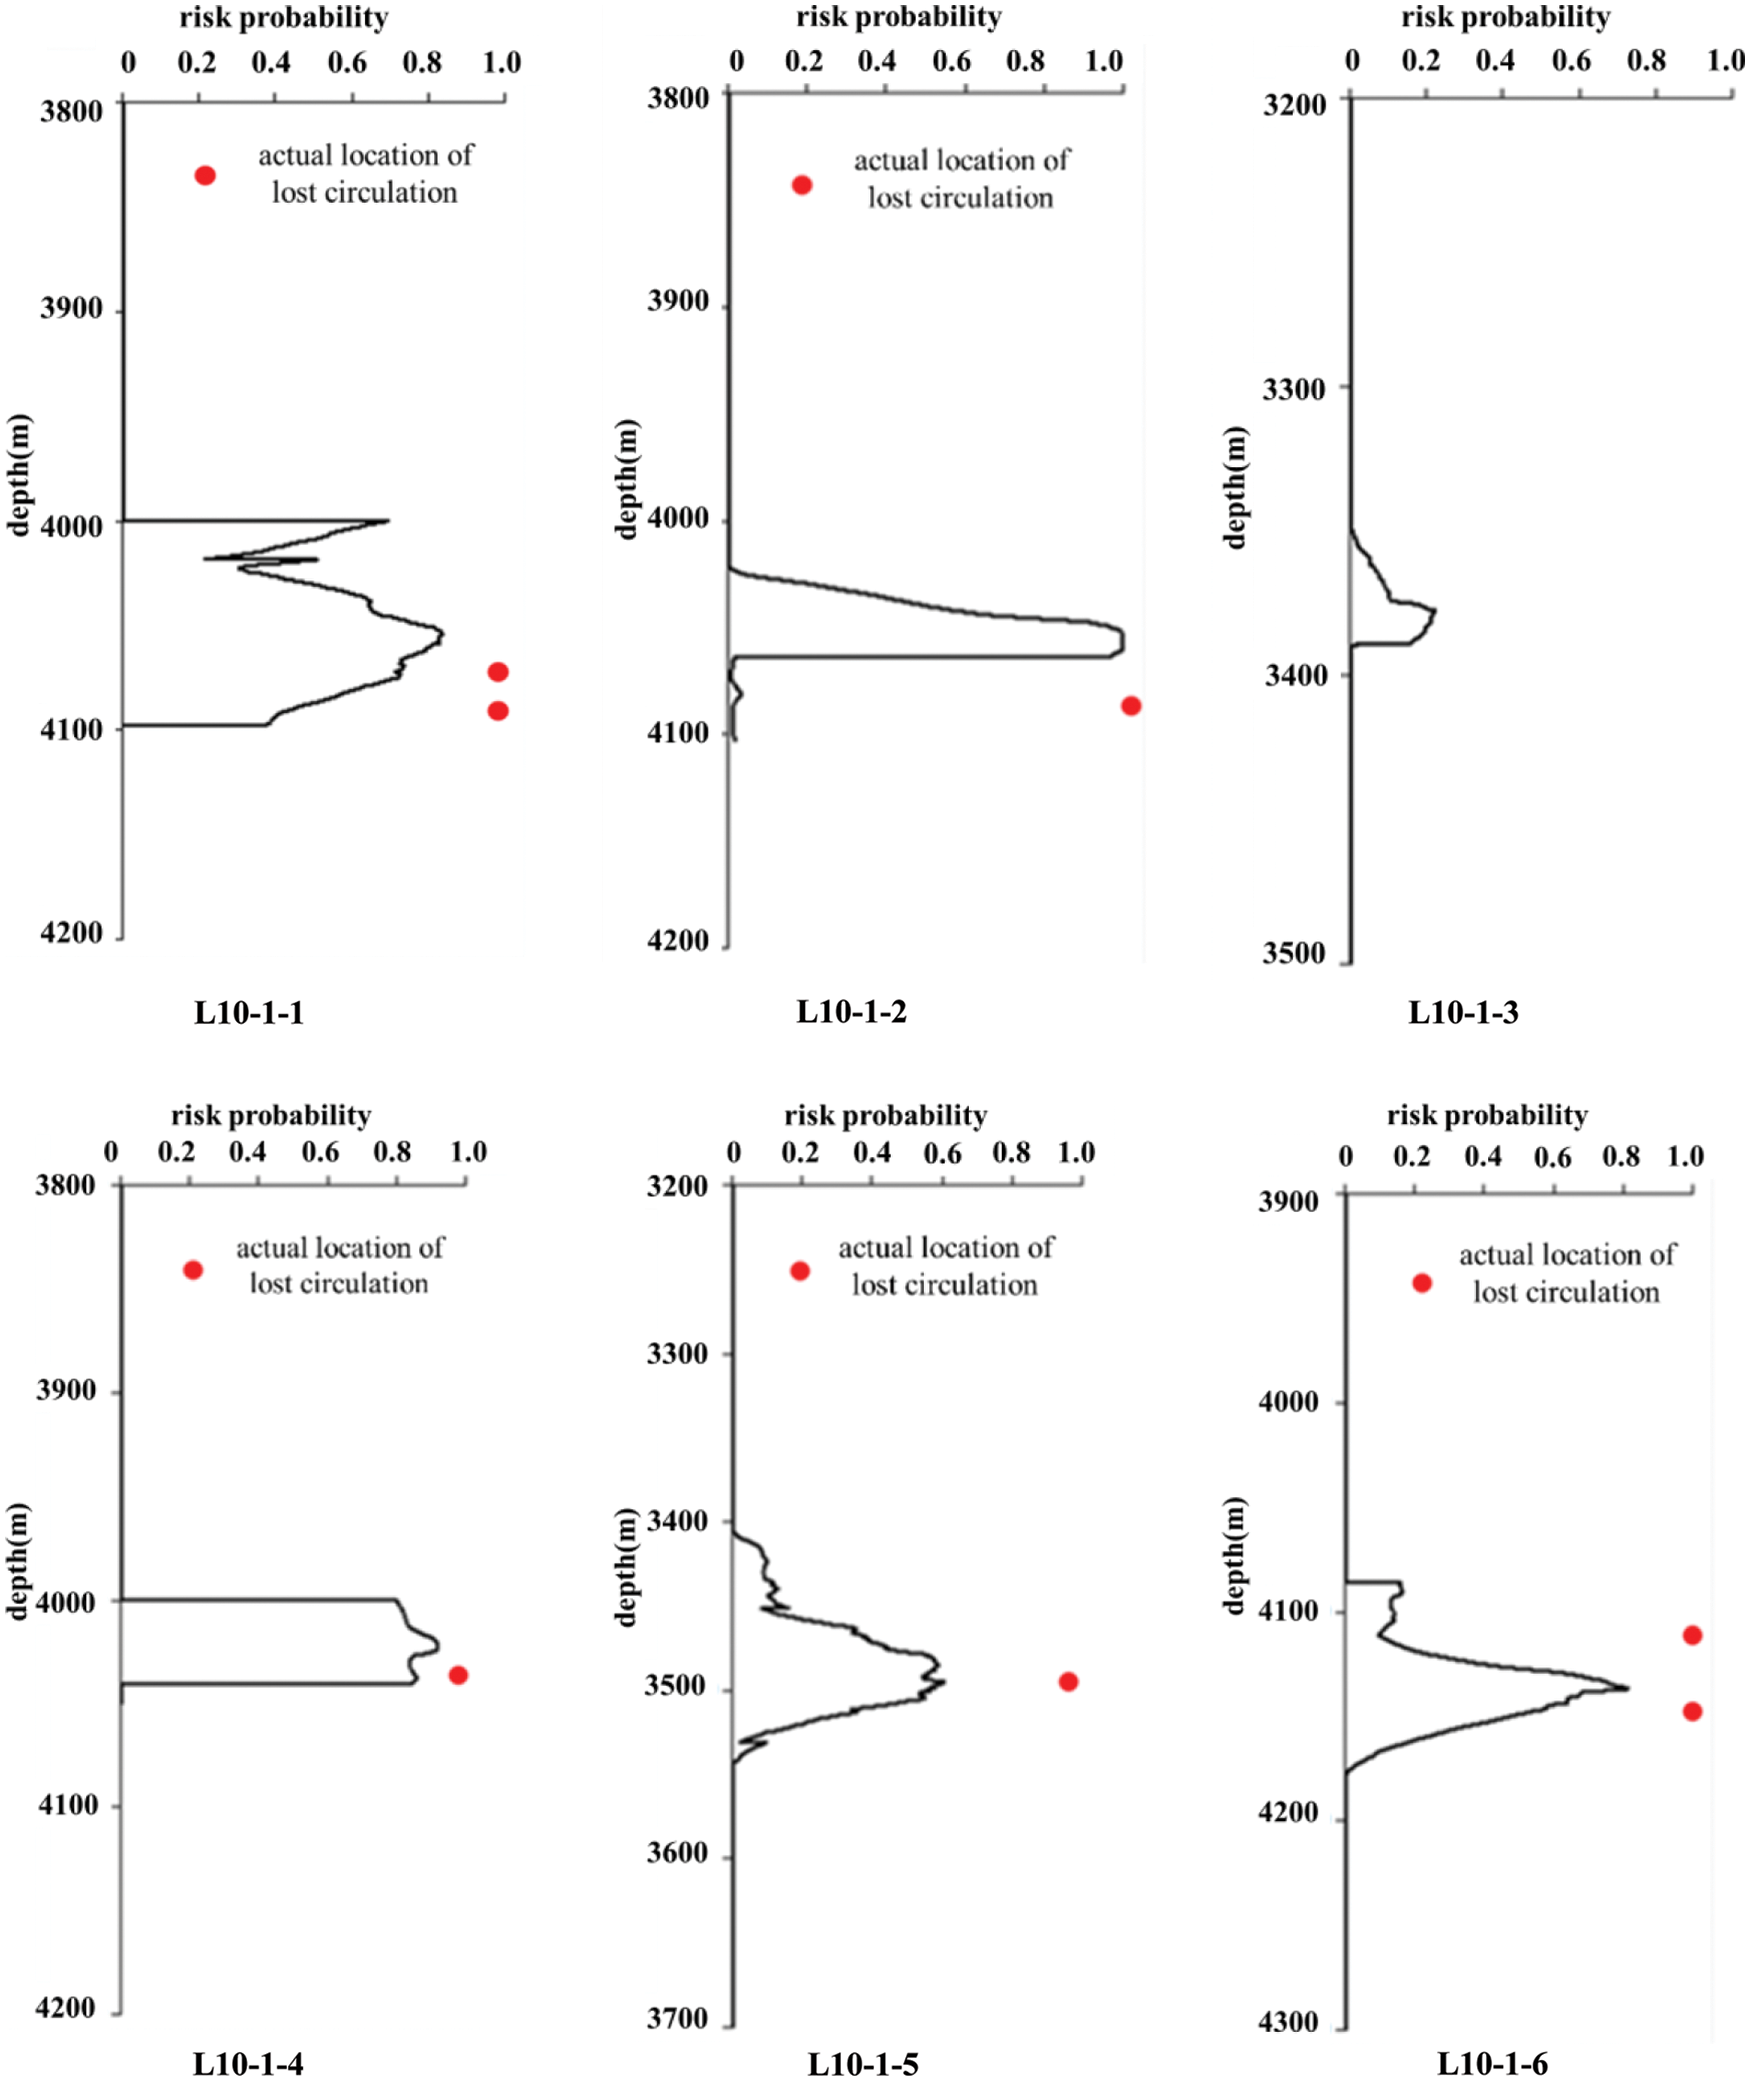
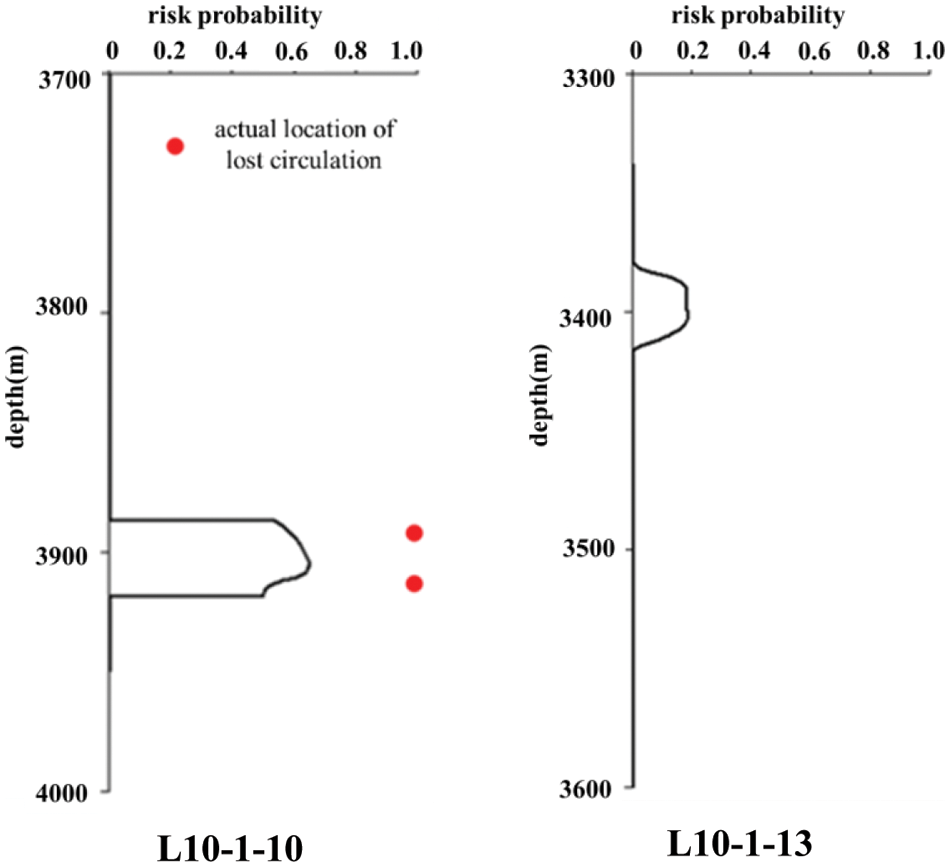
Figure 4: Lost circulation risk sample profile
It can be seen from Fig. 4 that the lost circulation risk sample profile calculated according to Eq. (1) has little difference from the actual location of lost circulation, which proves that Eq. (1) has high accuracy.
4 Block Lost Circulation Risk Model Construction Method
In order to intuitively analyze the formation lost circulation risk in the block, the three-dimensional geological modeling software is used to construct the lost circulation risk model of Block L based on the sequential Gaussian simulation method and the variation function. The construction process of the block lost circulation risk model is shown in Fig. 5 [26,27]:
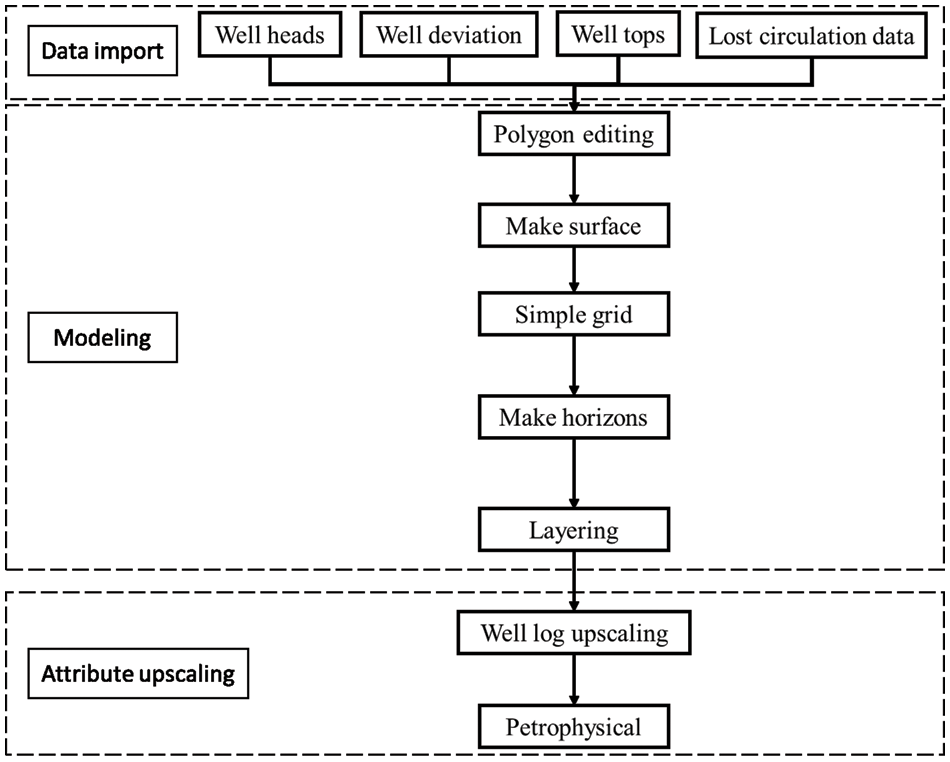
Figure 5: Flow chart of block lost circulation model construction
4.2 Complex Regionalization Analysis of Lost Circulation in Block
According to the construction process of the block lost circulation model developed in 4.1, the complex lateral distribution of Block L lost circulation is shown in Fig. 6.
It can be seen from the chart that in the T27-T31 layers where the corresponding layer depth is more than 4000 meters, the probability of lost circulation is small, about 1%–10%, and according to the statistics of lost circulation in Table 1, the number of lost circulation in the depth is less, thus the layers are consistent. In the T40 layer, where the corresponding layer depth is below 4000 m, the probability of lost circulation risk increases and shows obvious heterogeneity. L10-1-1, L10-1-2, L10-1-4 and L10-1-6 and nearby formations have a higher probability of lost circulation risk, as can also be seen from Fig. 4, the wells have had occurrences lost circulation and are therefore both consistent. Future drilling in these areas should pay attention to prevent lost circulation.
However, it can also be seen from Fig. 6 that the lost circulation risk of the formation around L10-1-5 is not precise enough. The reason is that L10-1-5 is too far away from its seven wells. Due to the Spatial Locality, the lost circulation data of its seven wells makes it difficult to describe the region’s space through the variation function and sequential Gaussian simulation.
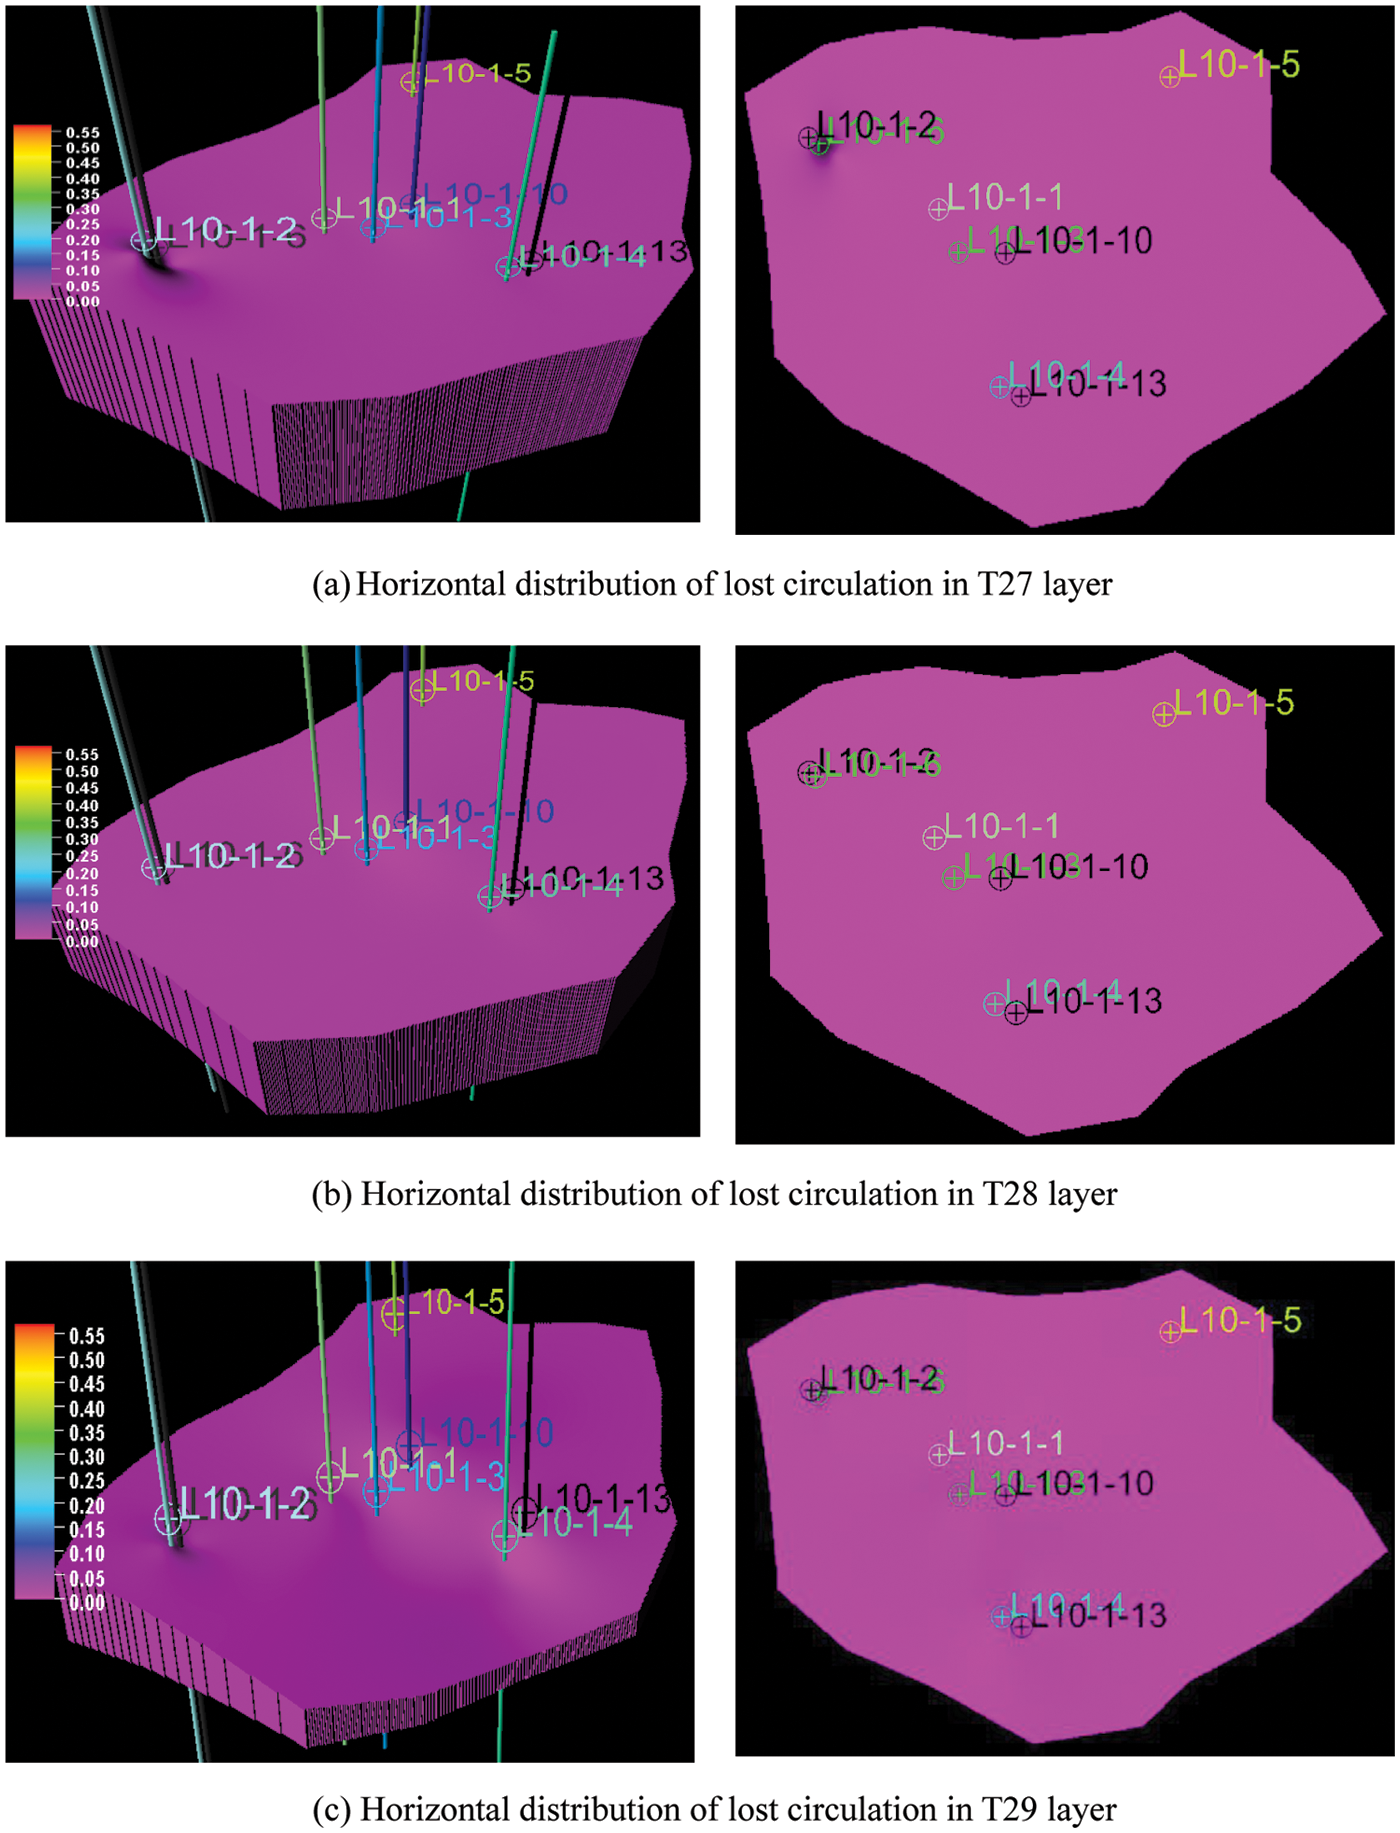
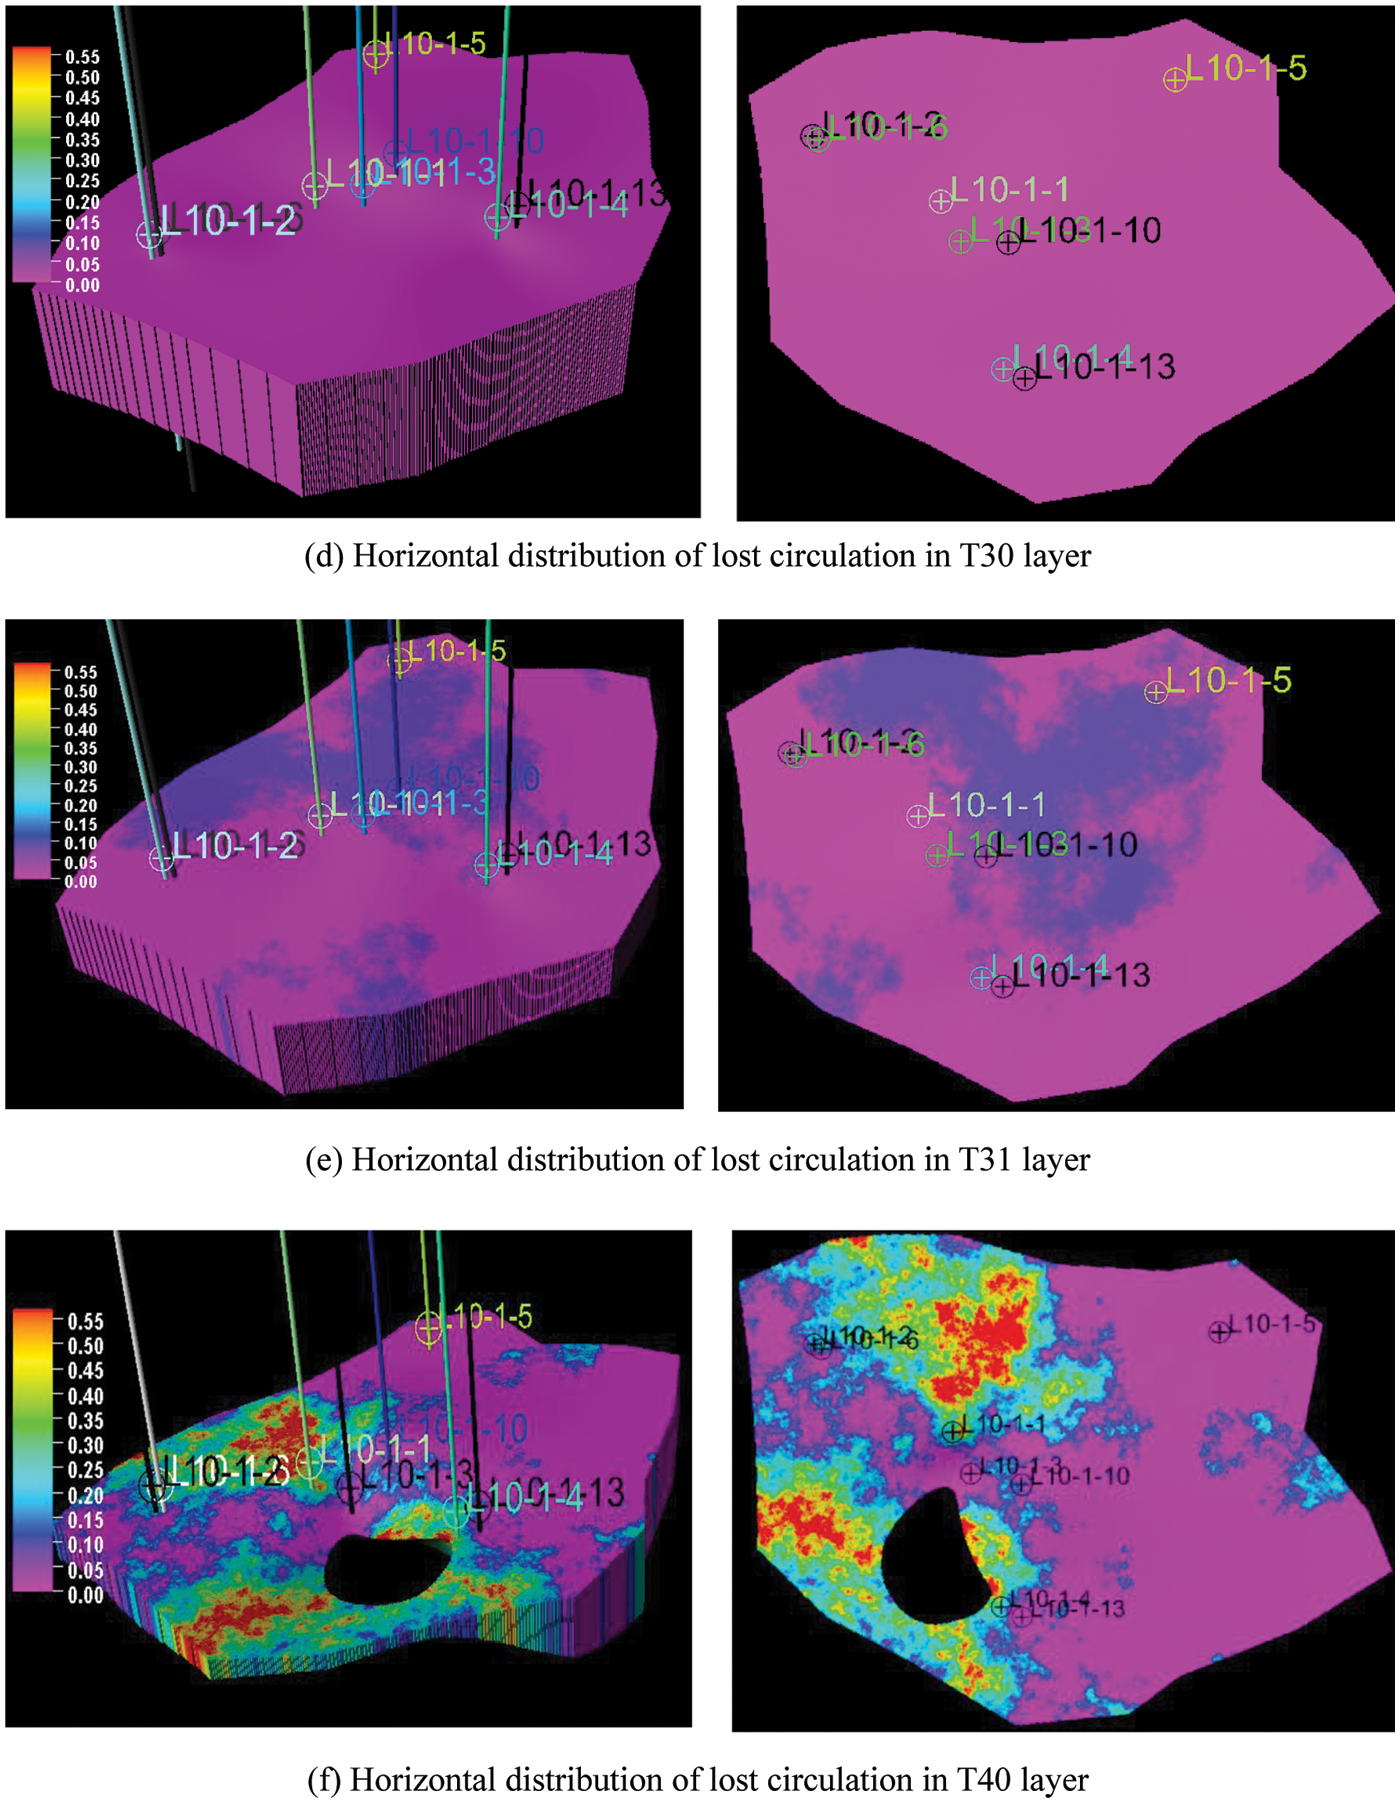
Figure 6: Horizontal distribution of lost circulation risk in each layer of block (the figures on the left are three-dimensional models, while the figures on the right are two-dimensional)
4.3 Comparison of Regionalization Analysis Methods
Compared with other regional analysis methods (see reference [9]), the method proposed in this paper is aimed at the target of strata rather than a plane. Therefore, it can effectively improve the determination of the risk of lost circulation in the block. It can effectively avoid the risk of occurrence of lost circulation in the drilling process by mastering the high-risk strata and regions of the block before drilling, and avoiding them in advance.
1) In order to solve the problem of the difficulty to quantitatively evaluate the risk of lost circulation, the team proposed a method to expand the sample of lost circulation risk in the block. Through the drilling mud density, fracture pressure and wave impedance at the actual occurrence of lost circulation, the formula for the calculation of lost circulation risk in samples is fitted, and the lost circulation risk sample profile is obtained, thus, the quantitative evaluation of lost circulation risk is realized.
2) The regionalization characteristics of lost circulation risk are analyzed, and it is noted that lost circulation risk has three main properties of regionalization variables, and the rationality of lost circulation risk as a regionalization variable is clarified.
3) Taking the stratigraphic group as the basic unit, the three-dimensional lost circulation risk model of Block L is developed by using the three-dimensional geological modeling software, Petrel, based on the sequential Gaussian simulation method and the variation function. It can intuitively judge the regional risk situation according to the model, making up for the shortcomings of other methods. Through the study of the lost circulation risk in Block L, it provides the basis for future drilling in this block, which can effectively reduce the risk of occurrence of lost circulation.
4) In addition, the risk of lost circulation is also related to the geomechanical properties of rocks. Therefore, for example, RQD, JV or joint aperture-joint fill, geomechanical properties obtained from rock core samples from various depths can also be used in statistical analysis to overcome Gaussian simulations errors and spatial position error.
Funding Statement: The authors received no specific funding for this study.
Conflicts of Interest: The authors declare that they have no conflicts of interest to report regarding the present study.
References
1. Tariq, Z., Mahmoud, M., Alahmari, M., Bataweel, M., Mohsen, A. (2022). Lost circulation mitigation using modified enzyme induced calcite precipitation technique. Journal of Petroleum Science and Engineering, 210, 110043. [Google Scholar]
2. Mirabbasi, S. M., Ameri, M. J., Alsaba, M., Karami, M., Zargarbashi, A. (2022). The evolution of lost circulation prevention and mitigation based on wellbore strengthening theory: A review on experimental issues. Journal of Petroleum Science and Engineering, 211, 110149. [Google Scholar]
3. Kang, Y. L., Wang, K. C., Xu, C. Y., You, L. J., Wang, L. M. et al. (2019). High-temperature aging property evaluation of lost circulation materials in deep and ultra-deep well drilling. Acta Petrolei Sinica, 40(2), 215–223. [Google Scholar]
4. Wang, Q., Yuan, H. Y., Liu, Y., Mi, G., Luo, L. (2021). An experimental investigation on pressure bearing and tight plugging of fractured formations in deep and ultra-deep wells. Journal of Southwest Petroleum University (Science &Technology Edition), 43(4), 109–117. [Google Scholar]
5. Sheng, Y. N., Guan, Z. C., Zhang, G. H., Ye, L., Liu, S. J. et al. (2016). Borehole structure optimization based on pre-drill risk assessment. Oil Drilling & Production Technology, 38(4), 415–421. [Google Scholar]
6. Abdideh, M., Kavousi, M. (2022). Application of geostatistical method in structural modeling and estimation of mud loss circulation in oil fields. Modeling Earth Systems and Environment, 8(1), 1433–1441. [Google Scholar]
7. Alkinani, H. H., Al, H. A. T. T., Dunn, N. S. (2020). Artificial neural network models to predict lost circulation in natural and induced fractures. SN Applied Sciences, 2(12), 1–13. [Google Scholar]
8. Jahanbakhshi, R., Keshavarzi, R., Jalili, S. (2014). Artificial neural network-based prediction and geomechanical analysis of lost circulation in naturally fractured reservoirs: A case study. European Journal of Environmental and Civil Engineering, 18(3), 320–335. [Google Scholar]
9. Sheng, Y. N., Guan, Z. C., Zhang, G. H., Ye, L. (2016). Optimization of casing design of dongping block based on regional formation pressure description. Fault-Block Oil and Gas Field, 23(3), 401–404. [Google Scholar]
10. Li, L., Wang, Y. G. (2006). Review of applications of geostatistics. Progress in Exploration Geophysics, 29(3), 163–169+4. [Google Scholar]
11. Hou, J. R. (1998). Practical geostatistics. Beijing, China: Geological Publishing House. [Google Scholar]
12. Zang, J., Meng, X. H. (2011). Kriging-based three-dimensional geophysical datamesh. The 27th Annual Meeting of Chinese Geophysical Society, Changsha, China. [Google Scholar]
13. Jika, H. T., Onuoha, M. K., Okeugo, C. G., Eze, M. O. (2020). Application of sequential indicator simulation, sequential Gaussian simulation and flow zone indicator in reservoir-E modelling; Hatch Field Niger Delta Basin, Nigeria. Arabian Journal of Geosciences, 13(11), 1–19. DOI 10.1007/s12517-020-05332-8. [Google Scholar] [CrossRef]
14. Breneis, S. (2020). On variation functions and their moduli of continuity. Journal of Mathematical Analysis and Applications, 491(2), 124349. DOI 10.1016/j.jmaa.2020.124349. [Google Scholar] [CrossRef]
15. Obi, I. S., Onuoha, K. M., Obilaja, O. T., Dim, C. I. (2020). Understanding reservoir heterogeneity using variography and data analysis: An example from coastal swamp deposits, Niger Delta Basin (Nigeria). Geologos, 26(3), 207–218. DOI 10.2478/logos-2020-0020. [Google Scholar] [CrossRef]
16. Aryafar, A., Khosravi, V., Karami, S. (2020). Groundwater quality assessment of Birjand plain aquifer using kriging estimation and sequential Gaussian simulation methods. Environmental Earth Sciences, 79(10), 1–21. DOI 10.1007/s12665-020-08905-8. [Google Scholar] [CrossRef]
17. Bai, T., Tahmasebi, P. (2022). Sequential Gaussian simulation for geosystems modeling: A machine learning approach. Geoscience Frontiers, 13(1), 101258. DOI 10.1016/j.gsf.2021.101258. [Google Scholar] [CrossRef]
18. Gao, Y. (2014). Geological modeling research on oil and gas reservoir (Master Thesis). Xi’an University of Science and Technology, China. [Google Scholar]
19. Zhao, Y. F., Hua, Q. X., Chen, J. (2011). Comparison of kriging interpolation with conditional sequential Gaussian simulation in principles and case analysis of their application in study on soil spatial variation. Acta Pedologica Sinica, 48(4), 856–862. [Google Scholar]
20. Kimple, D., Peterson, E. W., Malone, D. H. (2015). Stratigraphy and porosity modeling of South-Central Illinois (USA) chester (upper mississippian) series sandstones using petrel. World Journal of Environmental Engineering, 3(3), 82–86. [Google Scholar]
21. Liu, J., Cao, X. J., Zhou, P., Cheng, M., Chen, S. Y. (2020). Application of seismic multi-attribute analysis to channel sand body identification. Annual Conference of China Earth Science Association, pp. 174–176. Chongqing, China. [Google Scholar]
22. Purnama, A. Z., Machmud, P. A., Nurcahya, B. E., Yusro, M., Gunawan, A. et al. (2018). Acoustic impedance inversion to identify oligo-miocene carbonate facies as reservoir at Kangean offshore area. IOP Conference Series: Earth and Environmental Science, 132(1), 012010. [Google Scholar]
23. Wollner, U., Arevalo-Lopez, H., Dvorkin, J. (2017). Seismic-scale petrophysical interpretation and gas-volume estimation from simultaneous impedance inversion. The Leading Edge, 36(11), 910–915. DOI 10.1190/tle36110910.1. [Google Scholar] [CrossRef]
24. Ma, J. Q., Yiu, L. J., Kang, Y. L., Du, C. Z., Li, Z. J. (2010). Geological-geophysical methods of pre-diction lost circulation in fractured/caved carbonate formation. Drilling & Production Technology, 33(3), 90–93+145. [Google Scholar]
25. Chen, X. H., Wang, X., Feng, Y. C., Niu, M. M., Yan, J. Z. (2017). Loss prevention and control technology for fractured reservoirs in Jinghe oilfield. Fault-Block Oil and Gas Field, 24(2), 297–300. [Google Scholar]
26. Otoo, D., Hodgetts, D. (2021). Porosity and permeability prediction through forward stratigraphic simulations using GPM™ and petrel™: Application in shallow marine depositional settings. Geoscientific Model Development, 14(4), 2075–2095. DOI 10.5194/gmd-14-2075-2021. [Google Scholar] [CrossRef]
27. Nelepov, M., Gridin, R., Lutsenko, O., Sterlenko, Z., Tumanova, Y. et al. (2021). Fracture modeling of carbonate reservoirs of low triassic Neftekumsk formation of hydrocarbon field in petrel software. E3S Web of Conferences, 244, 03020. [Google Scholar]
Cite This Article
 Copyright © 2023 The Author(s). Published by Tech Science Press.
This work is licensed under a Creative Commons Attribution 4.0 International License , which permits unrestricted use, distribution, and reproduction in any medium, provided the original work is properly cited.
 Downloads
 Citation Tools