
 Submit a Paper
 Propose a Special lssue
 Open Access
ARTICLE

Analysis of the Applicability of a Risk Quantitative Evaluation Method to High Temperature-Pressure Drilling Engineering
1 CNOOC Research Institute, Beijing, 100101, China
2 College of Petroleum Engineering, China University of Petroleum, Qingdao, 266580, China
* Corresponding Authors: Baolun He. Email: ; Yuqiang Xu. Email:
Fluid Dynamics & Materials Processing 2023, 19(6), 1385-1395. https://doi.org/10.32604/fdmp.2023.025454
Received 13 July 2022; Accepted 27 September 2022; Issue published 30 January 2023
 View Full Text
 Download PDF
Abstract
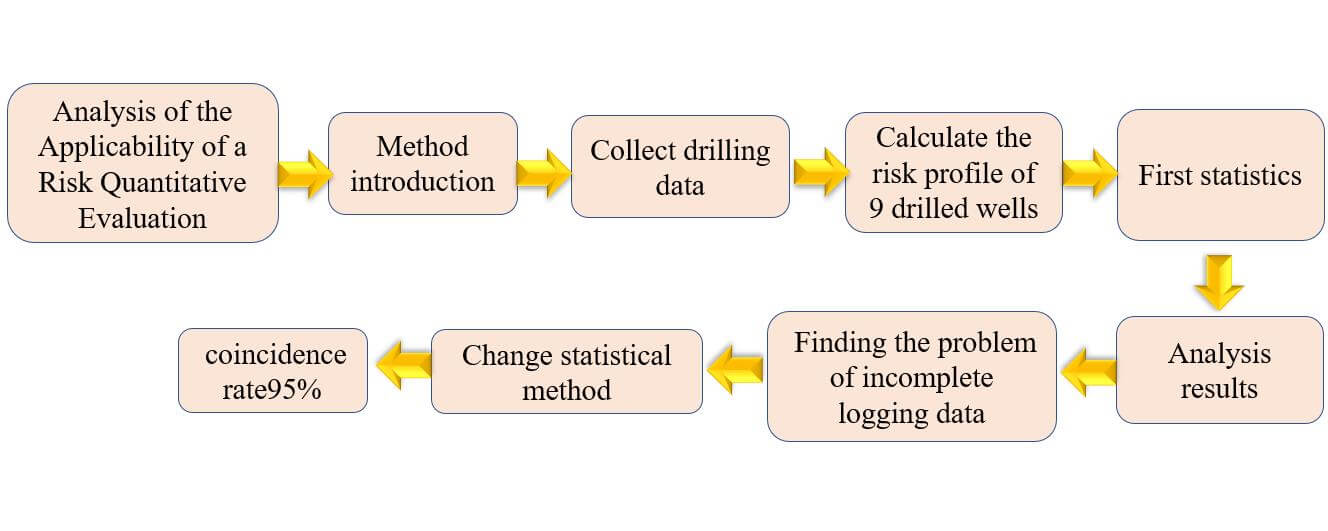
The optimization of methods for the quantitative evaluation of risks in drilling engineering is an effective means to ensure safety in situations where high temperature and high pressure blocks are considered. In such a context, this study analyzes the complexity of the drilled wells in such blocks. It is shown that phenomena such as well kick, loss, circulation, and sticking, are related to the imbalance of wellbore pressure. A method for risk quantitative evaluation is proposed accordingly. The method is used to evaluate the risk for 9 drilled wells. By comparing the predictions of the method with actual historical data related to these wells, it is found that the coincidence rate is about 95%.Graphic Abstract
Keywords
Offshore has become the main battlefield of oil and gas exploration. Most of the blocks are developed in high-temperature and overpressure formations, with huge natural gas reserves and overall exploration and development value. However, this region’s drilling and completion construction is faced with problems such as high temperature and high pressure, narrow safety density windows, and strong uncertainty of formation pressure information. In construction, situations such as well kick, well circulation, borehole collapse, and pipe sticking frequently occur, seriously restricting the exploration and development process [1–3]. Risk assessment of drilling engineering is an essential means to ensure safe construction. Therefore, Sabah et al. [4] took the Marun oilfield in Iran as an example, using the extracted data set composed of 1900 data subsets. The intelligent prediction model includes decision tree (DT), adaptive neuro-fuzzy inference system (ANFIS), artificial neural network (ANN) and hybrid artificial neural network, that is, multilayer perception (GA-MLP), which is developed according to genetic algorithm, is used to quantitatively predict leakage. Krechowicz [5] used the hybrid analysis method of the fuzzy fault and fault tree for risk management, which can effectively solve the problem because basic event probability is difficult to accurately get with the traditional fault tree analysis method and proposed 47 risk repair strategies. Rathnayaka et al. [6], using system hazard identification, prediction, and prevention methods, proposed an accident modeling and risk assessment framework based on accident precursors (early warning). Strand et al. [7] presented a method that can be used to solve human factors in modeling which are as an integral part of a well drilling operation risk assessment. Based on the reliability analysis of safety barrier and risk index evaluation, Li et al. [8] proposed a new quantitative risk assessment method—the barrier index risk prediction method (BIRP), which can predict the real-time risk state of a blowout in each stage of deepwater drilling and completion engineering. Huang et al. [3] proposed a quantitative risk analysis method based on the pressure balance technique, which considers the geological mechanic’s uncertainty and forms a more accurate risk assessment method.
The above literature research found that most existing methods apply the classical risk analysis method in the field of drilling projects, and results are often qualitative and semi-quantitative. Feedback from the field shows that this often cannot meet the safety requirements of offshore high-risk drilling construction. To verify the advantages and disadvantages of the above evaluation methods, this study takes a block in offshore as an example to analyze the applicability of quantitative risk assessment.
2 Drilling Engineering Risk Background in a Block
The buried depth of the reservoir in this block is 3800∼4100 m. The geothermal gradient of the basin increases gradually from north to south and from west to east. The formation pressure has the characteristics of more pressure steps and faster pressure uplift. The measured equivalent density of deep formation has reached about 2.30 g/cm3 [9]. The narrow safety density window brings challenges to the construction. Multiple lost circulations and sticking accidents occur in the drilling process [10]. The proportion of different drilled risk types in this block is shown in Fig. 1. From the engineering point of view, the risk problem is mainly due to the lack of understanding of pressure in this complex formation environment, which also influences many uncertain factors in pressure prediction. This will lead to insufficient accuracy of wellbore structure and fluid design, eventually leading to frequent safety accidents in engineering operations and restricting the construction process.
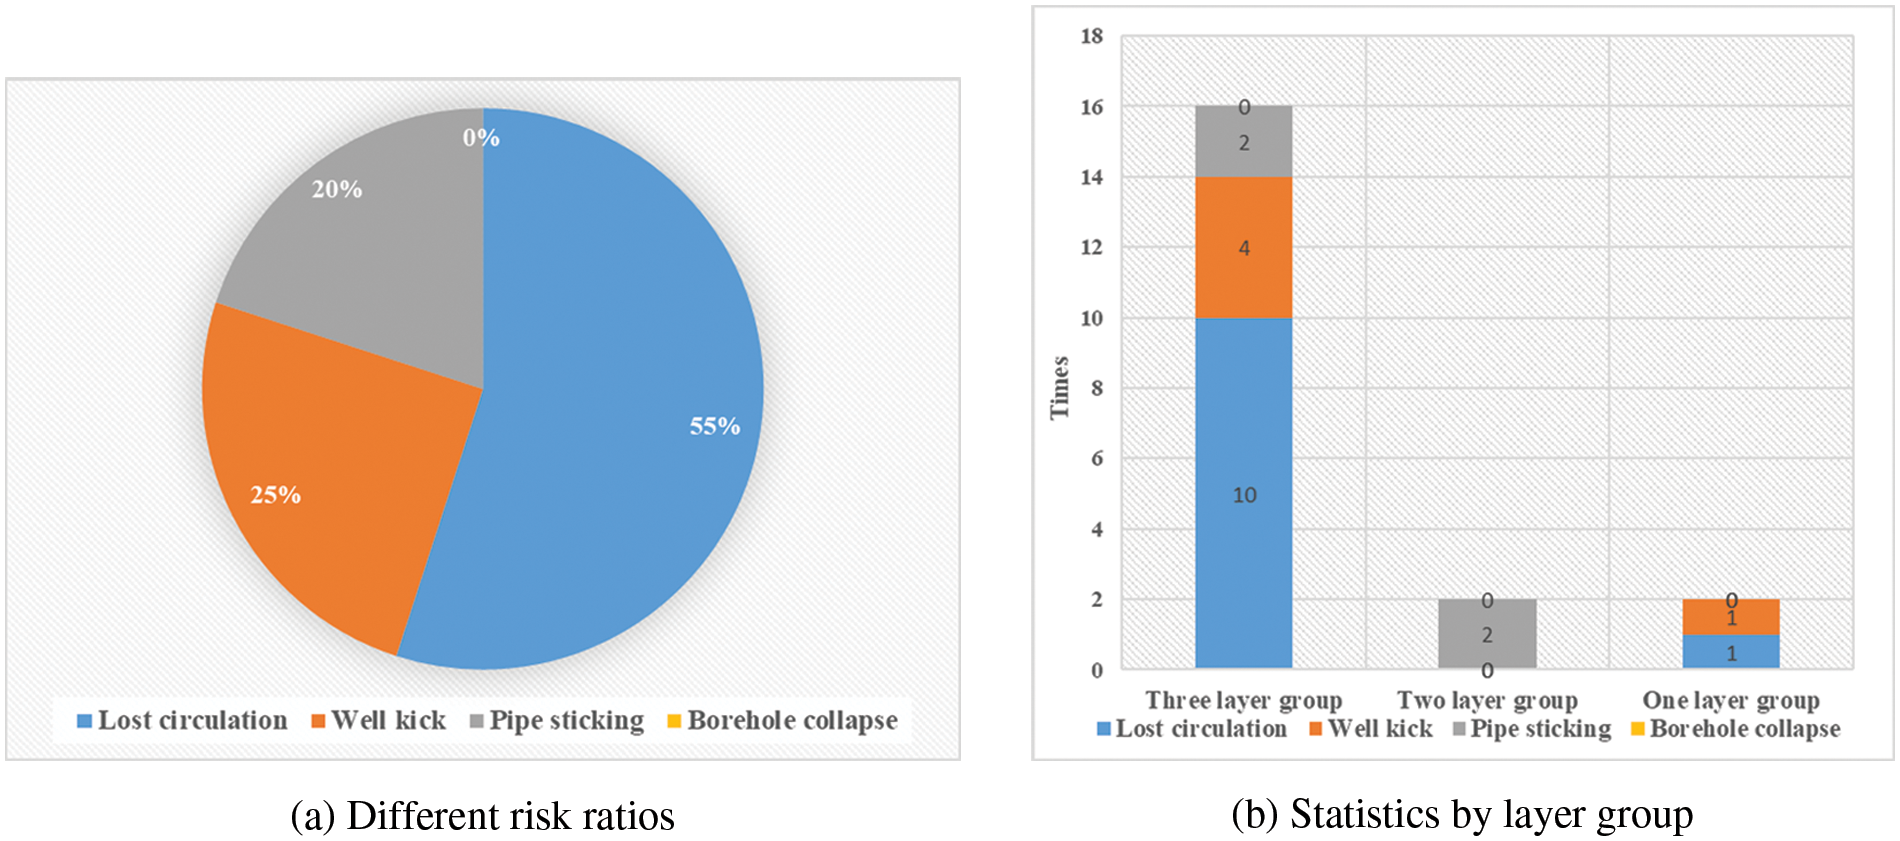
Figure 1: Statistical results of different types of risk
The risk is mostly concentrated in 3900∼4200 m. The drilling formations are mostly deep and complex, there are mainly sandy mudstone, especially mudstone formations with large sections of shale in the formation. There are sticking accidents in higher formations, which needs reverse reaming and reaming operation, and lost circulation accidents in its Lower Formation. The reason is that a narrow pressure window requires high-density drilling fluids to balance formation pressure. However, The use of high-density drilling fluid will cause the pressure of the liquid column in the wellbore to be greater than the fracture pressure, resulting in well loss in fracturing formation [11–13]. How to carry out drilling and completion operations efficiently and safely has become a big problem, so it is necessary to analyze its applicability. After analysis, the main reason for well kick in this block is the existence of high-pressure channel sand in deep formation [14]. The main reason for lost circulation is the fracturing leakage caused by high-density mud drilling. Sticking is mainly due to differential pressure sticking under different working conditions, which is judged to be related to the imbalance of wellbore pressure. Therefore, it is recommended to use the quantitative risk evaluation method of drilling projects based on wellbore pressure balance [3].
3 Brief Introduction of Quantitative Risk Evaluation Method for Drilling Engineering Based on Wellbore Pressure Balance [15,16]
Formation pore pressure, formation fracture pressure and collapse pressure profile are important basis for wellbore structure design. Due to complex formation conditions, incomplete interpretation data, and difficulty in selecting model parameters, the single-value formation pressure predicted by the conventional method is difficult to reflect real formation pressure, so the prediction of formation pressure has uncertainty. Guan et al. [16] proposed the concept of formation pressure profile with credibility. This method is based on the objective existence of error, and the pressure value is distributed in a certain interval in probability. From the feedback of field construction, this method can be more conducive to wellbore structure and fluid design, and can effectively control the occurrence of risks.
Quantitative risk analysis method based on pressure balance can be summarized as the following steps:
1. Calculation of formation pore pressure with credibility: According to the velocity of the seismic layer, the single-value pressure is calculated combined with Fillippone;
2. By combining Fillippone and Eaton methods, Eaton index is back-analysised to determine the probability distribution of whole Eaton index, and Eaton index of the obtained probability distribution is substituted into Eaton model. The distribution of pore pressure with confidence will be obtained, with different confidence profiles shown in Fig. 2;
3. Through the statistical analysis of logging data, core laboratory experimental data and LOT data, the structural stress coefficients of each well are obtained, and then these coefficients are counted to obtain range and distribution of their values;
4. Calculated rock mechanical parameters and tectonic stress coefficient are substituted into the calculation formula of formation collapse and fracture pressure [17], and formation collapse and fracture pressures are calculated to obtain formation collapse pressure and fracture pressure profile with probability information;
5. Finally, according to practical drilling fluid density and formation pressure measured data of adjacent wells, four formation pressure profiles with credibility are corrected by translation or interpolation;
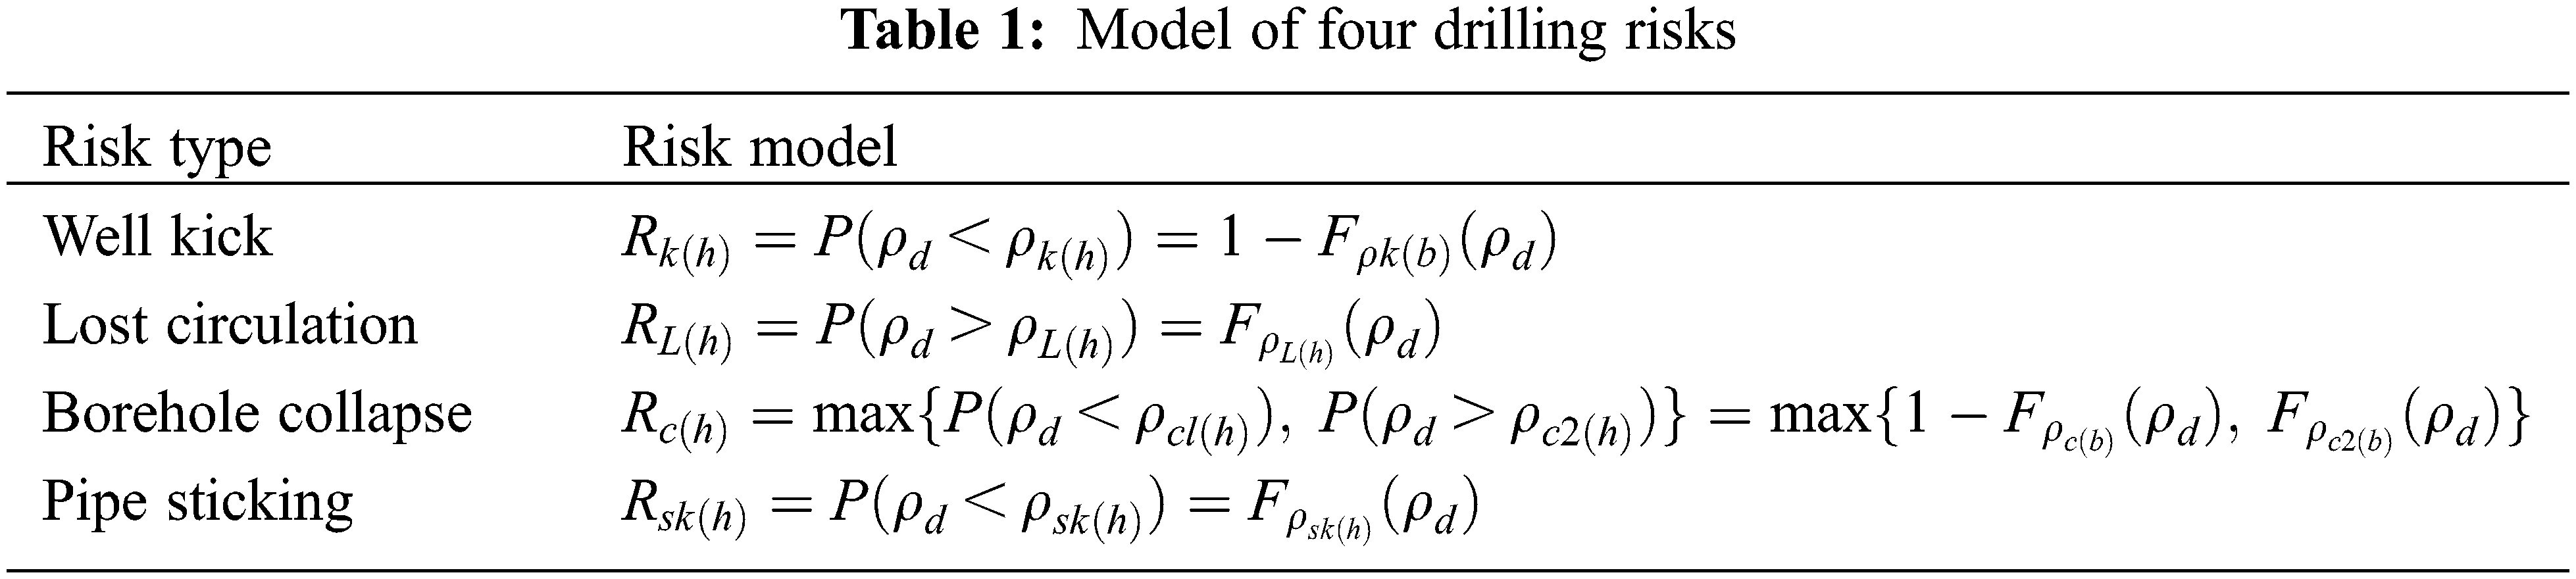
6. Based on constraint conditions of safe drilling fluid density design, four types of risks including well kick, lost circulation, wellbore collapse, and differential pressure pipe-stuck, are mainly considered. Combining formation pressure profile with the above three constructed credibility, four drilling engineering risk evaluation models are defined, as shown in Table 1.
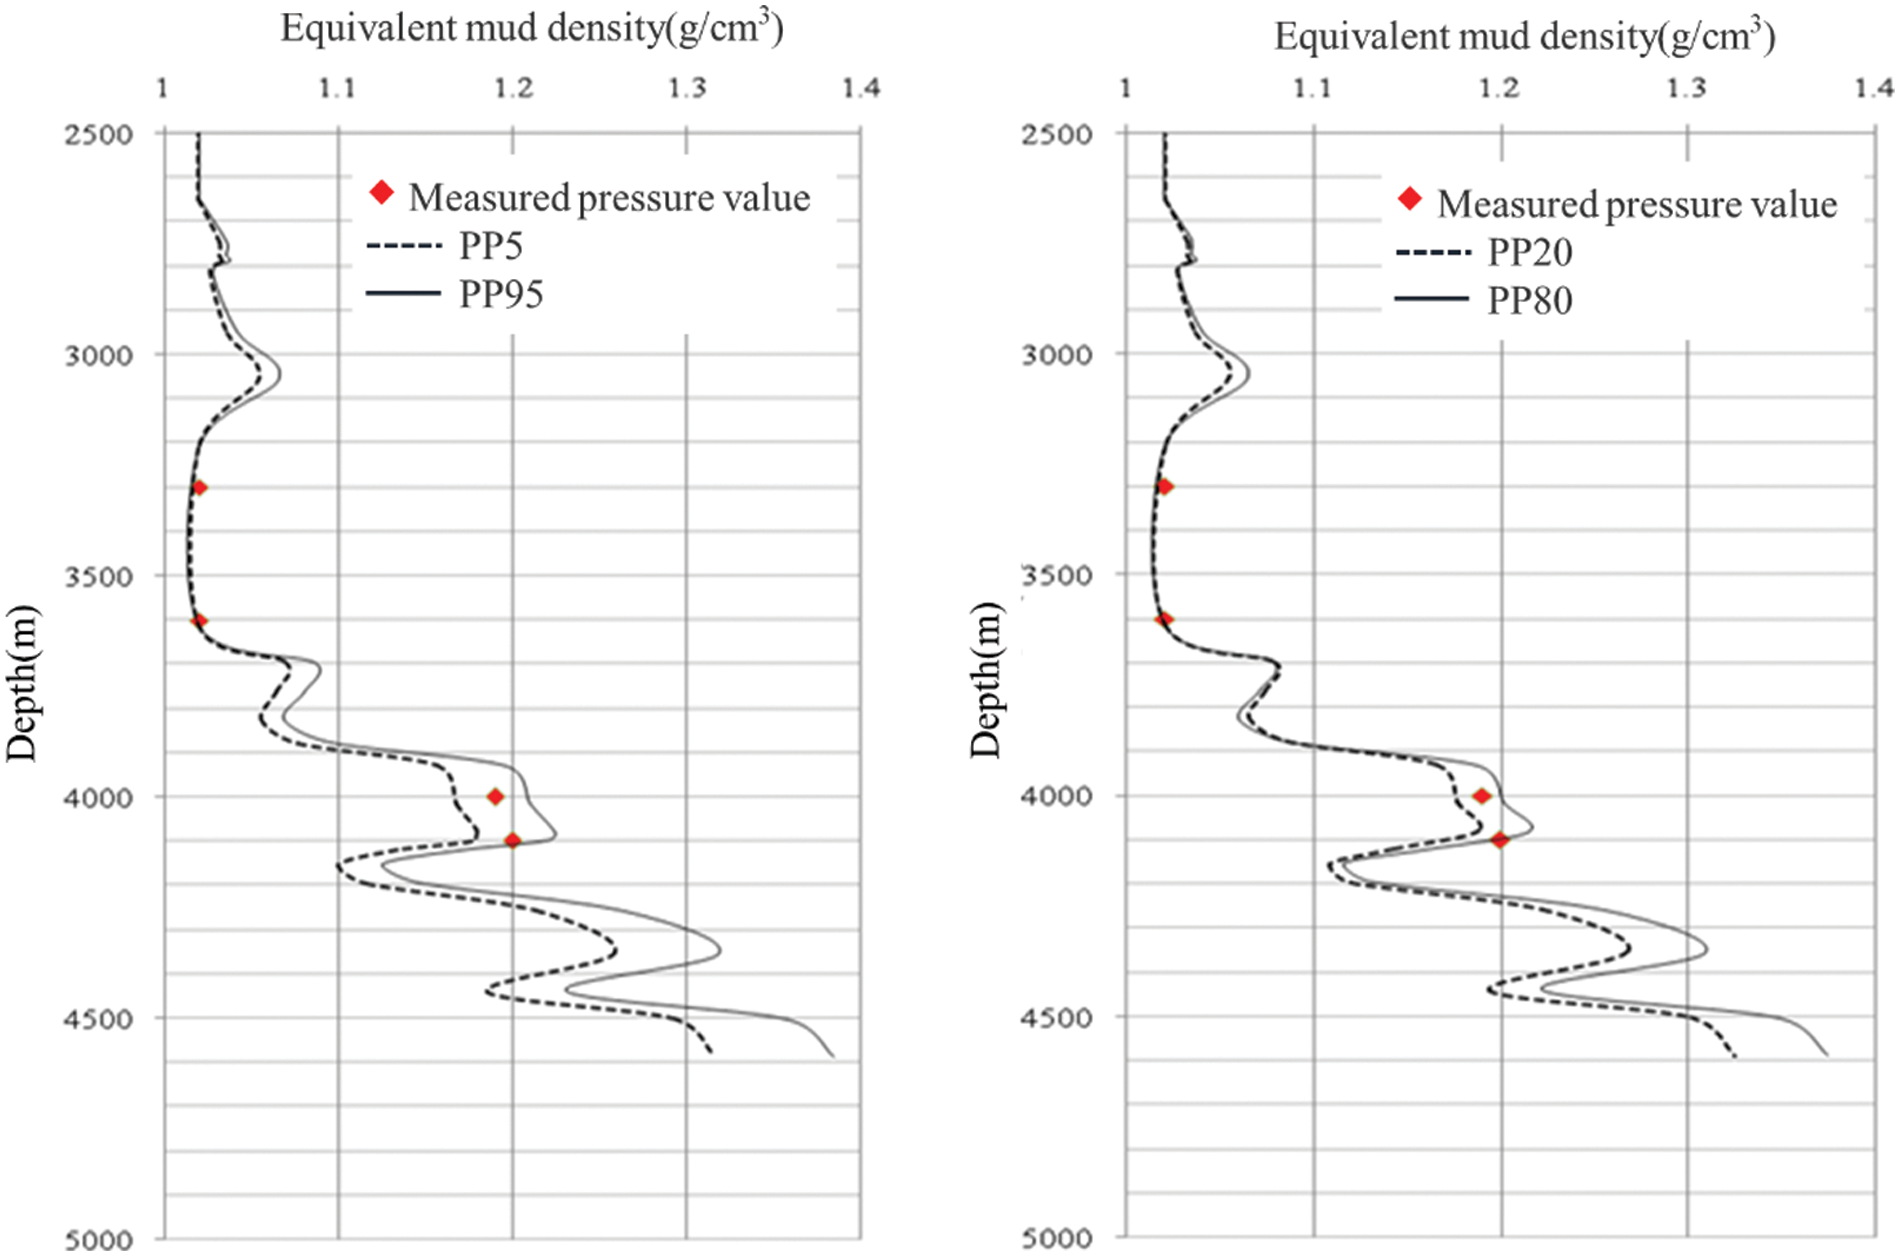
Figure 2: Comparison of 90% and 60% confidence pressure profiles
In the formula,
Combined with the above risk assessment method, the authors predicted the risk of 9 drilled wells in this block, and compared them with the actual situation. Taking Well A as an example for specific analysis, the drilling depth is 4368 m, and the risk of the well mainly occurs in Formation 6 with depth range of 4061∼4330 m. There are four times of lost circulation, two times of well kick, and simultaneous occurrence of lost circulation and well kick, which is due to the inaccurate grasp of formation pressure [18]. According to the above method, this section constructs three kinds of formation pressure profiles with credibility and calculates four kinds of drilling engineering risk probability profiles, as shown in Fig. 3.
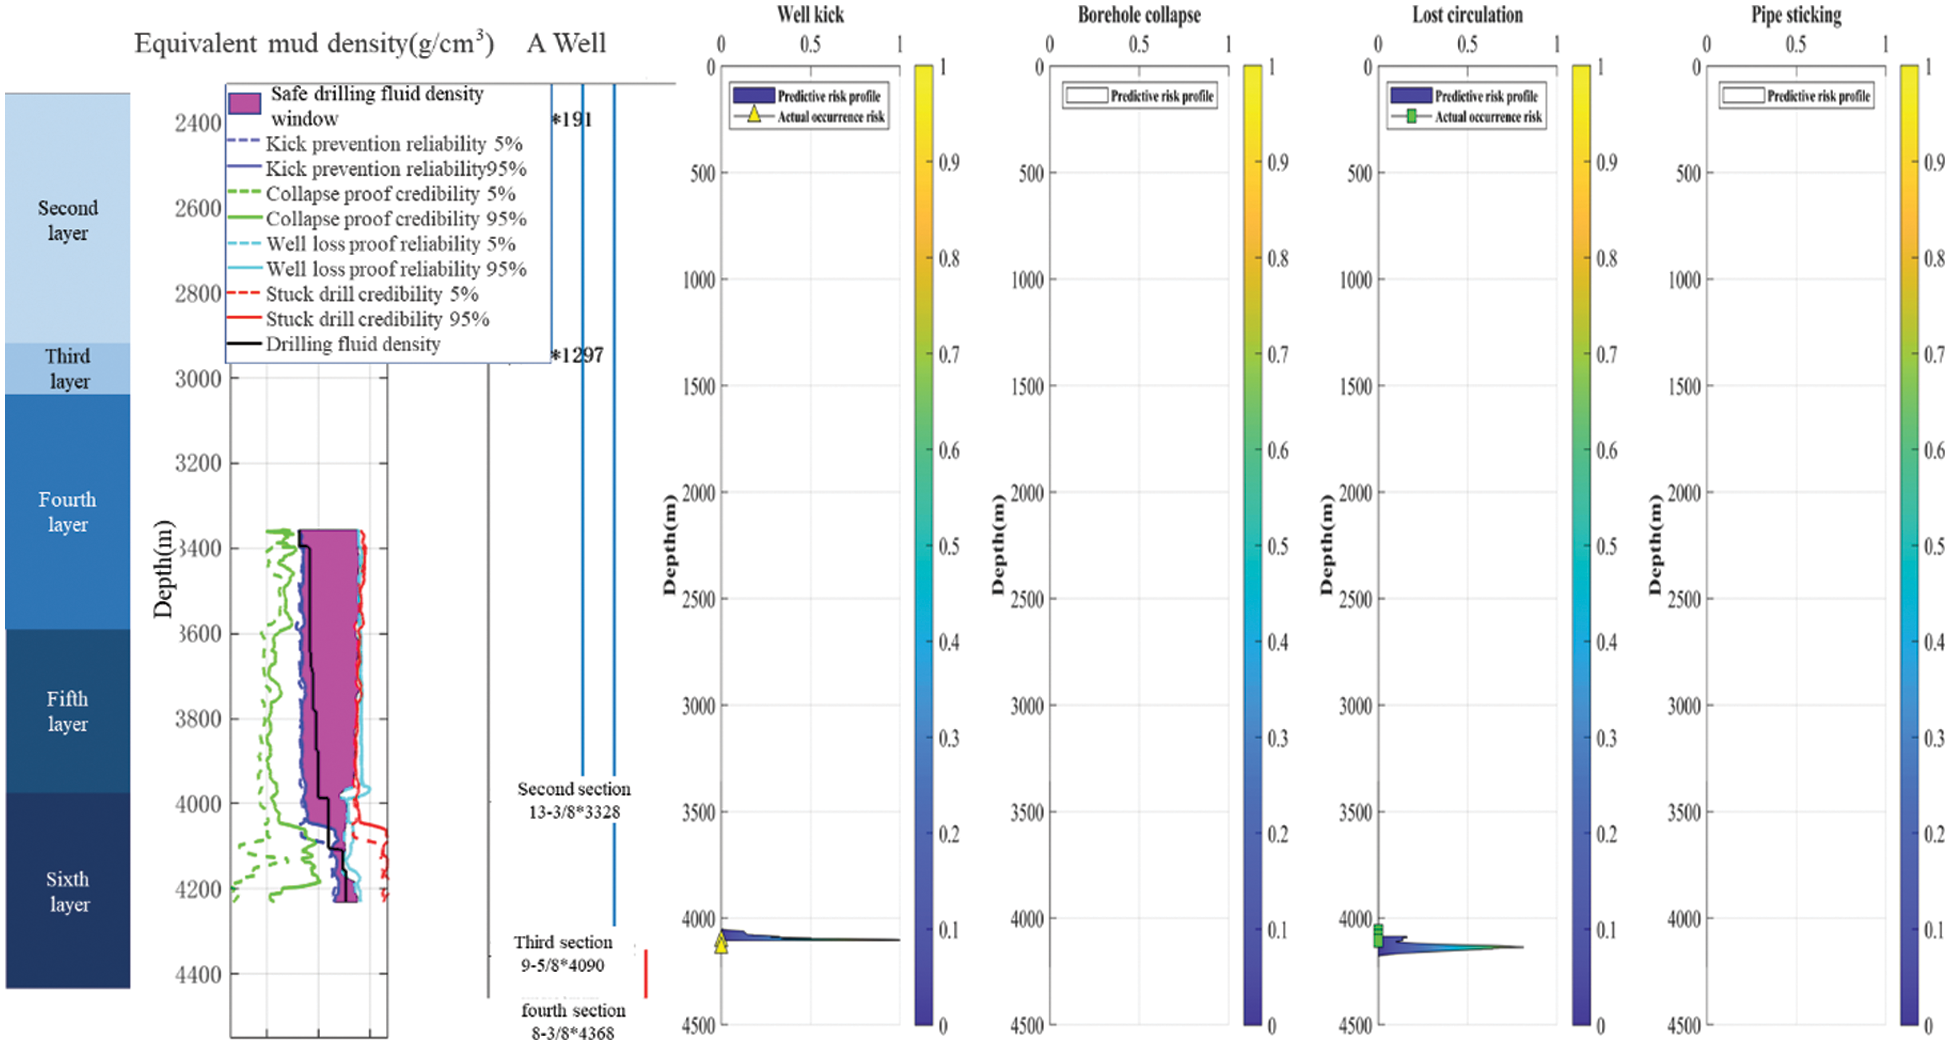
Figure 3: Quantitative risk assessment results of Well A
Fig. 3 shows the predicted risk at the well’s bottom. The practical drilling fluid density at this depth is greater than the upper limit of the safe drilling fluid density, and the predicted risk occurrence probability is 86%. The well kick accident at this depth is predicted, and the risk occurrence probability of lost circulation is 100%, which is consistent with the actual lost circulation accident at this depth.
In order to evaluate quantitative evaluation method from the whole block, the authors used this method to evaluate the risk of 8 remaining wells, and compared them with the actual situations.
Fig. 4 predicted that occurrence probability of lost circulation at 4000∼4080 m in Well B is high, and the actual lost circulation accident occurs at 4050 m, which is consistent with actual situation.
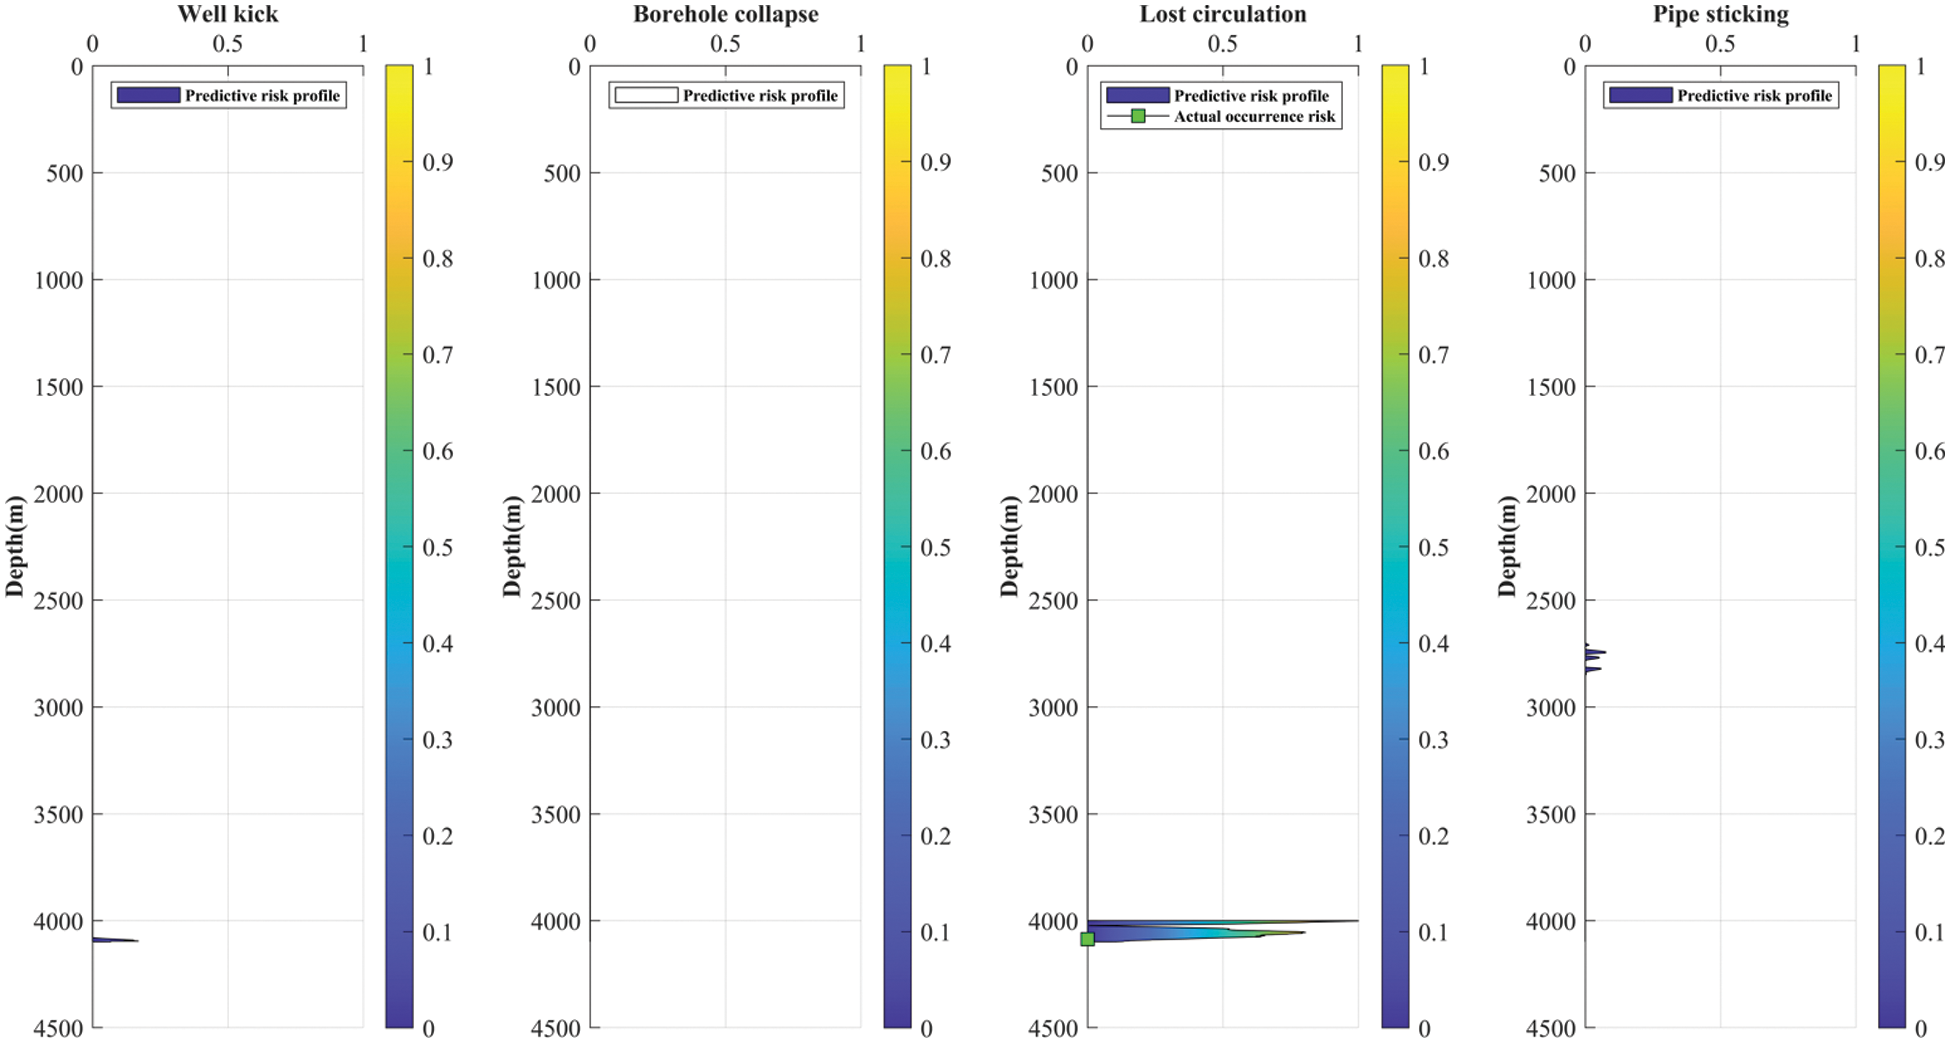
Figure 4: B Well risk profile
Fig. 5 predicted that there is low occurrence probability of well kick accident near 3000 m in Well C, and the occurrence probability of lost circulation accident at 4080 m is 100%, which is consistent with the actual lost circulation accident. There is a sticking risk at 4100 m, and the maximum occurrence probability is more than 0.5. Actual lost circulation accident occurs at the depth of 4103 m.
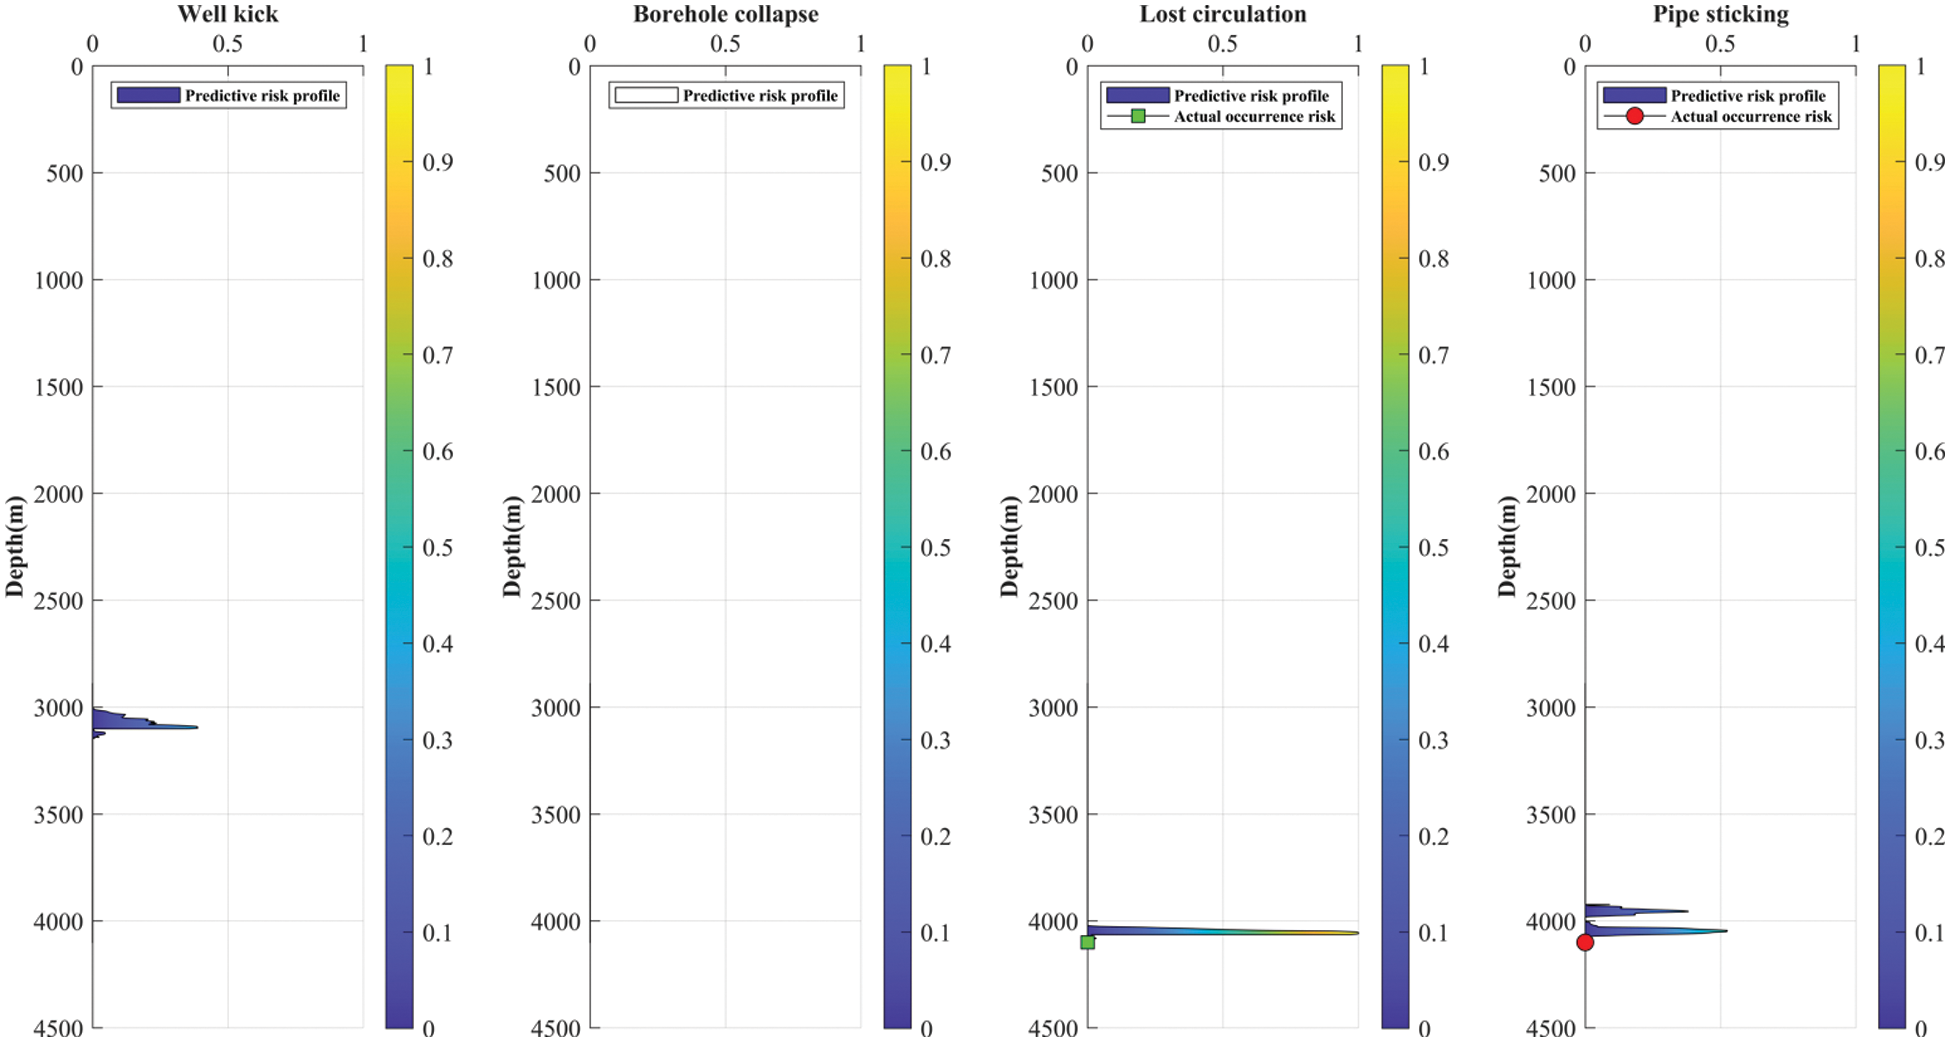
Figure 5: C Well risk profile
In fact, there is no risk in Well D, but Fig. 6 predicted that there is low occurrence probability of wellbore collapse at 3350 m, indicating that drilling fluid density design can be further optimized, and quantitative evaluation method of side reaction also has advantages in the upper formation.
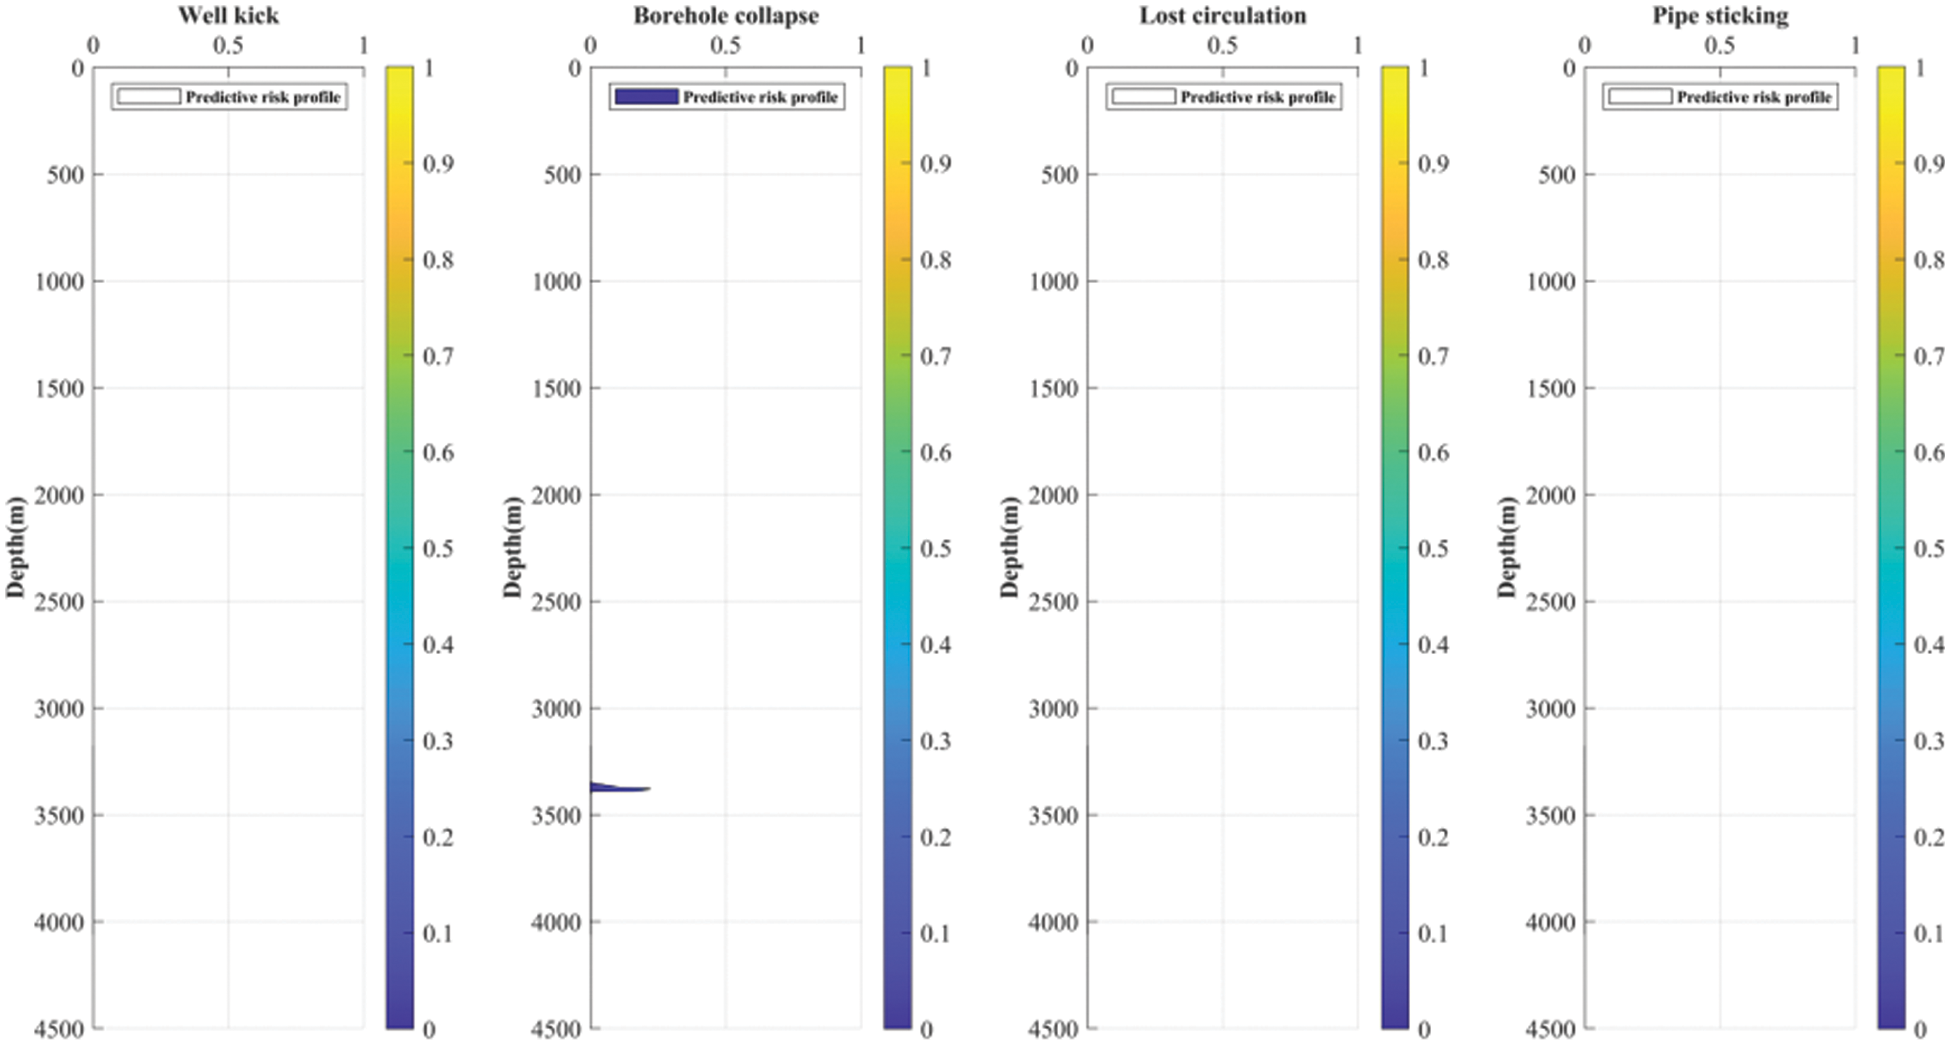
Figure 6: D Well risk profile
Fig. 7 predicted that there are well gushing and lost circulation risk accidents in Well E at 4050 m, which is consistent with the actual situation.
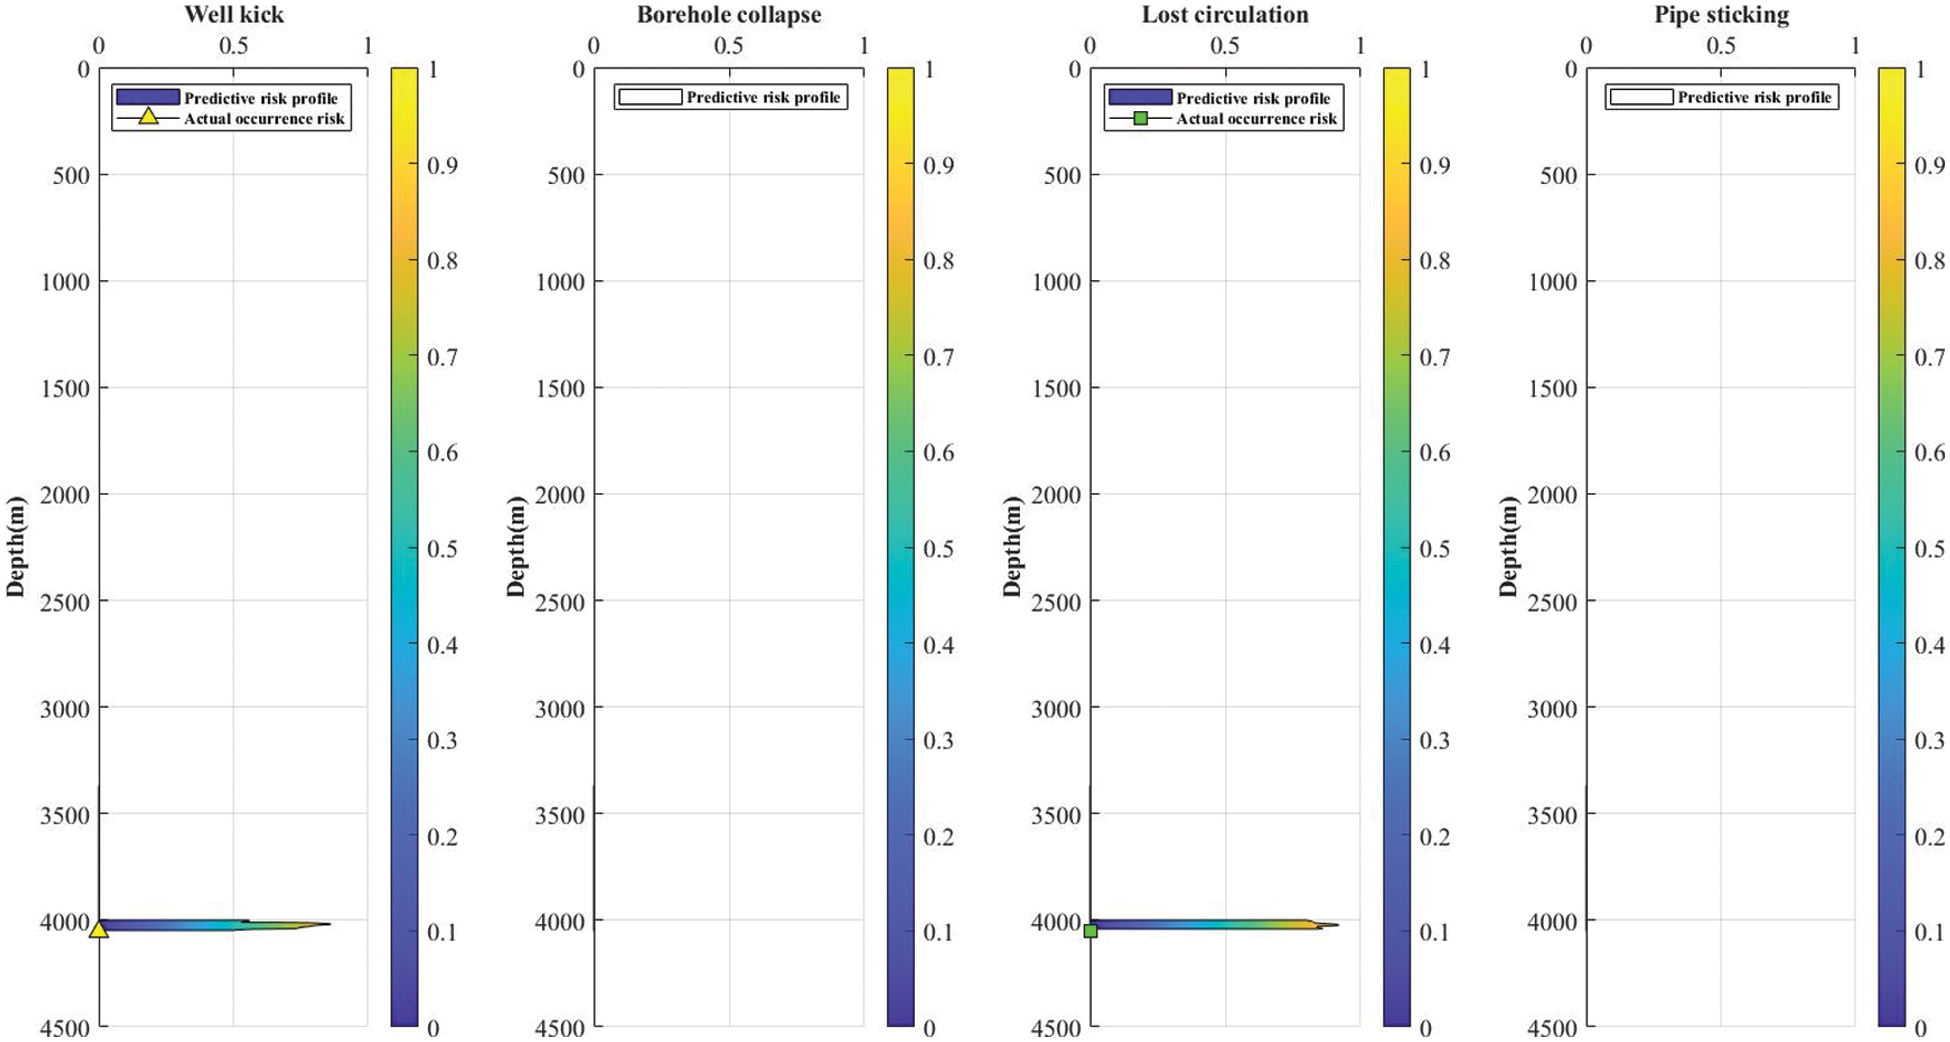
Figure 7: E Well risk profile
Fig. 8 predicted to have a high probability of leakage at 3500 m, but no risk occurs, which is inconsistent with the actual situation.
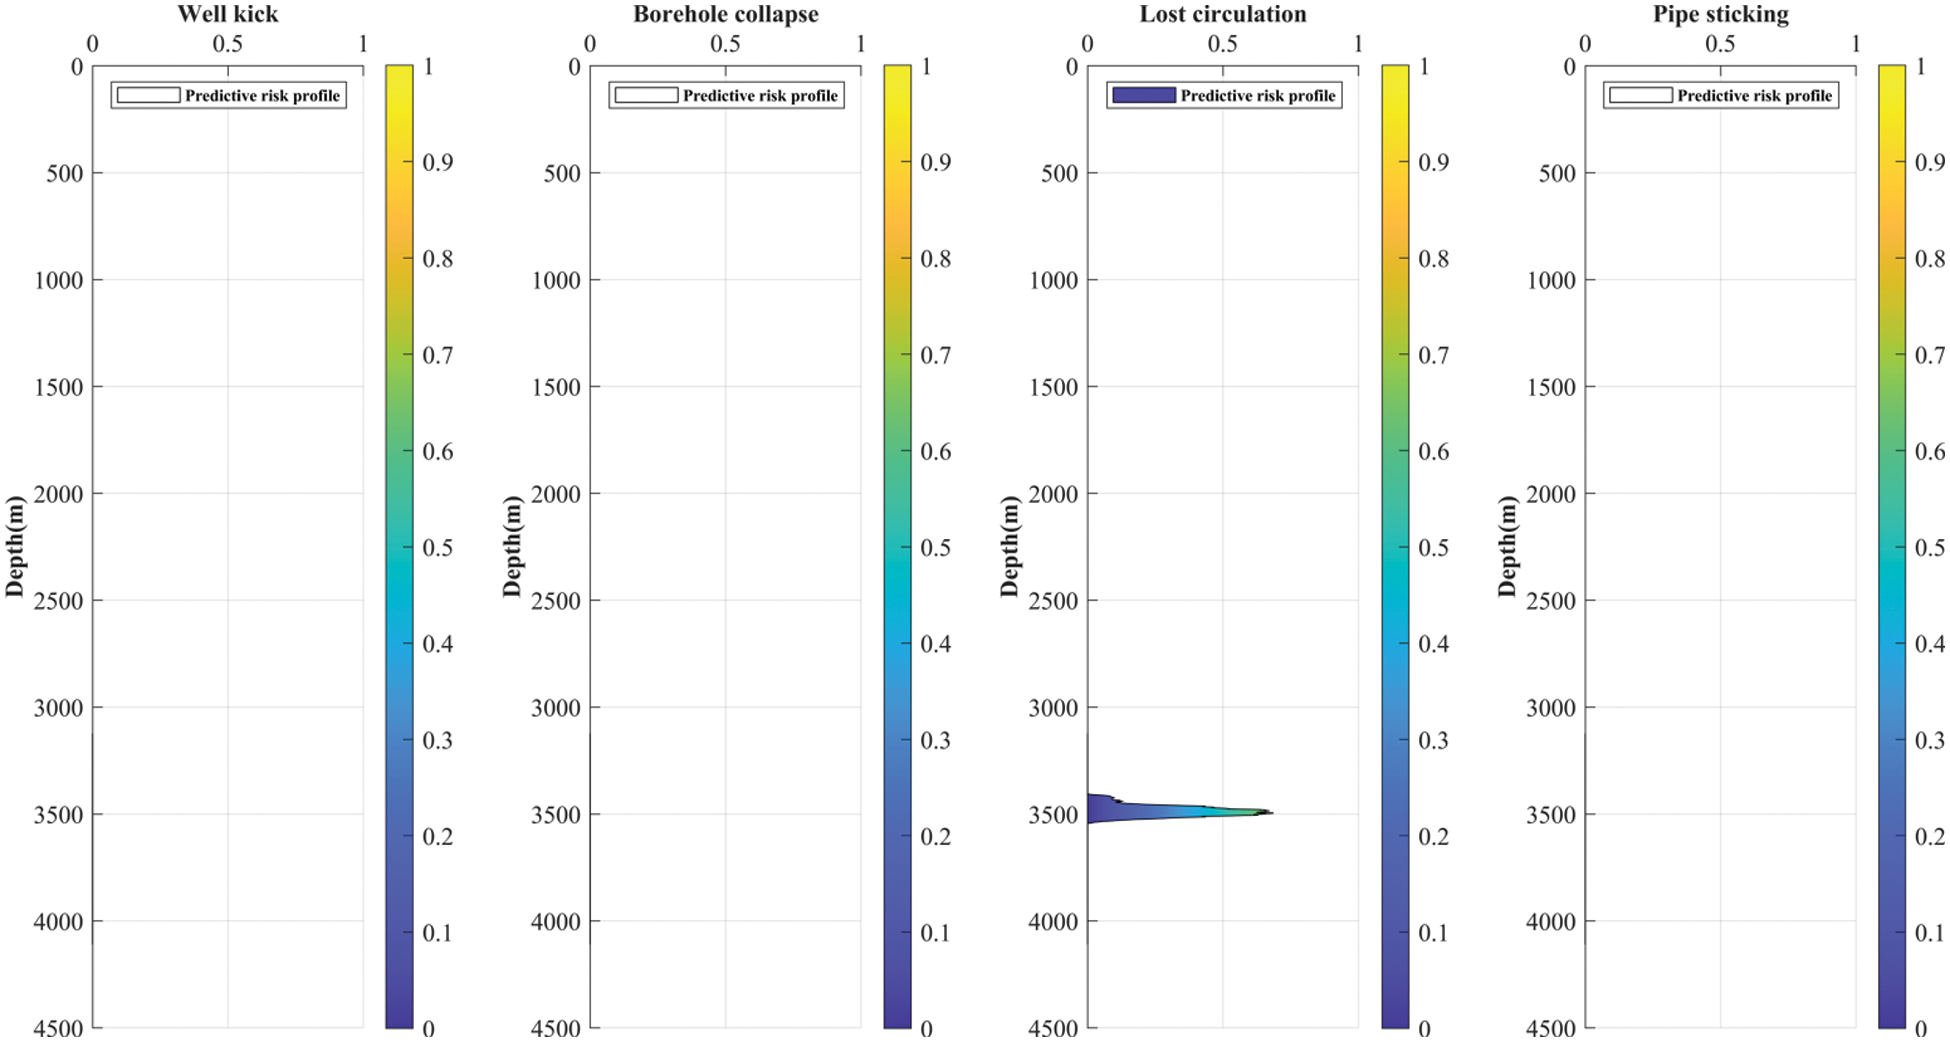
Figure 8: F Well risk profile
Fig. 9 predicted that Well G has well kick and lost circulation accidents at 3950 m, which is consistent with the actual risk and low probability sticking risk at 3300 m.
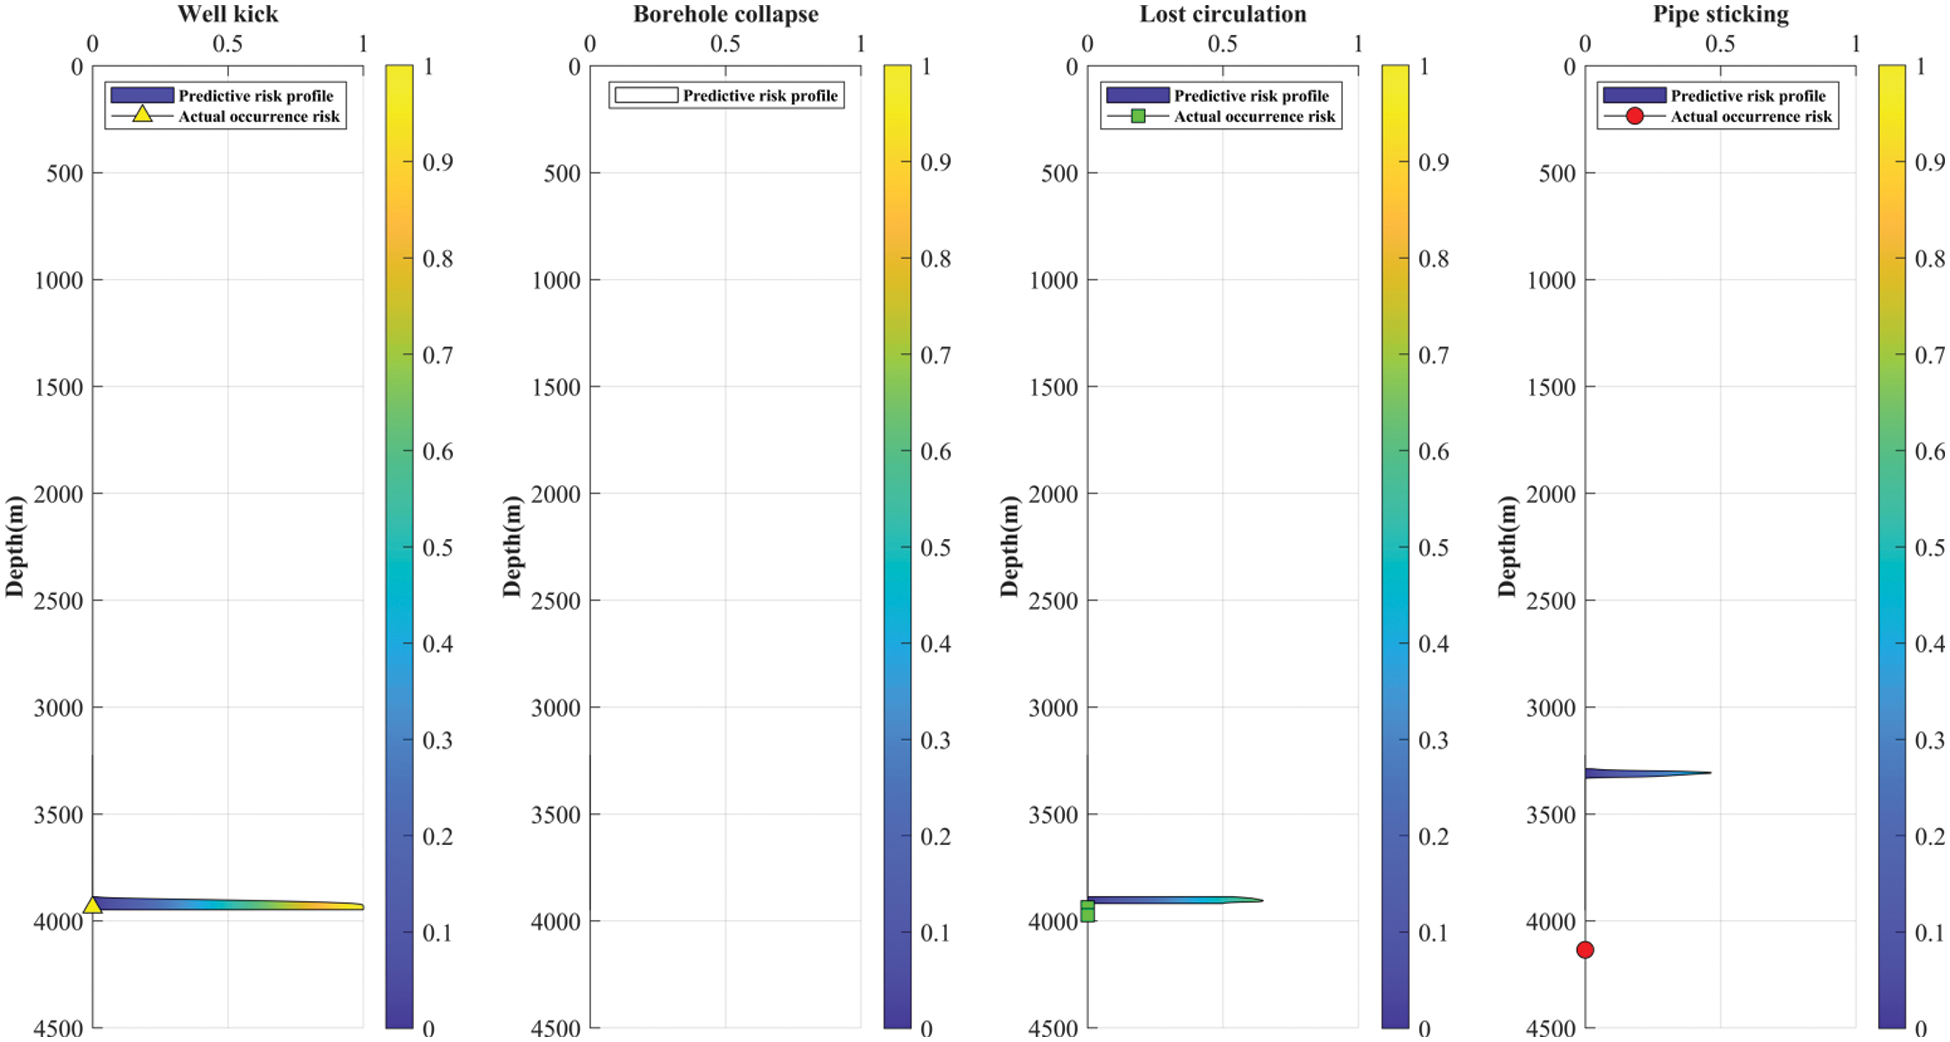
Figure 9: G Well risk profile
Fig. 10 predicted that Well H has the risk of well kick at 3955 m, which is consistent with the actual accident. Sticking accident is predicted at the depth of 3850 m, which is not consistent with the actual situation at 3050 m.
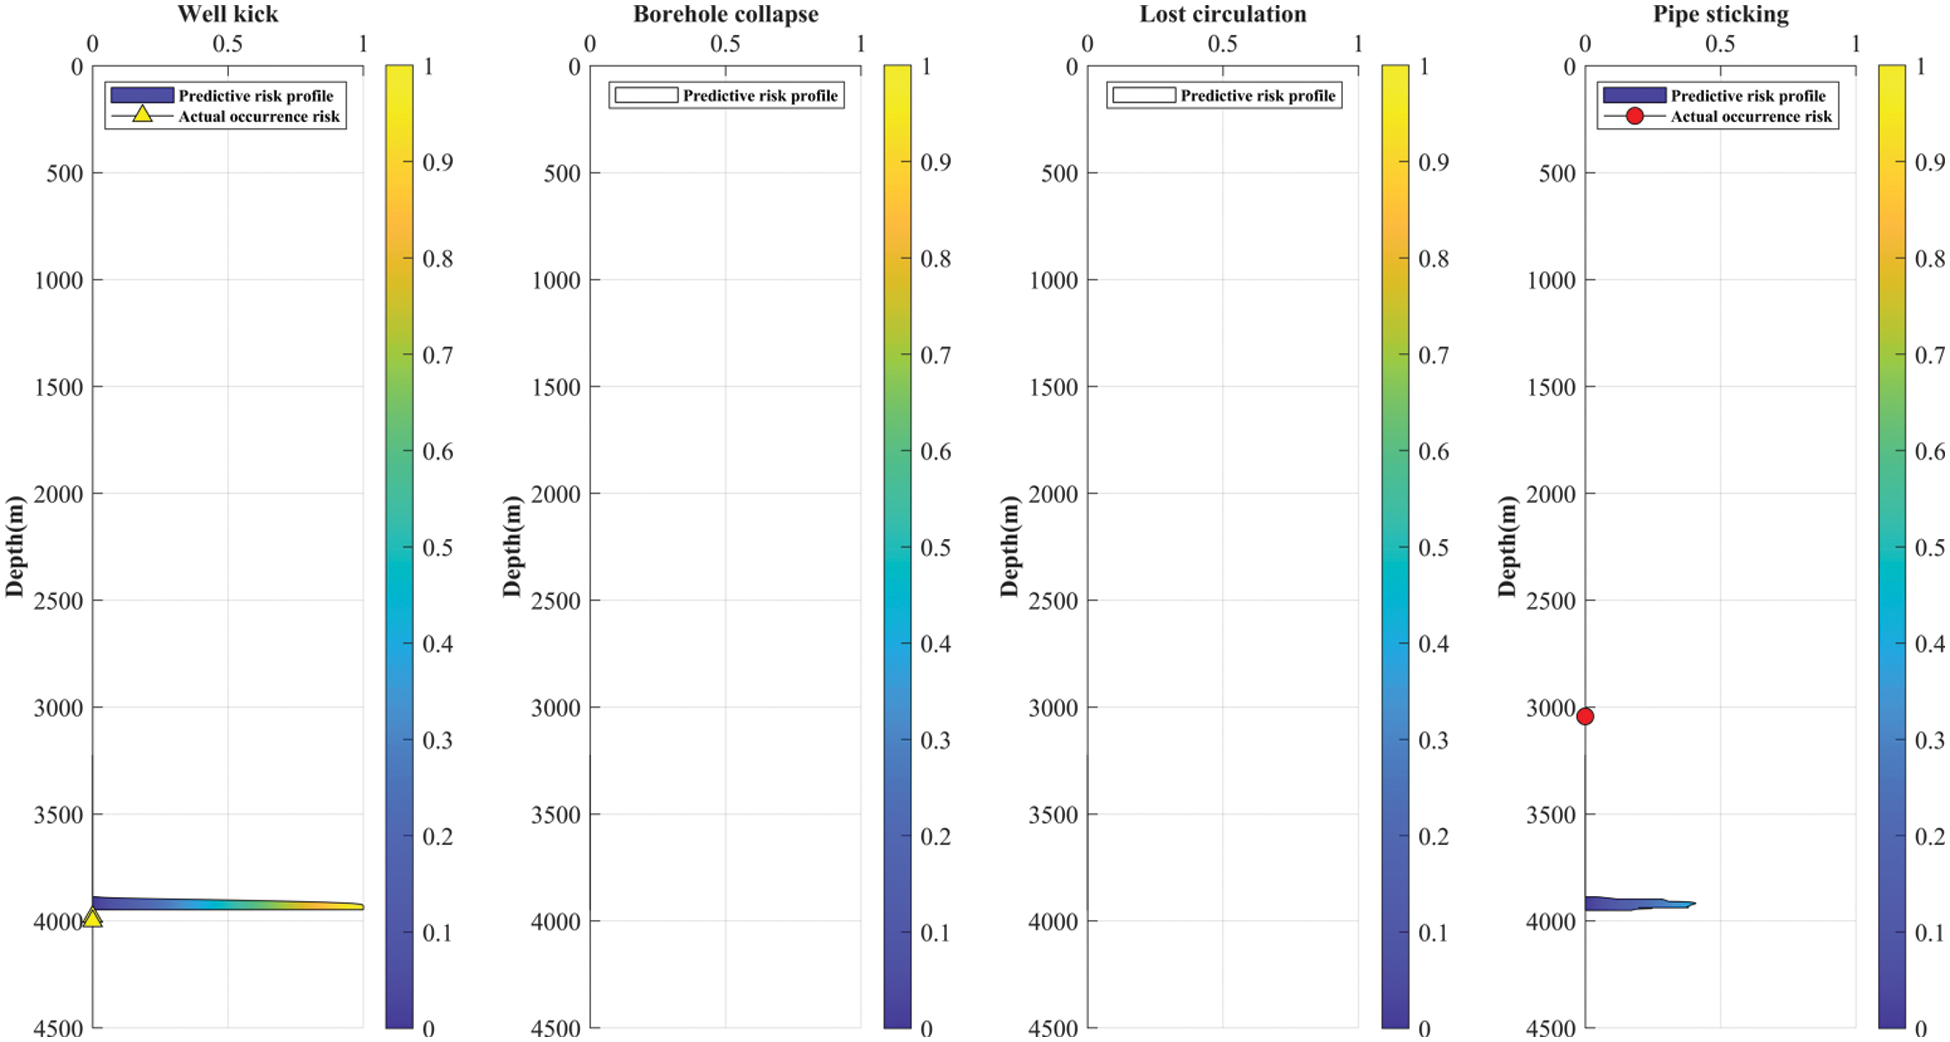
Figure 10: H Well risk profile
Fig. 11 predicted low occurrence probability of sticking accidents at 3450 m in Well I, which does not occur in practice.
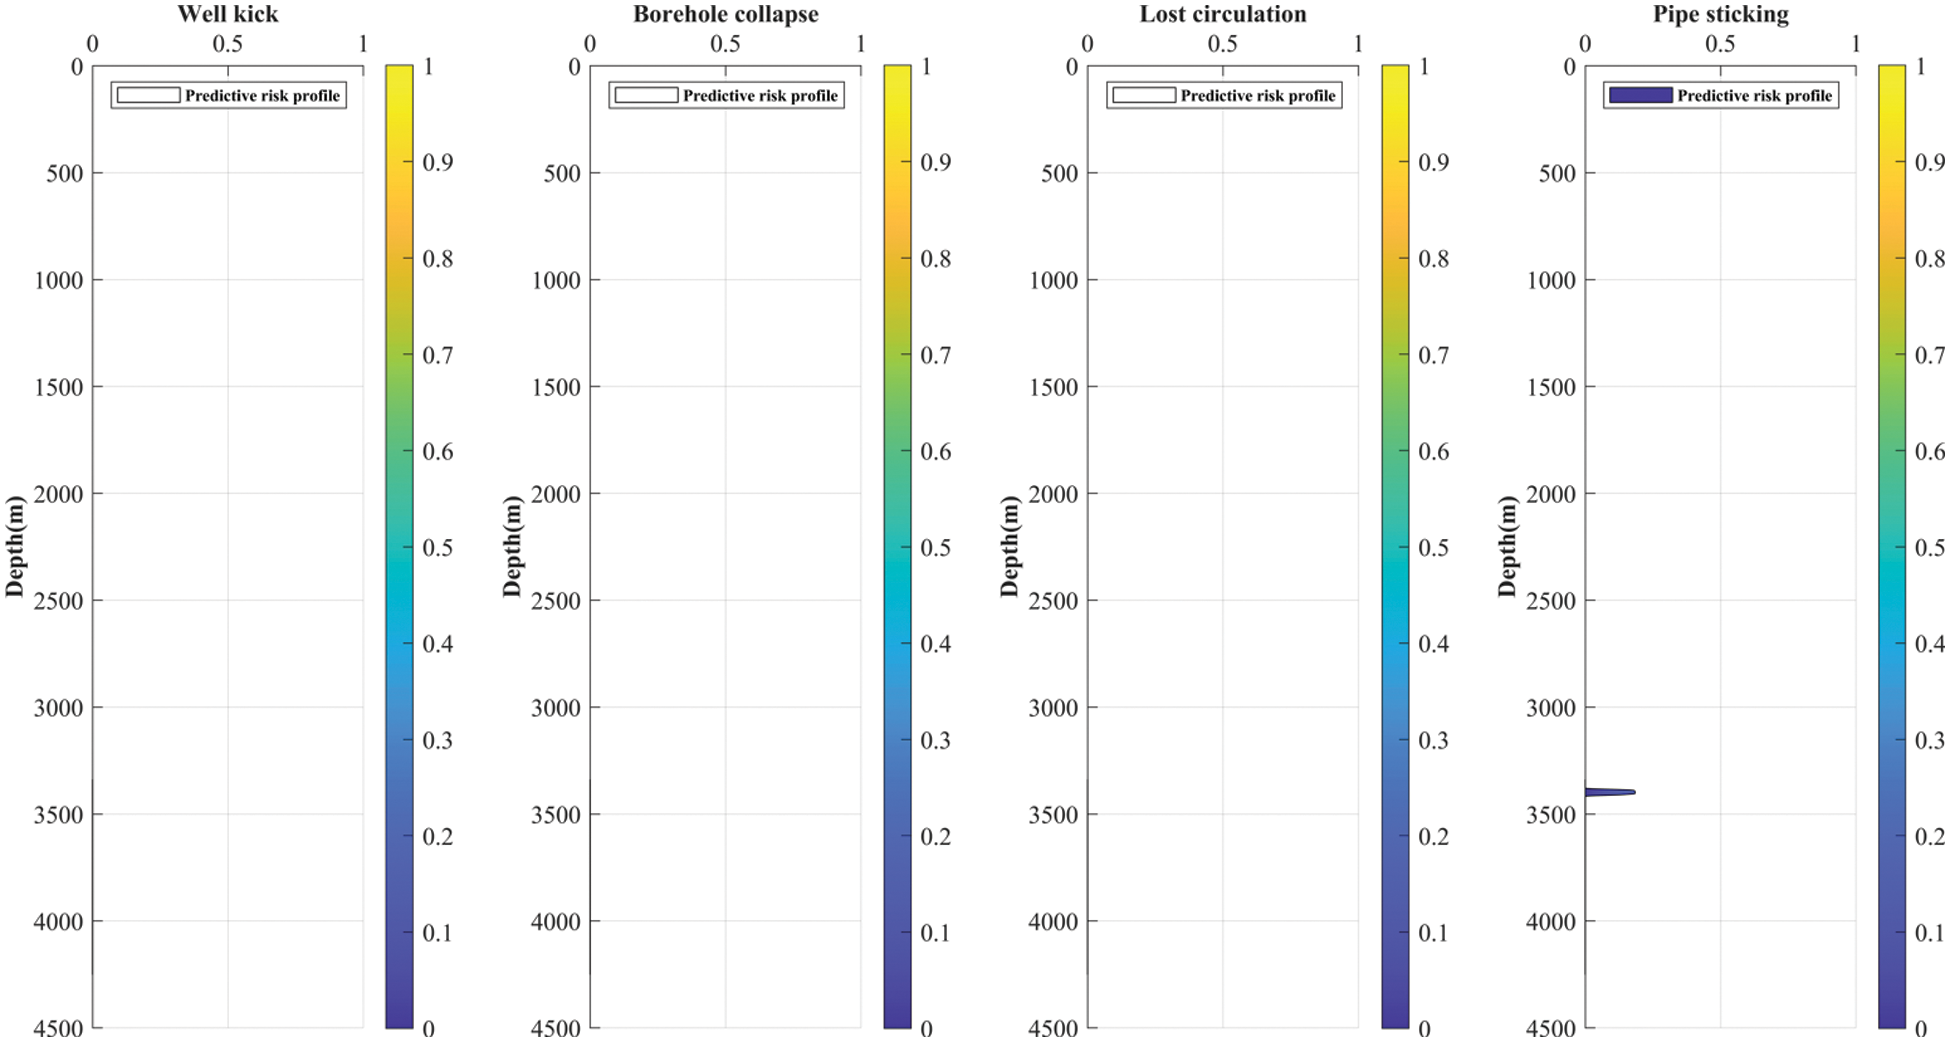
Figure 11: I Well risk profile
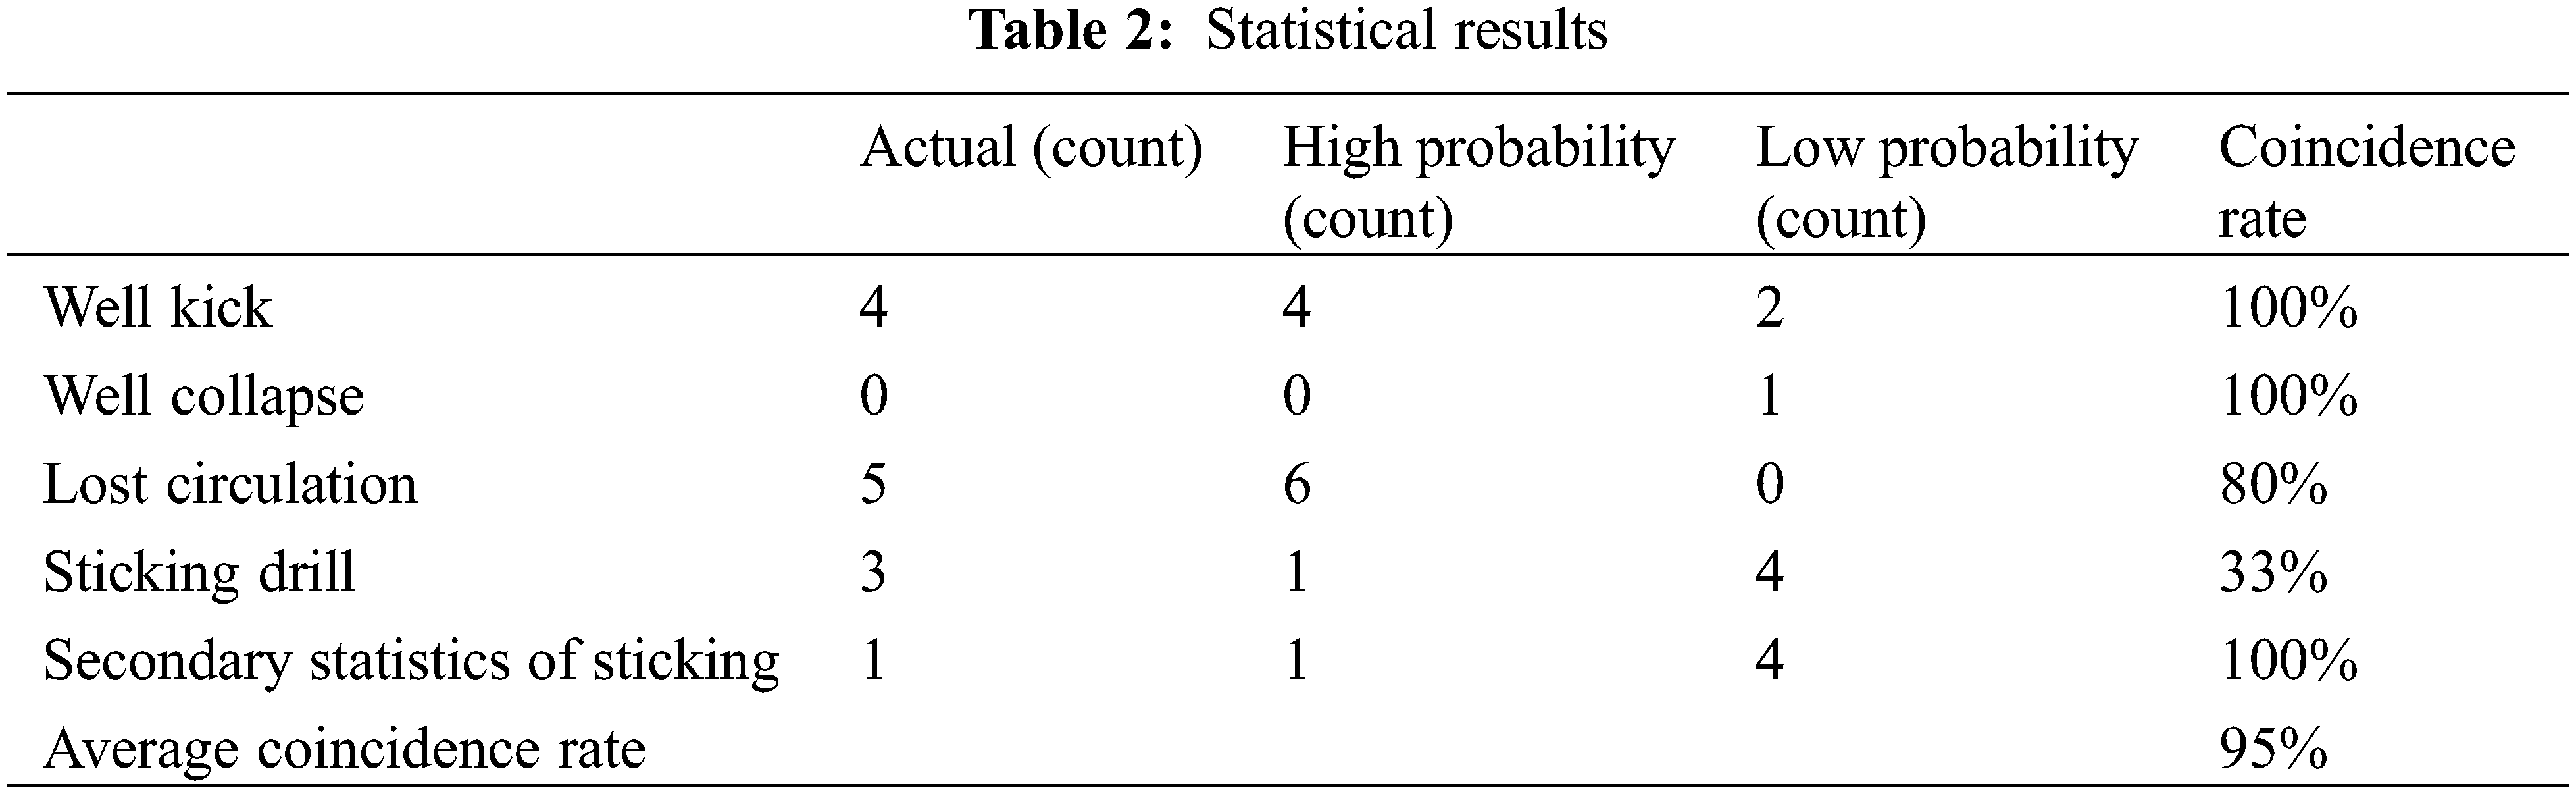
In order to systematically evaluate this method, the authors performed a statistical analysis of actual risk of the block and used a quantitative evaluation method. The near risk occurrence points in the statistics are recorded as one, such as accidents at 4100 and 4080 m in Well G, and evaluation method can predict two points in the depth section, which is consistent with actual situation. The maximum probability profile greater than 0.5 is defined as high probability, and lower than 0.5 is defined as a low probability.
It can be concluded from Table 2 that the accuracy of well kick, well collapse and prediction results are the highest, followed by lost circulation, and maximum sticking error. For example, the sticking accident occurred at 4135 m in Well A. Still, based on the quantitative evaluation method, it is difficult to obtain good prediction results due to the lack of logging interpretation data in the bottom section. The risk of sticking occurs in Well H at 3035 m, but logging interpretation depth is from 3256 to 4000 m at the bottom of well, which also limits the method. However, excluding the above problem of incomplete objective interpretation data, the secondary statistical results are obtained, and the average coincidence rate is 95%.
1. The quantitative evaluation method of underground engineering risk obtains an underground complex risk probability profile with geological engineering information, and quantified probability at the corresponding depth. Compared with the complex downhole situation in actual drilling progress, it has a good consistency.
2. Through pre-drilling risk assessment, the wellbore structure and mud design of any depth can be optimized, which brings good construction significance to the pre-drilling risk assessment for developing wells.
3. The deficiency of this method is that the source data requires high accuracy and richness. The model parameters should be as accurate as possible to establish more accurate pressure profiles, and to obtain accurate risk assessment results.
Funding Statement: The authors received no specific funding for this study.
Conflicts of Interest: The authors declare they have no conflicts of interest to report regarding the present study.
References
1. Kim, W., Woo, N., Park, J., Kim, H., Kang, D. et al. (2014). Marine survey for designing and installing offshore oil-gas plant. Geophysics and Geophysical Exploration, 17(1), 34–44. DOI 10.7582/GGE.2014.17.1.034. [Google Scholar] [CrossRef]
2. Abimbola, M., Khan, F. (2018). Dynamic blowout risk analysis using loss functions. Risk Analysis, 38(2), 255–271. DOI 10.1111/risa.12879. [Google Scholar] [CrossRef]
3. Huang, Y., Yang, J., Sheng, Y. (2019). Drilling engineering risk quantitative assessment for HTHP exploration wells in Yingqiong Basin. China Offshore Oil and Gas, 31(4), 119–124. [Google Scholar]
4. Sabah, M., Talebkeikhah, M., Wood, D., Khosravanian, R., Anemangely, M. et al. (2019). A machine learning approach to predict drilling rate using petrophysical and mud logging data. Earth Science Informatics, 12(3), 319–339. DOI 10.1007/s12145-019-00381-4. [Google Scholar] [CrossRef]
5. Krechowicz, M. (2021). The hybrid fuzzy fault and event tree analysis in the geotechnical risk management in HDD projects. Georisk Assessment and Management of Risk for Engineered Systems and Geohazards, 15(1), 12–26. [Google Scholar]
6. Rathnayaka, S., Khan, F., Amayotte, P. (2013). Accident modeling and risk assessment framework for safety critical decision-making: Application to deepwater drilling operation. Proceedings of the Institution of Mechanical Engineers, Part O: Journal of Risk and Reliability, 227(1), 86–105. DOI 10.1177/1748006X12472158. [Google Scholar] [CrossRef]
7. Strand, G., Lundteigen, M. (2016). Human factors modelling in offshore drilling operations. Journal of Loss Prevention in the Process Industries, 43, 654–667. DOI 10.1016/j.jlp.2016.06.013. [Google Scholar] [CrossRef]
8. Li, C., Jin, Y., Guan, Z., Dang, Z., Jin, J. et al. (2021). New quantitative risk prediction method of deepwater blowout: Case study of Macondo well accident. Energy Sources, Part A: Recovery, Utilization, and Environmental Effects. DOI 10.1080/15567036.2021.1903620. [Google Scholar] [CrossRef]
9. Li, Z., Liu, S., Li, Y., Xie, R. (2017). Key technology and practice of HTHP well drilling and completion in South China Sea. China Offshore Oil and Gas, 29(6), 100–107. [Google Scholar]
10. Xie, R., Wu, Y., Yuan, J., Zhang, X., Wu, Z. et al. (2021). Technical feasibility evaluation and key technologies study of drilling and completion for development of UHTHP gas fields in South China Sea. China Offshore Oil and Gas, 33(5), 122–129. [Google Scholar]
11. Moortgat, J., Schwartz, F., Darrah, T. (2018). Numerical modeling of methane leakage from a faulty natural gas well into fractured tight formations. Groundwater, 56(2), 163–175. DOI 10.1111/gwat.12630. [Google Scholar] [CrossRef]
12. Hosseini, S., Alfi, M. (2016). Time-lapse application of pressure transient analysis for monitoring compressible fluid leakage. Greenhouse Gases: Science and Technology, 6(3), 352–369. DOI 10.1002/ghg.1570. [Google Scholar] [CrossRef]
13. Rwechungula, J., Cheng, Y., Han, Z. (2022). Experimental study of fracture plugging effectiveness for improving the fracture pressure of a low bearing capacity formation. Petroleum Science and Technology, 40(5), 571–586. DOI 10.1080/10916466.2021.2007950. [Google Scholar] [CrossRef]
14. Yang, X., Shi, S., Zhang, H., Yang, Y., Liu, Z. et al. (2021). A pressure-drop model for oil-gas two-phase flow in horizontal pipes. Fluid Dynamics & Materials Processing, 17(2), 371–383. DOI 10.32604/fdmp.2021.011486. [Google Scholar] [CrossRef]
15. Sheng, Y., Guan, Z., Zhang, G., Ye, L., Liu, S. et al. (2016). Borehole structure optimization based on pre-drill risk assessment. Oil Drilling & Production Technology, 38(4), 415–421. [Google Scholar]
16. Guan, Z., Ke, K., Su, K. (2011). Casing design and optimization for deepwater drilling. Petroleum Drilling Techniques, 39(2), 16–21. [Google Scholar]
17. Wang, P., Zhang, X. (2022). Experimental study on seepage characteristics of a soil-rock mixture in a fault zone. Fluid Dynamics & Materials Processing, 18(2), 271–283. DOI 10.32604/fdmp.2022.017882. [Google Scholar] [CrossRef]
18. Wang, C., Liu, H., Liu, Y., Xia, X., Xiao, F. et al. (2022). Managed pressure drilling technology: A research on the formation adaptability. Fluid Dynamics & Materials Processing, 18(6), 1865–1875. DOI 10.32604/fdmp.2022.021668. [Google Scholar] [CrossRef]
Cite This Article
 Copyright © 2023 The Author(s). Published by Tech Science Press.
This work is licensed under a Creative Commons Attribution 4.0 International License , which permits unrestricted use, distribution, and reproduction in any medium, provided the original work is properly cited.
 Downloads
 Citation Tools