 Open Access
ARTICLE
Study of the Seepage Mechanism in Thick Heterogeneous Gas Reservoirs
1 Shanghai Branch of CNOOC, Ltd., Shanghai, 200335, China
2 School of Geosciences, China University of Petroleum, Qingdao, 266580, China
3 State Key Laboratory of Oil and Gas Reservoir Geology and Exploitation Southwest Petroleum University, Chengdu, 610500, China
* Corresponding Author: Xin Huang. Email:
Fluid Dynamics & Materials Processing 2023, 19(6), 1679-1691. https://doi.org/10.32604/fdmp.2023.025312
Received 05 July 2022; Accepted 11 October 2022; Issue published 30 January 2023
Abstract
The seepage mechanism plays a crucial role in low-permeability gas reservoirs. Compared with conventional gas reservoirs, low-permeability sandstone gas reservoirs are characterized by low porosity, low permeability, strong heterogeneity, and high water saturation. Moreover, their percolation mechanisms are more complex. The present work describes a series of experiments conducted considering low-permeability sandstone cores under pressure-depletion conditions (from the Xihu Depression in the East China Sea Basin). It is shown that the threshold pressure gradient of a low-permeability gas reservoir in thick layers is positively correlated with water saturation and negatively correlated with permeability and porosity. The reservoir stress sensitivity is related to permeability and rock composition. Stress sensitivity is generally low when permeability is high or in the early stage of gas reservoir development. It is also shown that in sand conglomerates, especially the more sparsely filled parts, the interstitial materials among the conglomerates can be rapidly dislodged from the skeleton particles under stress. This material can therefore disperse, migrate, and block the pore throat producing serious, stress-sensitive damage.
Keywords
In low-permeability reservoirs, the conclusion that there is a threshold pressure gradient for fluid seepage in porous media has been generally accepted by most scholars [1–3]. However, the threshold pressure gradient in low-permeability gas reservoirs has always been one of the petroleum research priorities [4]. On the one hand, the positive view is that there is residual water in the pores of low-permeability gas reservoirs, and natural gas will have a certain interface effect with the pore interface under high temperature and high-pressure conditions, resulting in a certain threshold pressure gradient for gas seepage [5,6]. On the other hand, researchers holding a negative view believe that natural gas molecules are small and easy to flow, and there will be no threshold pressure gradient when flowing in the pore media. Even if the gas cannot flow under certain conditions due to a certain saturation of water in the pore space, this situation should be classified as a two-phase seepage problem [7]. At present, there is no unified standard for the method of determining the threshold pressure gradient. The main methods of determination include laboratory experiments, numerical experiment, production analysis, stable test well methods, and transient test well methods. Among them, the experimental laboratory method is the most commonly used one, including the seepage method and the bubble method [8].
Stress sensitivity is the property of reservoir rock permeability to change with the variation of stress state [9,10]. Stress sensitivity of reservoirs (especially low-permeability reservoirs) is one of the research hotspots in petroleum engineering in recent years [11–14]. There is a great controversy in academic circles about the existence of strong stress sensitivity in low permeability reservoirs [15,16]. The research tools for stress sensitivity are mainly aboratory experiments [17–19]. Many scholars have conducted experimental tests and concluded that core permeability decreases with increasing effective stress, and irreversible loss of permeability occurs because the permeability cannot return to the initial state after stress release. Low-permeability reservoir rocks have a strong stress sensitivity, and the lower the permeability of the rock, the stronger the stress sensitivity. The reason for stress sensitivity is that the pore space in the core is compressed and even closed due to plastic deformation in the core during the increase of effective stress [20]. It has also been pointed out that in the process of the core permeability test, the effective stress is less than the elastic limit, and the core does not produce plastic deformation. The stress sensitivity is overestimated because the effect of the microgap between core and envelope is ignored, and there is no strong stress sensitivity in low permeability reservoirs [21,22]. The two opposing academic views confuse oil and gas production decision-makers on mine sites.
Thick-bedded tight gas reservoirs have high heterogeneity, great thickness, and seepage. Conventional analytical solutions cannot accurately characterize heterogeneity nor seepage [23–26]. Moreover, many experiments have shown that there are mechanisms such as high-speed non-Darcy seepage, stress sensitivity, movable water flow, and aqueous-phase nonlinear percolation in tight gas reservoirs, which cannot be accurately described by traditional analytical solutions [27,28]. Therefore, this paper takes Block A in the Xihu Sag of the East China Sea Basin as the research object. A seepage model for thick-bedded tight gas reservoirs considering multiple percolation mechanisms is developed to analyze the influencing factors of threshold pressure gradient and stress sensitivity in low-permeability sandstone reservoirs. It provides a substantial basis for the study of seepage mechanisms in low-permeability reservoirs.
2.1 Experimental Method of Low Permeability Gas Reservoir Low-Speed Non-Darcy Seepage
The bubble method is to test the pressure difference corresponding to the first bubble at the outlet end of the core, which is the threshold pressure difference, avoiding the manual data processing link, and the results are more representative. Bubble method test principle: when the core is filled with fluid, and the displacement pressure difference is displaced from low-pressure difference to high-pressure difference; a certain pressure must overcome the resistance of the largest pore throat in the core and the interfacial tension between the fluids, etc. At this time, the displacing fluid will begin to enter the pore channel and occupy the volume of the pore channel. Due to the pressure transmission, the fluid begins to move, and the thin tube at the outlet end of the core inserted in the water begins to generate air bubbles. We consider this pressure as the minimum start-up pressure.
2.1.1 Experimental Instruments and Experimental Process
The bubble method tests the threshold pressure gradient. The test instrument consists primarily of a full-size Core Lab gripper system of oil-water relative permeability metre manufactured by the American Core Lab company, as well as a pressure control system of gas-liquid relative permeability metre, with the experimental flow rate (Fig. 1).
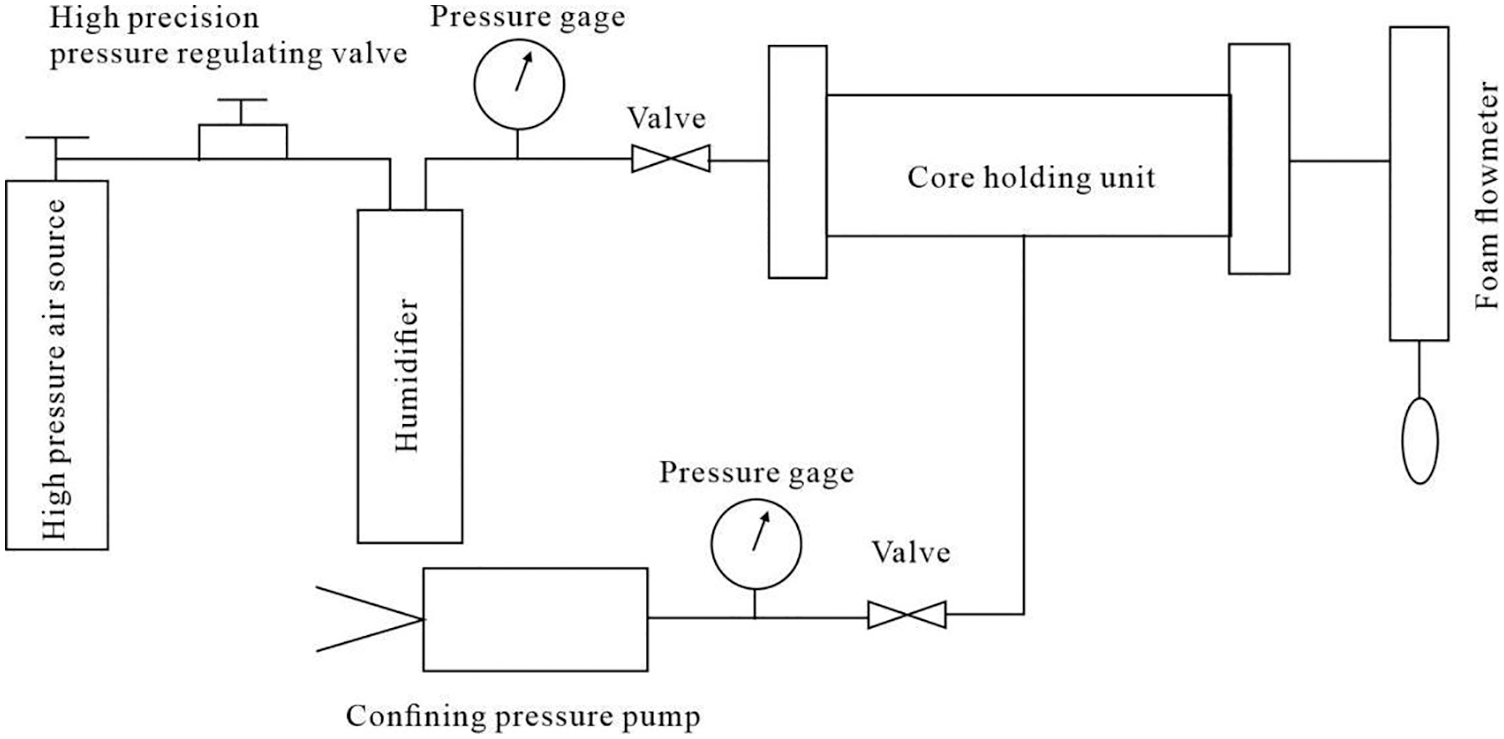
Figure 1: Flow chart of threshold pressure gradient test system
① First, evacuate the rock sample and completely saturate the formation water (low salinity brine);
② The rock sample is loaded into a Core Lab holder, and the formation water is passed through the rock sample with a displacement pump at a certain pressure or flow rate;
③ When the pressure difference between the inlet and outlet of the rock sample and the outlet flow rate are both stable, the water phase permeability is measured three times continuously, and the relative error is less than 3%;
④ Evacuate the rock sample and completely saturate the formation water (low salinity brine) again;
⑤ Close the valves at both ends of the Core Lab for more than 5 h to ensure the stability of fluid and pressure distribution in the Core Lab;
⑥ The formation water (low salinity brine) is then used to replace the Core Lab, and the pressure at the Core Lab’s inlet is gradually increased, with each pressure point remaining constant for 30 min. When the pressure at the Core Lab outlet is full of liquid, bubbles appear in the capillary. At this point, the minimum starting pressure difference is the corresponding pressure difference at both ends of the Core Lab, and the threshold pressure gradient is the corresponding pressure gradient.
2.1.3 Experimental Content and Experimental Conditions
The experiment was carried out at normal temperature, under normal pressure, using industrial nitrogen, whose purity is 99.95%.The formation water used was compounded indoors concerning the on-site formation water data. The formation water sample analysis report is shown in Table 1, and the samples are shown in Table 2.


2.2 Stress Sensitivity Experiment under Simulated Gas Reservoir Pressure Depletion
2.2.1 Experimental Instruments and Experimental Process
The experimental method of changing pore fluid pressure with fixed confining pressure was used to simulate the stress sensitivity of underground reservoir under the actual situation of effective stress change in order to study the change law of reservoir rock permeability caused by the change of pore fluid pressure. The abnormally high-pressure Core Lab displacement device and the actual reservoir Core Lab were used. The confining pressure of the gas field in the Xihu Sag A is 80–87 MPa, and the temperature is 158°C (Fig. 2).
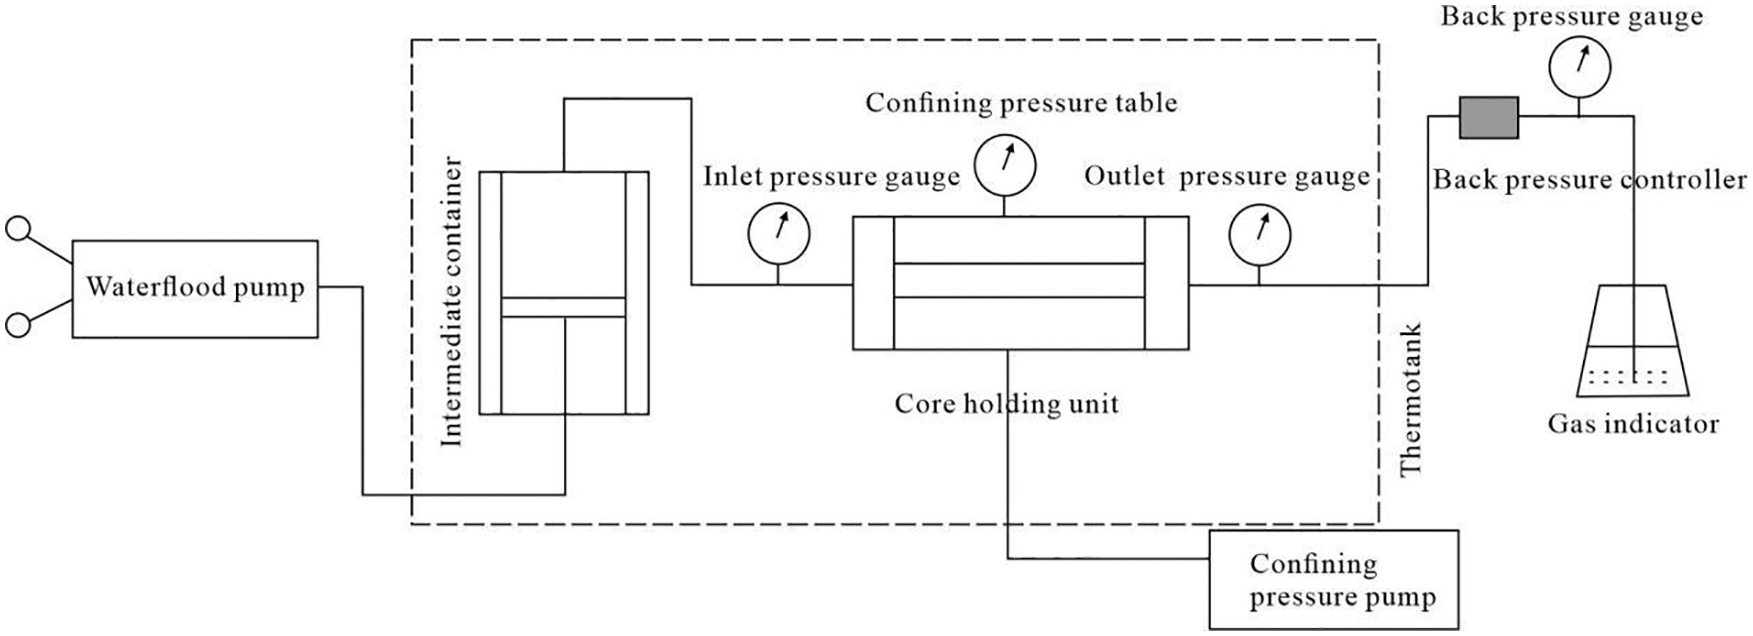
Figure 2: Flow chart of stress-sensitive test experiment
① Put the Core Lab into the Core Lab holder to prepare for the experiment;
② Keep the confining pressure 5 MPa higher than the internal pressure before the test, and let the confining pressure, internal pressure, and back pressure (Core Lab outlet pressure) all rise to the designed pressure value at the same time, so that the confining pressure is equivalent to the overlying strata pressure and the internal pressure is equivalent to the formation pressure (fluid pressure). The back pressure is reduced during the test to create a pressure difference between the internal pressure and the Core Lab outlet. The permeability under variable internal pressure was measured by measuring the pressure difference and flow rate. Gradually lowering the internal pressure and outlet pressure of Core Lab (i.e., increasing the effective overburden pressure of the gas reservoir) could determine the stress sensitivity of Core Lab when lowering the internal pressure; then gradually increasing the internal pressure and outlet pressure of Core Lab could determine the recovery degree of rock permeability when raising the internal pressure (i.e., reducing the pressure of overlying strata). In this manner, the stress sensitivity was measured repeatedly while increasing and decreasing the pressure.
The Core Lab did not produce irreducible water. The permeability of Core Lab was tested using single-phase fluid flow. During the experiment, the thermostat was set to the required temperature (158°C). The actual overburden pressure of the Core Lab layer was held constant during the test. The same layer’s Core Lab reduced the internal pressure at equal net stress intervals, allowing it to stabilize at each internal pressure point for some time before testing its gas permeability until the internal pressure dropped to 5 MPa. The permeability-related parameters were recorded, such as time T, inlet pressure P1, outlet pressure P2, confining pressure Pw, real-time atmospheric pressure Pa, gas accumulation volume Q over time period T, and so on. The average permeability was calculated using the Darcy formula after testing each point three times.
2.2.3 Experimental Samples and Experimental Conditions
In the experiment, seven rock samples from the Xihu Sag A area were used to test the permeability stress sensitivity curve under real stratum conditions. See Table 3 for basic physical parameters of the experimental matrix Core Lab.

Commercial nitrogen and compound formation water were used as the experimental fluids. The experiment was carried out in the Xihu Sag A area under the conditions of confining pressure of 80–87 MPa and a temperature of 158°C.
Under different net stress changes, Core Lab’s change degree of permeability measured by calculation experiment is as follows:
Dstu—— the change rate of permeability under different net stresses.
Ki—— initial permeability, MD.
Kn—— permeability of core lab, MD.
3.1 Experimental Results of Low-Speed Non-Darcy Seepage
Figs. 3 and 4 depict the distribution and frequency of the starting pressure ranges of horizontal and vertical rock samples in the Xihu Sag A area. The figure shows that the threshold pressure gradients of vertical and horizontal rock samples are between 0–0.04 MPa/cm, 69 percent of horizontal rock samples are between 0–0.01 MPa/cm and 86 percent of vertical rock samples are above this interval, indicating that rock sample threshold pressure gradients are primarily concentrated in the interval of 0–0.01 MPa/cm, with few distributions in other intervals.
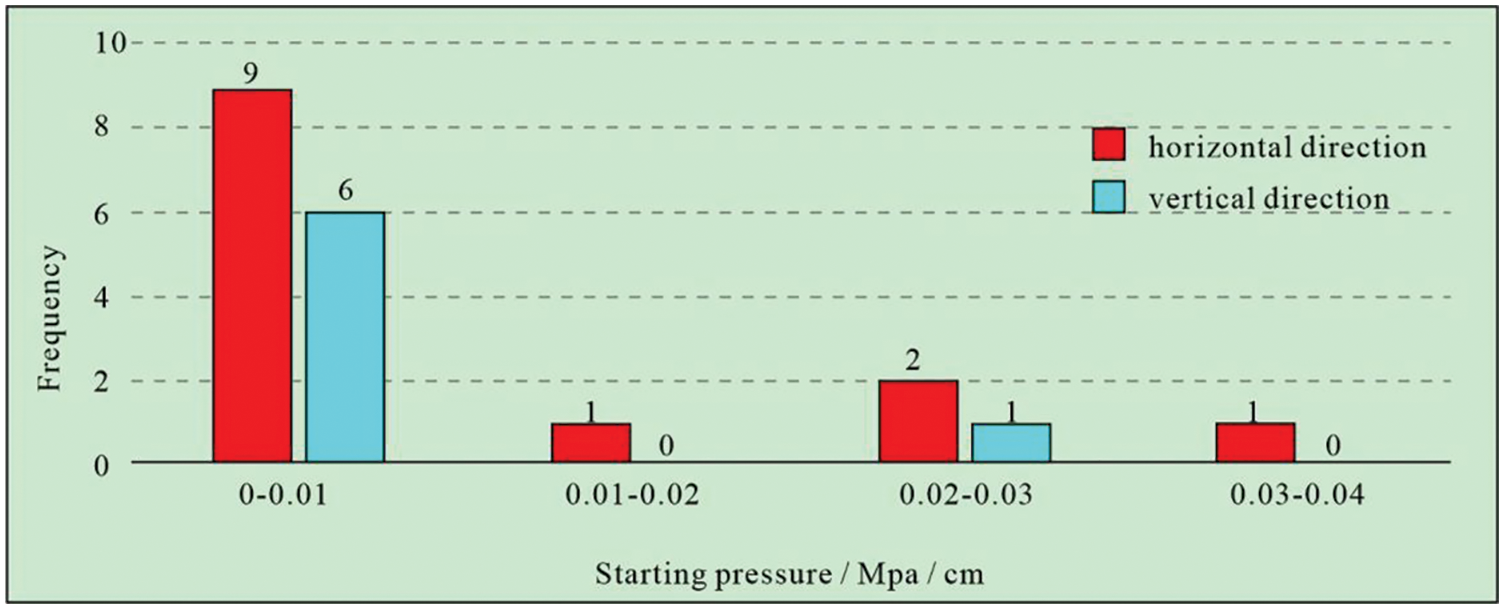
Figure 3: Distribution frequency of different starting pressure ranges of Core Lab
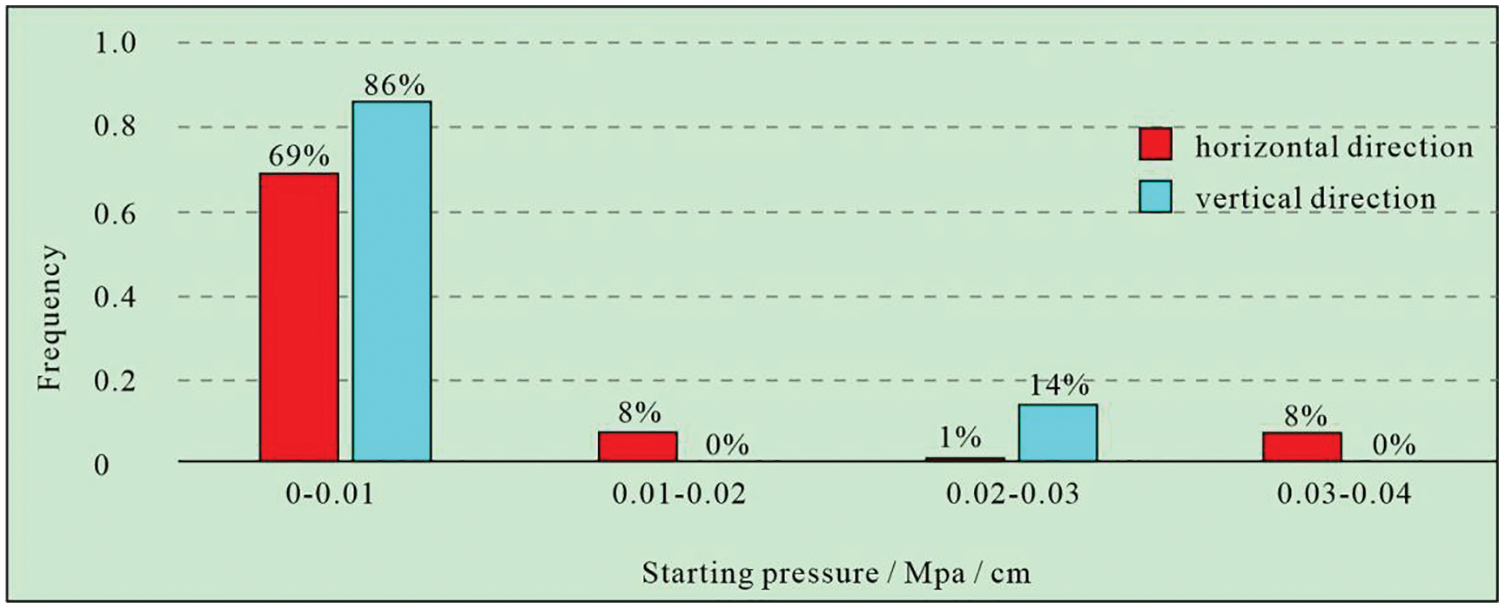
Figure 4: Distribution percentage of different starting pressure ranges of Core Lab
3.2 Stress Sensitive Experimental Results
Core Lab’s stress sensitivity test results in seven blocks of the Xihu Sag, Table 4 shows a gas field with constant confining pressure and variable internal pressure. As the internal pressure of the Core Lab decreases, so does its permeability, and different core labs exhibit different permeability stress sensitivity. Core Lab No. 6 has the highest stress sensitivity of the group. When the internal pressure drops from 31 to 1 MPa, the permeability of Core Lab drops by nearly half. Core Lab No. 2 has the lowest stress sensitivity. When the internal pressure drops from 34.9 to 4.9 MPa, the permeability of Core Lab decreases by less than 20%. The stress sensitivity evaluation standard adopts the evaluation standard put forward by Li Chuanliang in Reservoir Engineering Principles (2nd Edition): when Dstu = 0~0.1, it is weakly sensitive; When Dstu = 0.1~0.3, it is moderately sensitive; When Dstu = 0.3~0.5, it is highly sensitive; When Dstu > 0.5, it is super sensitive. Most Core Lab are moderately stress sensitive.

4.1 Analysis of Influencing Factors of Thick-Layer Low-Permeability Gas Reservoir Threshold Pressure
It is thought that the threshold pressure gradient is caused by the decrease or reduction of the gas seepage channel due to the absorption of water film on the surface of rock papers, and the main reason is that the pore throat with small radius is frequently disconnected after absorbing water film under low driving pressure difference. Permeability, porosity, and water saturation all impact the threshold pressure gradient.
4.1.1 Influence of Permeability on Threshold Pressure Gradient
The threshold pressure gradient of each core in the irreducible water can be calculated by processing the characteristic curve of seepage. The curve of the relationship between the threshold pressure gradient of the ultra-low permeability water-bearing core in the confined water and the absolute permeability of the core can be obtained, as shown in Fig. 5. Fig. 5 shows that when the experimental cores contain water in their irreducible water, the threshold pressure gradient of gas seepage decreases with increasing core permeability.

Figure 5: Curves of threshold pressure gradient and absolute permeability in the Xihu Saga district
4.1.2 Influence of Water Saturation on Threshold Pressure Gradient
The threshold pressure gradient of cores with different permeabilities under different irreducible water saturation can be obtained using the experimental data, and the curve of the relationship between threshold pressure gradient and irreducible water saturation is shown in Fig. 6.

Figure 6: Curves of threshold pressure gradient and irreducible water saturation in the Xihu Saga district
Fig. 6 shows that the threshold pressure gradient increases with increasing water saturation and decreases with decreasing water saturation. It demonstrates that under higher water saturation conditions, the gas must overcome greater seepage resistance before it begins to flow continuously.
4.1.3 Influence of Porosity on Threshold Pressure Gradient
The curve of threshold pressure gradient as a function of porosity can be obtained by analyzing the core experimental data. The curve in the figure shows that the threshold pressure gradient of the gas field in the Xihu Sag A area decreases as the porosity increases (Fig. 7).
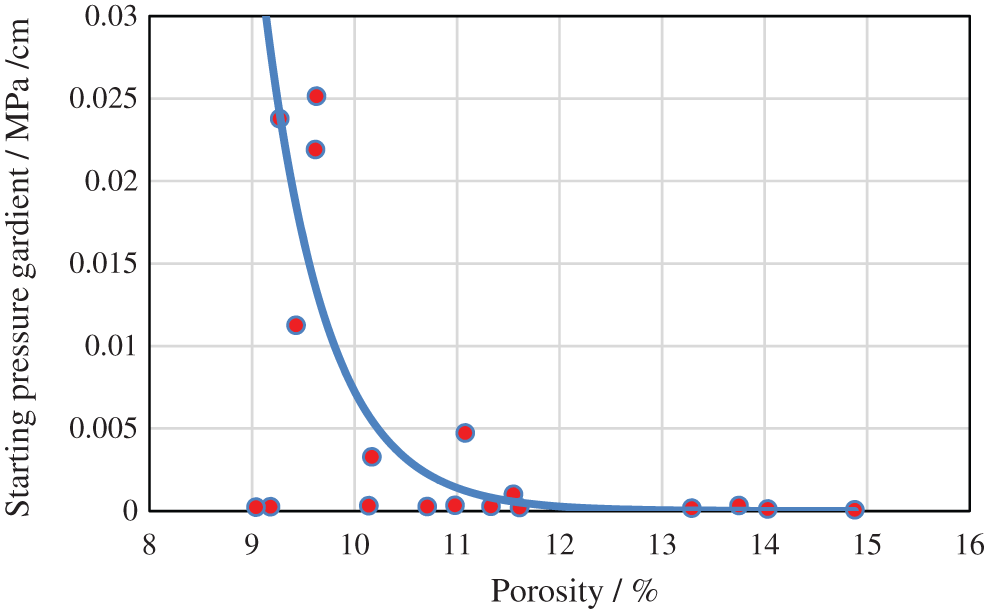
Figure 7: Threshold pressure gradient and porosity curve in the Xihu Saga district
4.2 Analysis of Controlling Factors of Stress Sensitivity of Thick Heterogeneous Low Permeability Reservoir Core
Fig. 8 shows that the stress sensitivity of cores in the same horizon varies greatly. Permeability is generally high, or stress sensitivity is low in the early stages of gas reservoir development.

Figure 8: Comparison of stress sensitivity curves in the Xihu Sag A district
Table 5, Figs. 9 and 10 show that, in the same horizon, as permeability and porosity decrease, the permeability damage rate of the core increases, indicating a trend of increasing stress sensitivity. According to rock physical property analysis, the lower the permeability, the smaller the average throat of a rock sample. The reduction of seepage channel has a greater impact on the smaller throat under the same pressure change, increasing its stress sensitivity.


Figure 9: Core permeability stress sensitivity curve
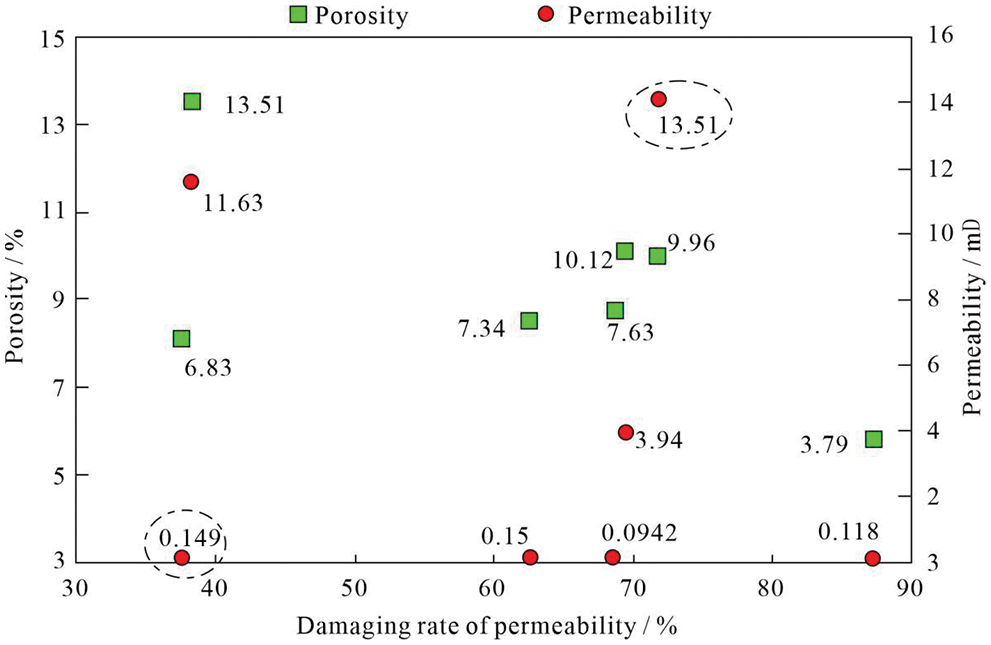
Figure 10: Scatter diagram of a correlation between porosity/permeability and stress sensitivity
In Fig. 10, the negative correlation between porosity and the permeability damage rate is more obvious, and there are two abnormal points in the permeability (the permeability is 0.149 and 13.51 mD, respectively). Analyzing the reasons, the permeability of the entire sample is not only affected by the pore throat, but also affected by the overall heterogeneity and fractures of the sample [29]. When the sample heterogeneity is strong, the extrusion effect first affects the large pore throat, and has little effect on the overall stress sensitivity of the sample. When there are fractures in the sample, the opening of the fracture is easily changed by the extrusion, and the overall stress sensitivity of the sample is strong.
Furthermore, the results of the stress sensitivity experiment show that the No. 1 sample has the highest permeability, and the damage degree of stress sensitivity is up to 71.87 percent. Similarly, the damage degree of stress sensitivity of the No. 5 sample is up to 87.32 percent, which is significantly higher than that of the No. 4 sample, which contradicts conventional wisdom.
Samples No. 2 and No. 5 should be glutenite based on the conglomerate content of the other experimental cores. In general, the factors influencing reservoir stress sensitivity can be classified as internal (rock composition, pore type, cementation mode, Particle sorting, and contact relationship) and external (other factors) (effective stress, pore fluid type and saturation, reservoir temperature). Internal factors that influence and determine reservoir damage include mineral composition, structure, content, and distribution of rock skeleton particles and interstitial materials, as well as pore structure and throat characteristics of rocks. The fillings include various types of cement and other bases, as well as their distribution and occurrence have varying effects on the sensitivity of oil and gas reservoirs. Internal factors determine the strength of reservoir stress sensitivity, and changes in external factors can cause reservoir stress sensitivity. Conglomerate’s interstitial materials are primarily mud-grade fine miscellaneous base, sand-grade coarse miscellaneous base, and silt-grade coarse miscellaneous base, while the cement is primarily carbonate. As a result, glutenite has a low structural maturity, and the pore space with gravel as the skeleton is completely or partially filled with sandpapers. In contrast, the pores composed of sand particles are filled with clay matrix, resulting in a complex bimodal or multimodal structure. As a result, as the gas reservoir pressure decreases and the effective stress gradually increases, the interstitial material between the stressed conglomerates in glutenite will quickly fall off from the skeleton particles, disperse, and migrate, blocking the pore throat and forming strong stress sensitivity damage.
(1) Permeability, porosity, and water saturation all influence the threshold pressure gradient of low permeability gas reservoirs in thick layers. The threshold pressure gradient of gas seepage is positively correlated with water saturation and negatively correlated with permeability and porosity.
(2) The cores in the same layer of thick low-permeability gas reservoirs have great differences in stress sensitivity. Permeability is generally high, or stress sensitivity is low in the early stages of gas reservoir development.
(3) Internal factors influencing and determining reservoir damage include mineral composition, structure, content, distribution, pore structure, and throat characteristics of reservoir rock skeleton particles and interstitial materials. In sand conglomerates, especially the more sparsely filled parts, as gas reservoir pressure decreases and effective stress gradually increases, the interstitial materials among the stressed conglomerates will quickly fall off from the skeleton particles, disperse, and migrate, blocking the pore throat and forming strong stress sensitivity damage.
Funding Statement: The research was carried out at the National Natural Science Foundation of China (Nos. 41672129, U19B200129), http://www.nsfc.gov.cn/ and the National Science and technology Major Projects of China (No. 2016ZX05027-004).
Conflicts of Interest: The authors declare that they have no conflicts of interest to report regarding the present study.
References
1. Fan, W., Sun, L. J., Qiao, G. A., Zhao, X. L., Chen, D. L. (2001). Research on gas flow property and starting pressure phenomenon. Natural Gas Industry, 21(1), 82–84. [Google Scholar]
2. Bennion, D. B., Thomas, F. B. (2005). Formation damage issues impacting the productivity of low permeability, low initial water saturation gas producing formations. Journal of Energy Resources Technology, 127(3), 240–247. DOI 10.1115/1.1937420. [Google Scholar] [CrossRef]
3. Burrows, L. C., Haeri, F., Cvetic, P., Sanguinito, S., Shi, F. et al. (2020). A literature review of CO2, natural gas, and water-based fluids for enhanced oil recovery in unconventional reservoirs. Energy & Fuels, 34(5), 5331–5380. DOI 10.1021/acs.energyfuels.9b03658. [Google Scholar] [CrossRef]
4. Yong, H. (2010). Experimental test analysis of the threshold pressure in tight sandstone gas flow: A case study of the Sulige Gas Field. Natural Gas Industry, 30(11), 48–50+119. [Google Scholar]
5. Almisned, O. A., Al-Quraishi, A. A., Al-Awad, M. N. (2017). Effect of triaxial in situ stresses and heterogeneities on absolute permeability of laminated rocks. Journal of Petroleum Science and Engineering, 7(2), 311–316. [Google Scholar]
6. Zheng, J., Dai, L., Xue, Y. C. (2015). An experimental study on starting pressure gradient of low permeability reservoirs on offshore field. Xinjiang Oil & Gas, 11(4), 31–35+2–3. [Google Scholar]
7. Luo, T., Qu, H., Wang, B., Luo, T. (2018). Experimental on the stress sensitivity and the influence factor of upper paleozoic reservoir in East Ordos Basin. Unconventional Oil & Gas, 5(2), 71–78. [Google Scholar]
8. Min, Y. I., Guo, P., Sun, L. T. (2007). An experimental study on relative permeability curve for unsteady—State gas displacement by water. Natural Gas Industry, 27(10), 92–94. [Google Scholar]
9. Zhao, Z. X., Wu, S. B., He, M. W., Fan, Y. J. (2022). Effect of saline sedimentary environment on pore throats of shale. Frontiers in Earth Science, 10, 974441. DOI 10.3389/feart.2022.974441. [Google Scholar] [CrossRef]
10. Al-Wardy W., Zimmerman R. W. (2004). Effective stress law for the permeability of clay-rich sandstones. Journal of Geophysical Research: Solid Earth, 109(B4). DOI 10.1029/2003jb002836. [Google Scholar] [CrossRef]
11. Atapour, H., Mortazavi, A. (2018). The influence of mean grain size on unconfined compressive strength of weakly consolidated reservoir sandstones. Journal of Petroleum Science and Engineering, 171, 63–70. DOI 10.1016/j.petrol.2018.07.029. [Google Scholar] [CrossRef]
12. Tian, L., Xiao, C., Gu, D. (2014). A shale gas reservoir productivity model considering stress sensitivity and non-Darcy flow. Natural Gas Industry, 34(12), 70–75. [Google Scholar]
13. Li, M. J., Ma, Y. X., Li, H. D., Ma, W. H. (2014). Stress sensitivity experiment of offshore abnormal high pressure low permeability gasreservoir. Drling & Production Technology, 37(1), 88–90. [Google Scholar]
14. Song, F. Q., Song, X. X., Long, Y. Q., Huang, X. H., Zhu, W. Y. (2019). Characteristics of starting pressure of gas flow in fractured shaleporous media under irreducible water condition. Chinese Journal of Hydrodynamics, 34(3), 317–322. [Google Scholar]
15. Bakhtiari, H. A., Moosavi, A., Kazemzadeh, E., Goshtasbi, K., Esfahani, M. R. (2011). The effect of rock types on pore volume compressibility of limestone and dolomite samples. Geopersia, 1(1), 37–82. DOI 10.22059/jgeope. [Google Scholar] [CrossRef]
16. Huang, X. L., Li, J. Q., Lei, D. S., Qi, Z. L., Yue, X. L. (2014). Influence of stress sensitivity on gas well productivity for low permeability. Fault—Block Oil & Gas Field, 21(6), 786–789. [Google Scholar]
17. David, C., Wong, T., Zhu, W., Zhang, J. X. (1994). Laboratory measurement of compaction-induced permeability change in porous rocks: Implications for the generation and maintenance of pore pressure excess in the crust. Pure and Applied Geophysics, 143(1–3), 425–456. DOI 10.1007/BF00874337. [Google Scholar] [CrossRef]
18. Blöcher, G., Reinsch, T., Hassanzadegan, A., Milsch, H., Zimmermann, G. (2014). Direct and indirect laboratory measurements of poroelastic properties of two consolidated sandstones. International Journal of Rock Mechanics and Mining Sciences, 67(4), 191–201. DOI 10.1016/j.ijrmms.2013.08.033. [Google Scholar] [CrossRef]
19. Standardization Committee for Oil and Gas Field Development. Formation damage evaluation by flow test. SYT5358 (2010). Beijing: Petroleum lndustry Press, pp. 15–18. https://std.samr.gov.cn/hb/search/stdHBDetailed?id=8B1827F22F99BB19E05397BE0A0AB44A [Google Scholar]
20. Gao, T., Guo, X., Liu, J., Li, H. T., Xie, C. et al. (2014). Stress sensitivity experiment for ultra—Low permeability core. Petroleum Geology and Development in Daqing, 33(4), 87–90. [Google Scholar]
21. Liu, X., Hu, Y., Li, N., Zhu, B. (2007). Experimental study and analysis of the special percolation mechanism in low permeability sandstone gas reservoir. Special Oil & Gas Reservoirs, 33(4), 87–90. [Google Scholar]
22. Blunt, M. J. (2001). Flow in porous media—Pore-network models and multiphase flow. Current Opinion in Colloid & Interface Science, 6(3), 197–207. DOI 10.1016/S1359-0294(01)00084-X. [Google Scholar] [CrossRef]
23. Fang, J. L., Guo, P., Xiao, X. J., Du, J. F., Dong, C. et al. (2015). Gas-water relative permeability measurement of high temperature and high pressure tight gas reservoirs. Petroleum Exploration & Development, 42(1), 92–96. DOI 10.1016/S1876-3804(15)60010-6. [Google Scholar] [CrossRef]
24. Xin, F., Wang, Z., Bing, Z., Feng, X., Li, N. et al. (2010). Characteristics of single phase gas seepage in sandstone gas reservoirs with low-permeability and high water saturation in the sixth member of the Xujiahe Formation, Guang’an Gas Field. Natural Gas Industry, 30(7), 39–41. [Google Scholar]
25. Gobran, B. D., Brigham, W. E., Ramey, J. (1987). Absolute permeability as a function of confining pressure, pore pressure, and temperature. SPE Formation Evaluation, 2(1), 77–84. DOI 10.2118/10156-PA. [Google Scholar] [CrossRef]
26. Zeng, F., Dong, C. M., Lin, C. Y., Wu, Y. Q., Tian, S. S. et al. (2021). Analyzing the effects of multi-scale pore systems on reservoir Properties—A case study on Xihu Depression, East China Sea Shelf Basin, China. Journal of Petroleum Science and Engineering, 203(1), 108609. DOI 10.1016/j.petrol.2021.108609. [Google Scholar] [CrossRef]
27. Wang, W., Pan, S., Li, S., Gao, X. (2016). Physical simulation of high-pressure and low-pressure multilayer production of tight gas reservoir. Unconventional Oil & Gas, 3(2), 59–64. [Google Scholar]
28. Sallam, M. A., El-Banbi, A. H. (2018). Analysis of multi-layered commingled and compartmentalized gas reservoirs. Journal of Petroleum Exploration & Production Technology, 8, 1–14. DOI 10.1007/s13202-018-0454-3. [Google Scholar] [CrossRef]
29. Song, F. Q., Song, X. X. (2019). Characteristics of starting pressure of gas flow in fractured shaleporous media under irreducible water condition. Chinese Journal of Hydrodynamics, 34(3), 317–322. [Google Scholar]
Cite This Article
 Copyright © 2023 The Author(s). Published by Tech Science Press.
This work is licensed under a Creative Commons Attribution 4.0 International License , which permits unrestricted use, distribution, and reproduction in any medium, provided the original work is properly cited.


 Submit a Paper
 Propose a Special lssue
 View Full Text
 Download PDF
 Downloads
 Citation Tools