
 Submit a Paper
 Propose a Special lssue
 Open Access
ARTICLE

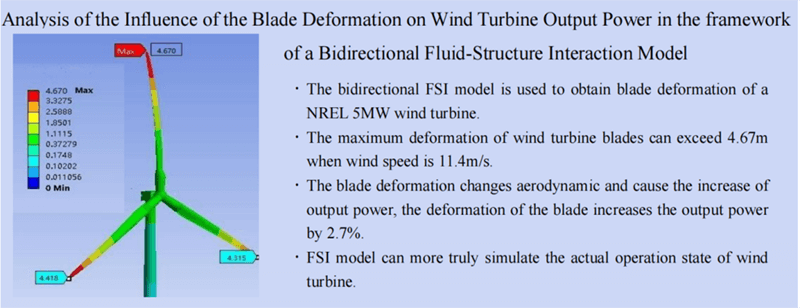
Analysis of the Influence of the Blade Deformation on Wind Turbine Output Power in the Framework of a Bidirectional Fluid-Structure Interaction Model
1 CHN Energy United Power Technology Co., Ltd., Beijing, 100036, China
2 School of Energy and Power Engineering, Shandong University, Jinan, 250061, China
3 School of Renewable Energy, North China Electric Power University, Beijing, 102206, China
* Corresponding Author: Zhenggang Liu. Email:
Fluid Dynamics & Materials Processing 2023, 19(5), 1129-1141. https://doi.org/10.32604/fdmp.2023.023538
Received 30 April 2022; Accepted 26 July 2022; Issue published 30 November 2022
 View Full Text
 Download PDF
Abstract
The blades of large-scale wind turbines can obviously deform during operation, and such a deformation can affect the wind turbine’s output power to a certain extent. In order to shed some light on this phenomenon, for which limited information is available in the literature, a bidirectional fluid-structure interaction (FSI) numerical model is employed in this work. In particular, a 5 MW large-scale wind turbine designed by the National Renewable Energy Laboratory (NREL) of the United States is considered as a testbed. The research results show that blades’ deformation can increase the wind turbine’s output power by 135 kW at rated working conditions. Compared with the outcomes of the simulations conducted using the model with no blade deformation, the results obtained with the FSI model are closer to the experimental data. It is concluded that the bidirectional FSI model can replicate the working conditions of wind turbines with great fidelity, thereby providing an effective method for wind turbine design and optimization.Graphic Abstract
Keywords
As a pollution-free renewable energy technology, wind power generation has developed rapidly in recent years. Hence, the wind turbines have gradually developed into large-scale structures themselves, and the diameter of wind turbine blades and output power gradually increased too. For example, the large wind turbine designed by the National Renewable Energy Laboratory (NREL) of the United States can reach a diameter of 126 m, and output power can reach 5 MW [1].
The numerical simulation method based on Computational Fluid Dynamics (CFD) was widely used to research the aerodynamics characteristic of wind turbines. Frulla et al. [2] simulated the flow field and relative rotation between the air and wind turbine with Moving Reference Frame (MRF) method. Regodeseves et al. [3] studied the unsteady flow around an experimental horizontal axis by CFD simulations. They researched the effects of the nacelle, wind tower, and blade rotation on the induction region and near wake. Wang et al. [4] improved the output power of wind turbines and the optimized local twist angles of the blades based on numerical simulation. Abdelsalam et al. [5] obtained the working characteristics of wind turbines with twisted Savonius blades by numerical simulation. They discussed the effects of blade attachment angle and radius ratio on the operating characteristics of wind turbines. Burgos Tafur et al. [6] discussed the rotational augmentation effects of a large wind turbine utilizing CFD technology. These studies analyzed the aerodynamic characteristics of wind turbines and optimized the wind turbine based on numerical simulation, but the deformation of wind turbine blades is not considered.
When the wind turbine is running, the blade can deform under the action of rotational centrifugal force, aerodynamic force, and other loads. Further, the deformations of the blade also can affect the aerodynamic performance and the output power of the wind turbine. So, it is necessary to employ the bidirectional fluid-structure interaction (FSI) model to analyze the operational characteristics of the wind turbine. Pawar et al. [7] analyzed mechanical and thermo-mechanical characteristics of wind turbine blades made by granite powder-filled polymer composites with the FSI model. Boujleben et al. [8] proposed an FSI numerical model to represent the large overall motion of wind turbines with flexible blades. Johnson et al. [9] proposed an adaptable projection-based method to superimpose complex ice configurations onto a baseline structure and provided an efficient methodology to include ice accretion in the high-fidelity geometric shell analysis of a realistic wind turbine blade. Nakhchi et al. [10] investigated the aerodynamic performance of the horizontal-axis wind turbine blades by considering the flap-wise oscillations with the direct numerical simulations method. They analyzed the details of flow structure by considering the realistic behavior of the wind turbine blade structure with natural vibration frequencies. Santo et al. [11] studied wind turbine blades’ dynamic load and stress through the unidirectional FSI model. Zhu et al. [12] calculated the stress and strain of wind turbine blades with a unidirectional FSI model. Wiegard et al. [13] employed the FSI model to analyze the wind turbine blades’ elastic deformation and stress characteristics. Bazilevs et al. [14] simulated the flow field around the wind turbine by employing the FSI method and predicted the fatigue damage of the wind turbine blade. Santo et al. [15] analyzed the effect of a wind gust impacting the blades of a large horizontal-axis wind turbine by employing a high-fidelity FSI model. Boujleben et al. [16] proposed an efficient computational model for the FSI problems corresponding to the steady-state flow representing a large overall motion of wind turbines with flexible blades. Macphee et al. [17] studied the flexible and rigid blades of the horizontal axis wind turbine by employing the experimental and FSI methods. Wang et al. [18] applied the fluid-structure coupling method to analyze the deformation and stress of the wind turbine blade. Lee et al. [19] have studied the structural response of the NREL Phase VI turbine at seven wind speed cases. Dose et al. [20] established an in-house framework for FSI numerical simulations and an NREL phase VI wind turbine with two different tower concepts was simulated by the FSI model. Dai et al. [21] established the aeroelastic modeling of Tjreborg wind turbine blades based on the FSI model. They analyzed aeroelastic performance of the Tjreborg wind turbine under yaw angles of 10°, 30°, and 60°. The focus of these researches is to analyze the deformation stress and vibration of the blades; the influence of blade deformation on the working characteristics and output power of the wind turbine is less concerned.
In this study, the bidirectional FSI model is used to analyze the operational characteristics of the NREL 5 MW large-scale wind turbine. The flow field around the wind turbine and the deformations of the wind turbine blades under different wind speeds are obtained by the FSI model, and the influence of the blade deformation on the output power of the wind turbine is also analyzed. The research results of this paper can provide a reference and basis for the design and safe operation of large-scale wind turbines.
The bidirectional FSI model is used for the numerical simulation. The turbulent model is used to obtain the velocity and pressure distributions of the flow field, and the finite element model (FEM) model is adopted to calculate the stress and deformations of the structure domain, the interaction between structural deformation and the flow field is analyzed simultaneously.
2.1 The Numerical Model of CFD
The SST k-ω turbulence model is employed for the numerical simulation in the fluid domain. SST k-ω model combines the advantages of k-ω model and k-ε model, the k-ω model is used near the wall, and the standard k-ε model is used in the fully developed turbulent region. The SST k-ω turbulence model is represented by the following equations:
(1) Continuity equation:
(2) Momentum equation:
(3) k equation:
(4) ω equation:
In the above equations, u is the velocity component in a certain direction, p is the pressure, ρ is the density, Fi is the sum of external forces in a certain direction, k is the turbulent flow energy, and ω is the specific dissipation rate. Further, μ is the viscosity of the fluid, μt is the turbulent viscosity, σk and σω are the turbulent Prandtl numbers of the k and ω equations, respectively. Gk represents the turbulent energy generated by the velocity gradient, Yk and Yω represent the diffusion terms of k and ω, respectively. Gω is a coefficient related to ω, whereas Dω represents the orthogonal diffusion term. τij is the stress tensor that can be obtained by the following equation:
Sij is the deformation rate tensor, and δij is the kerodiler function. SST k-ω model applies k-ω model in the area near the wall and the standard k-ε model in the area far away from the wall. Gω, Yω, and Dω are calculated by the next equations:
F1 is the mixing function. The SST k-ω model becomes the k-ω model when F1 = 1 and becomes the k-ε model when F1 = 0. α1, α2, β1, β2 and σω,2 are coefficients used to calculated Gω, Yω and Dω.
2.2 The Numerical Model of Structure
The finite element analysis model is adopted to simulate the stress and deformation of the structure. After the mesh is generated, the displacement vector of the node is solved by the linear equations given as:
where {F} is the force vectors caused by the wind loads and the rotating centrifugal force, [K] is the stiffness matrix of structure, and {δ} is the displacement vectors of all mesh nodes. [K] is formed by the superposition of all the mesh stiffness matrices as:
where [B] is the geometric matrix of mesh element, and [D] is the elasticity matrix of mesh element, which is determined by the material of wind turbine blade. When the boundary conditions, constraint conditions, and the force acting on the structure are known, the stress and deformation of the structure can be obtained.
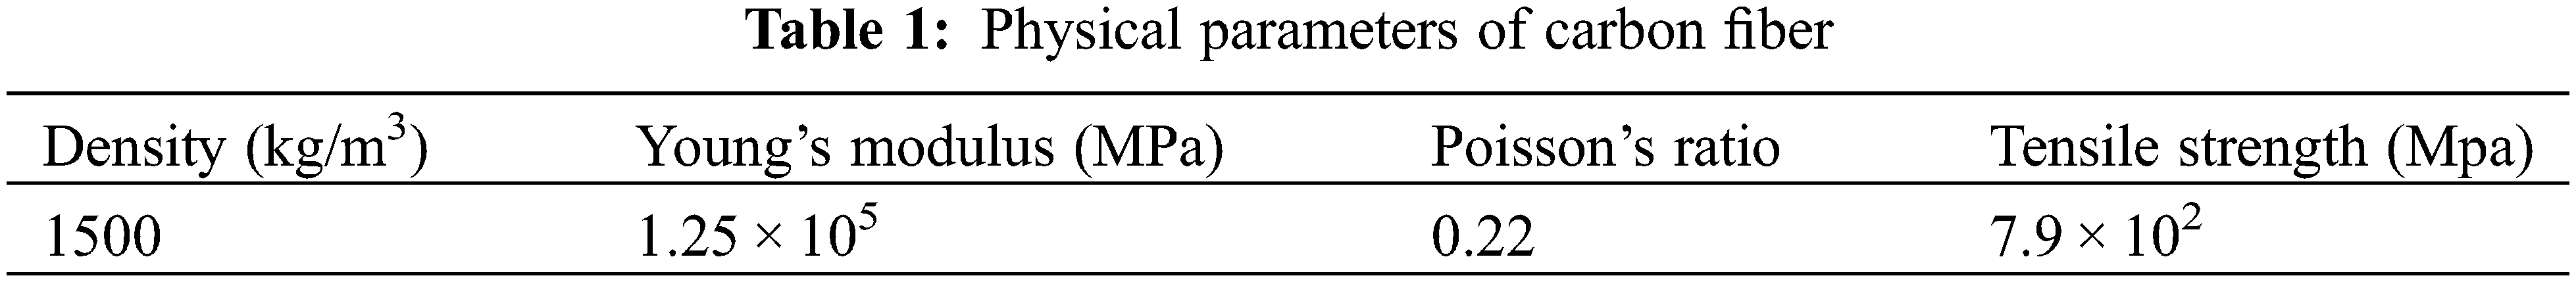
The blade of the wind turbine is made from carbon fiber, and the main physical parameters of the carbon fiber are listed in Table 1.
2.3 The Solving Steps of FSI Model
Using the weak coupling method to finish the numerical simulation of the FSI model, Fig. 1 shows the solution steps of the FSI model.
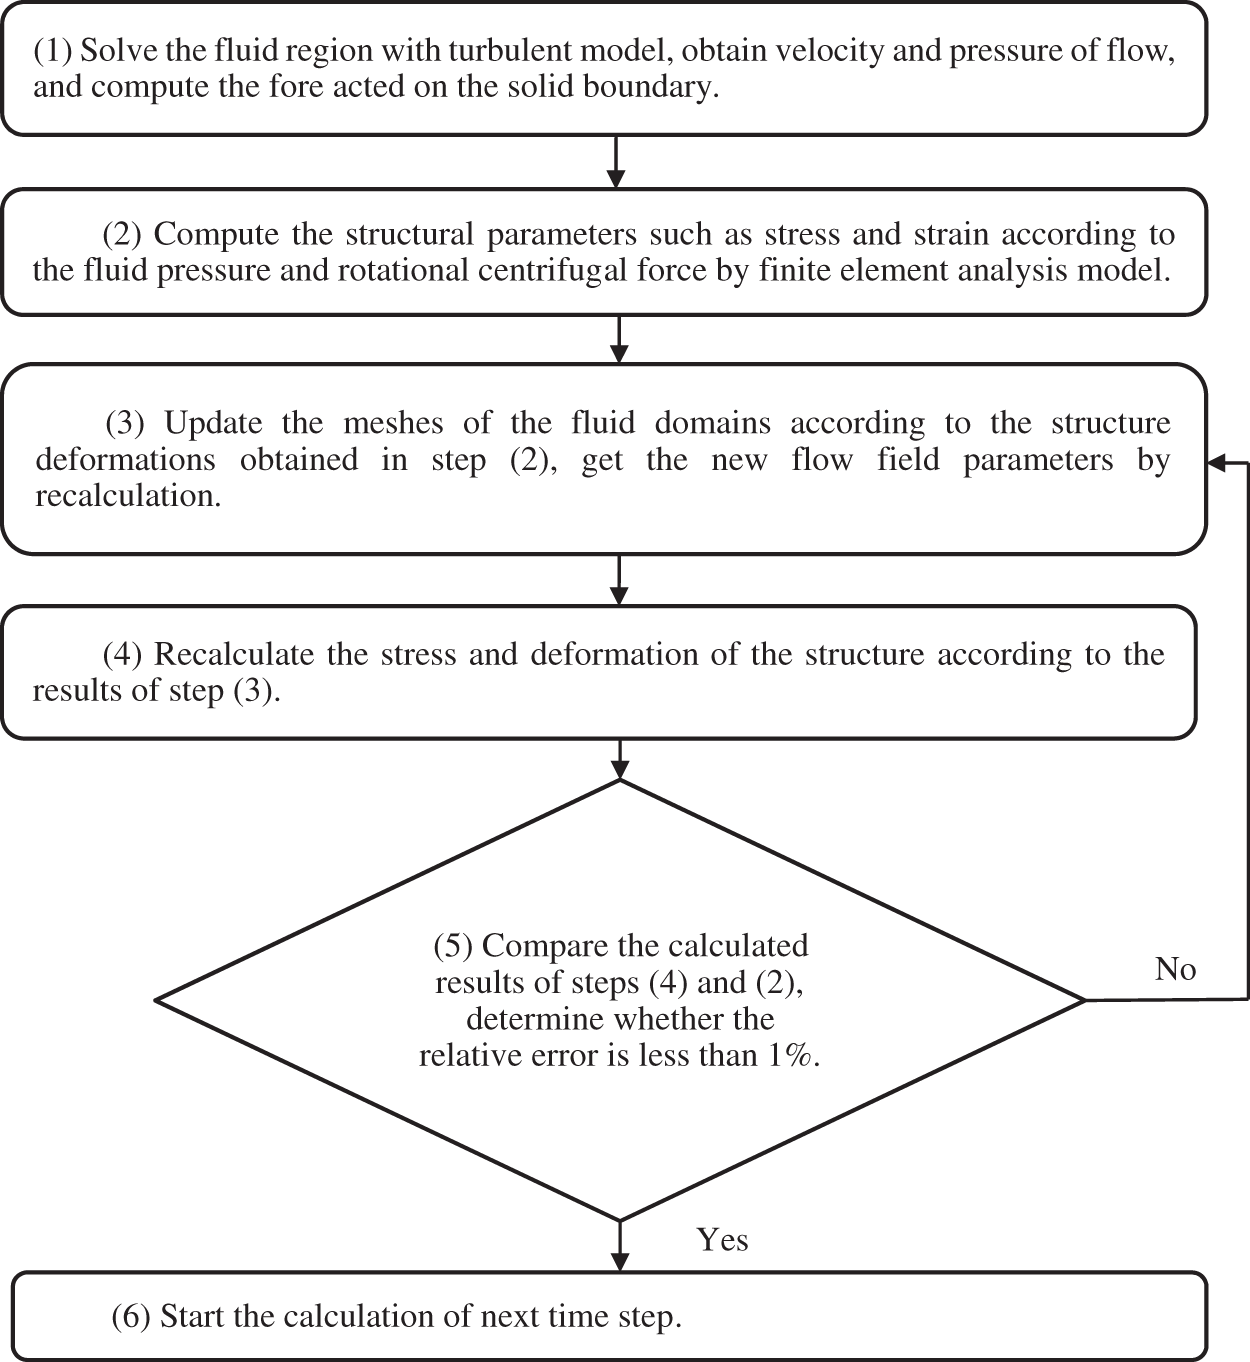
Figure 1: The solution steps of the FSI model
3 The Domain and Meshes of Numerical Simulation
3.1 The Model of the Wind Turbine
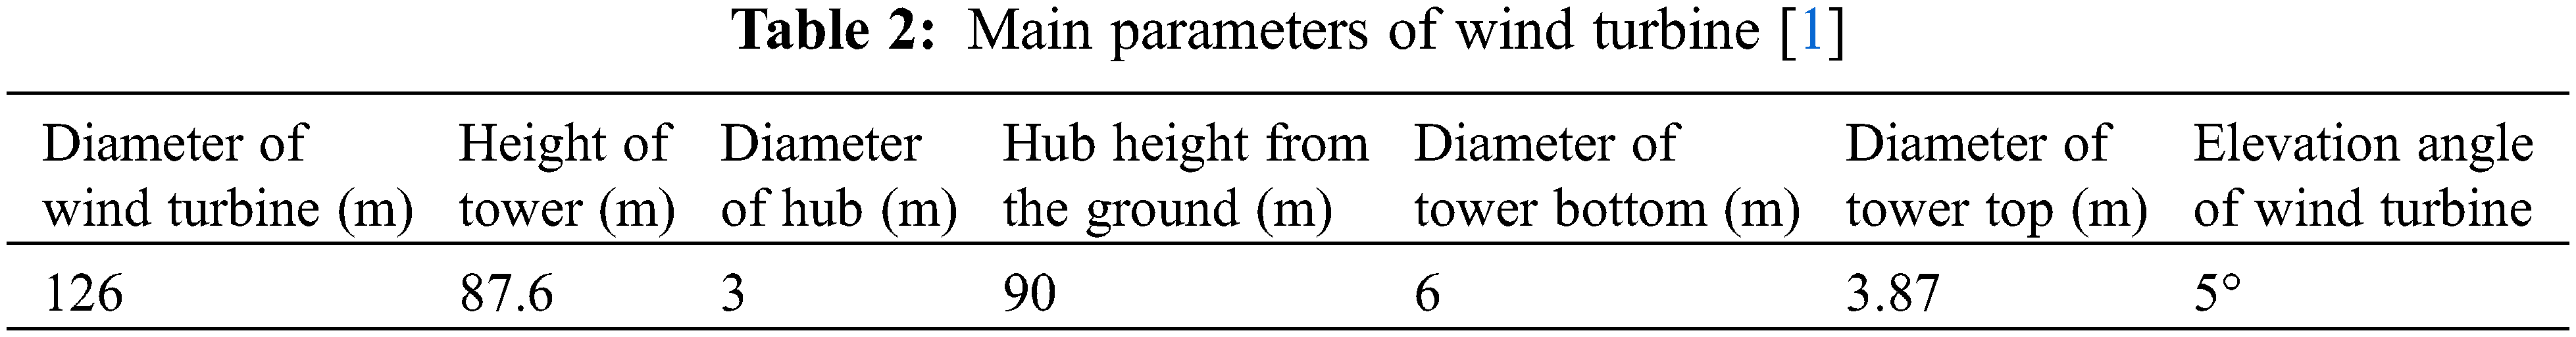
A NREL 5 MW wind turbine is selected as the research object. The rated power is 5 MW, the rated rotating speed is 12.1 rpm, and the rated wind speed is 11.4 m/s. Fig. 2 shows the three-dimensional model of the wind turbine, and Table 2 shows the basic structural parameters of the wind turbine.
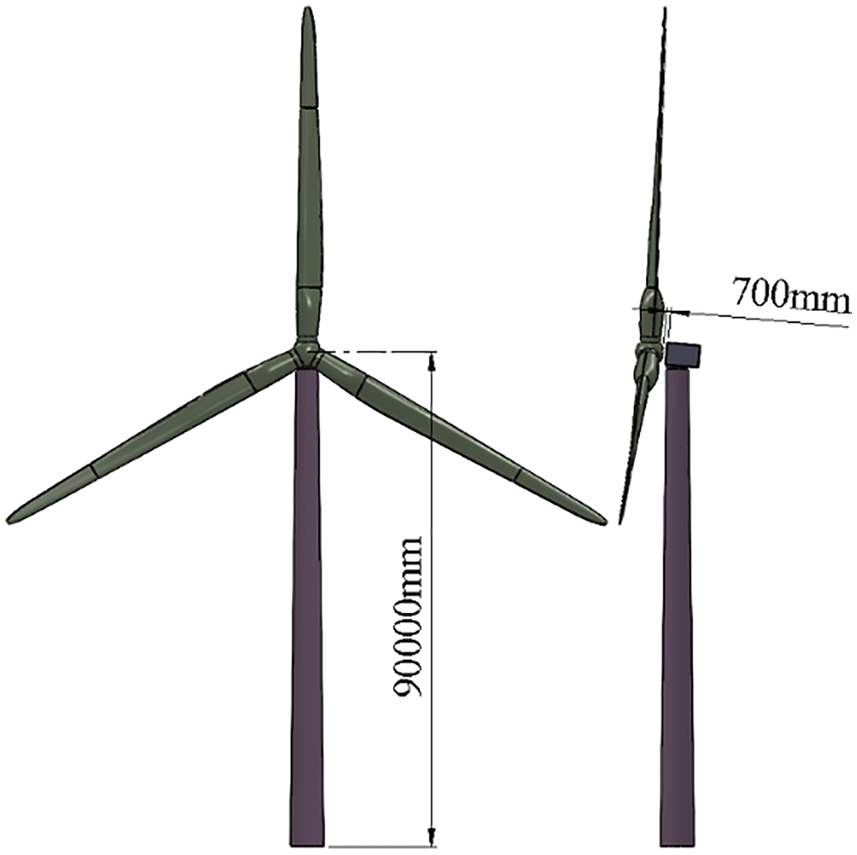
Figure 2: NREL 5 MW wind turbine model
The three-dimensional structure of the blade is shown in Fig. 3, the blade structure is determined by 5 airfoils [1].
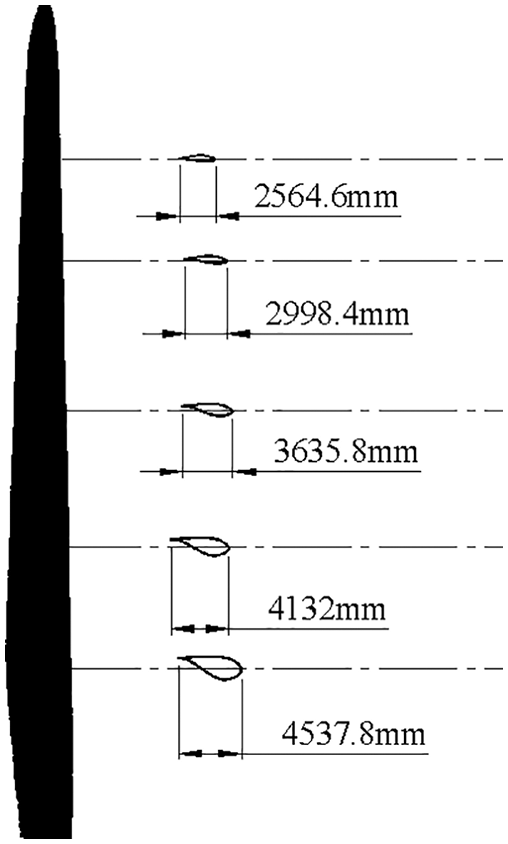
Figure 3: The structure of blade
3.2 The Meshes of the Fluid Domain
The sliding mesh technology is used to deal with the rotation of the blades in the fluid domain. The fluid domain is divided into two parts: the rotating and the fixed domain. The fixed domain is a half-cylinder with a radius of 300 m and a length of 500 m; the rotating domain is a flat cylinder with a radius of 70 m and a length of 8 m. The length of the fluid domain in front of the wind turbine is 150 m. The rotating domain rotates with the blades, and the flow data are transmitted by interpolation at the interface between the fixed domain and the rotating domain. To improve mesh quality, tetrahedral meshes are used, and the meshes are refined near the blades.
The mesh independence needs to be verified. The flow field around the wind turbine is simulated by the SST k-ω model without considering structure deformation and the output power of the wind turbine can be obtained. Table 3 shows the influence of the mesh number on the numerical simulation results. According to Table 3, while the wind speed is 11.4 m/s, the difference in output power between the meshes number is 16.7 million, and the meshes number is 19.0 million is less than 1%. It shows mesh independence can be realized when the mesh number exceeds 16.7 million. So, 19 million meshes are used to simulate the fluid domain, and Fig. 4 shows the meshes of the fluid domain. The skewness is used to evaluate the mesh quality, the maximum skewness is 0.825, and the average skewness is 0.382, while the number of meshes is 19 million. In Fig. 4, the y+ ≤ 62 when the wind speed is 11.4 m/s, which meets the requirements of the wall function method.
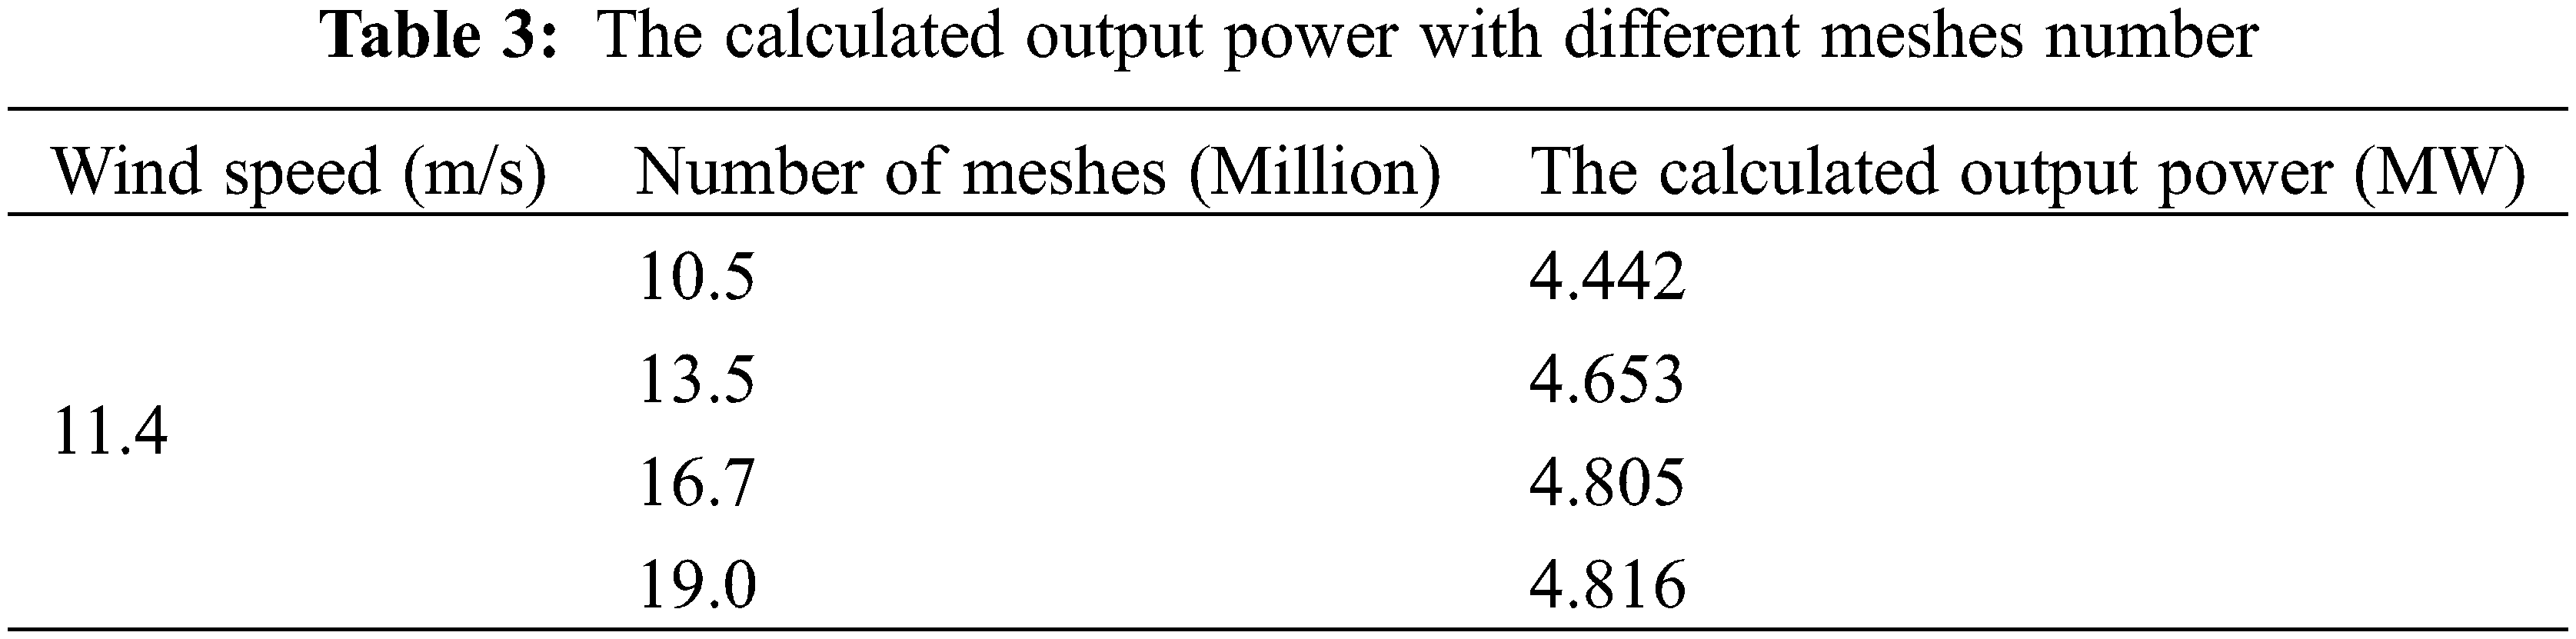
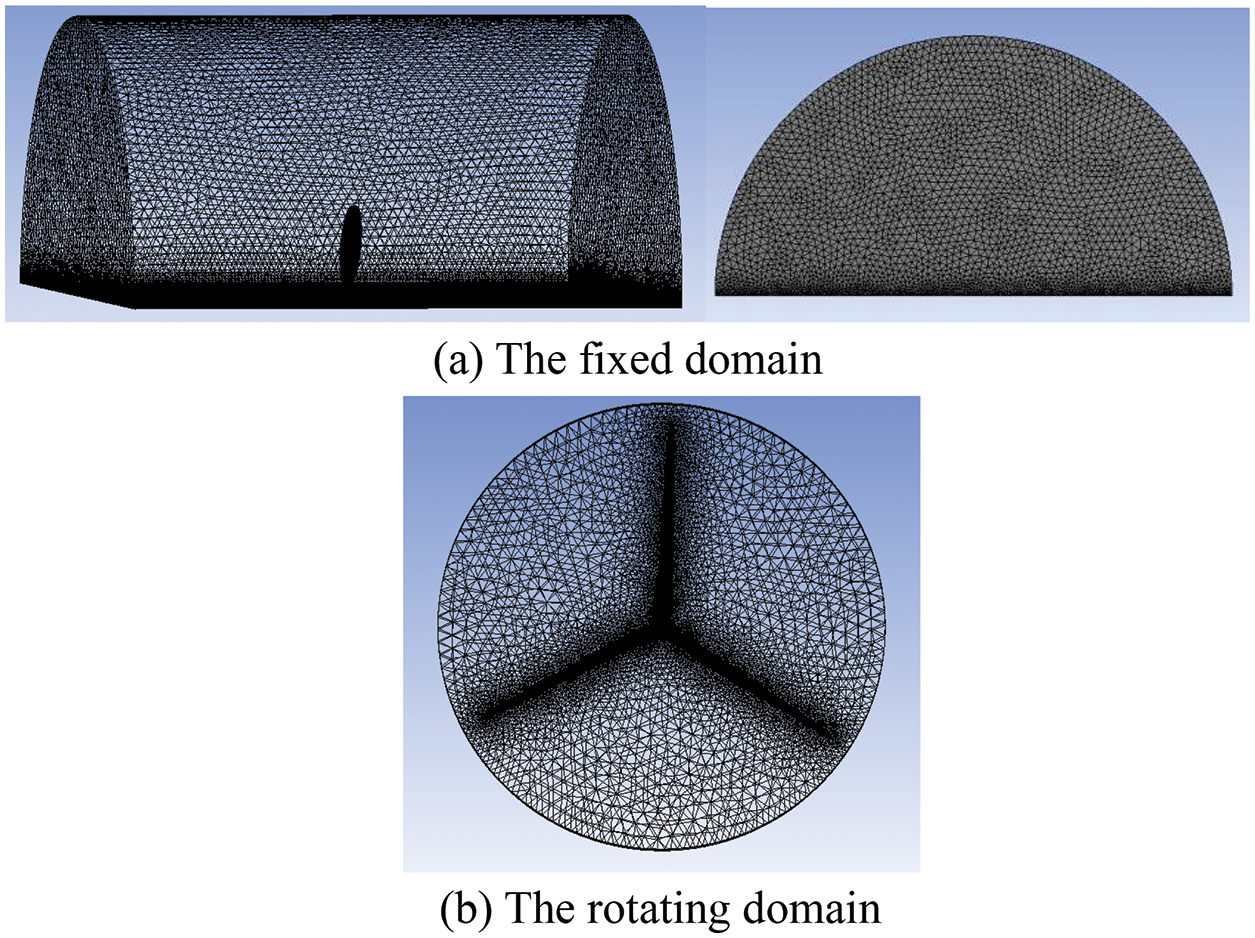
Figure 4: The meshes of fluid domain
3.3 The Meshes of Structure Domain
The blades are selected as the structure domain of the FSI model. Static analysis is used to verify the mesh independence of the structural region; the gravity load and centrifugal force load with 12.1 rpm rotating are applied to the blades of a wind turbine. Table 4 shows the influence of meshes number on calculated results.
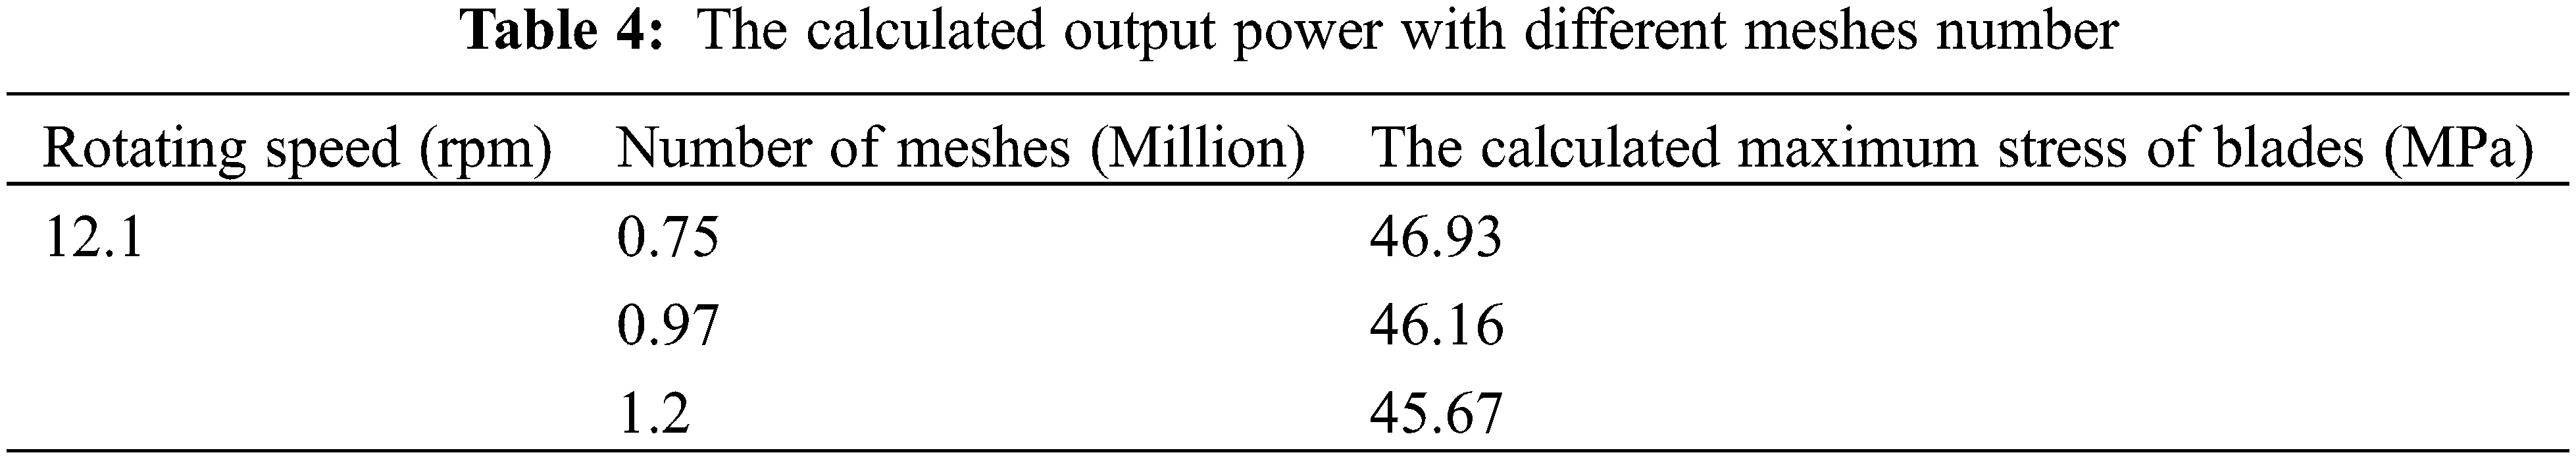
From Table 4, the difference between the calculation results of 0.97 million meshes and 1.2 million meshes is 1.07%, the mesh-independence is realized when meshes number exceed 0.97 million. Finally, the 1.2 million meshes are used in the structural domain. Fig. 5 shows partial meshes of wind turbine blades. The tetrahedral mesh is employed in the structure domain, the maximum skewness is 0.852, and the average skewness is 0.501.
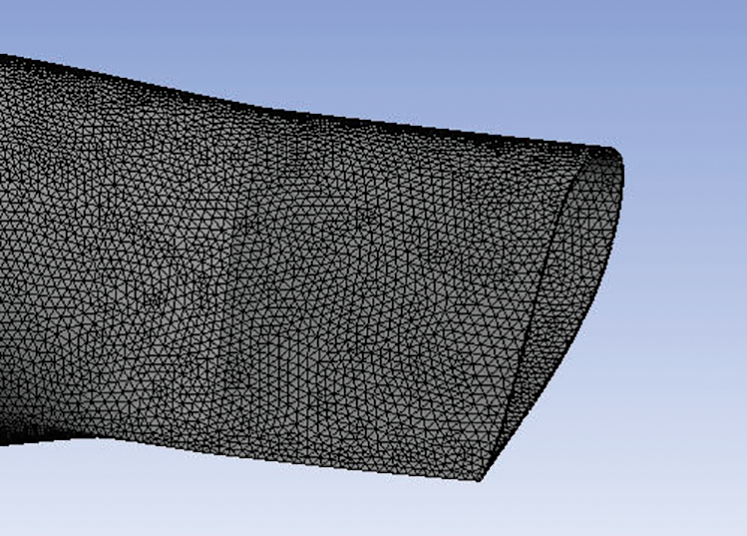
Figure 5: The meshes of blade
4 The Numerical Simulation and Analyses of 5 MW Wind Turbine
4.1 The Boundary and Time Conditions
In order to determine the influence of blades deformation on the performance of wind turbine, the CFD model, without considering the structural deformation and FSI model are used to simulate the operation of wind turbine separately. To maintain consistency, the two models use the same turbulence model and initial meshes in the fluid domain. In the fluid domain, the left side is set to the velocity-inlet boundary condition, the right side is set to the pressure-outlet boundary condition, the bottom surface is set to the wall boundary, and the semi-cylindrical surface is set to the symmetrical boundary. The rotational speed of the rotational domain is 12.1 rpm, and the blade surfaces are set as the fluid-structure interaction interface for the FSI model; the Wall function method is adopted near the wall.
ANSYS software is used to complete the numerical simulation. The finite volume method is used to discretize the momentum equation, k equation and ω equation, in which the second-order upwind difference scheme is used to deal with the convection term and the central difference scheme is adopted to discretize the diffusion term. The SIMPLE algorithm is used for pressure-velocity coupling.
The unsteady method is used for numerical simulation and second-order implicit time stepping scheme is used to discretize the temporal term. The implicit time step scheme has excellent time stability, and there is no strict requirement for the setting of time step size [22]. So, the time step is selected as 0.013774 s, i.e., the time of the blade rotating 1°. The iteration number of each time step is 800 and 720-time steps are calculated, the wind turbine rotates two turns during the numerical simulation, and the data of second turns are used to study the performance of wind turbines.
4.2 The Deformation of the Blades
The deformation of the wind turbine blade is simulated for four wind speeds of 3, 5, 8, and 11.4 m/s by the FSI model. The simulation results show that the maximum deformation is located at the blade tip. Due to the influence of the tower shadow effect, the deformation of the blade fluctuates periodically. Fig. 6 shows the variation of the deformation at the blade tip with the rotation angle of the blade while the wind speed is 11.4 m/s. From Fig. 6, the blade deformation decreases slightly when the blade coincides with the tower.
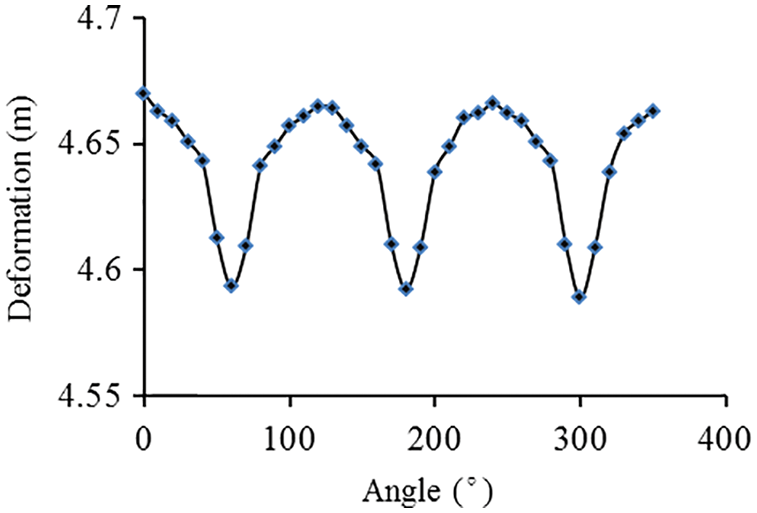
Figure 6: The influence of tower shadow effect on deformation
Fig. 7 shows the maximum deformation of the blade under different wind speeds; from Fig. 7, the blades are deformed greatly under the wind load and centrifugal force, the main deformation occurs in the downwind direction. With the increase in wind speed, the blade deformation gradually increases. The maximum deformation is 4.67 m at a rated wind speed of 11.4 m/s, 3.676 m at the wind speed of 10 m/s, and 2.272 m at the wind speed of 8 m/s. With the increase of the blade height, the linear velocity of the blade increases, and the thickness of the blade decreases gradually. Hence, the deformation is nonlinear. Fig. 8 shows the deformation along with the blade height as the wind speed is 11.4 m/s; according to Fig. 8, the deformation is more pronounced in the regions closer to the blade tip, and deformation near the hub is almost insignificant.
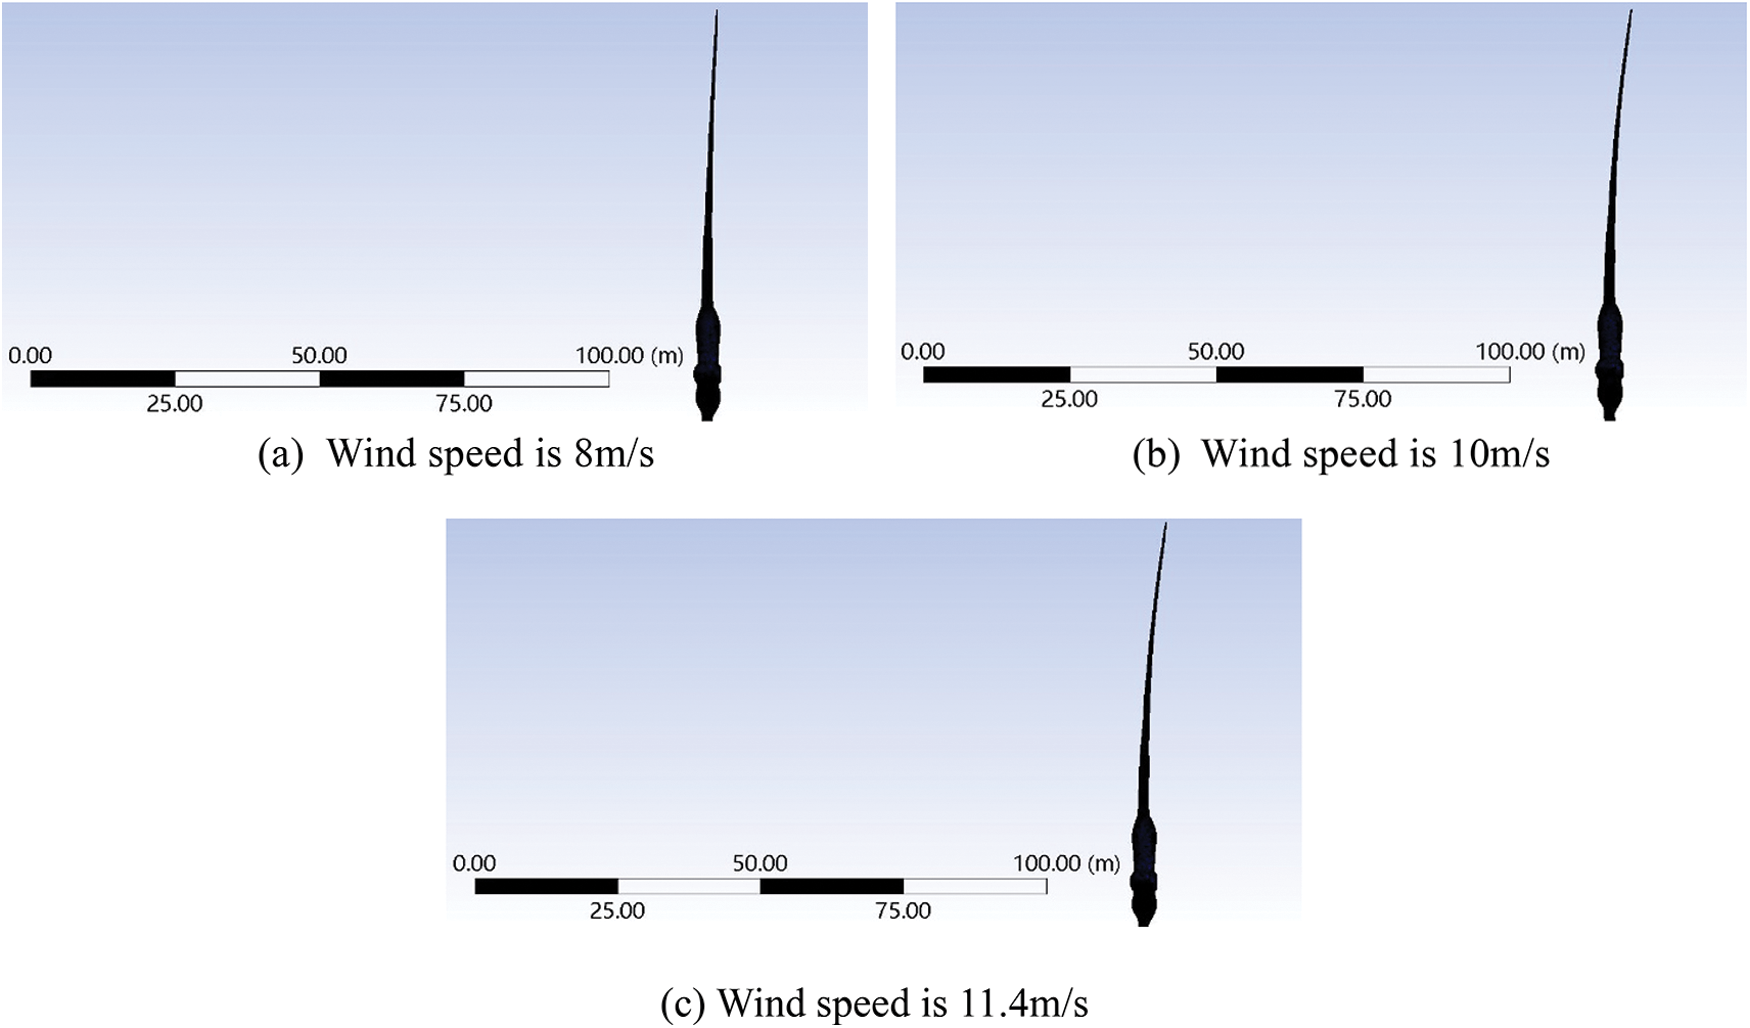
Figure 7: The deformation of blade
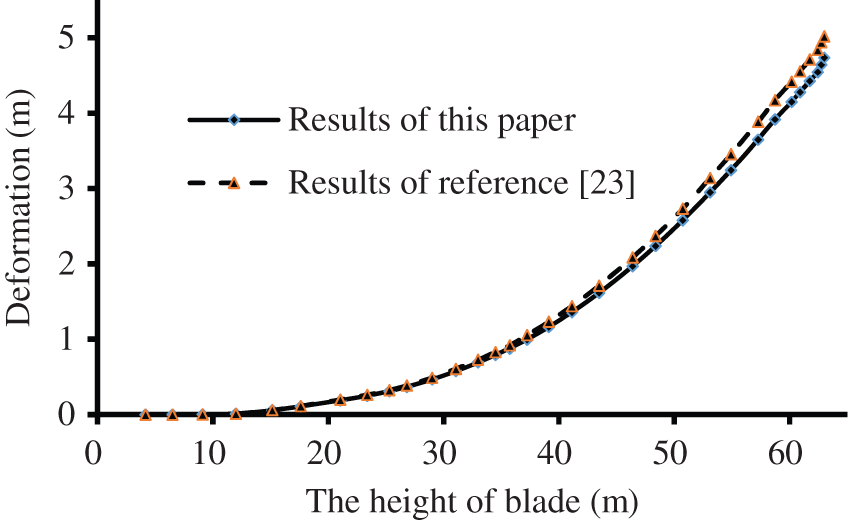
Figure 8: The deformation along with blade height
Zhang [23] also obtained the deformation of 5 MW NREL wind turbine blade by FSI model. Fig. 8 also shows the deformation gotten by reference [23]. According to Fig. 8, the results in this paper are consistent with the results in reference [23], and the maximum error between them is 5.7%, which confirms the correctness of the simulation results in this paper.
4.3 The Influence of Blades Deformation on the Output Power
According to simulation results, the blades have a large deformation when the wind turbine is running; the large blade deformation can affect the aerodynamic characteristics and power output of the wind turbine.
Fig. 9 shows the variation of wind turbine power with blade rotation angle while wind speed is 11.4 m/s. Similar to Fig. 6, due to the influence of the tower shadow effect, the power changes periodically also. When the blade coincides with the tower, the power reaches the minimum value. The output power of the wind turbine can be obtained by averaging the power shown in Fig. 9.
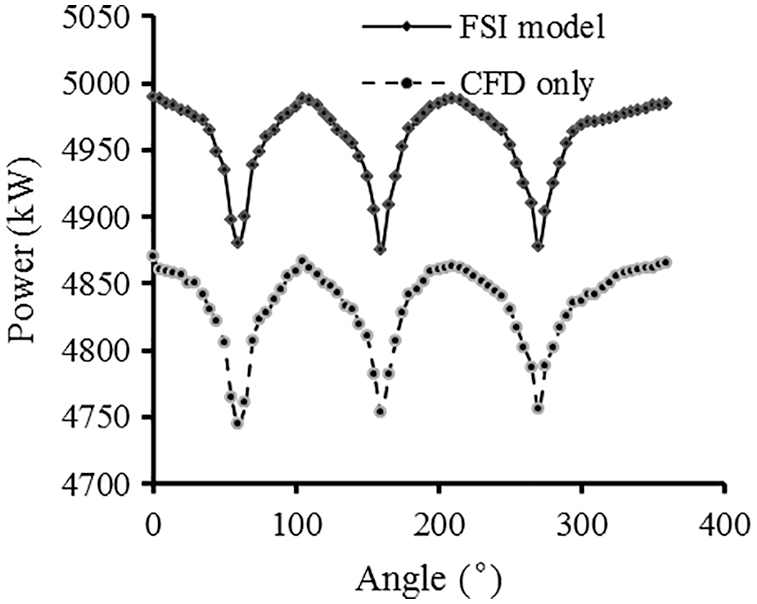
Figure 9: The influence of tower shadow effect on power
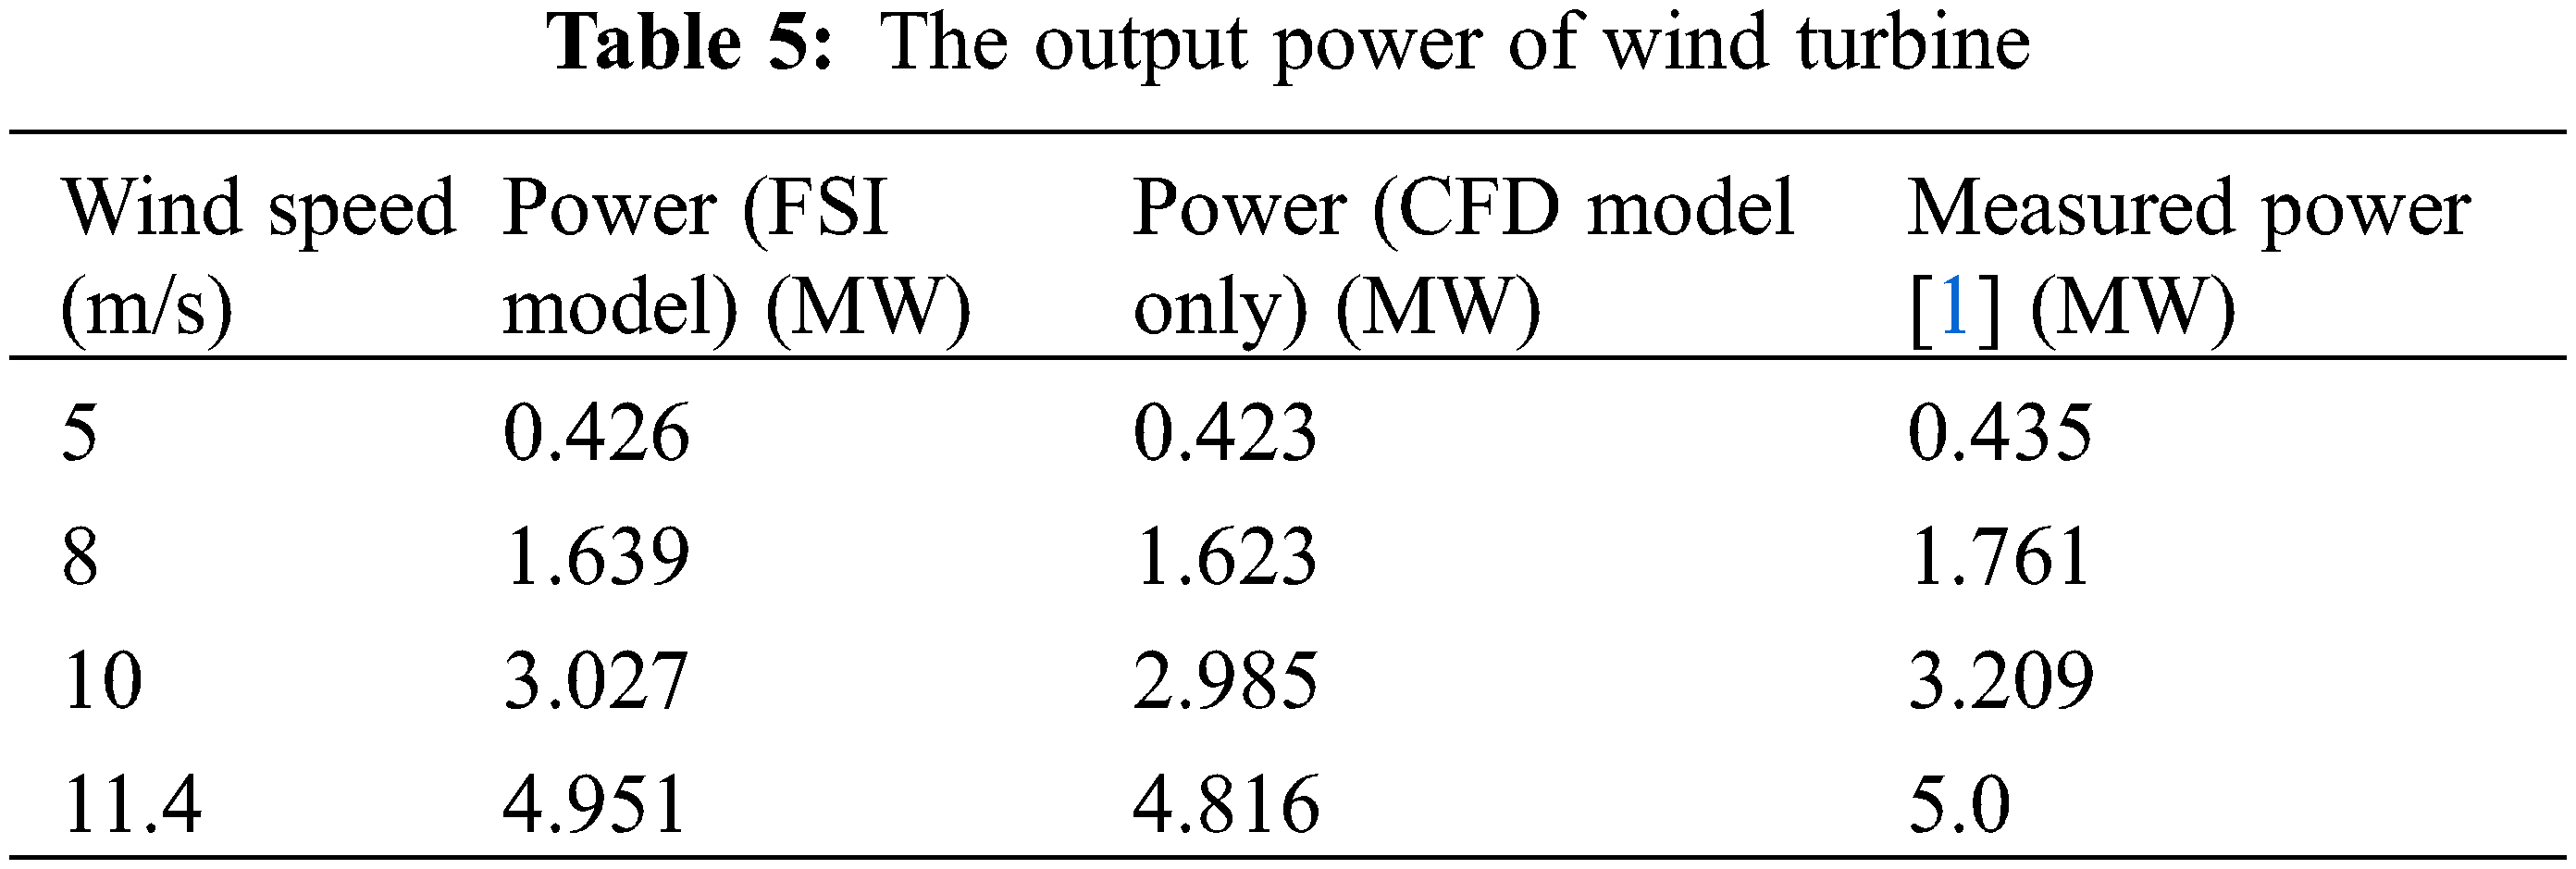
Table 5 lists the values of the output power obtained from the simulation and the comparison with the measured value of the wind turbine. The results show that when the wind speed is less than 8 m/s, the result obtained by the FSI model is very close to the result obtained by the model that blade deformation is not considered, and the variation between them is about 1%. When the wind speed is greater than 8 m/s, the variation of the results between the two models becomes larger. For the rated wind speed of 11.4 m/s, the output power obtained by the FSI model is 135 kW higher than the result obtained by the CFD model the blade deformation is not considered. The comparison between the simulation results and the measured power of the wind turbine shows that the results obtained by the FSI model are closer to the measured results. At the rated wind speed, the difference between the simulation results obtained by the model without the structural deformation and the measured power of the wind turbine is −3.68%, and the difference between the results obtained by the FSI model and the design power is −0.98%. The results in Table 5 prove the correctness of the FSI model and show that the large deformation of the blade has a marked impact on the wind turbine’s power output. Further, it shows that the FSI model can replicate the working conditions of the wind turbine with more fidelity.
4.4 Stress and Pressure Distribution of Blades
Fig. 10 shows the stress distribution of the blade. From Fig. 10, the area with large stress is mainly concentrated on the pressure surface in the middle of the blade. The maximum stress and strain appear at a blade height of 11.68 m, where the cylindrical part is connected to the blade airfoil. The maximum stress is 123 Mpa, which is lower than the tensile strength of the carbon fiber, and hence satisfies the strength design requirements of the blade.
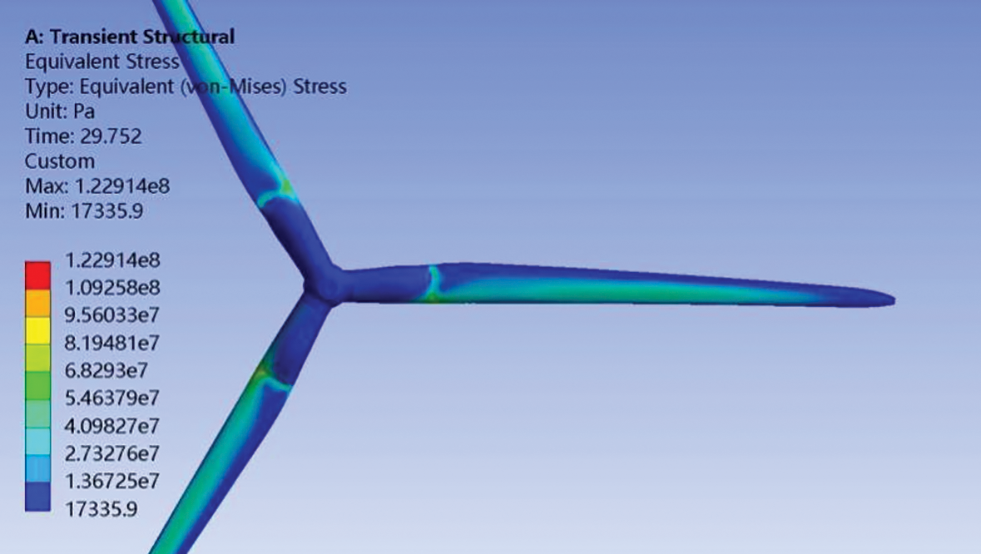
Figure 10: The stress distribution of blade
Fig. 11 shows the pressure distribution contours in the pressure side and suction side obtained from numerical simulation. From Fig. 11, the maximum pressure of the pressure surface obtained by the FSI model is 2832 Pa, and the minimum negative pressure of the suction surface is −5148 Pa; the maximum pressure of the pressure surface obtained only by the CFD model is 3823 Pa, and the minimum negative pressure of the suction surface is −5114 Pa.
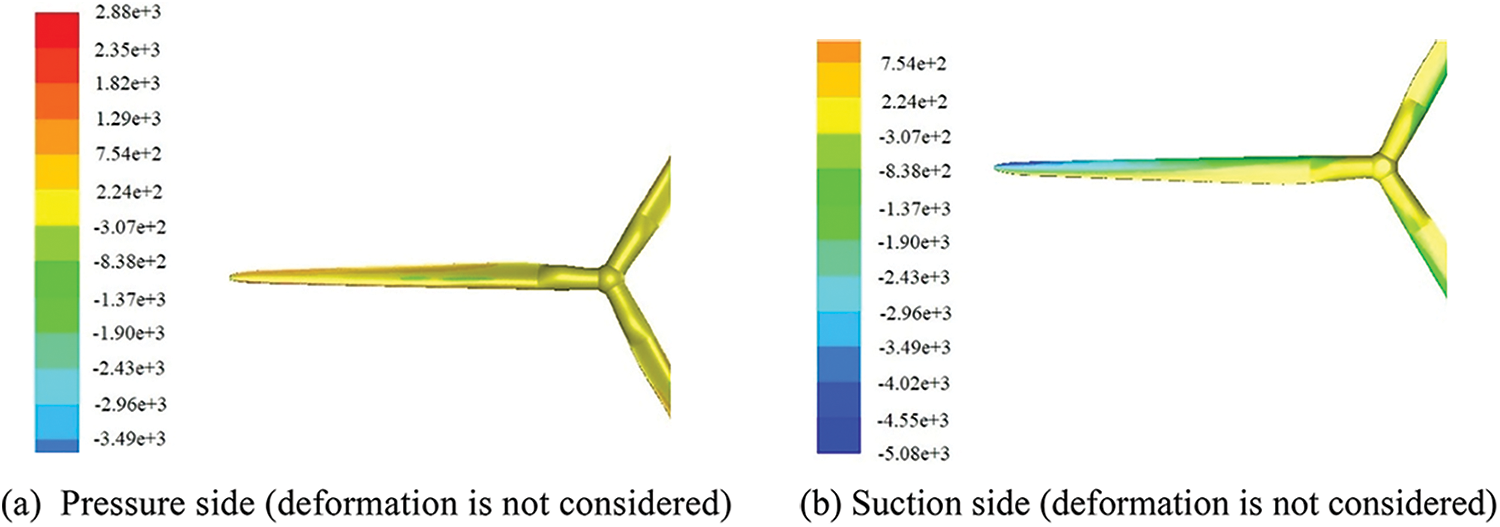
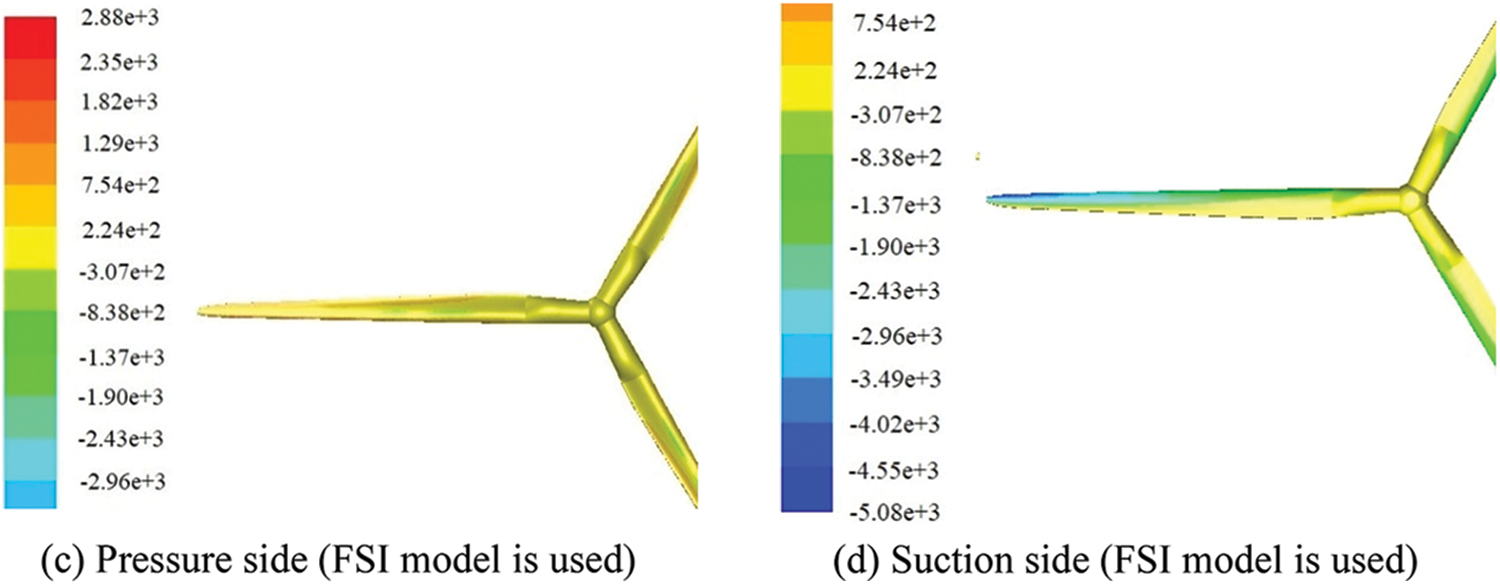
Figure 11: Pressure distribution contours of blade
According to the pressure distribution of the blade surface, the force acted on the wind turbine can be obtained. Table 6 shows the thrust coefficient obtained from the simulation and the thrust coefficient given in reference [1]. From Table 6, the deformation of the blade causes an increase in the thrust coefficient. Table 6 also proves that the thrust coefficient calculated by the FSI model is closer to the measured value.
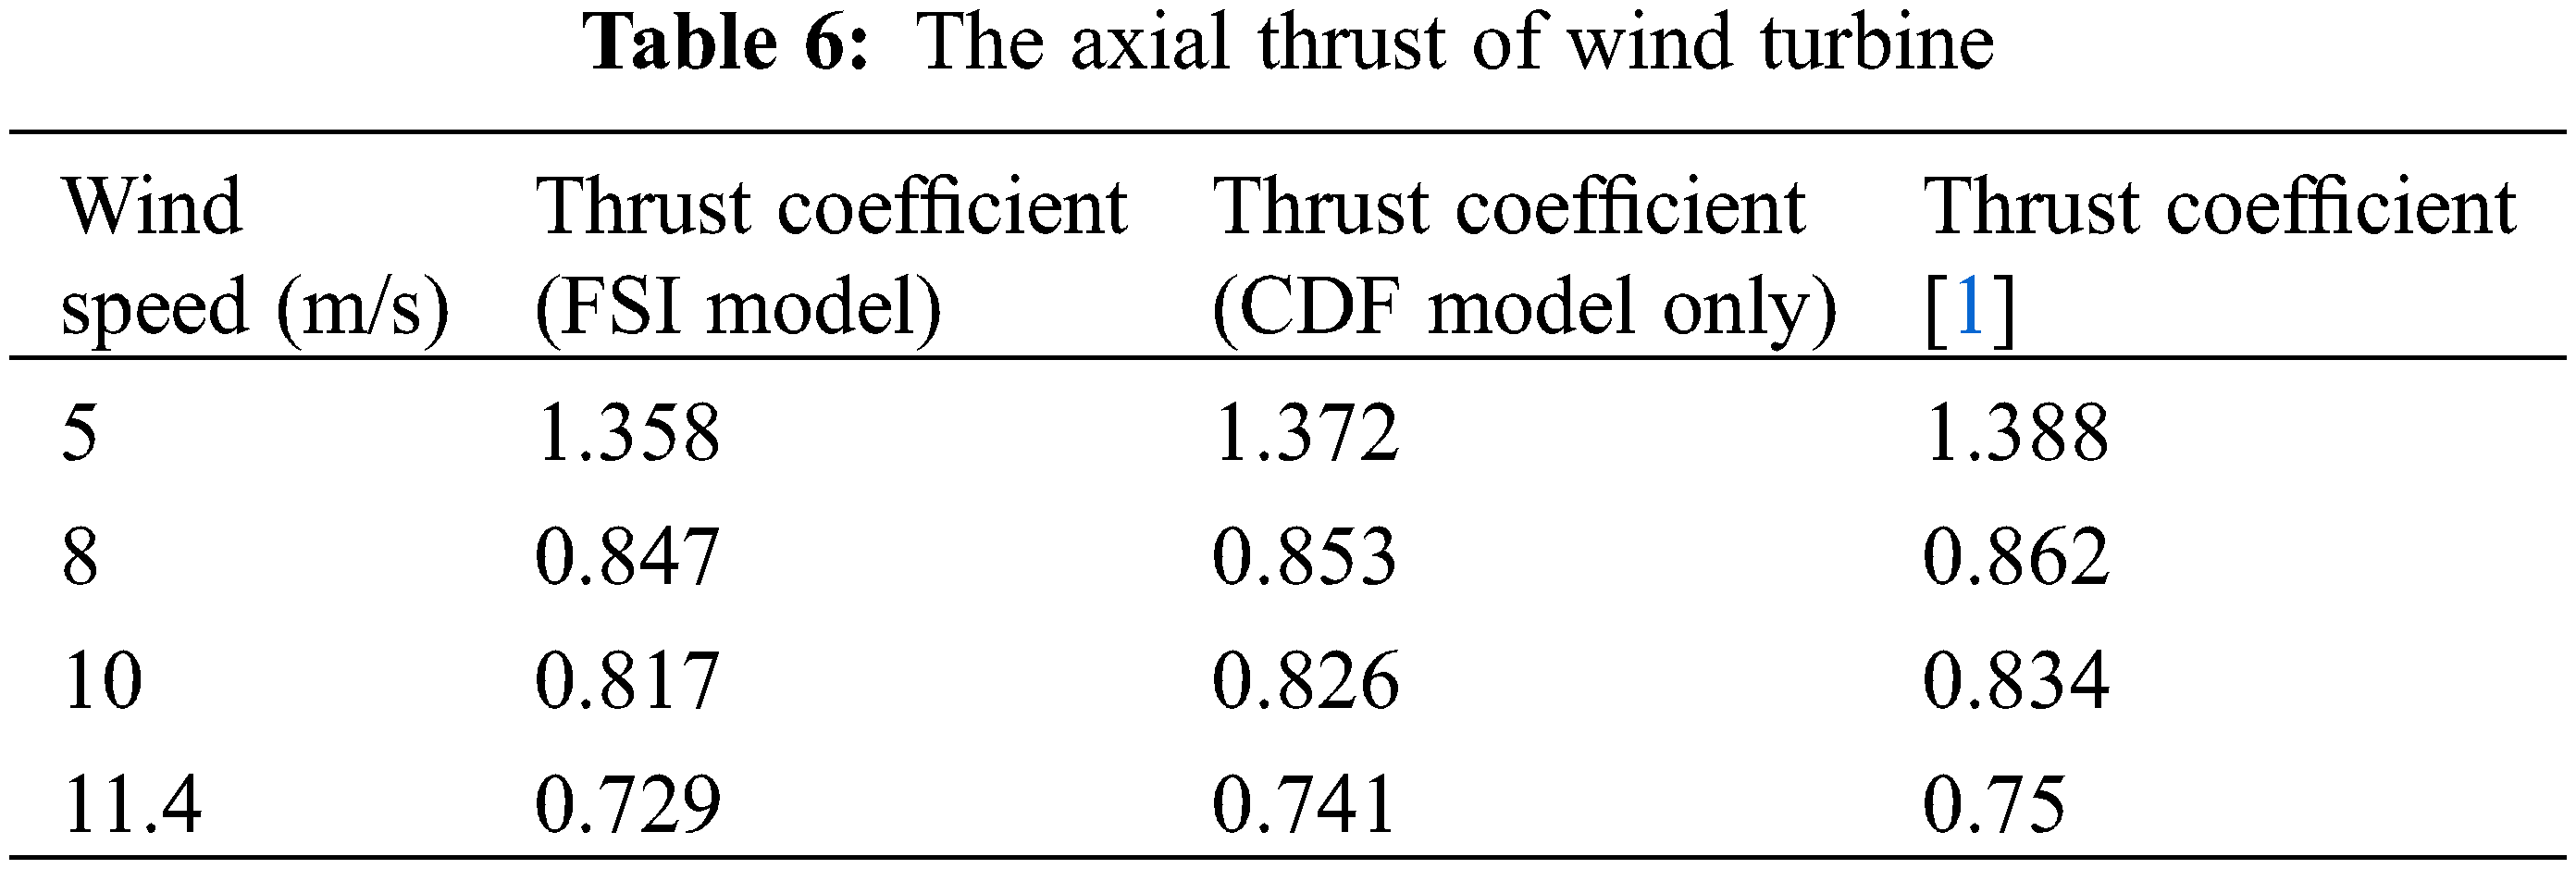
Fig. 11 and Table 6 show the deformation of the blade leads to the increase of the pressure difference between the pressure surface and the suction surface; hence the force acted on the blade and the output power of the wind turbine increases.
The bidirectional FSI model is used to study a large NREL 5 MW wind turbine, the blade deformation, output power, speed, and pressure distribution around the wind have been obtained from the numerical simulation. Henceforth, Therefore, the following conclusions are drawn in this paper:
(1) The deformation of the blade can be calculated accurately by employing the bidirectional fluid-structure coupling model. The deformation of the blade is nonlinear, and the maximum deformation occurs at the blade tip. Underrated conditions, the blade has a large deformation, the maximum deformation is 4.67 m, reaching 7.78% of the blade length.
(2) The large deformation of the blade greatly impacts the wind turbine’s aerodynamic characteristics and power output. Under the rated working condition, the deformation of the blade increases the output power by 2.7%. Following the deformation of the blade, the pressure difference between the pressure surface and the suction surface increases, resulting in the increase of torque in the circumferential direction and power output.
(3) The output power of the wind turbine obtained by the FSI model is closer to the experimental value, which establishes that the FSI model can replicate the working characteristics of the wind turbine with more fidelity. FSI analysis is an important method for the large wind turbine optimization design, which is relevant in important engineering applications.
Funding Statement: This work was supported by the CHN Energy United Power Technology Co., Ltd., China (Contract No. 2020-75).
Conflicts of Interest: The authors declare that they have no conflicts of interest to report regarding the present study.
References
1. Jonkman, J., Butterfield, S., Musial, W., Scott, G. (2009). Definition of a 5 MW reference wind turbine for offshore system development (No. NREL/TP-500-38060). Technical Report/TP-500-38060, National Renewable Energy laboratory, USA. [Google Scholar]
2. Frulla, G., Gili, P., Visone, M., D’Oriano, V., Lappa, M. (2015). A practical engineering approach to the design and manufacturing of a mini kW blade wind turbine: Definition, optimization and CFD analysis. Fluid Dynamics & Materials Processing, 11(3), 257–277. DOI 10.3970/fdmp.2015.011.257. [Google Scholar] [CrossRef]
3. Regodeseves, P. G., Morros, C. S. (2021). Numerical study on the aerodynamics of an experimental wind turbine: Influence of nacelle and tower on the blades and near-wake. Energy Conversion and Management, 237(6–7), 114110. DOI 10.1016/j.enconman.2021.114110. [Google Scholar] [CrossRef]
4. Wang, H., Jiang, X., Chao, Y., Li, Q., Li, M. et al. (2021). Numerical optimization of horizontal-axis wind turbine blades with a surrogate model. Proceedings of the Institution of Mechanical Engineers, Part A: Journal of Power and Energy, 235(5), 1173–1186. DOI 10.1177/0957650920976743. [Google Scholar] [CrossRef]
5. Abdelsalam, A. M., Kotb, M. A., Yousef, K., Sakr, I. M. (2021). Performance study on a modified hybrid wind turbine with twisted savonius blades. Energy Conversion and Management, 241, 114317. DOI 10.1016/j.enconman.2021.114317. [Google Scholar] [CrossRef]
6. Burgos Tafur, B. S., Daniele, E., Stoevesandt, B., Thomas, P. (2020). On the calibration of rotational augmentation models for wind turbine load estimation by means of CFD simulations. Acta Mechanica Sinica/Lixue Xuebao, 36(2), 306–319. DOI 10.1007/s10409-020-00949-0. [Google Scholar] [CrossRef]
7. Pawar, M. J., Patnaik, A., Nagar, R. (2016). Mechanical and thermo-mechanical analysis based numerical simulation of granite powder filled polymer composites for wind turbine blade. Fibers and Polymers, 17(7), 1078–1089. DOI 10.1007/s12221-016-5843-y. [Google Scholar] [CrossRef]
8. Boujleben, A., Ibrahimbegovic, A., Lefranois, E. (2020). An efficient computational model for fluid-structure interaction in application to large overall motion of wind turbine with flexible blades. Applied Mathematical Modelling, 77, 392–407. DOI 10.1016/j.apm.2019.07.033. [Google Scholar] [CrossRef]
9. Johnson, E., L., Chen, H. M. (2020). Isogeometric analysis of ice accretion on wind turbine blades. Computational Mechanics, 66, 311–322. DOI 10.1007/s00466-020-01852-y. [Google Scholar] [CrossRef]
10. Nakhchi, M. E., Naung, S. W., Dala, L., Rahmati, M. (2022). Direct numerical simulations of aerodynamic performance of wind turbine aerofoil by considering the blades active vibrations. Renewable Energy, 191, 669–684. DOI 10.1016/j.renene.2022.04.052. [Google Scholar] [CrossRef]
11. Santo, G., Peeters, M., Paepegem, W. V., Degroote, J. (2019). Dynamic load and stress analysis of a large horizontal axis wind turbine using full scale fluid-structure interaction simulation. Renewable Energy, 140(9), 212–226. DOI 10.1016/j.renene.2019.03.053. [Google Scholar] [CrossRef]
12. Zhu, R. S., Zhao, H. L., Peng, J. Y., Li, J. P., Wang, S. Q. et al. (2016). A numerical investigation of fluid-structure coupling of 3 MW wind turbine blades. International Journal of Green Energy, 13(3), 241–247. DOI 10.1080/15435075.2014.917418. [Google Scholar] [CrossRef]
13. Wiegard, B., Knig, M., Lund, J., Radtke, L., Düster, A. (2021). Fluid-structure interaction and stress analysis of a floating wind turbine. Marine Structures, 78, 102970. DOI 10.1016/j.marstruc.2021.102970. [Google Scholar] [CrossRef]
14. Bazilevs, Y., Korobenko, A., Deng, X., Yan, J. (2016). Fluid-structure interaction modeling for fatigue-damage prediction in full-scale wind-turbine blades. Journal of Applied Mechanics, 83(6), 061010. DOI 10.1115/1.4033080. [Google Scholar] [CrossRef]
15. Santo, G., Peeters, M., Paepegem, W. V., Degroote, J. (2020). Fluid-structure interaction simulations of a wind gust impacting on the blades of a large horizontal axis wind turbine. Energies, 13(3), 509. DOI 10.3390/en13030509. [Google Scholar] [CrossRef]
16. Boujleben, A., Ibrahimbegovic, A., Lefranois, E. (2020). An efficient computational model for fluid-structure interaction in application to large overall motion of wind turbine with flexible blades. Applied Mathematical Modelling, 77, 393–407. DOI 10.1016/j.apm.2019.07.033. [Google Scholar] [CrossRef]
17. Macphee, D. W., Beyene, A. (2015). Experimental and fluid structure interaction analysis of a morphing wind turbine rotor. Energy, 90, 1055–1065. DOI 10.1016/j.energy.2015.08.016. [Google Scholar] [CrossRef]
18. Wang, X. L., Zhang, L. R., Zhang, J. Q. (2021). Study on wind turbine output power based on fluid-solid coupling law. Journal of Engineering Thermophysics, 42(3), 641–646. DOI 10.1016/j.energy.2015.08.016. [Google Scholar] [CrossRef]
19. Lee, K., Huque, Z., Kommalapati, R., Han, S. E. (2017). Fluid-structure interaction analysis of NREL phase VI wind turbine: Aerodynamic force evaluation and structural analysis using FSI analysis. Renewable Energy, 113, 512–531. DOI 10.1016/j.renene.2017.02.071. [Google Scholar] [CrossRef]
20. Dose, B., Rahimi, H., Stoevesandt, B., Peinke, J. (2020). Fluid-structure coupled investigations of the NREL 5 MW wind turbine for two downwind configurations. Renewable Energy, 146, 1113–1123. DOI 10.1016/j.renene.2019.06.110. [Google Scholar] [CrossRef]
21. Dai, L. P., Zhou, Q., Zhang, Y. W., Yao, S. G., Kang, S. et al. (2017). Analysis of wind turbine blades aero elastic performance under yaw conditions. Journal of Wind Engineering and Industrial Aerodynamics, 171, 273–287. DOI 10.1016/j.jweia.2017.09.011. [Google Scholar] [CrossRef]
22. Badcock, K. J., Richards, B. E. (1996). Implicit time-stepping methods for the navier-stokes equations. AIAA Journal, 34(3), 555–559. DOI 10.2514/3.13103. [Google Scholar] [CrossRef]
23. Zhang, K. K. (2019). Aerodynamic performance of 5 MW wind turbine and fluid-solid interaction analysis of blades (Master Thesis). School of Energy and Power Engineering, Lanzhou University of Technology, China. [Google Scholar]
Cite This Article
 Copyright © 2023 The Author(s). Published by Tech Science Press.
This work is licensed under a Creative Commons Attribution 4.0 International License , which permits unrestricted use, distribution, and reproduction in any medium, provided the original work is properly cited.
 Downloads
 Citation Tools