 Open Access
ARTICLE
Analysis of the Emissions and Performance of a Diesel Engine Using Pumpkin Seed Oil Methyl Ester with Different Injection Pressures
1 Research Scholar, Department of Mechanical Engineering, Vinayaka Missions Research Foundation, Chennai, 603104, India
2 Department of Mechanical Engineering, Aarupadai Veedu Institute of Technology, Vinayaka Missions Research Foundation, Chennai, 603104, India
3 Department of Mechanical Engineering, Vinayaka Mission’s Kirupananda Variyar Engineering College, Vinayaka Mission Research Foundation, Chennai, 636001, India
4 Department of Mechanical Engineering, Dr. M.G.R. Educational and Research Institute, Chennai, 600095, India
* Corresponding Author: Surendrababu Kuppusamy. Email:
(This article belongs to the Special Issue: Advances in Fluid Dynamics and Functional Materials)
Fluid Dynamics & Materials Processing 2023, 19(4), 1003-1014. https://doi.org/10.32604/fdmp.2022.022262
Received 01 March 2022; Accepted 04 April 2022; Issue published 02 November 2022
Abstract
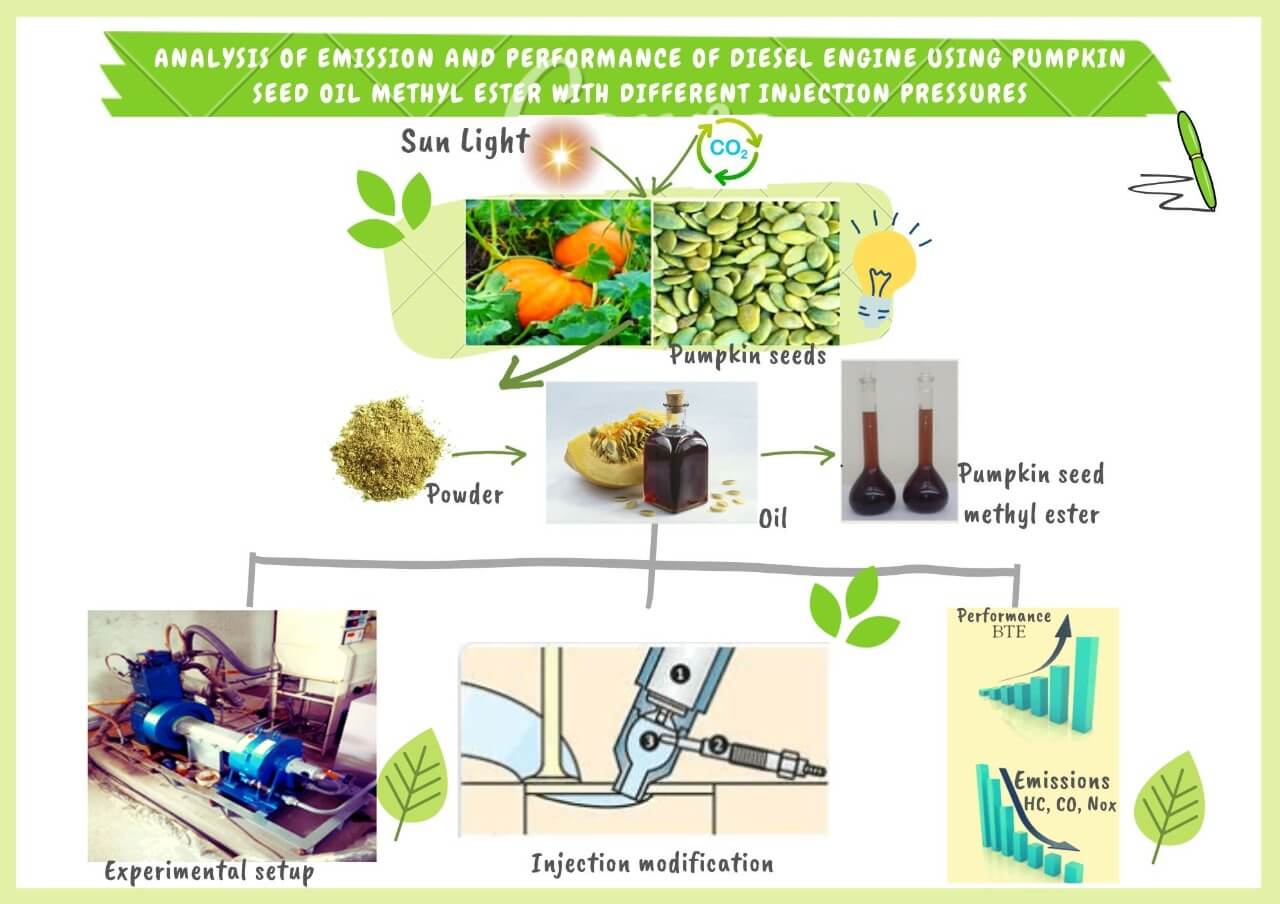
Biodiesel fuel is a potential alternative energy source for diesel engines due to its physiochemical characteristics relatively similar to those of traditional diesel fuel. In this study, the performance, emission, and combustion features of a mono cylinder DI diesel engine are assessed using 20% Pumpkin seed methyl ester (PSOME20) and considering varying injection pressures (200, 220, 240, and 260 bar). The considered Pumpkin seed oil is converted into pumpkin biodiesel by transesterification and then used as fuel. The findings demonstrate that the Brake Thermal Efficiency (BTE) of PSOME20 can be raised by 1.68%, and the carbon monoxide (CO), hydrocarbon (HC), and smoke emanations can be lowered, while oxides of nitrogen (NOx) emissions are increased at an injection pressure (IP) of 240 bar compared to the standard IP of 200 bar. The cylinder pressure and the Heat Release Rate (HRR) become higher at 240 bar, whereas the ignition delay is shortened with respect to PSOME20 at a normal IP of 200 bar.Graphic Abstract
Keywords
Nomenclature
| BTE | Brake thermal efficiency |
| bTDC | Before top dead center |
| BSFC | Brake specific fuel consumption |
| CO | Carbon monoxide |
| NOx | Oxides of Nitrogen |
| EGT | Exhaust gas temperature |
| HC | Hydrocarbon |
| HRR | Heat release rate |
| IT | Injection timing |
| IP | Injection pressure |
| J/°CA | Joules per degree crank angle |
| PSOME | Pumpkin seed methyl ester |
Petroleum is the most common type of fuel used in automobiles. Toxic gases are released into the atmosphere as a result of the combustion of fossil fuels. As the environment deteriorates and fossil fuel stocks deplete, experts are focusing on alternative energy sources such as biomass and biofuels. Vegetable oils and their methyl esters are becoming more attractive as long-term energy sources [1] Although vegetable oils are a viable substitute for diesel, they do have some disadvantages, such as high viscosity and poor volatility. Carbon accumulation, injector fouling, piston ring stickiness, fuel line obstruction, poor fuel atomization, and lubricating oil condensation are all disadvantages of using vegetable oils in engines. As a result, restoring the physio-chemical characteristics of vegetable oils is increasingly critical [2] Biodiesel was viewed as the most viable diesel substitute due to its renewable nature, lower carbon content, and lower pollutants. Biodiesel is made from a variety of oils, including edible and inedible vegetable oils, animal fats, and waste cooking oils.
In recent years, a slew of new biodiesels generated from non-edible oils has been discovered. The performance and emissions of biodiesels such as Karanja biodiesel [3], Yellow oleander biodiesel [4], Pongamia biodiesel [5], Orange biodiesel [6], Rapeseed biodiesel [7], Chicha oil biodiesel [8] in diesel engines were investigated using the transesterification process. In specific v/v proportions, these oils were combined with diesel. Biodiesels made from neem oil and pumpkin were included in the list of feasible biodiesel options. Many researchers have looked into the engine performance of various biodiesels and their blends, revealing similar reductions in all pollutants except NOx [9,10]. When oxygenate chemicals are used, discovered that cleaner combustion of biodiesel and its blends is possible, resulting in fewer emissions [11–13].
Because biodiesel has different physical properties than mineral diesel, engine combustion variables such as delay time, fuel mass burnt, and other factors may alter. As a result, various researchers worked tirelessly to investigate the effects of changing crucial aspects including injection pressure (IP) and injection timing (IT). Some studies were carried out to maximize the IT and IP when using biodiesel and its various blends with diesel, either independently or in combination. Combustion is expected to occur sooner as technology improves, resulting in more fuel being burned before top dead center and peak pressure occurring closer to top dead center, and vice versa [14,15]. Within specific limits, delaying the IT can lower NOx emissions without having a significant influence on engine efficiency [16–18]. Increased injection pressure may improve biodiesel atomization, but improved combustion may result in higher NOx levels [19–21].
Sayin et al. [22] investigated the effects of IPs and ITs on the engine and found that a 280 bar IP and a 25.5°bTDC were suitable for biodiesel operation, resulting in enhanced BTE and reduced NOx and smoke. The impact of different ITs and IPs on engines running on a B20 castor biodiesel blend was investigated by Prabhahar et al. [23]. Delaying the injection time is said to minimize peak cylinder pressure and BTE. CO and HC pollutants have been demonstrated to reduce when injection pressure is increased to 300 bar, while NOx appears to be preferable at 21°bTDC IT, but at the expense of a considerable reduction in BTE and smoke, opacity appears to be preferable at 25°bTDC. Kannan et al. [24,25] investigated the impact of IP and IT on engine performance when using biodiesel blends. The BTE improved by 2.4 percent with an increase in IP and 1.5 percent with an increase in IT at maximum load, and it was somewhat less than diesel. All emissions were reduced at 230 bar IP and 27°bTDC IT, with the exception of NOx and CO2, which improved dramatically as IP and IT increased.
Most of the researchers found that while NOx emissions increased, CO, HC, and smoke levels decreased [26–28]. Ravichandran et al. [29] investigated the effects of several IPs on the performance of biodiesel-powered diesel engines. Their studies revealed that as IPs increased, BTE increased as well, while BSFC was lowered, and NOx was increased as IPs increased. The effects of methyl ester in the fish oil mixture on engine performance were investigated by [30,31]. BSFC and NOx emissions increased as the percentage of biodiesel in the fuel mix increased, but soot, HC, and CO emissions decreased. Using a 25% concentration of biodiesel generated from pumpkin seed biodiesel and diesel, this study will investigate the impact of varied injection pressures on engine performance and emissions. The data was examined and compared to standard operating conditions with base fuels.
2.1 Pumpkin Seed Oil Extraction
The botanical name for the pumpkin plant is Cucurbita pepe L. The pumpkin seed has a pleasant aroma and is dark green colour. Pumpkin oil is made from raw pumpkin seeds at low temperatures. It is made by pressing toasted, hull-less pumpkin seeds from a local variety. Pumpkin seeds have high oil content, ranging from 40% to 60%. The exterior layers of a pumpkin seed appear to be green, while the hidden layers appear to be red. It has a specific gravity of 4.62 and an acid value of 1.2. The oil must be stored in a dry, cool environment due to its fragile nature.
The transesterification of raw pumpkin seed oil in the presence of a sodium hydroxide (NaOH) catalyst produces pumpkin seed oil biodiesel. 1000 mL of raw Oleander oil is placed in a round bottom conical flask, and 10 g of potassium hydroxide (KOH) crystal is correctly dissolved in 200 mL of methanol in a beaker to generate a sodium methoxide solution. In a three-necked flask, the solution is applied to raw pumpkin seed oil, heated to 65°C, and constantly swirled at 500 rpm for 1 h. It is transferred to a separating flask and let to settle for eight hours. Two layers appeared in the flask: glycerol on the bottom and biodiesel on the top. Although the glycerin process was mostly segregated, the biodiesel phase contained some glycerin and residual methanol. These chemicals were soluble in water. To remove and purify these chemicals from the biodiesel, a distilled water washing procedure was used.
The biodiesel was mixed with one-third of its volume of warm distilled water and agitated during this operation. This technique was carried out three times in all. The refined biodiesel was free of residual water and methanol after evaporation. In the filtration procedure, the filter paper was employed. There was plenty of pure B-100 fuel on hand. PSOME fuel was also mixed with diesel in a 25 percent by volume ratio to make PSOME20 fuel. Table 1 contains the physicochemical properties.

To replicate the braking load, a single-cylinder Kirloskar diesel engine was coupled to a dynamometer in this study. Fig. 1 shows a schematic representation of a test engine. Before measuring engine characteristics and tailpipe emissions, the instruments utilized in this investigation were calibrated and tested. The experimental engine is described in detail in Table 2. An AVL-444 gas analyzer was utilized to measure CO, HC, and NOx concentrations in the exhaust, while an AVL-437 smoke meter was used to measure smoke opacity in the tailpipe. The engine was principally powered by diesel and PSOME20, and it was then tested at 0–100 percent load in 25 percent increments using PSOME20 at various injection pressures (200, 220, 240, and 260 bar) with standard injection timing 23°bTDC. Every experiment was carried out three times, with the average data being used in the calculations. The experimental data was examined and compared to diesel injection pressures of 200 bar.
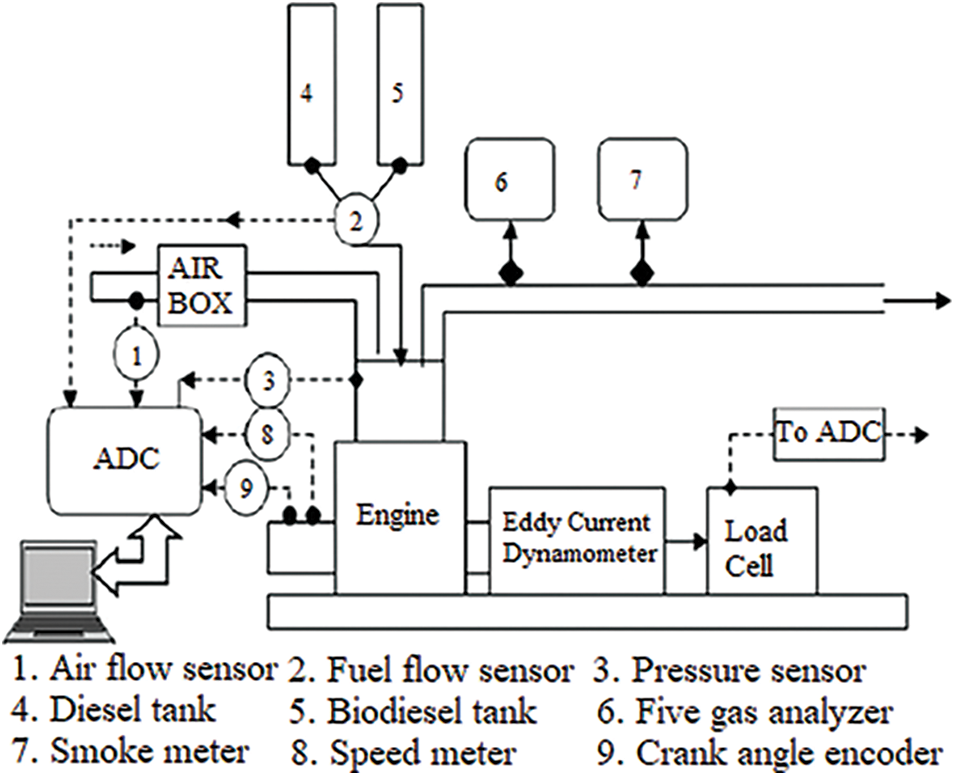
Figure 1: Experimental test engine setup

The injection pressure was varied between 200, 220, 240, and 260 bar. The needle valve spring tension on the injector was adjusted to change the nozzle opening pressure. The injector’s opening pressure (IP) is adjusted by modifying the spring tension, which implies that the injector’s nozzle valve opens when the fuel line pressure exceeds the required pressure value. The injector tester is used to assess the fuel injection pressure following the appropriate changes.
The diesel engine test was carried out with diesel and PSOME20 at varying injection pressures and loads. For each test, the time taken to consume 10cc of fuel was recorded, as well as the emission levels. In this section, the computed and measured parameters were examined and compared to diesel.
The effective work output produced from the thermal energy liberated by fuel combustion is represented by the pressure generated during the expansion stroke in a process restricted by the cylinder. Fig. 2 depicts the change in-cylinder pressure as a function of the crank angle at maximum load. Cylinder pressure attained at maximum power for PSOME20 with 220, 240, and 260 bar injection pressure is 69 bar, 71 bar, and 65 bar, respectively, while for diesel and PSOME20 with 200 bar IP is 68.3 bar and 67 bar, respectively. Peak pressure may have arisen as a result of improved atomization of fuel particles at higher injection pressures, which minimizes ignition delay and improves combustion. Due to increased fuel accumulation during injection, cylinder pressure was found to be lower at 275 bar IP, resulting in poor combustion.
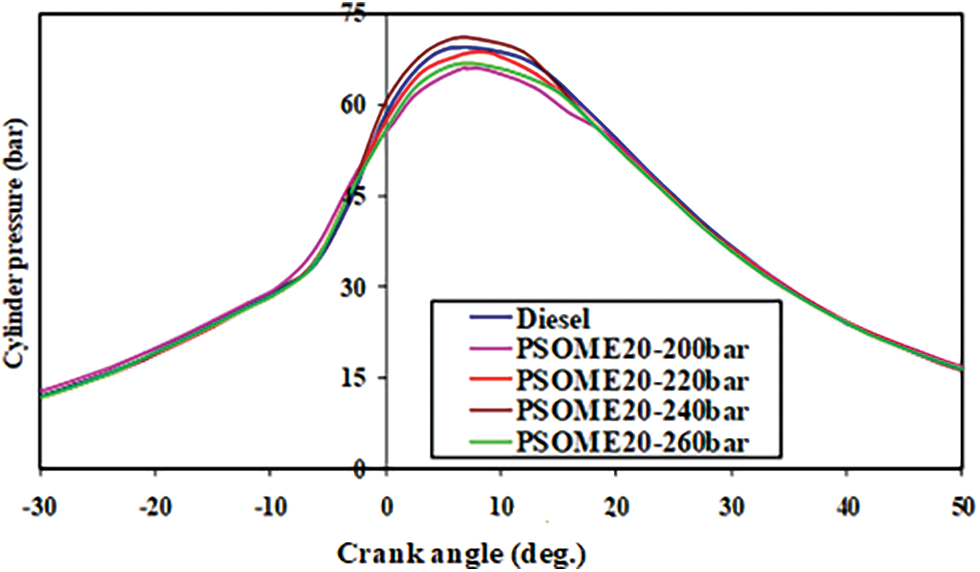
Figure 2: Cylinder pressure vs. crank angle
The Heat Release Rate (HRR) is the amount of heat produced during the combustion process by the burning of fuel inside the engine cylinder. The cylinder pressure is combined with the crank angle to calculate HRR. Under full load, Fig. 3 depicts the change in HRR as a function of crank angle for all fuels. Because pure PSOME20 fuel has a shorter ID time, it tends to burn less fuel in premixed combustion, resulting in a lower heat release rate. HRR recorded at full load for PSOME20 with 225, 250, and 275 bar is 60 J/̊CA, 64 J/̊CA, and 62 J/̊CA, respectively, while for diesel and PSOME20 with 200 bar IP is 56 J/̊CA and 54 J/̊CA. At higher injection pressures, the premixed combustion stage for PSOME20 is bigger than the typical injection pressure. This could be attributed to enhanced fuel particle atomization, which allows them to permeate the air more quickly, resulting in an increase in the premixed combustion phase.
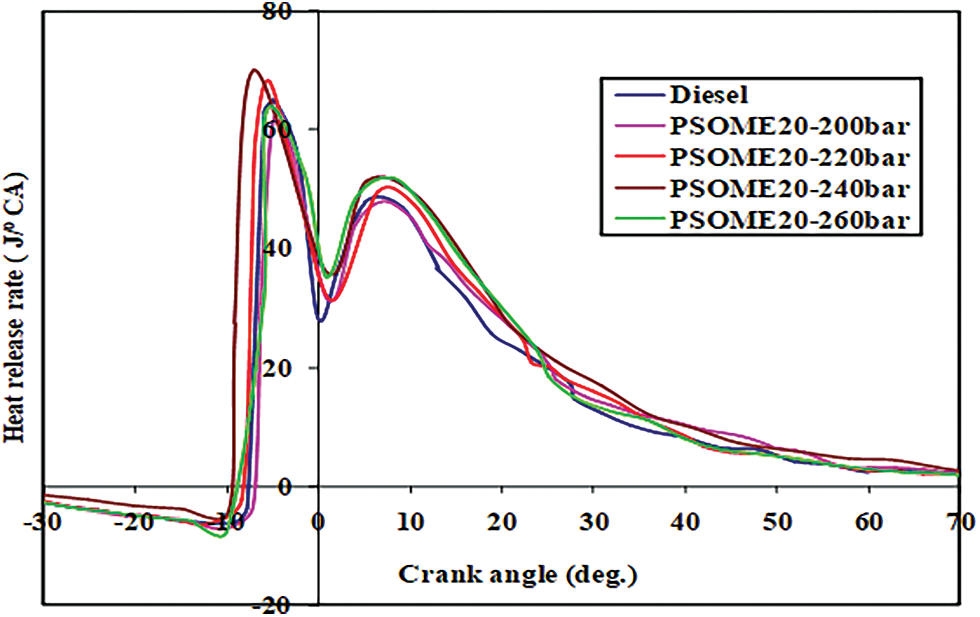
Figure 3: Heat release rate vs. crank angel
The ability of an engine to convert thermal energy from a fuel into mechanical energy is measured by its BTE value. Fig. 4 shows how the thermal efficiency of diesel and PSOME20 changes with BP at various IPs. It has been noticed that as the number of IPs and loads increases, BTE rises. Because of its higher viscosity and higher energy content, PSOME20 has a lower BTE than diesel. Furthermore, as the IP rises to 240 bar, so does the BTE. This is due to increased fuel atomization and vaporization at higher IPs, which results in improved PSOME20-air mixture combustion. Because more fuel was injected during maximum power conditions, the BTE was reduced at 260 bar pressure. This resulted in slower combustion and a lower BTE. The BTE of PSOME20 at IPs 220, 240, and 260 bar is 30.1 percent, 31.9 percent, and 29.2 percent, respectively, at maximum load, and 31.4 percent and 28.6 percent, respectively, for diesel and PSOME20 at 200 bar IP. At maximum load, the BTE of PSOME20 at 260 bar IP was 1.5% lower than at 240 bar IP. The BTE of PSOME20 at 240 bar IP is 2.1 percent higher than the BTE of PSOME20 at 200 bar IP. The researcher Jagadish found a similar pattern in the BTE curve for biodiesel blend [30].
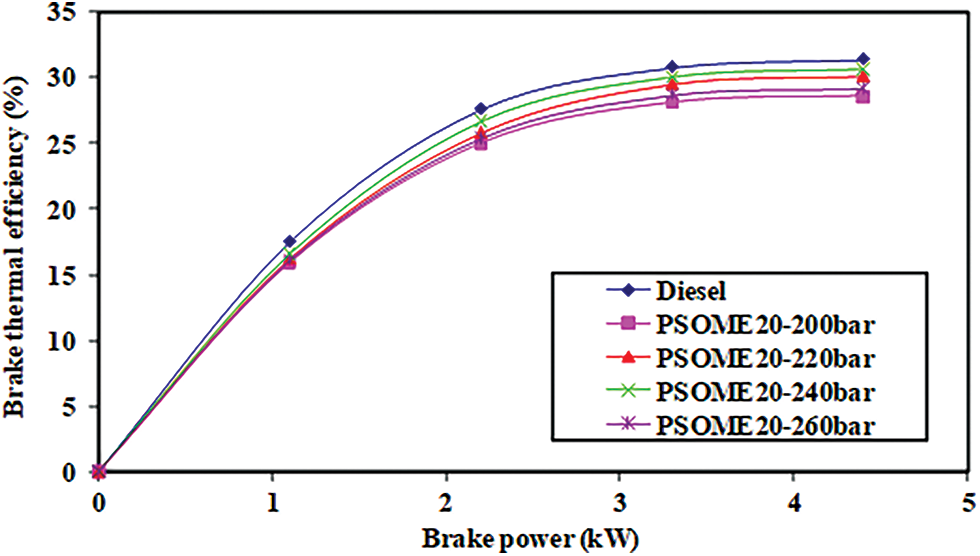
Figure 4: Changes in brake thermal efficiency with BP
The impact of IPs on BSFC against BP for diesel and PSOME20 fuels with various injection pressures is shown in Fig. 5. The BSFC curve trend is the inverse of the BTE curve trend at all IPs. When compared to diesel, the PSOME20’s BSFC is improved by 200 bar IP. PSBD exhibited a higher BSFC at typical IP 200 bar at peak load due to its low energy content and high viscosity. As IP rises, the atomization of fuel particles reduces, resulting in higher air-fuel combining rates and, as a result, higher HRR. The BSFC for diesel and PSOME20 is 0.28 and 0.31 kg/kWh at standard IP, respectively, whereas it is 0.30, 0.29, and 0.33 kg/kWh at peak load for IPs 220, 240, and 260 bar, respectively. When compared to PSOME20 at 200 bar, the BSFC of PSOME20 at 240 bar IP was lowered by 6.5 percent and by 3.2 percent at 225 bar due to greater homogenization and vaporization of the fuel-air combination at higher IPs. At 260 bar, the BSFC has increased because the fuel has less momentum, resulting in poor combustion and hence a greater BSFC at peak load.
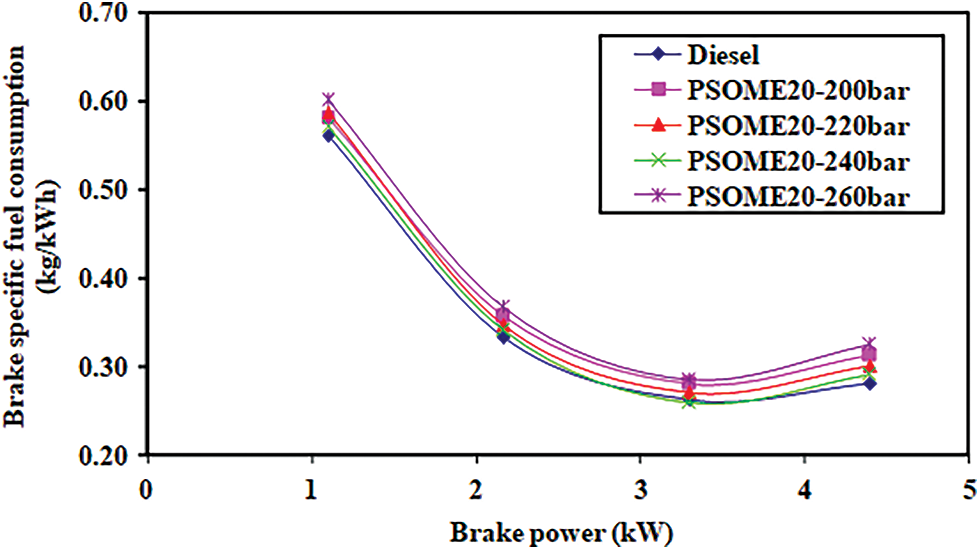
Figure 5: Changes in brake-specific fuel consumption with BP
Fig. 6 depicts the effects of different IPs on EGT for PSOME20 and diesel. It is well known that EGT rises as load rises, owing to the increased energy released from the fuel. Furthermore, the combustion process is optimized to increase IPs by improving atomization and mixing of fuel and air, resulting in better fuel burning and, as a result, lower EGT. PSOME20 was able to obtain a lower EGT because it burned more effectively than diesel. The EGT of diesel and PSOME20 at peak load is 376°C and 392°C, respectively, and at 220, 240, and 260 bar, it is 410°C, 424°C, and 402°C.
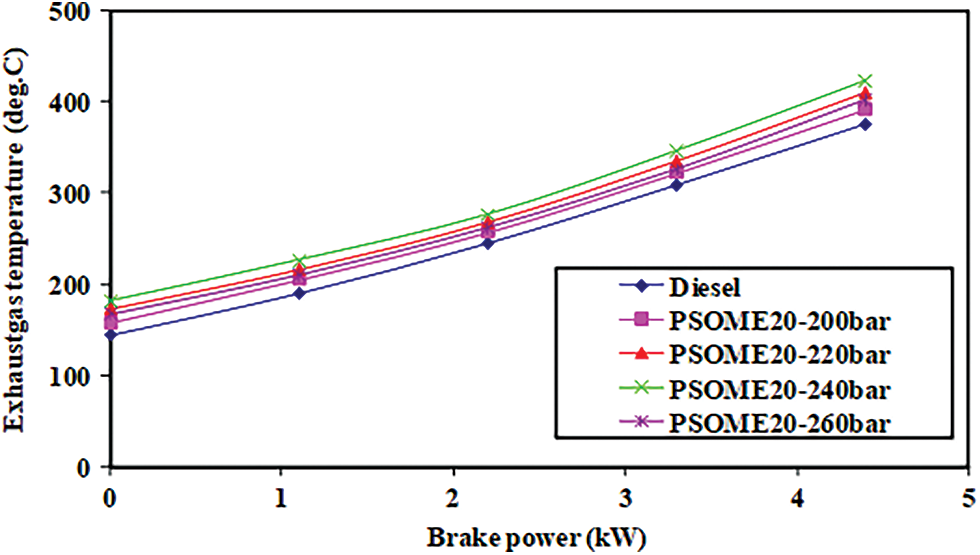
Figure 6: Changes in exhaust gas temperature with BP
The change in CO emissions for both diesel and PSOME20 with varying IPs and brake power is depicted in Fig. 7. The production of CO emissions in CI engines is usually linked to diesel quality and combustion characteristics. PSOME20 CO emission is reduced at normal IP 200 bar due to the presence of extra O2 molecules in biodiesel, which aid in the oxidation of the fuel-air mixture, resulting in improved biodiesel combustion. Increasing IPs also improves spray penetration in compressed air, which improves fuel and air mingling and the burning process, resulting in increased biodiesel combustion. At a regular IP of 200 bar, CO emissions for diesel and PSOME20 are 0.12 percent and 0.09 percent, respectively, whereas at maximum power, emissions are 0.08 percent, 0.07 percent, and 0.11 percent, respectively. When compared to diesel, CO emissions for PSOME20 at 220 and 240 bar IP were reduced by 33 and 42 percent, respectively, and by 11 and 22 percent when compared to PSOME20 at 200 bar. In comparison to diesel at typical IP 200 bar at maximum load, CO emissions for PSOME20 at 240 bar were reduced by 57%.
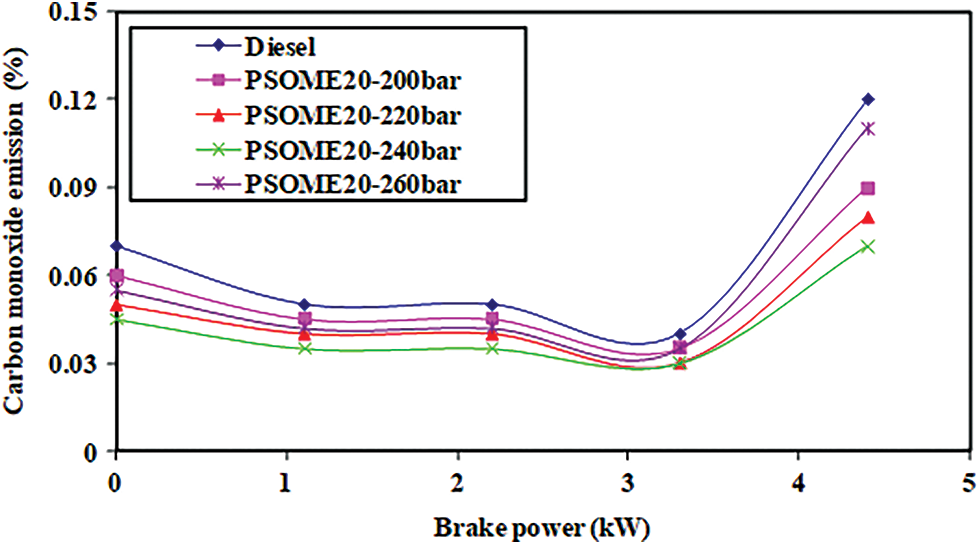
Figure 7: Changes in carbon monoxide with BP
Fig. 8 shows the change in HC as a function of BP for diesel and PSOME20 at various IPs. PSOME20 showed a higher HC than diesel at peak power circumstances at a normal IP of 200 bar. The change in PSOME20’s IP has a big impact on HC emissions. PSOME20 has lower HC at 220 and 240 bar IP when compared to diesel at 200 bar IP. Because the fuel is more atomized, the droplets of diesel fuel acquire more velocity and penetration, resulting in complete combustion and increased injection pressure [32]. Because of a lack of adequate fuel interaction and a lack of oxygen for combustion, an increase in IP above 240 bar increases HC emissions. Diesel and PSOME20 emit 48 and 43 ppm at a conventional IP of 200 bar, respectively, while PSOME20 emits 36, 32, and 39 ppm for 220, 240, and 260 bar IPs, respectively. When compared to PSOME20 at typical IP of 200 bar at peak power, HC emissions for PSOME20 at 225, 250, and 275 bar IPs were reduced by 16 percent, 26 percent, and 9 percent, respectively.
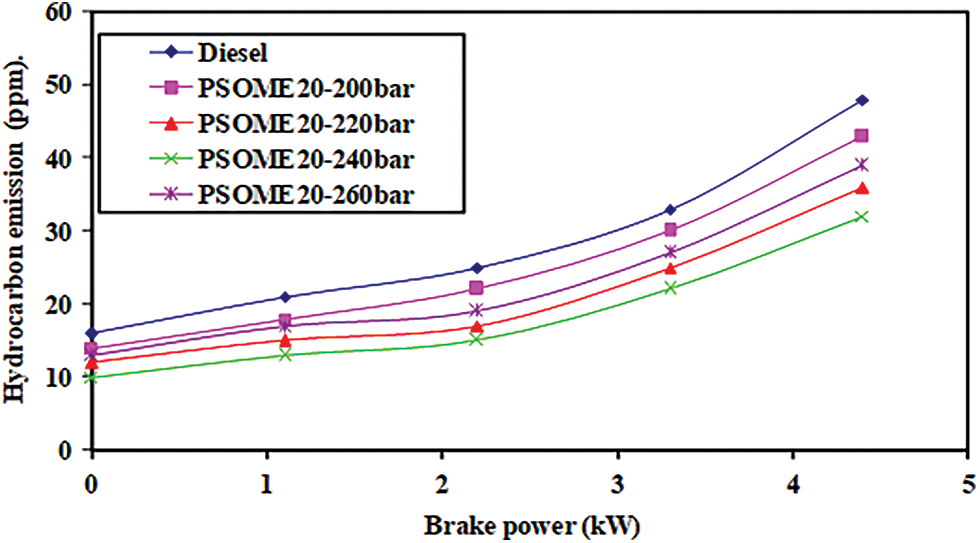
Figure 8: Changes in hydrocarbon with BP
Fig. 9 shows how NOx emissions fluctuate with BP for diesel and PSOME20 at various IPs. There was an increase in NOx emissions when PSOME20 was compared to diesel at 200 bar IP. When IPs increased from 200 to 250 bar due to a rise in peak temperature, NOx emissions increased at full load. This could be due to biodiesel’s higher oxygen content in its structure, as well as more atomization and evaporation of fuel at higher IPs, resulting in higher NOx emissions than diesel [30]. The NOx emissions for diesel and PSOME20 are 868 and 936 parts per million, respectively, whereas the NOx emissions for IPs 220, 240, and 260 bar are 1015, 1109, and 1062 parts per million, respectively. When compared to PSOME20 at original IP 200 bar, NOx emissions rose by 8.4%, 18.5 percent, and 13.5 percent for 220, 240, and 260 bar IPs, respectively, at peak load. A similar pattern in NOx emissions curves for biodiesel blends was discovered by Nallusamy et al. [32].
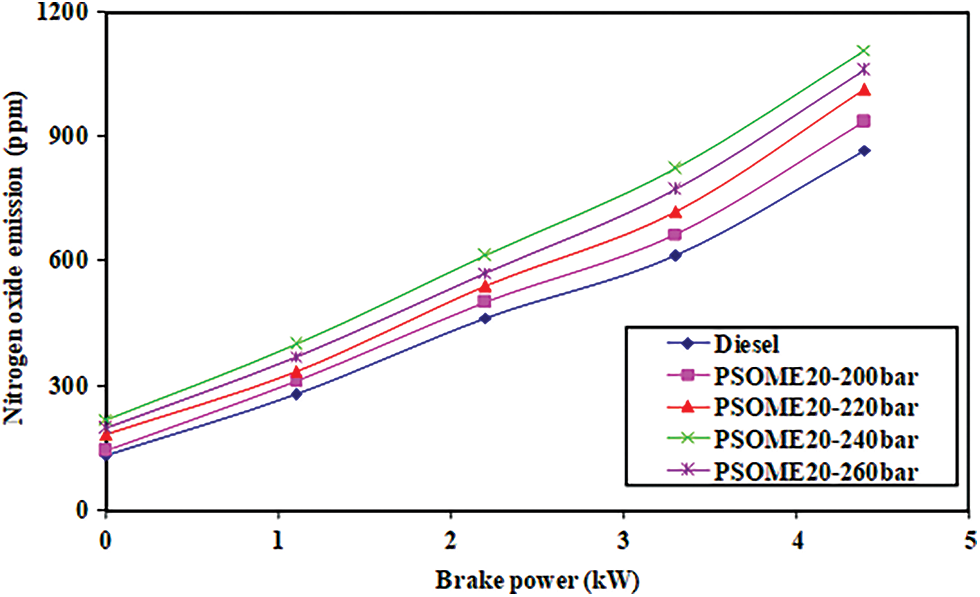
Figure 9: Changes in nitrogen oxide with BP
Fig. 10 shows how smoke changes with BP for diesel and PSOME20 at various IPs. Because PSOME20 has a higher O2 concentration and provides cleaner combustion than diesel, smoke was reduced for PSOME20 with a normal IP of 200 bar. In addition, while comparing PSOME20 to diesel, the smoke was reduced by raising the IPs. Smoke from diesel and PSOME20 is 32 percent and 28 percent at normal IP, respectively, while it is 23 percent, 20 percent, and 26 percent at 220, 240, and 260 bar IP, respectively. PSOME20’s smoke emissions decreased by 22%, 36%, and 11% at 220, 240, and 260 bar, respectively, compared to PSOME20’s typical IP of 200 bar, owing to enhanced fuel atomization and mixing with air, which resulted in lower smoke emission for PSOME20 at higher IPs. Senthilkumar et al. [33] discovered a similar pattern of results with biodiesel mixes in terms of smoke emissions.
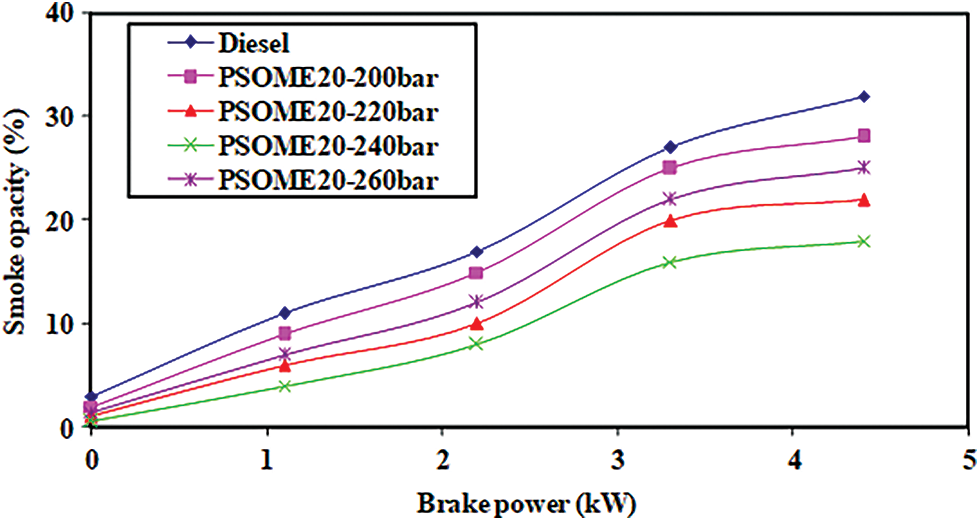
Figure 10: Changes in smoke with BP
This research looked at the performance, emissions, and combustion of a CI engine powered by a PSOME20 at various injection pressures. As a result of the studies, the following conclusions have been reached:
Using PSOME20, increased IPs improve the engine’s performance characteristics in terms of BSFC and BTE. When compared to the PSOME20 at 200 bar, the BTE increased by 1.5 percent and the BSFC reduced by 6.5 percent at 240 bar, while the EGT of the PSOME20 declined with all injection pressures. Increasing the IPs for PSOME20 reduces CO, HC, and smoke emissions at peak load. Higher IPs in contrast to PSOME20 led to more NO emissions as a result of a higher combustion peak temperature. As a result, when compared to PSOME20 at 200 bar, PSOME20 blends at 240 bar IP provide adequate performance and lower exhaust gas emissions at peak power. Raising the injection pressures for biodiesel raises the cylinder pressure and HRR at maximum power. Furthermore, because of the higher combustion temperature and pressure, increasing the injection pressures reduces the combustion duration, resulting in enhanced combustion. Overall, the biodiesel blend with higher IP enhances combustion and performance characteristics while lowering specific fuel consumption and CO, HC, and smoke emissions from the engine.
Acknowledgement: The authors gratefully acknowledge the laboratory facilities provided by Aarupadai Veedu Institute of Technology, Vinayaka Mission Research Foundation, Deemed to be University, Tamil Nadu, India.
Funding Statement: The authors received no specific funding for this study.
Conflicts of Interest: The authors declare that they have no conflicts of interest to report regarding the present study.
References
1. Aydına, H., Cumali, İ. (2017). Air pollution, pollutant emissions and harmfull effects. Journal of Engineering and Technology, 1, 8–15. [Google Scholar]
2. Anbarasu, A., Karthikeyan, A. (2015). Effect of injection pressure on the performance and emission characteristics of CI engine using canola emulsion fuel. International Journal of Ambient Energy, 38 (3), 314–319. DOI 10.1080/01430750.2015.1092472. [Google Scholar] [CrossRef]
3. Thomas, W., Elke, P., Klaus, S., Franz, S. W. (2002). An improved method to discover adulteration of styrian pumpkin seed oil. Journal of Biochemical and Biophysical Methods, 53(1–3), 193–202. DOI 10.1016/S0165-022X(02)00108-2. [Google Scholar] [CrossRef]
4. Luqman, R., Mujtaba, M. A., Shahbaz, M. A., Saad, N. et al. (2022). Effect of biodiesel-dimethyl carbonate blends on engine performance, combustion and emission characteristics. Alexandria Engineering Journal, 61, 5111–5121. DOI 10.1016/j.aej.2021.10.015. [Google Scholar] [CrossRef]
5. Mujtaba, M. A., Kalam, M. A., Masjuki, H. H., Gul, M. et al. (2020). Comparative study of nanoparticles and alcoholic fuel additives-biodiesel-diesel blend for performance and emission improvements. Fuel, 279(1), 118434. DOI 10.1016/j.fuel.2020.118434. [Google Scholar] [CrossRef]
6. Karthickeyan, V., Ashok, B., Nanthagopal, K., Thiyagarajan, S., Geo, V. E. (2019). Investigation of novel pistacia khinjuk biodiesel in DI diesel engine with post combustion capture system. Applied Thermal Engineering, 159, 113969. DOI 10.1016/j.applthermaleng.2019.113969. [Google Scholar] [CrossRef]
7. Prakash, S., Prabhahar, M., Niyas, O. P., Faris, S., Vyshnav, C. (2020). Thermal barrier coating on IC engine piston to improve efficiency using dual fuel. Materials Today: Proceedings, 33, 919–924. [Google Scholar]
8. Tamilselvan, P., Nallusamy, N., Rajkumar, S. (2017). A comprehensive review on performance, combustion and emission characteristics of biodiesel fuelled diesel engines. Renewable and Sustainable Energy Reviews, 79, 1134–1159. DOI 10.1016/j.rser.2017.05.176. [Google Scholar] [CrossRef]
9. Ashok, B., Nanthagopal, K., Thundil Karuppa Raj, R., Pradeep Bhasker, J., Sakthi Vignesh, D. (2017). Influence of injection timing and exhaust gas recirculation of a calophyllum inophyllum methyl ester fuelled CI engine. Fuel Processing Technology, 167, 18–30. DOI 10.1016/j.fuproc.2017.06.024. [Google Scholar] [CrossRef]
10. Sathiyamoorthi, R., Sankaranarayanan, G. (2021). Effect of antioxidant additives on the performance and emission characteristics of a DICI engine using neat lemongrass oil–diesel blend. Fuel, 174, 89–96. DOI 10.1016/j.fuel.2016.01.076. [Google Scholar] [CrossRef]
11. Vergel-Ortega, M., Valencia-Ochoa, G., Duarte-Forero, J. (2021). Experimental study of emissions in single-cylinder diesel engine operating with diesel-biodiesel blends of palm oil-sunflower oil and ethanol. Case Studies in Thermal Engineering, 26, 101190l. DOI 10.1016/j.csite.2021.101190. [Google Scholar] [CrossRef]
12. Ochoa, G. V., Isaza-Roldan, C., Forero, J. D., (2019). A phenomenological base semi-physical thermodynamic model for the cylinder and exhaust manifold of a natural gas 2-megawatt four-stroke internal combustion engine. Heliyon, 5, e02700. DOI 10.1016/j.heliyon.2019.e02700. [Google Scholar] [CrossRef]
13. Michael, K., Brian, K., Beth, A., Jim, S., Vladislav, L. (2022). Stability, rheological and combustion properties of biodiesel blends with a very-low sulfur fuel oil (VLSFO). Fuel, 316, 123365. DOI 10.1016/j.fuel.2022.123365. [Google Scholar] [CrossRef]
14. Szybist, J., Szymkowicz, P., Northrop, W. F. (2012). Fuel effects on combustion and emissions of a direct-injection diesel engine operating at moderate to high engine speed and load. SAE Paper, No. 2012–01–0863. [Google Scholar]
15. Bhojraj, N. K., Patle, S. D. (2020). State of art review of algal biodiesel and its blends influence on performance and emission characteristics of compression ignition engine. Cleaner Engineering and Technology, 7, 100431. [Google Scholar]
16. Solaimuthu, C., Govindarajan, P. (2012). Effect of injection timing on the performance, combustion and emission characteristics of diesel engine using mahua oil methyl ester in different volumetric proportions as fuel. Journal of Scientific and Industrial Research, 71, 69–74. [Google Scholar]
17. Shehata, M. S., Attia, A. M., Razek, S. A. (2015). Corn and soybean biodiesel blends as alternative fuels for diesel engine at different injection pressures. Fuel, 161, 49–58. DOI 10.1016/j.fuel.2015.08.037. [Google Scholar] [CrossRef]
18. Panneerselvam, N., Murugesan, A., Vijayakumar, C., Kumaravel, A., Subramaniam, D. et al. (2015). Effects of injection timing on bio-diesel fuelled engine characteristics –an overview. Renewable and Sustainable Energy Reviews, 50, 17–31. DOI 10.1016/j.rser.2015.04.157. [Google Scholar] [CrossRef]
19. Kiani Deh Kiani, M., Rostami, S., Eslami, M., Yusaf, T., Sendilvelan, S. (2018). Experimental study of using vegetable oil as renewable fuel in diesel engine. Energy Conversion and Management, 165, 344–353. DOI 10.1016/j.enconman.2018.03.066. [Google Scholar] [CrossRef]
20. Ganapathy, T., Gakkhar, R. P. P., Murugesan, K. (2011). Influence of injection timing on performance, combustion and emission characteristics of jatropha biodiesel engine. Applied Energy, 88, 4376–86. DOI 10.1016/j.apenergy.2011.05.016. [Google Scholar] [CrossRef]
21. Prakash, S., Prabhahar, M., Saravana Kumar, M. (2020). Experimental analysis of diesel engine behaviours using biodiesel with different exhaust gas recirculation rates. International Journal of Ambient Energy, 43(1), 1508–1517. DOI 10.1080/01430750.2020.1712251. [Google Scholar] [CrossRef]
22. Sayin, C., Gumus, M. (2011). Impact of compression ratio and injection parameters on the performance and emissions of a di diesel engine fueled with biodiesel-blended diesel fuel. Applied Thermal Engineering, 31, 3182–88. [Google Scholar]
23. Prabhahar, M., Kiani, M. K. D., Bhaskar, K., Sendilvelan, S., Prakash, S. et al. (2019). Studies on pongamia oil methyl ester fueled direct injection diesel engine to increase efficiency and to reduce harmful emissions. In: Azad, A. K., Rasul, M. (Eds.Woodhead publishing series in energy, pp. 217–245. Advanced Biofuels, Woodhead Publishing. [Google Scholar]
24. Kannan, G. R., Anand, R. (2012). Effect of injection pressure and injection timing on DI diesel engine fuelled with biodiesel from waste cooking oil. Biomass and Bioenergy, 46, 443–352. [Google Scholar]
25. Akash, D., Sandhu, S. S., Subhash, C. (2017). Experimental investigations on the influence of fuel injection timing and pressure on single cylinder C.I. engine fueled with 20% blend of castor biodiesel in diesel. Fuel, 210, 15–22. [Google Scholar]
26. Prabhahar, M., Sendilvelan, S., Prakash, S., Saravanakumar, M. (2017). Investigation of pine oil methyl ester blends with diesel on a compression ignition engine to control oxides of nitrogen and soot particles. Rasayan Journal of Chemistry, 10(4), 1075–1079. DOI 10.7324/RJC.2017.1041847. [Google Scholar] [CrossRef]
27. Jindal, S., Nandwana, B. P., Rathore, N. S., Vashistha, V. (2010). Experimental investigation of the effect of compression ratio and injection pressure in a direct injection diesel engine running on jatropha methyl ester. Applied Thermal Engineering, 30, 442–448. [Google Scholar]
28. Bellad, M., Tevari, R., Rakesh, B. V., Swamith, K. B., Avinash Patel, K. L. (2018). Production of biodiesel from algae for alternative fuel as diesel. International Journal of Innovative Research in Science, Engineering and Technology, 7(4), 3896–3902. DOI 10.15680/IJIRSET.2018.0704102. [Google Scholar] [CrossRef]
29. Ravichandran, A., Rajan, K., Senthil Kumar, K. R. (2017). Effect of piston bowl geometry and different injection pressure on the performance. Emission, and Combustion Characteristics of Diesel Engine Using Biodiesel Blend. Thermal Science, 22(3), 1445–1446. [Google Scholar]
30. Jagadish, D. (2017). Effect of fuel injection pressure on performance of constant-speed diesel engine fuelled with biofuel mixtures. Biofuels, 2017, 8(5), 537–541. [Google Scholar]
31. E, J. Q., Pham, M. H., Deng, Y. W., Nguyen, T., Duy, V. N. et al. (2018). Effects of injection timing and injection pressure on performance and exhaust emissions of a common rail diesel engine fueled by various concentrations of fish-oil biodiesel blends. Energy, 149, 979–989. DOI 10.1016/j.energy.2018.02.053. [Google Scholar] [CrossRef]
32. Nallusamy, S., Sendilvelan, S., Bhaskar, K., Prabu, N. M. (2017). Analysis of performance, combustion and emission characteristics on biofuel of novel pine oil. Rasayan Journal of Chemistry, 10(3), 873–880. [Google Scholar]
33. Senthilkumar, P., Sankaranarayanan, G. (2016). Effect of jatropha methyl ester on waste plastic oil fueled DI diesel engine. Journal of the Energy Institute, 89(4), 504–512. DOI 10.1016/j.joei.2015.07.006. [Google Scholar] [CrossRef]
Cite This Article
 Copyright © 2023 The Author(s). Published by Tech Science Press.
This work is licensed under a Creative Commons Attribution 4.0 International License , which permits unrestricted use, distribution, and reproduction in any medium, provided the original work is properly cited.


 Submit a Paper
 Propose a Special lssue
 View Full Text
 Download PDF
 Downloads
 Citation Tools