
 Submit a Paper
 Propose a Special lssue
 Open Access
ARTICLE
Experimental and Numerical Assessment of the Influence of Bottomhole Pressure Drawdown on Terrigenous Reservoir Permeability and Well Productivity
1 Oil and Gas Research Institute of Russian Academy of Science, Moscow, 119333, Russian
2 Perm National Research Polytechnic University, Perm, 614990, Russian
* Corresponding Author: Sergey Chernyshov. Email:
(This article belongs to the Special Issue: Fluid Dynamics & Materials Processing in the Oil and Gas Industry)
Fluid Dynamics & Materials Processing 2023, 19(3), 619-634. https://doi.org/10.32604/fdmp.2022.021936
Received 31 January 2022; Accepted 03 May 2022; Issue published 29 September 2022
 View Full Text
 Download PDF
Abstract
During oil and gas fields development, a decrease in reservoir and bottomhole pressure has often a detrimental effect on reservoir properties, especially permeability. This study presents the results of laboratory tests conducted to determine the response of terrigenous reservoir core-sample permeability to changes in the effective stresses and a decrease in the reservoir pressure. The considered samples were exposed for a long time to a constant high effective stress for a more reliable assessment of the viscoplastic deformations. According to these experiments, the decrease of the core samples permeability may reach 21% with a decrease in pressure by 9.5 MPa from the initial reservoir conditions. Numerical simulations have been also conducted. These have been based on the finite element modeling of the near-wellbore zone of the terrigenous reservoir using poroelasticity relations. The simulation results show a limited decrease in reservoir permeability in the near-wellbore zone (by 17%, which can lead to a decrease in the well productivity by 13%).Graphic Abstract
Keywords
Nomenclature
| ρ | average density of overlying rocks (kg/m3) |
| g | acceleration of gravity (m/s2) |
| H | average depth of productive deposit (m) |
| γ | average bulk density of overlying rocks (Н/m3) |
| α | Biot coefficient |
| Km | Bio module |
| p0 | initial pore pressure (Pа) |
| p | current pore pressure (Pа) |
| v | Poisson’s ratio |
| E | Young’s modulus |
| σ | stress tensor |
| | vertical stress in the reservoir (Pa) |
| | effective vertical stress in the reservoir (Pa) |
| | effective horizontal stress in the reservoir (Pa) |
| | average effective stress in the reservoir (Pa) |
| | effective stress at the ends of the specimen (axial) (Pa) |
| | effective confining (all-around compressive) stress on the sample side surface (Pa) |
| | effective average stress in the sample (Pa) |
| | confining (all-around compressive) pressure (stress) of the sample (Pa) |
| | average effective stress in the sample corresponding to the initial reservoir conditions (Pa) |
| krel | relative permeability (unit fraction) |
| k | second-order permeability tensor |
| a | empirical coefficient (unit fraction) |
| b | empirical coefficient (Pa−1) |
| ⋅ | derivative operator |
| ∇ | gradient operator |
| | divergence operator |
| σ′ | effective stress tensor |
| I | second order unit tensor |
| f | is the force vector |
| εV | volumetric deformations of the rock skeleton |
| q | vector of fluid flow velocity |
| S | flow source |
| εe | second-order elastic strain tensor |
| D | tensor of elastic constants of the fourth order |
| V | volume of deformed body (m3) |
| Г | surface of deformed body (m3) |
| u | displacement (m) |
| fB | component of body force (N) |
| fS | component of surface force (N) |
| K | stiffness matrix |
| L | coupling matrix to flow unknowns |
| E | flow matrix |
| F | vector of force boundary conditions |
| R | right hand side of the flow equations |
| Q | vector of boundary conditions |
| T | symmetric transmissibility matrix |
| D | accumulation matrix |
| kav | average reservoir permeability (mD) |
| rk | radial extent (m) |
| rw | well radius (m) |
| Qw | well flow rate (m3/day) |
| Vw | fluid filtration rate on the well wall (m/s) |
| h | reservoir thickness (m) |
During the development of oil and gas reservoirs close to production wells, a depression funnel occurs, caused by a decrease in bottomhole pressure, which leads to an increase in the effective stresses upon the reservoir rock. An increase in effective stresses also occurs with a decrease in pressure in the entire reservoir as a whole during the depletion of hydrocarbon reserves [1–3]. In most cases, due to an increase in effective stresses, the rock is compacted and its porosity and permeability decrease, which can reach several tens of percent of the initial value. A natural consequence of the decrease in the permeability of the reservoir rock is a decrease in the production wells’ productivity. Such changes are typical for both granular [4–6] and fractured reservoirs [7–9]; most often the difference lies in the fact that the permeability of fracture systems is more sensitive to the reservoir pressure changes.
There are quite a lot of publications devoted to the study of the influence of effective stress changes on the permeability of rocks, and at the same time, in several studies, the authors do not pay much attention to the holding time of the samples at each step of stress increase [6,10–12]. However, as shown in the works [13–15], the decrease in porosity and permeability of core samples can continue for quite a long time, which is associated with the manifestation of viscoplastic deformations within rocks. In view of the aforementioned, the aim of the present work was to conduct research to assess the effect of changes in the effective stresses of the reservoir rock during long-term holding at the increasing operating stresses. The duration of each experiment was 39 h, while each of the three loading cycles of core samples lasted 11.5 h, and at the end, an unloading cycle was carried out. The studies were carried out using the terrigenous core samples taken from one of the oil fields located at the depth of 1489 m.
Based on the results of the experiments, the relationship between effective stresses changes and reservoir permeability was obtained. Further, this dependence was used in the numerical finite element modeling of the near-wellbore zone stress state with changes in reservoir and bottomhole pressures. Numerical simulation was carried out in the ANSYS software package using poroelasticity relations. As a result of numerical simulation, graphs of changes in near-wellbore zone permeability and well productivity were obtained depending on the pressure drawdown in the bottomhole and the current reservoir pressure.
2 Laboratory Studies of Core Samples
2.1 Preparation of Core Samples and Preliminary Studies
As already noted, to study the long-term effect of increased effective stresses on the reservoir permeability, the core samples were taken from a terrigenous oil productive object (Fig. 1). The average reservoir depth is 1489 m, the initial reservoir pressure is 14.5 MPa, and the gas saturation pressure is 8.5 MPa. Standard core samples (length and diameter 30 mm) were drilled from the original core material, which were then extracted and dried (Fig. 1). Then, for all prepared samples, using the PIK-PP laboratory equipment, the nitrogen permeability was determined at the minimum pressure (0.5 MPa) of all-round core samples compression.
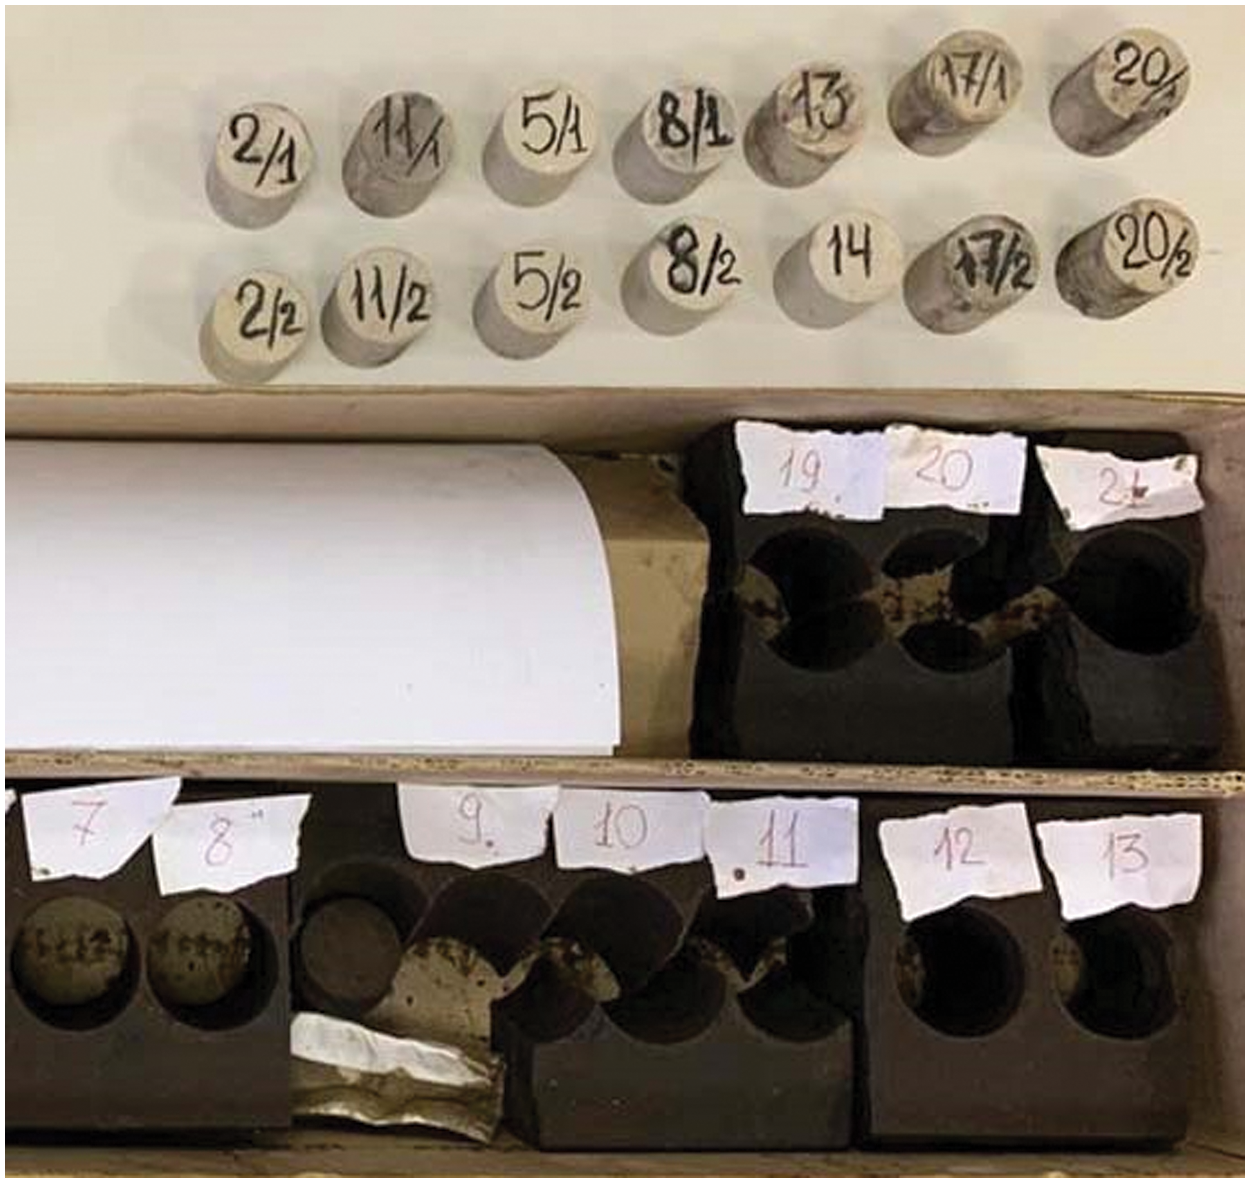
Figure 1: Picture of original core material and core samples prepared for testing
The average porosity of the samples was 22.4%, and the permeability was 656 mD. For further long-term experiments, several standard samples were selected, having the highest permeability, without natural fractures, and represented only by sandstone (with no clay inclusions). In the selected samples, residual water saturation was created using a reservoir water model, oil saturation was simulated with kerosene.
2.2 Program of Long-Term Studies of Core Samples
For long-term studies of samples, the UIK-5VG laboratory equipment was used, which allows measuring the permeability of the rocks during fluid filtration, while it is possible to vary the pore pressure and core sample compression pressure. At the UIK-5VG, the end faces of the sample are rigidly fixed, and compressive pressure are created on the side surface of the sample. Below are the equations for determining the required values of the reservoir and compressive pressure in accordance with the given reservoir conditions.
The value of vertical stresses was determined from the following equation:
The following equation also can be used:
For the considered oil field conditions the parameter γ was set equal to 0.022 MN/m3. In this case, for an average core sampling depth of 1489 m, the vertical stress is 32.8 MPa. Effective vertical stress is defined as:
The initial vertical effective stress is 21.9 MPa. The effective horizontal stress can be found in the equation:
As follows from Eq. (4), the initial horizontal effective stress is 10.3 MPa. In the experimental research, the average effective stress should correspond to the average effective stress in the reservoir:
and equal to 14.2 MPa.
The constant conditions of the experiment are usually the initial reservoir pressure and the gas saturation pressure. At the same time, if the reservoir pressure falls below the saturation pressure, it should also be taken into account. For the considered reservoir the saturation pressure is 8.5 MPa, however, the reservoir pressure has already decreased to 7.5 MPa, in this regard it is advisable to take the limit value of the reservoir pressure of 5 MPa.
Taking into account that at the UIK-5VG the ends of the samples are rigidly fixed and using the equations of the elasticity theory, the effective stresses on the ends is determined by the equation:
Thus, the average stress in the sample can be determined from the following equation, taking into account the fact that for the standard sample, the side surface area is 2 times larger than the end area:
After transformation:
The effective stress from the compression pressure at the UIK-5VG is determined by the following equation:
As a result, we obtain the ratio based on which it is possible to determine the compression pressure in the experiment:
And the final equation is following:
Based on this equation, it is possible to determine the compression pressure during testing of core samples, knowing the effective stress and reservoir pressure under-conditions. Table 1 shows the program of the experiments, obtained according to the above equations. As can be seen from Table 1, the total time for each experiment was 39 h. It should be noted that the research program included three loading cycles for 11.5 h at three different values of effective stresses. The first loading cycle corresponds to the initial reservoir conditions (effective stress 14.2 MPa) and is required to reach the initial value of the core samples’ permeability. Further, this permeability value will be used to determine the nature of the relationship between permeability and increasing effective stresses.
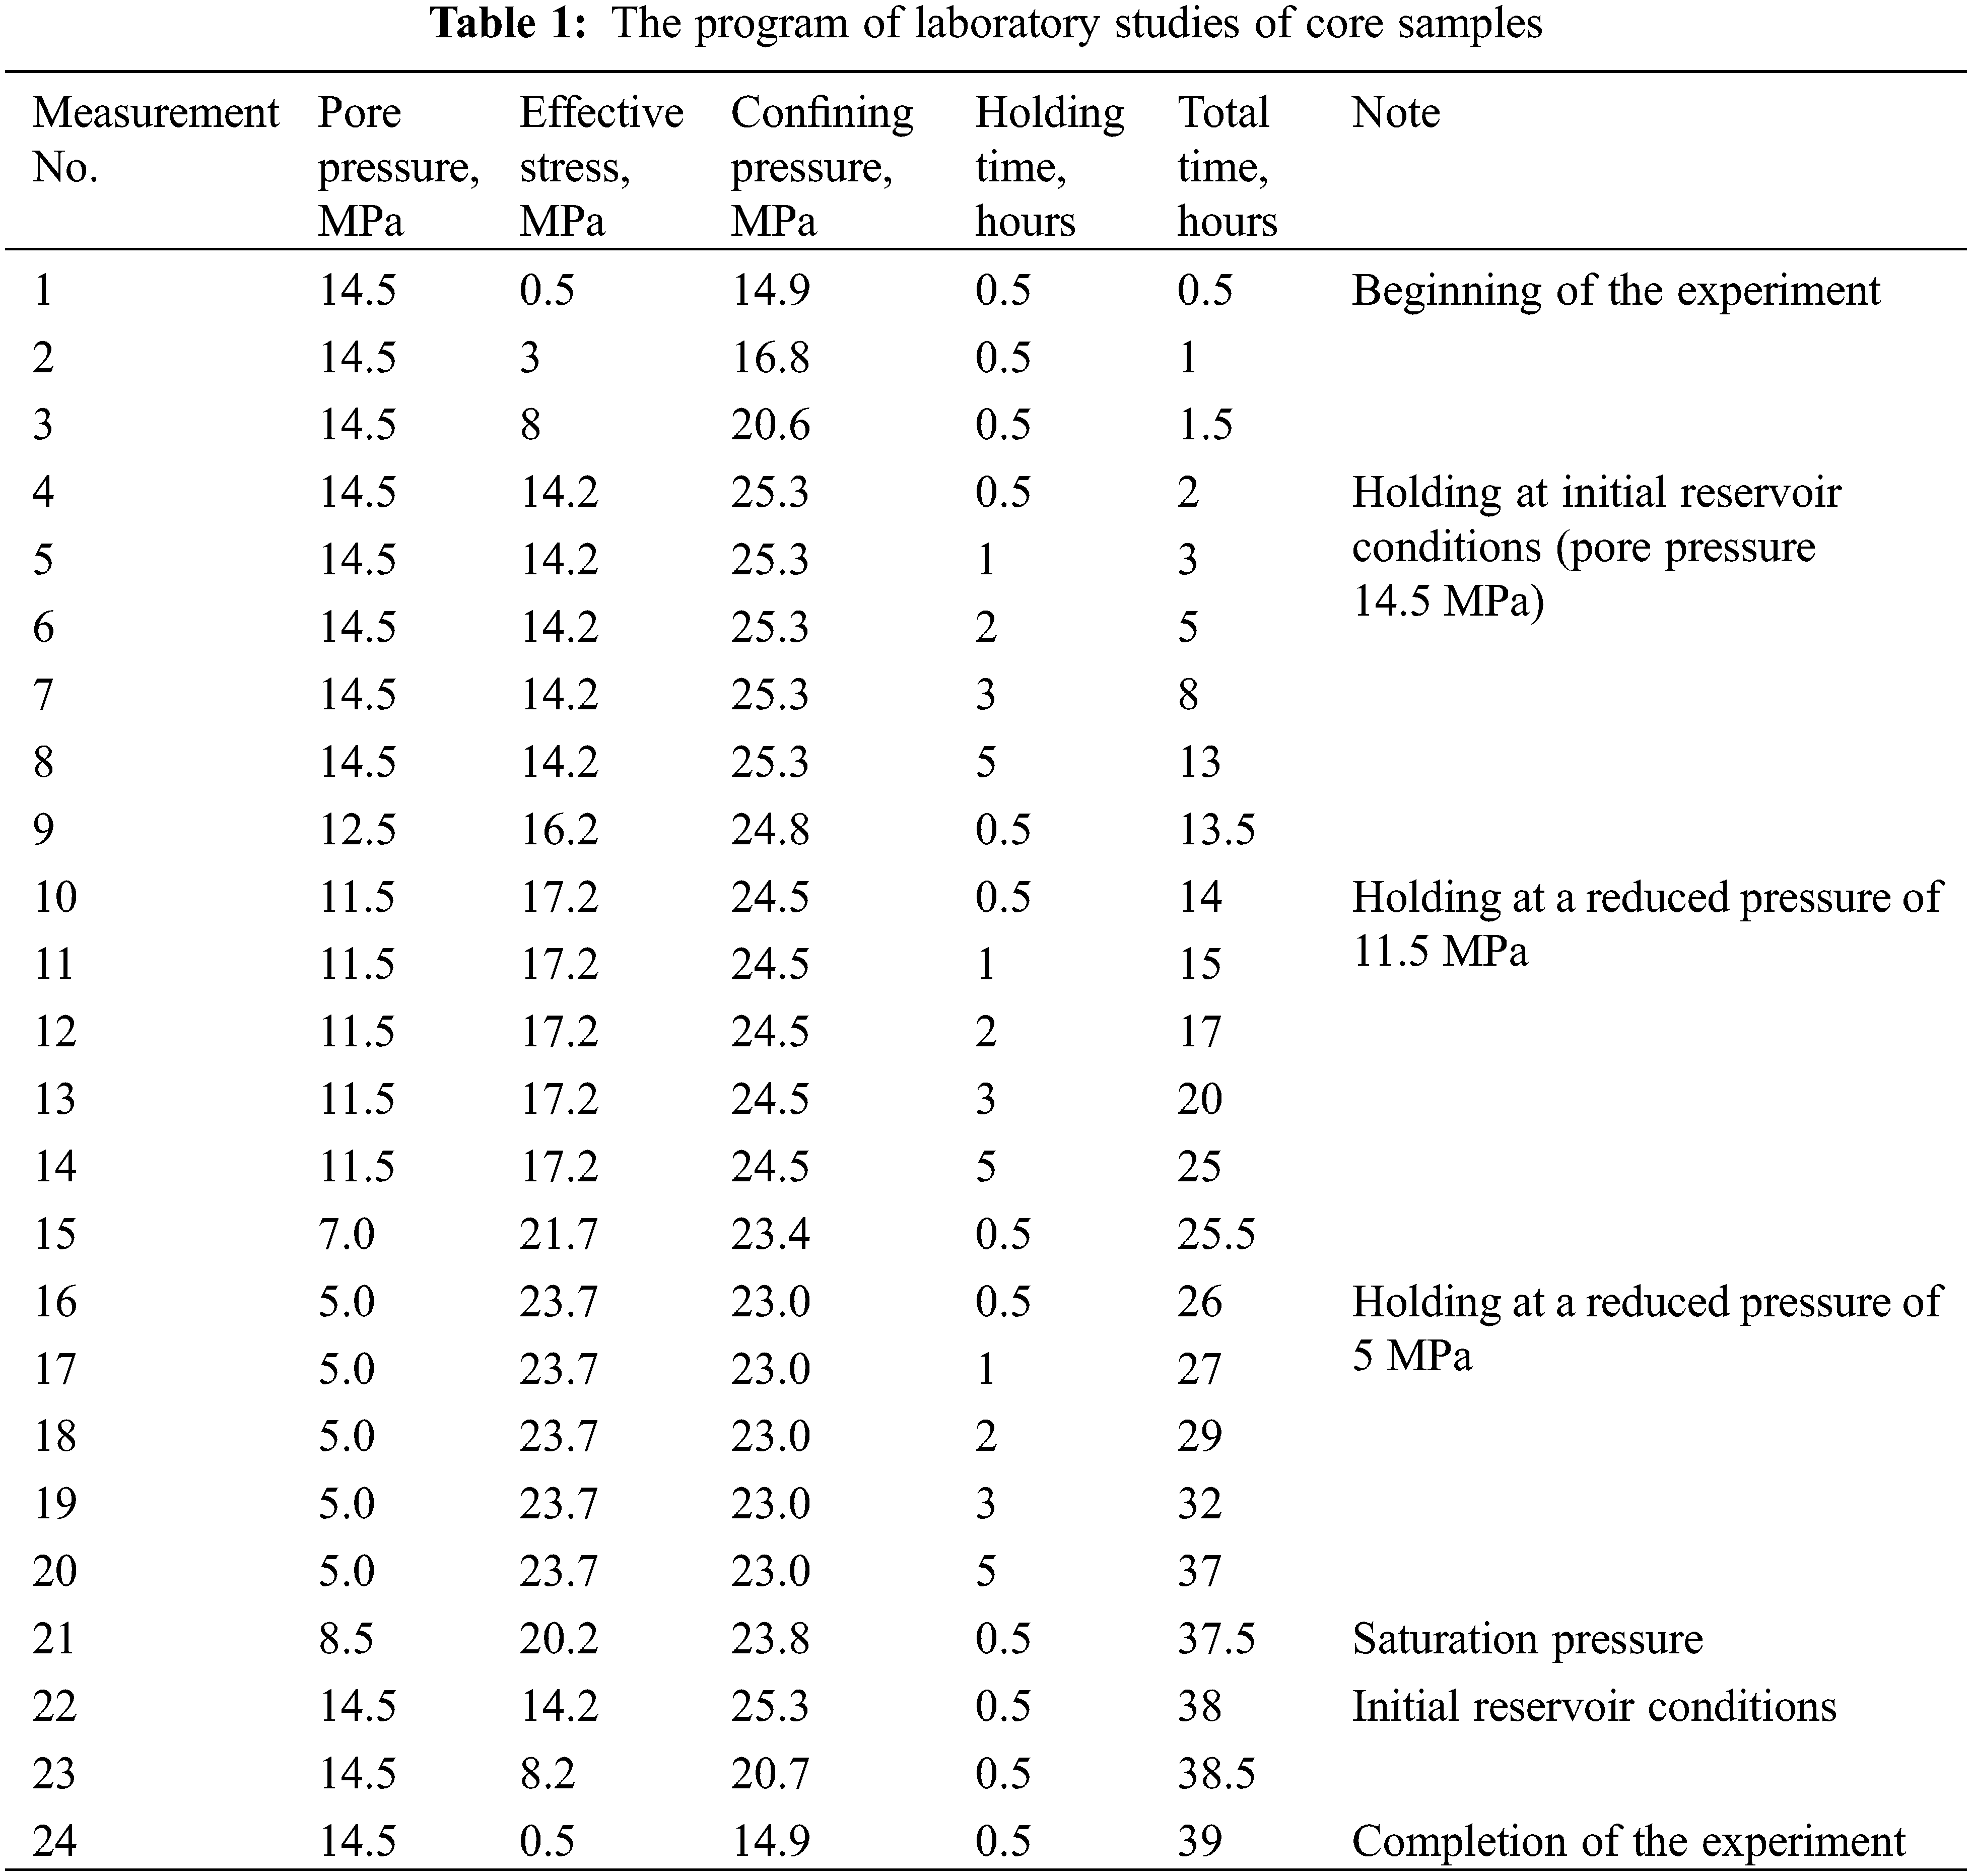
The next loading cycle at constant effective stresses corresponded to the decrease of reservoir pressure by 3 MPa (effective stress is 17.2 MPa), and the last loading cycle simulated the ultimate decrease in reservoir pressure to 5 MPa, i.e., by 9.5 MPa (effective stress is 23.7 MPa).
As can be seen from the research program, in each loading cycle, 5 permeability measurements were made, while the holding step of loading was gradually increased from 0.5 to 5 h. This is due to the fact that at the constant effective stress, the change in permeability has a damped character, and a more discrete change in this characteristic does not make sense.
2.3 Results of the Core Samples Long-Term Studies and the Relationship between Changes in Permeability and Effective Stresses Determination
In total, long-term studies were carried out on the three different core samples. For example, Fig. 2 shows the results of such an experiment for the one sample, which shows the changes in permeability depending on the effective stresses and the experiment duration. As can be seen from Fig. 2, with an increase in effective stresses to the initial reservoir conditions value (14.2 MPa), an intensive permeability decrease from 745 to 563 mD, or by 24.4% is observed.
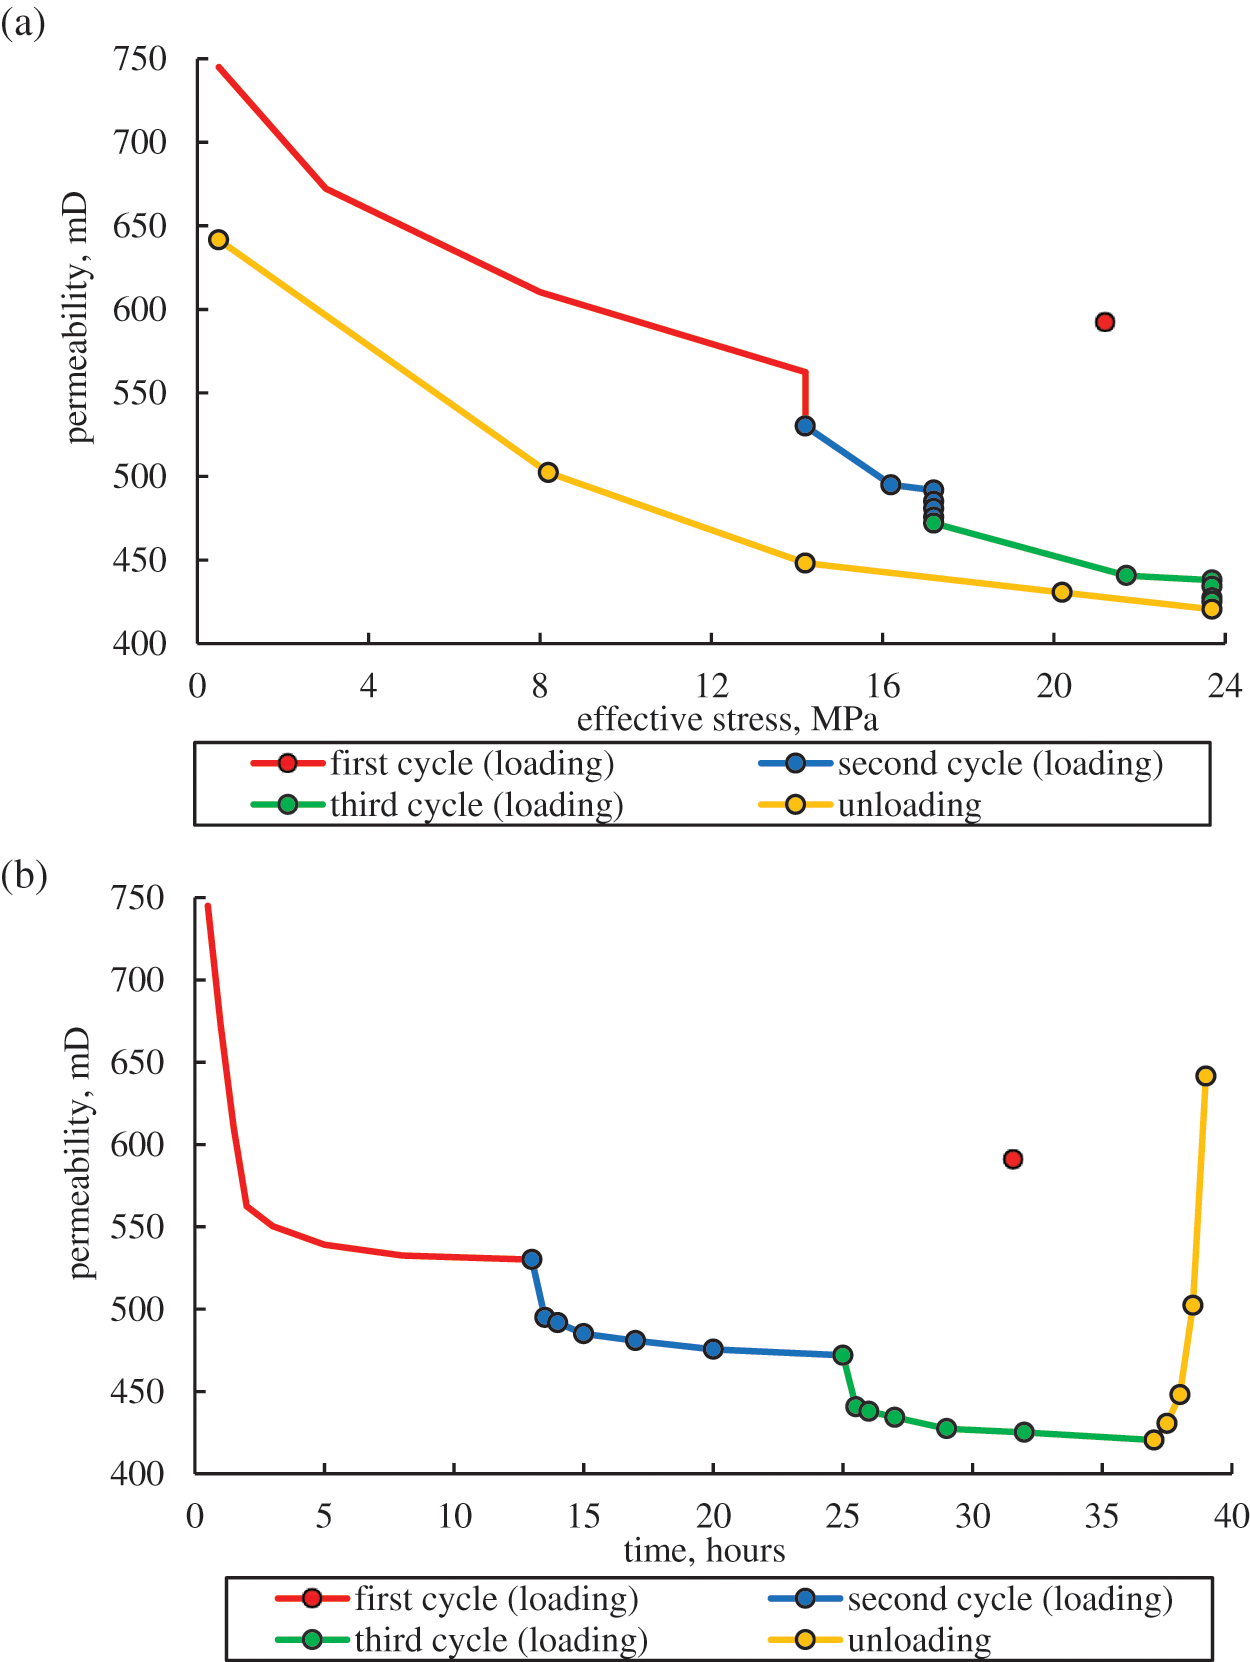
Figure 2: Change in the permeability of the core sample during the experiment depending on the effective stress (a) and time (b)
Then, in the process of holding the sample under the constant effective stress of 14.2 MPa (initial reservoir conditions), the permeability of the sample also decreases from 563 to 530 mD or by 5.9%, which is caused by viscoplastic rock deformations. With the further effective stresses increasing, the permeability continues to decrease, including under constant effective stresses of 17.2 and 23.7 MPa, which corresponds to the decrease in reservoir pressure by 3 and 9.5 MPa, respectively. As can be seen from Fig. 2b, in each holding cycle under the constant effective stress, the change in permeability has the damping character, which indicates that the viscoplastic rock deformations tend to the limit value. It also should be noted that when the effective stresses (reservoir pressure recovery) were restored to the initial value of 0.5 MPa, the permeability did not recover to its initial value and has a value of 642 mD, which is 86.2% of the initial value of 745 mD. Thus, we can establish that the viscoplastic strains of the sample are 13.8%.
In Fig. 3, the blue circles show the averaged relative permeability values for all three tested samples, which were determined from the last results in each core sample holding cycle under the constant effective stress. The permeability value was related to its limiting value during the first holding cycle, which corresponds to the initial reservoir conditions. As can be seen from Fig. 3, the maximum decrease in permeability with a decrease in reservoir pressure from 14.5 to 5 MPa, on average, amounted to 20.6%, which is a very significant value and, undoubtedly, should affect the well’s productivity. It should be noted that in this case, the approximating function should be built from the effective stresses corresponding to the initial reservoir conditions (14.2 MPa).
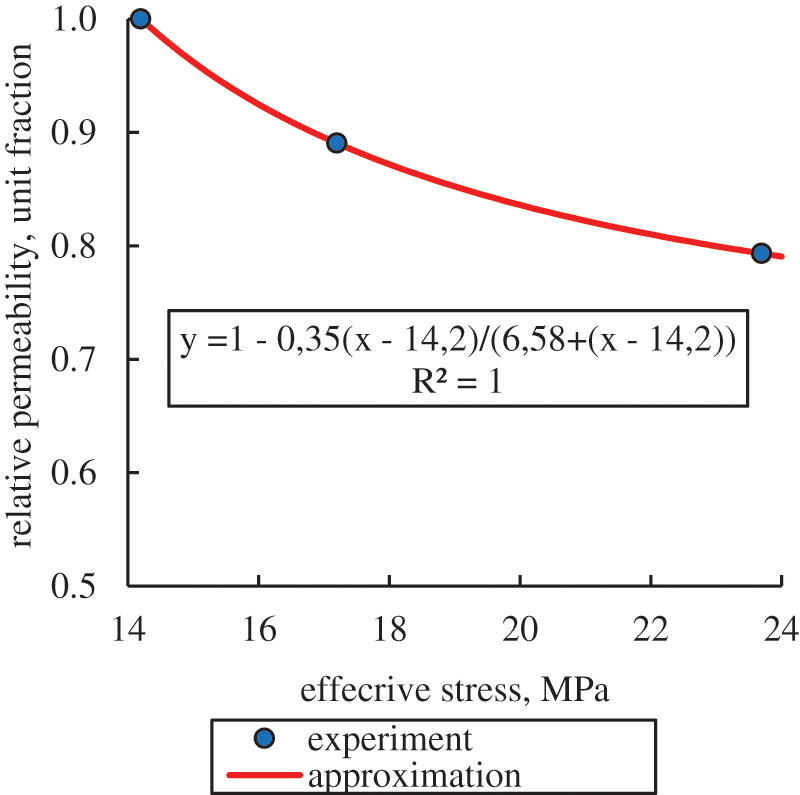
Figure 3: Approximation of the average change in relative permeability determined on the basis of experiments for the range of real reservoir and bottomhole pressures
In scientific publications, various equations that describe the change in permeability depending on effective stresses are used [16–19]. In various studies quite often the changes in the porosity of samples are first determined from effective stresses or reservoir pressure, and then the changes in permeability are determined from the porosity-permeability relationships [1,4,17,20]. It was shown in [15] that the experimental relationships of the decrease in the relative permeability of terrigenous reservoirs with an increase in effective stresses (a decrease in fluid pressure) are quite accurately approximated by the following analytical function:
After statistical processing of the laboratory experiments results, the following analytical equation of the change in the relative permeability of the reservoir rock under the influence of effective stresses was obtained (Fig. 3):
This equation was later used in the numerical modeling of the near-wellbore zone stress state during the process of reservoir and bottomhole pressure drawdown.
3 Numerical Modeling of the Near-Wellbore Zone Stress State and Well Productivity Determination Considering Changes in Permeability at Various Effective Stresses under Conditions of Reservoir and Bottomhole Pressure Decrease
At present, poroelasticity equations are often used to determine the stress state of reservoir rocks in the oil and gas fields [1,4]. In this case, the mutual influence of rock stresses and the inhomogeneous distribution of the reservoir are taken into account. In this work, for numerical calculations, the ANSYS finite element modeling software package was used, which has proven itself well in solving geomechanical problems associated with the development of hydrocarbon fields [21,22].
The fluid-containing porous medium was modeled by representing it as a two-phase material (liquid and rock) and applying the basic principles of Biot theory. At the same time, the fluid flow was considered single-phase. It was assumed that the porous medium is completely saturated by fluid. The basic equations for solving the problem of consolidating the Biot theory implemented in the ANSYS software package, are given below:
The relationship between the effective stress tensor and elastic deformations of the rock skeleton:
The relationship between fluid flow and pore pressure is described based on Darcy’s law:
This study assumed that after the decrease in reservoir or bottomhole pressure, a sufficient amount of time passed for the fluid filtration mode to be established, in this case, at each calculation step, the initial conditions corresponded to the boundary conditions. The poroelastic model implemented in ANSYS allows for the setting of two types of boundary conditions for two simulated media (liquid and solid phase). For the liquid, either the liquid filtration rate or its pressure at the model boundaries can be set. For the solid phase (reservoir rock), either displacements or stresses at the boundaries of the model can be specified. It is also assumed in the calculations that the liquid is incompressible.
The simultaneous equations are derived from the element formulations which are based on the principle of virtual work [23]:
The left side of Eq. (17) is the virtual work. Taking into account Eqs. (14)–(16), (17), after discretization of differential equations by the finite element method, the connection of the adjoint problem can be expressed as a system of equations [24]:
The matrix E can be defined as the difference: T – D.
The system of Eq. (18) is divided into two components:
– stress equations:
– flow equations:
The connection between the equations is carried out through the matrix L.
For the numerical calculations, the four-node quadrangular finite element CPT212 was used, according to the ANSYS classification. This element is used to solve poroelasticity problems.
The sensitivity of the finite element grid to the calculation results was tested for the case when the reservoir pressure is equal to the initial value (14.5 MPa) and the bottomhole pressure drawdown is equal to the maximum value (9.5 MPa). In this case, the maximum pressure drop occurs in the bottomhole zone of the well, which is the most sensitive factor for numerical calculation. The remaining characteristics were taken in accordance with Table 3. For the calculations, the finite element scheme shown in Fig. 4 was used. For comparison, the filtration rate characteristic on the well’s wall was used, on the basis of which the well productivity was subsequently determined.
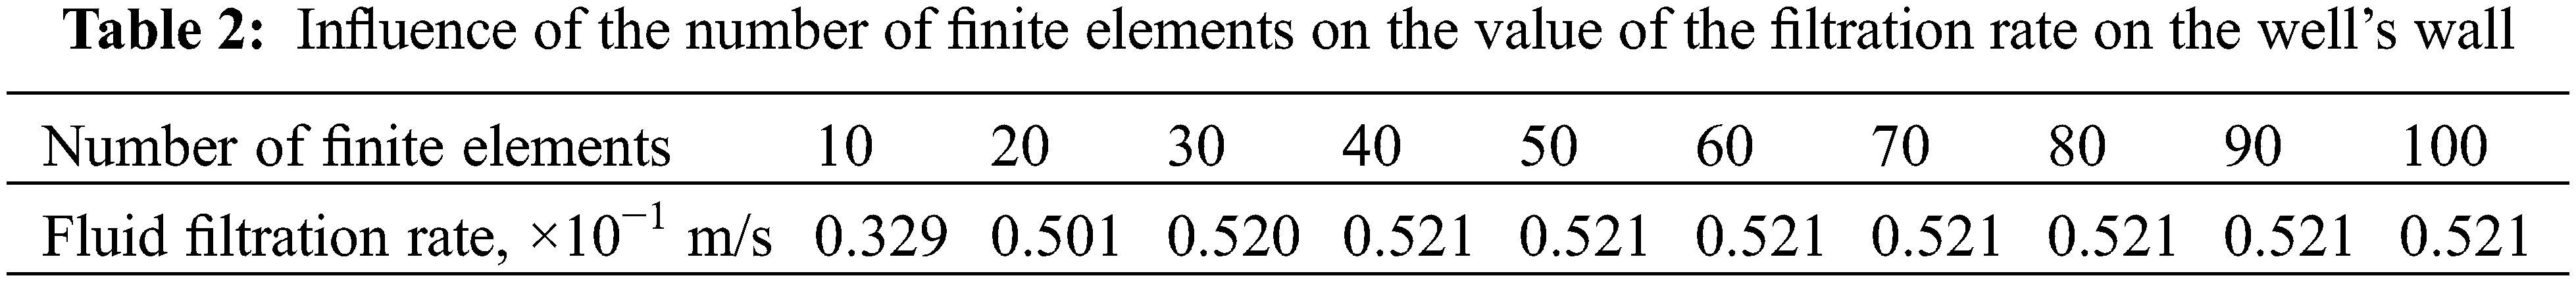
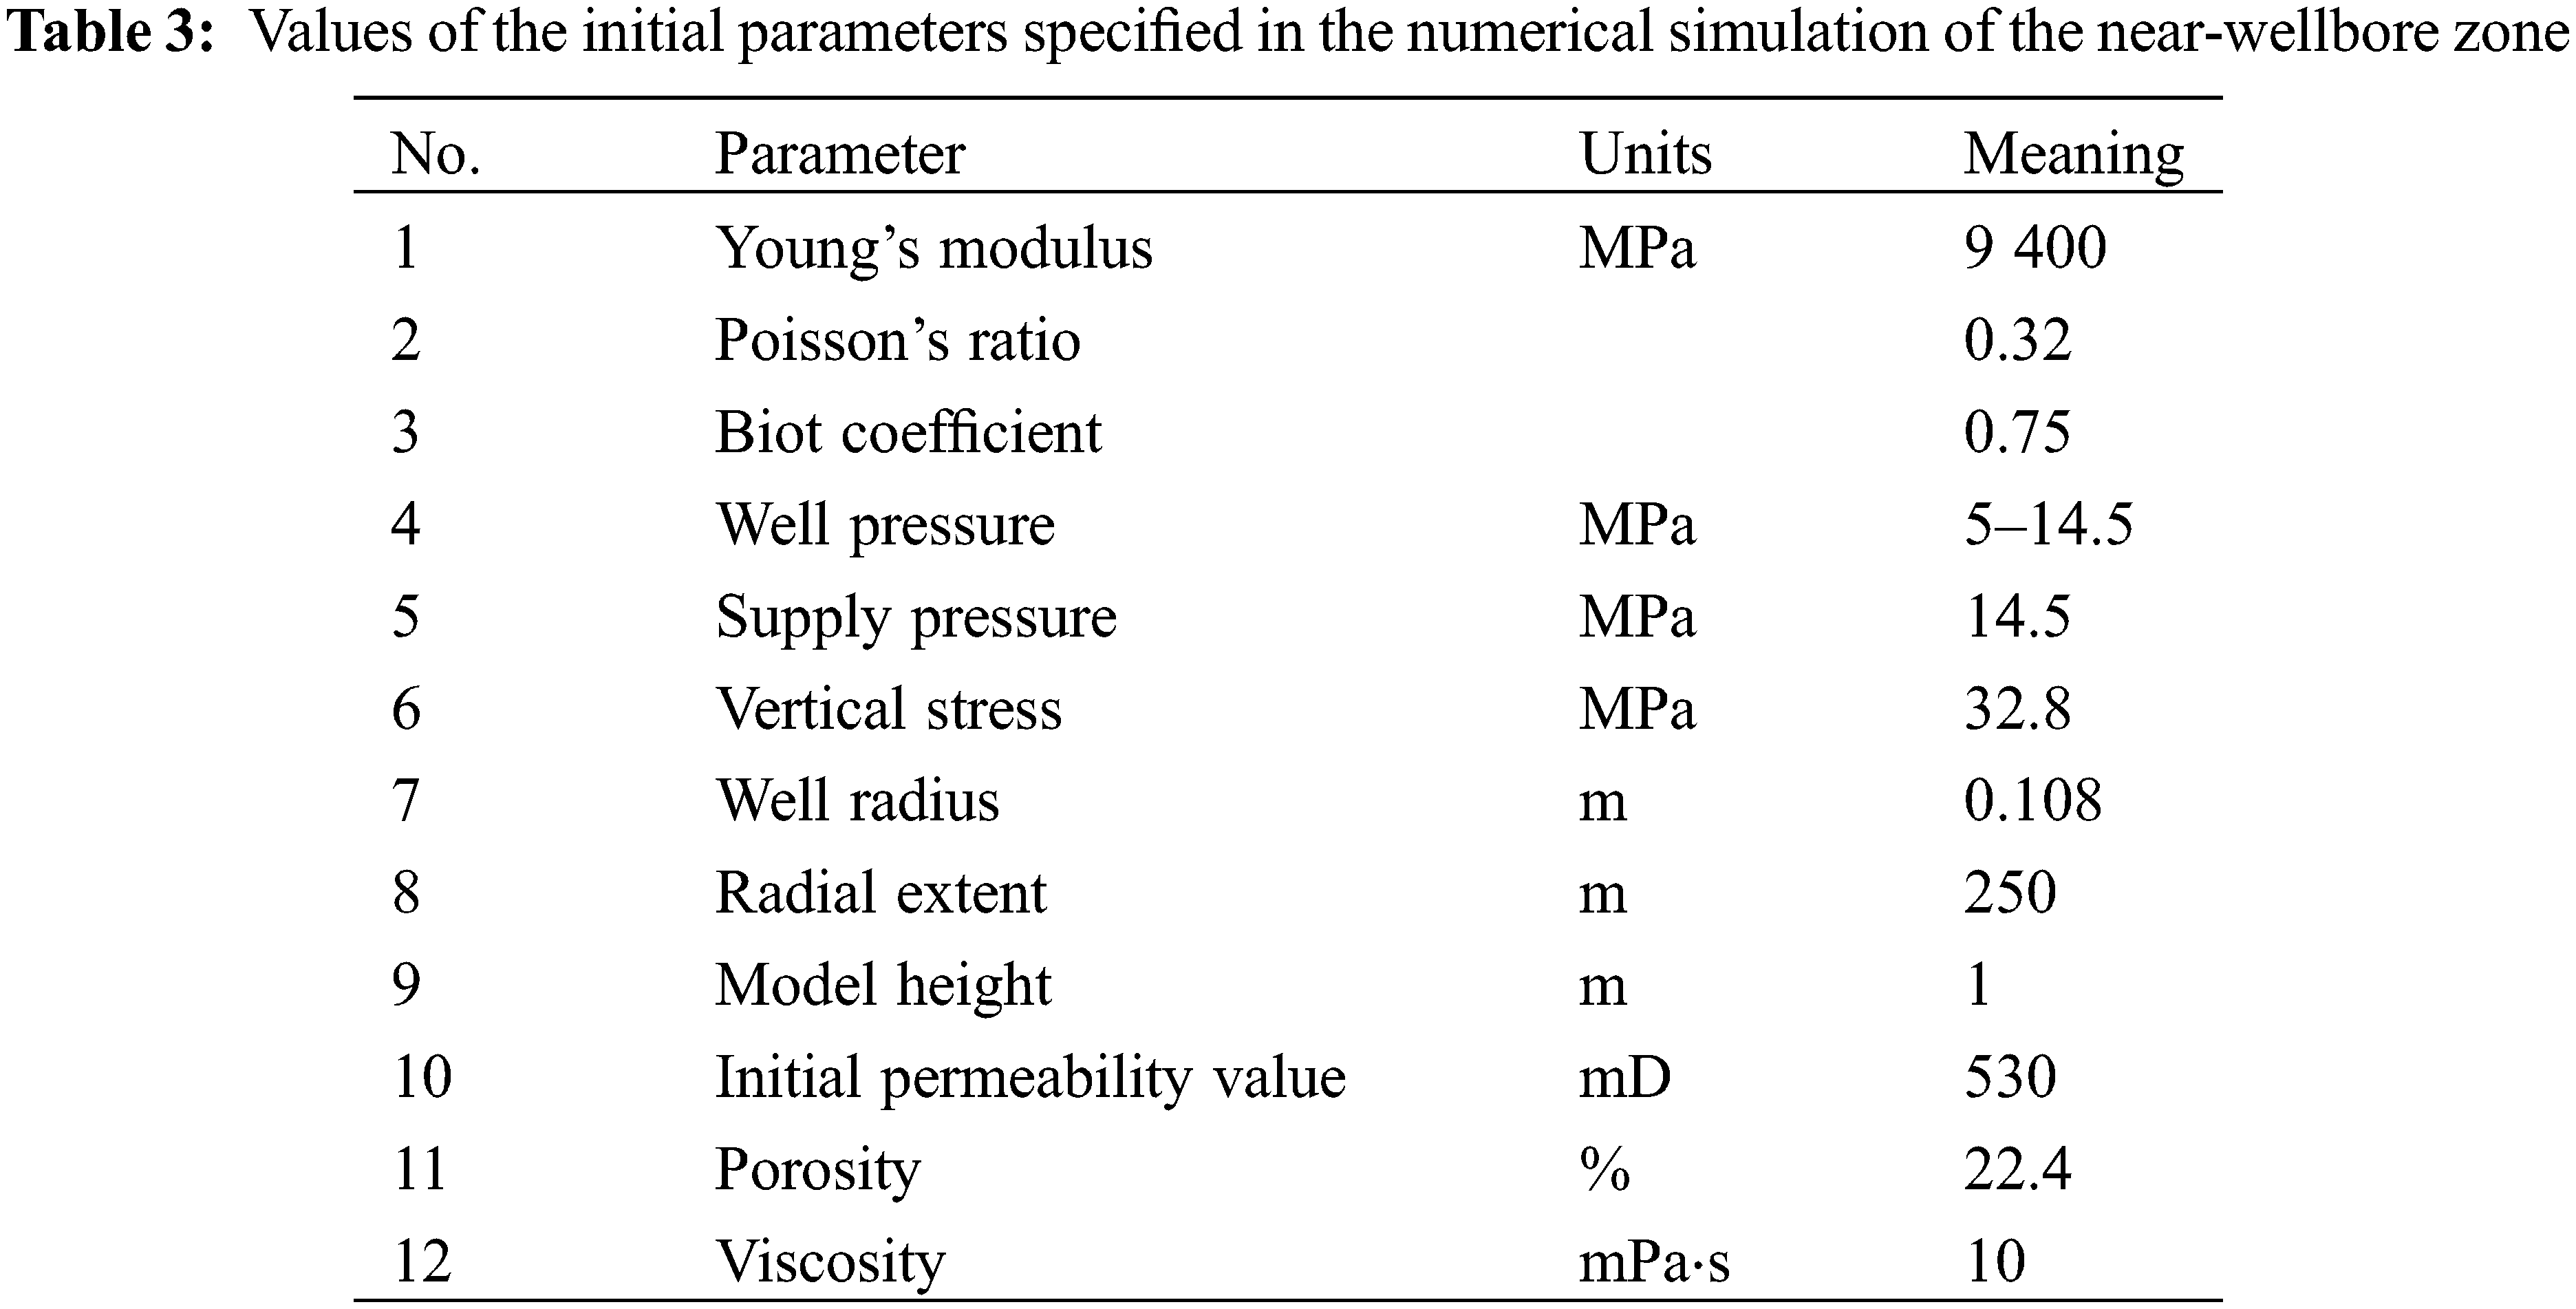
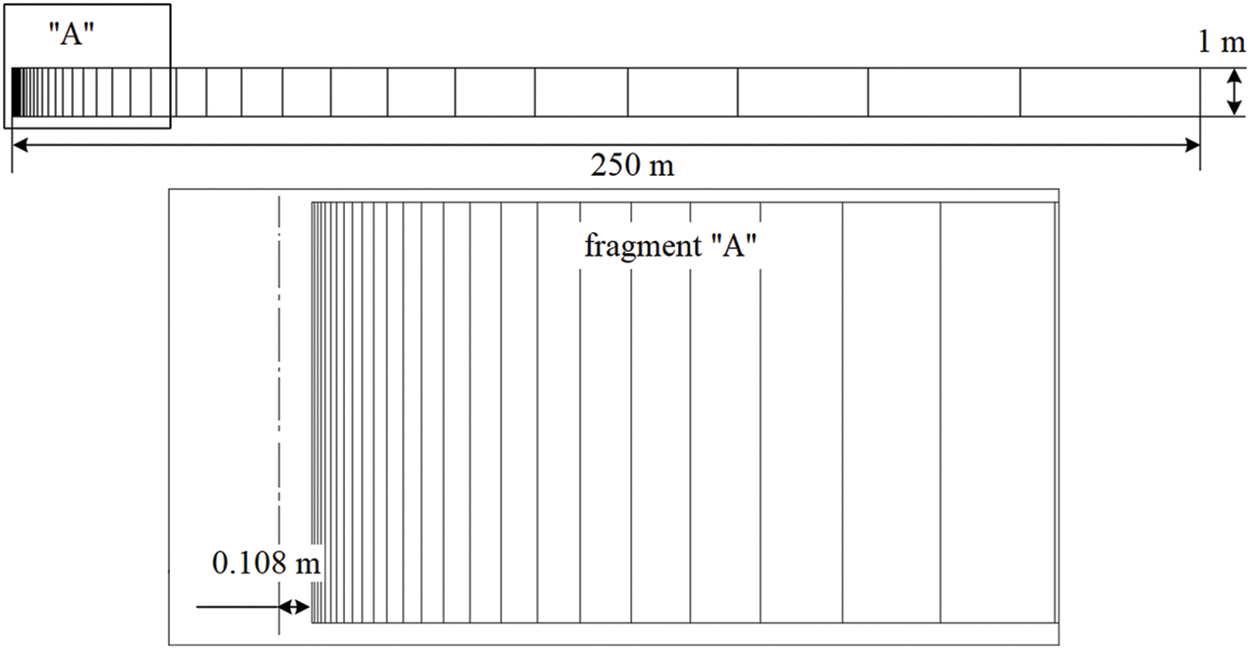
Figure 4: Finite element scheme of an axisymmetric numerical model of the near-wellbore zone used to simulate the stress state of the reservoir near the well
Table 2 shows the calculation results. The number of finite elements varied from 10 to 100 with a step of 10. As can be seen from this table, starting from 40 finite elements, there is no difference in the filtration rate. Thus, the optimal number of finite elements in the design scheme was chosen, equal to 40.
Since it is not possible to analytically determine the fluid filtration rate on the well’s wall, taking into account the changing effective stresses and rock permeability, the comparison of the results was carried out on a model with a constant permeability equal to the initial value (530 mD), while, as in Section 3.3, the maximum bottomhole pressure drawdown was set equal to 9.5 MPa. Analytically, the filtration rate was determined based on the Dupuis equation for the flow rate:
Dividing the well flow rate by the area of the lateral surface of the well (2πrwh), an analytical relationship for determining the fluid filtration rate on the well’s wall was obtained:
Substituting into expression (23) the above values of permeability and bottomhole pressure drawdown, the radius of the well and the radial extent from Table 3, obtained that the value of the fluid flow rate will be 0.5791 10−1 m/s. Using similar initial data, the fluid flow rate calculated in ANSYS amounted to 0.6019 10−1 m/s. The difference in the analytical and numerical calculations is 3.8%, which is quite acceptable. Apparently, the difference in the calculations is due to the fact that in numerical calculations, the pressure distribution in the near-wellbore zone is affected not only by drawdown pressure, but also by the change in effective stresses. Thus, a comparison of calculations shows that the chosen method of numerical simulation can be used to calculate the fluid flow filtration rate and well productivity.
3.5 The Results of Numerical Simulation
Table 3 shows the initial data used for numerical simulation. Fig. 4 shows the finite element axisymmetric design scheme used to model the near-wellbore zone. The scheme was created in such a way that near the wall there was a maximum concentration of finite elements, since in this area there is the greatest change in most of the calculated parameters: reservoir pressure, effective stresses and reservoir permeability. As the boundary conditions of the model, the pressure on the well’s wall and on the radial extent and the vertical stress were set. On the lower boundary of the model, zero displacements along the normal to the surface were set.
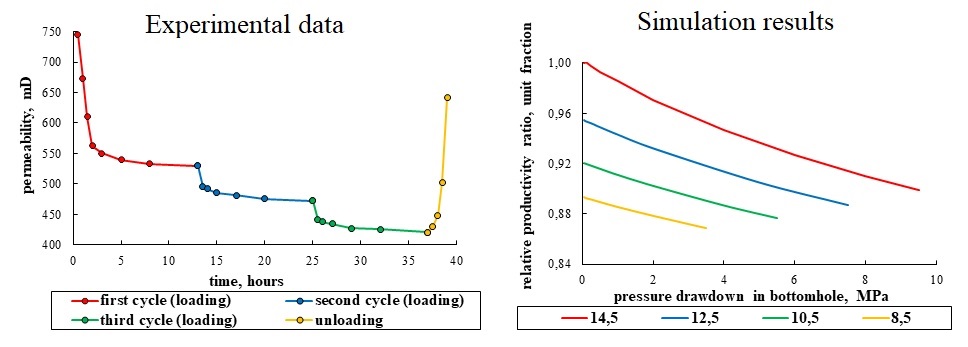
Using the developed finite element scheme, multivariant modeling of the near-wellbore zone was performed. In the calculations, the bottomhole pressure drawdown value and the pressure at a distance from the well were varied, which simulated a decrease in reservoir pressure. Figs. 5 and 6 present the main results of the simulation: the change in the relative permeability of the near-wellbore zone and the relative productivity ratio of the production well depending on the bottomhole pressure drawdown. Also in the calculations, the reservoir pressure varied. Relative permeability was defined as the current permeability divided by the permeability at initial reservoir pressure (calculated maximum value). The relative productivity ratio was determined in a similar way-the current calculated value of the productivity ratio was divided by its maximum value, which in this case corresponded to the initial reservoir pressure and the minimum bottomhole pressure drawdown.
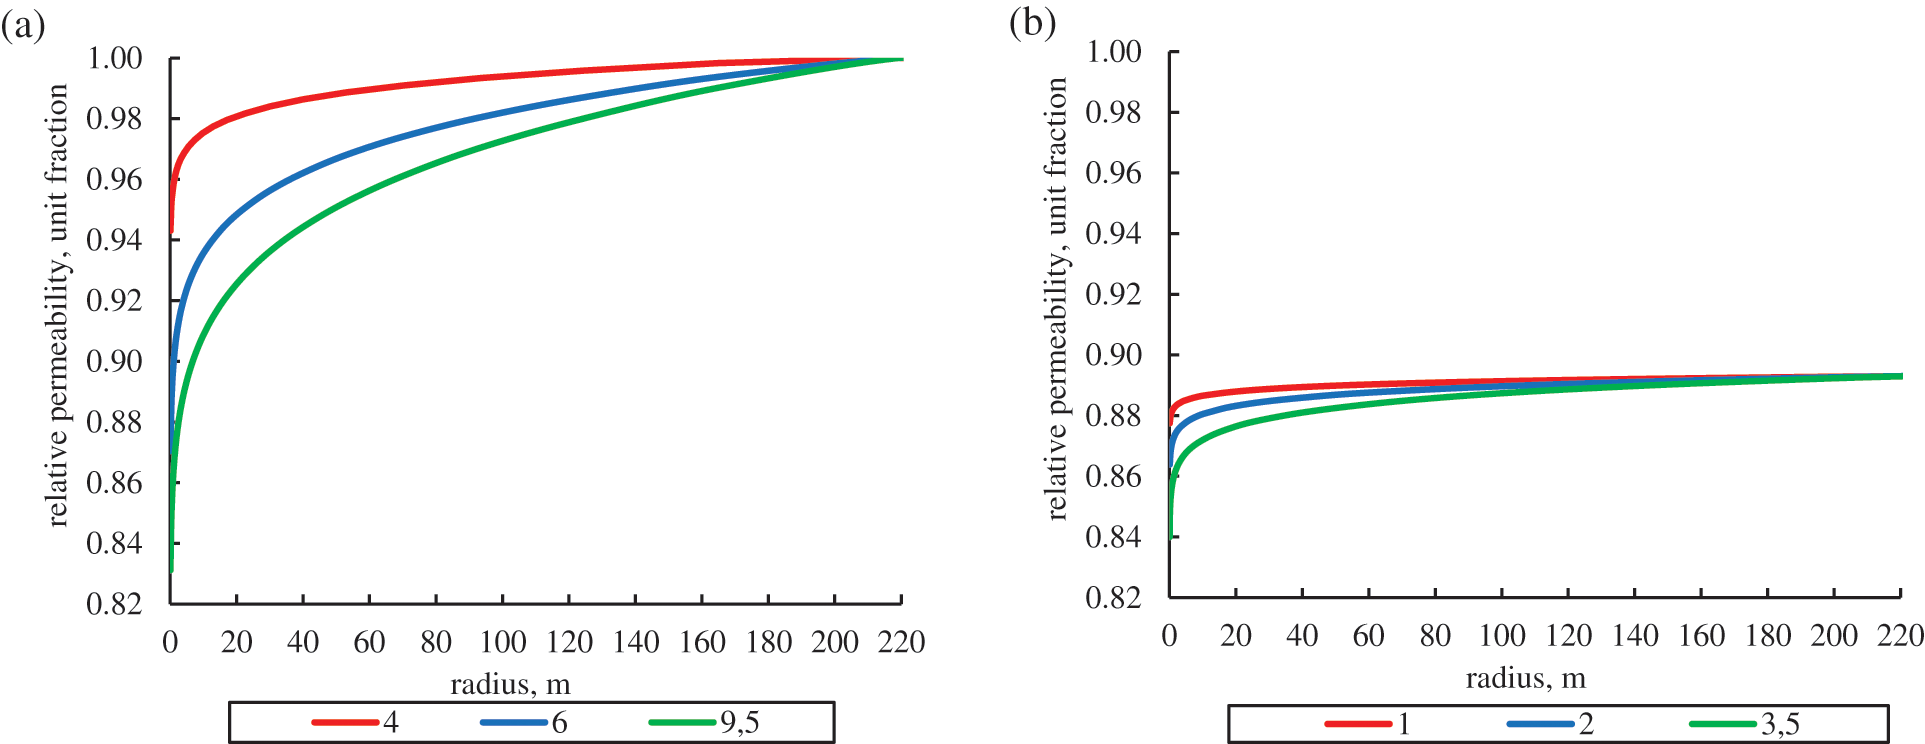
Figure 5: Change in the relative permeability of the formation depending on the distance from the well at different drawdown values (in MPa) for an initial reservoir pressure of 14.5 MPa (a) and with a decrease of reservoir pressure to 8.5 MPa (b)
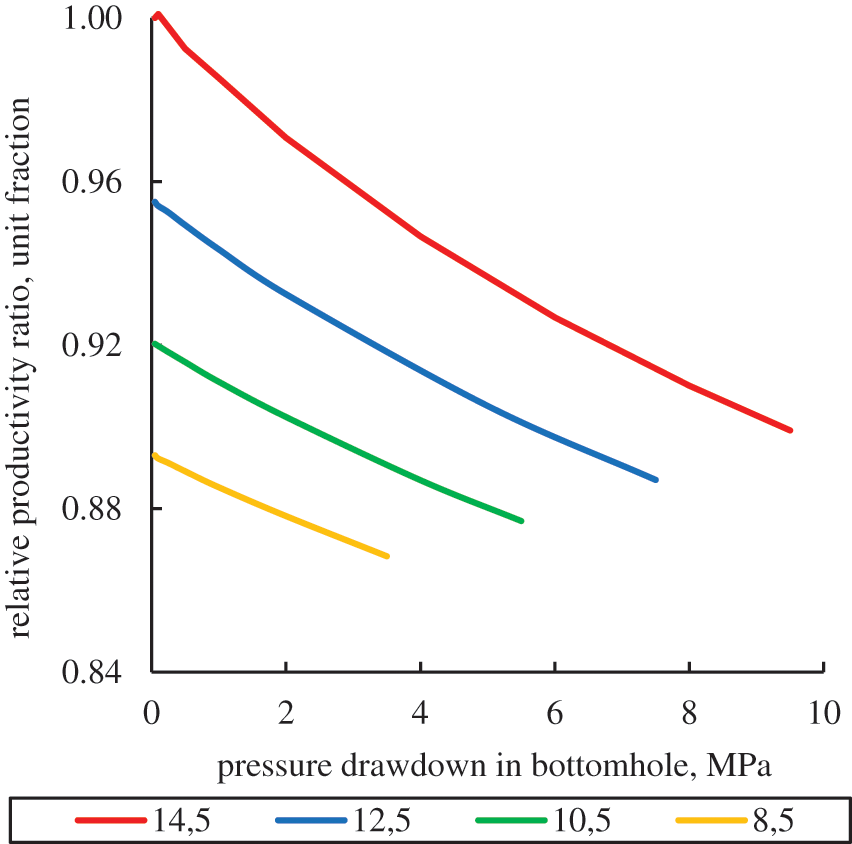
Figure 6: Change in the relative well productivity depending on pressure drawdown for different values of reservoir pressure (in MPa)
As can be seen from Fig. 5, an intense decrease in permeability is observed near the well, caused by a decrease in bottomhole pressure and the formation of a depression funnel. The magnitude of the decrease in permeability increases with an increase in bottomhole pressure drawdown, which is caused by the effective stresses increasing. At the initial reservoir pressure, depending on the bottomhole pressure drawdown, the permeability decreases from 6% (drawdown 4 MPa) to 17% (drawdown 9.5 MPa).
Reducing the reservoir pressure correspondingly reduces the permeability in the entire near-wellbore zone. So, with a decrease in reservoir pressure from 14.5 to 8.5 MPa with zero bottomhole pressure drawdown, the permeability in the entire near-wellbore area decreases by 8% (Fig. 5b). When bottomhole pressure drawdown increased, the permeability decreases by an additional 8.7%.
The most objective indicator of well exploration in conditions of changing reservoir and bottomhole pressure is the productivity ratio, which was determined as the well flow rate divided by the bottomhole pressure drawdown. Next, the relative productivity ratio was calculated (Fig. 6) as the current productivity ratio divided by the maximum value of this parameter.
As can be seen from Fig. 6, at the initial reservoir pressure of 14.5 MPa and maximum bottomhole pressure drawdown of 9.5 MPa, the productivity ratio decreases by 10%, which is caused by the compaction of the reservoir rock under the increasing effective stresses. With a decrease in reservoir pressure, a decrease in well productivity is observed. Thus, with a minimum modeling reservoir pressure of 8.5 MPa and a maximum bottomhole pressure drawdown of 3.5 MPa, the relative productivity ratio will be 87% of the maximum value, i.e., will decrease by 13%.
In this work, the selection and preparation of core material taken from the terrigenous oil productive object was carried out. To study the effect of the reservoir and bottomhole pressure drawdown on the reservoir permeability, a special program of long-term core samples studies was developed, taking into account the real geomechanical stresses in the reservoir and the decrease in reservoir pressure from 14.5 MPa to 11.5 and to 5 MPa. An important feature of the special research program was the three loading cycles of holding core samples under long-term action of effective stresses to consider viscoplastic deformations of the reservoir rock.
Long-term experimental studies have shown a decrease in permeability, both in the process of increasing the stresses and under the influence of constant stresses. Thus, with an increase in effective stresses from 0.5 to 14.2 MPa (initial reservoir conditions), the permeability decreased by 24.4%. Under the three loading cycles, the decrease in permeability was from 5.8% to 4%, which indicates the need to consider the effects of viscoplastic deformations in laboratory studies, i.e., the need for long-term holding of samples at constant effective stresses, simulating reservoir and bottomhole pressure drawdown. In this case, more reliable permeability values are the last values in each loading cycle. Based on these limit values, it was determined that reservoir pressure decreasing from the initial value of 14.5 to 5 MPa leads to permeability decreasing by 20.6%.
Based on the results of long-term experiments, an approximating function was determined in the form of a hyperbolic dependence, which describes with great accuracy the regularity of the decrease in permeability with an increase in effective stresses (decrease in reservoir pressure). The determined dependence was further used in numerical finite element modeling of the near-wellbore zone stress state.
Numerical simulation of the effective stresses changes was carried out in the ANSYS software using the poroelasticity relations. The reservoir and bottomhole pressure parameters were varied. The simulation results showed that due to the occurrence of a depression funnel near the well, an intensive decrease in reservoir permeability occurs. At the initial reservoir pressure and maximum bottomhole pressure drawdown of 9.5 MPa, the decrease in permeability reaches 17%. If the reservoir pressure is set to 8.5 MPa, then the permeability in the whole reservoir decreases by 8%, if at the same time a maximum bottomhole pressure drawdown of 3.5 MPa is created, then the permeability will decrease by an additional 8.7%.
In addition to the change in permeability, the numerical simulation determined the productivity ratio of the well based on the known flow rate and bottomhole pressure drawdown. Numerical modeling showed that for the initial reservoir conditions, an increase in bottomhole pressure drawdown to a maximum value of 9.5 MPa will lead to a decrease in the productivity ratio by 10%, which is a very significant value. With a decrease in reservoir pressure to 8.5 MPa and the bottomhole pressure drawdown of 3.5 MPa, the limiting decrease in the productivity ratio will be 13%. In general, the results of numerical and experimental modeling of changes in the permeability of the reservoir rock with an increase in effective stresses showed a very significant effect on the well productivity. In this case, such phenomena that occur not only in the near-wellbore zone, but in the whole reservoir should be considered when the field development designing.
Experimental and numerical modeling of the effect of changes in reservoir and bottomhole pressures on the terrigenous reservoir rock permeability and well productivity was carried out. Based on the research results, the following main conclusions can be drawn:
1. To study the influence of effective stress changes on the reservoir rock permeability a special long-term research program was developed that reliably considers reservoir stress state and pore pressure changes. At the same time, the research program also included three loading cycles of core samples holding at constant effective stresses to take into account viscoplastic deformations of the rock.
2. The research results showed a decrease in permeability, both with the increase in effective stresses and with their constant value, which indicates the influence of not only elastic, but also viscoplastic deformations regarding the reservoir rock permeability. Experiments have shown that if the reservoir pressure decreases from the initial 14.5 to 5 MPa, then the permeability will decrease by 20.6%, which is a very significant value. Based on the experiments, the analytical dependence describing the decrease in permeability with the increase in effective stresses was obtained and was used in numerical modeling of the near-wellbore zone.
3. Numerical modeling by using the finite element method, considering the poroelasticity ratios, also showed the decrease in permeability with the increase in bottomhole pressure drawdown and the decrease in reservoir pressure. So, under the initial reservoir conditions and the maximum bottomhole pressure drawdown of 9.5 MPa, the decrease in permeability reaches 17%. With a reduced reservoir pressure to 8.5 MPa, the permeability in the whole reservoir will decrease by 8%, if at the same time a maximum bottomhole pressure drawdown of 3.5 MPa is created, then a further decrease in permeability by an additional 8.7% will occur.
4. The simulation of changes in the well productivity ratio shows similar results. For the initial reservoir conditions and the bottomhole pressure drawdown of 9.5 MPa, the well productivity ratio will decrease by 10%. With the reservoir pressure of 8.5 MPa and the bottomhole pressure drawdown of 5 MPa, the value of the decrease in the productivity ratio will be 13%.
5. The result of numerical modeling shows a very significant effect of the reduction of reservoir pressure on the reservoir rock permeability and well productivity decreasing; should be considered during future field development designings.
Funding Statement: The research was completed with the support of the grant of the President of the Russian Federation for state support of leading scientific schools of the Russian Federation (Grant No. NSh-1010.2022.1.5).
Conflicts of Interest: The authors declare that they have no conflicts of interest to report regarding the present study.
References
1. Fjear, E., Holt, R. M., Horsrud, P., Raaen, A. M., Risnes, R. (2008). Petroleum-related rock mechanics. Amsterdam: Elsevier. [Google Scholar]
2. Kashnikov Yu, A., Ashikhmin, S. G. (2019). Rock mechanics in the petroleum industry. Moscow: Gornaya Kniga. [Google Scholar]
3. Zhang, Y., Yang, Z., Li, D., Liu, X., Zao, X. (2021). On the development of an effective pressure driving system for ultra-low permeability reservoir. Fluid Dynamics & Material Processing, 17(6), 1067–1075. DOI 10.32604/fdmp.2021.016725. [Google Scholar] [CrossRef]
4. Zoback, M. D. (2007). Reservoir geomechanics, pp. 3–55. New York: Cambridge University Press. [Google Scholar]
5. Popov, S. N., Kusaiko, A. S. (2021). Experimental study of the effect of filtration for low-mineralized water with high temperature on changes in elastic and strength properties of reservoir rocks. Processes in GeoMedia, vol. II, pp. 343–349. Springer, Cham: Springer Geology. DOI 10.1007/978-3-030-53521-6_37. [Google Scholar] [CrossRef]
6. Hu, C., Agostini, F., Jia, Y. (2020). Porosity and permeability evolution with deviatoric stress of reservoir sandstone: Insights from triaxial compression tests and in situ compression CT. Geofluids, 2020, 6611079. [Google Scholar]
7. Popov, S. N. (2015). Influence of mechanochemical effects on elastic and strength properties of reservoir rocks. Neftyanoe Khozyaystvo–Oil Industry, 8, 77–79. [Google Scholar]
8. Kashnikov Yu, A., Shustov D, V., Yakimov S, Y., Krasilnikova, N. B. (2015). Hydrodynamic simulation of part of yurubcheno-tokhomovskoye oil field based on geological geomechanical model. Neftyanoe Khozyaystvo–Oil Industry, 4, 62–67. [Google Scholar]
9. Feng, Y., Liu, Y., Chen, J., Mao, X. (2022). Simulation of the pressure-sensitive seepage fracture network in oil reservoirs with multi-group fractures. Fluid Dynamics & Material Processing, 18(2), 395–415. DOI 10.32604/fdmp.2022.018141. [Google Scholar] [CrossRef]
10. Schutjens, P. M. T. M., Hansen, T. H., Hettema, M. H. H., Merour, J., de Bree, P. et al. (2004). Compaction-induced porosity/permeability reduction in sandstone reservoirs: Data and model for elasticity-dominated deformation. SPE Reservoir Evaluation & Engineering, 7(3), 202–216. DOI 10.2118/88441-PA. [Google Scholar] [CrossRef]
11. Pettersen, O. (2010). Compaction, permeability, and fluid flow in brent-type reservoirs under depletion and pressure blowdown. The Open Petroleum Engineering Journal, 3, 1–13. DOI 10.2174/1874834101003010001. [Google Scholar] [CrossRef]
12. Wang, J., Yan, W., Wan, Z., Wang, Y., Lv, J. et al. (2020). Prediction of permeability using random forest and genetic algorithm model. Computer Modeling in Engineering & Sciences, 125(3), 1135–1157. DOI 10.32604/cmes.2020.014313. [Google Scholar] [CrossRef]
13. Kashnikov, O. Y., Gladyshev, S. V., Popov, S. N., Kashnikov Yu, A. (2010). Optimization of parameters and period of reservoir pressure maintenance system commissioning taking into account changes in reservoir filtration-capacity properties. Neftyanoe Khozyaystvo–Oil Industry, 5, 80–83. [Google Scholar]
14. Sonich V. P., Cheremisin N. A., Baturin Yu, E. (1997). Effect of reducing reservoir pressure in reservoir properties. Neftyanoe Khozyaystvo–Oil Industry, 1997(9), 52–57. [Google Scholar]
15. Popov, S. N., Mazanov, S. V., Zharikov, M. G. (2016). Development of geomechanical model for forecasting changes of reservoir properties of a fracture-pore type of reservoir in the process of reducing the pore pressure (for example, the achimov plays of oil and gas of the far North). Geology, Geophysics and Development of Oil and Gas Fields, 5, 28–35. [Google Scholar]
16. Bohnsack, D., Potten, M., Freitag, S., Einsiedl, F., Zosseder, K. (2021). Stress sensitivity of porosity and permeability under varying hydrostatic stress conditions for different carbonate rock types of the geothermal malm reservoir in Southern Germany. Geothermal Energy, 9, 15. DOI 10.1186/s40517-021-00197-w. [Google Scholar] [CrossRef]
17. To, T., Chang, C. (2019). Comparison of different permeability models for production-induced compaction in a sandstone reservoir. The Journal of Engineering Geology, 29(4), 367–381. [Google Scholar]
18. Xue, Y. (2017). Numerical simulation of coal deformation and gas flow properties around boreholes. Computer Modeling in Engineering & Sciences, 113(4), 429–441. DOI 10.3970/cmes.2017.113.429. [Google Scholar] [CrossRef]
19. Sun, J., Liu, D., Zhu, X., Huang, W., Cheng, L. (2020). Experimental investigation on the pressure propagation mechanism of tight reservoirs. Fluid Dynamics & Materials Processing, 16(3), 425–440. DOI 10.32604/fdmp.2020.08531. [Google Scholar] [CrossRef]
20. Xue, S., Zhu, X., Zhang, L., Zhu, S., Ye, G. et al. (2016). Research on the damage of porosity and permeability due to the perforation on sandstone in the compaction zone. Computers, Materials & Continua, 51(1), 21–42. DOI 10.3970/cmc.2016.051.021. [Google Scholar] [CrossRef]
21. Chernyshov, S. E., Popov, S. N. (2021). The influence of geomechanical factors on the oil well productivity and the bottom-hole zone permeability of reservoir exposed by slotted perforation. Processes in GeoMedia, vol. III, pp. 167–182. Springer Geology. [Google Scholar]
22. Ashikhmin, S. G., Chernyshov, S. E., Kashnikov Yu, A., Macdonald, D. I. M. (2018). A geomechanical analysis of the influence of orientation and placement of jet slots on terrigenous reservoir permeability. Neftyanoe Khozyaystvo–Oil Industry, 6, 132–135. DOI 10.24887/0028-2448. [Google Scholar] [CrossRef]
23. Zienkiewicz, О. C. (1977). The finite element method. London: McGraw-Hill. [Google Scholar]
24. Settari, A., Walters, D. A. (1999). Advances in coupled geomechanical and reservoir modeling with applications to reservoir compaction. SPE Reservoir Simulation Symposium, pp. 14–17. Houston, Texas. [Google Scholar]
Cite This Article
 Copyright © 2023 The Author(s). Published by Tech Science Press.
This work is licensed under a Creative Commons Attribution 4.0 International License , which permits unrestricted use, distribution, and reproduction in any medium, provided the original work is properly cited.
 Downloads
 Citation Tools