
 Submit a Paper
 Propose a Special lssue
 Open Access
ARTICLE
Effect of Dry-Wet Cycles on the Transport and Mechanical Properties of Cement Mortar Subjected to Sulfate Attack
1 School of Civil Engineering, Architecture and Environment, Hubei University of Technology, Wuhan, 430068, China
2 CNRS, Centrale Lille, UMR9013-LaMcube-Laboratoire de Mécanique Multiphysique et Multiéchelle, Université de Lille, Lille, F-59000, France
* Corresponding Author: Wei Chen. Email:
Fluid Dynamics & Materials Processing 2023, 19(3), 679-696. https://doi.org/10.32604/fdmp.2022.021249
Received 05 January 2022; Accepted 13 April 2022; Issue published 29 September 2022
 View Full Text
 Download PDF
Abstract
This study deals with the analysis of the detrimental effects of a “sulfate attack” on cement mortar for different dry-wet cycles. The mass loss, tensile strength, and gas permeability coefficient were determined and analyzed under different exposure conditions. At the same time, nitrogen adsorption (NAD), scanning electron microscopy (SEM), and X-ray diffraction (XRD) techniques were used to analyze the corresponding variations in the microstructure and the corrosion products. The results show that certain properties of the cement mortar evolve differently according to the durations of the dry-wet cycles and that some damage is caused to the mortars in aqueous solution. The pores fill with corrosion products, increasing the mortar specimen mass and tensile strength while reducing the permeability coefficient and pore size distribution. As corrosion proceeds, the crystallization pressure of the corrosion products increases, resulting in a 16% reduction in tensile strength from the initial value and a 2.6-factor increase in the permeability coefficient, indicating sensitivity to sulfate attack damage. Furthermore, the main corrosion products generated in the experiment are gypsum and ettringite. Application of osmotic pressure and extension of the immersion time can accelerate the erosion process.Keywords
The structural performance of cement-based materials changes in different environments, mainly in terms of strength and durability, and sulfate attack, involving a complex corrosion mechanism, is very harmful to cement-based materials and seriously affects concrete durability [1,2]. Tian et al. [3] believed that dry-wet cycles accelerate the deterioration process. Zhang et al. [4] revealed that the degree of damage caused by concrete dry-wet cycles is far greater than the damage caused by long-term soaking. Val et al. [5] believed that alternating wet and dry conditions greatly accelerate the penetration of corrosive ions and that the tidal range becomes the most severely corroded area of the concrete structure. Therefore, it is of great significance to study the evolution of cement-based material properties under the combined action of dry-wet cycles and sulfate attack.
Sulfate attack is the most common chemical attack on concrete. When a concrete specimen is immersed in sulfate solution, SO42− reacts with C-S-H, Ca(OH)2, C3A, and hydration calcium aluminate phases after entering the pore space to generate gypsum, ettringite, and other crystals that fill the pores, making the concrete more dense and briefly strengthening the concrete performance, but over time, these products exert a certain stress related to expansion. When the expansion stress is greater than the tensile strength of concrete, the cracking of concrete capillaries produces microcracks, which eventually lead to changes in the mechanical properties of the concrete [6]. Previously, much research has been conducted on the performance damage to cement-based materials under the action of sulfate attack [7–10] and in recent years, dry-wet cycles and sulfate attacks have received the attention of many scholars [11–13]. Wei et al. [14] researched the effect of fly ash on the mechanical properties and microstructure of fiber-reinforced concrete under the coupling of dry-wet cycles and sulfate attack, and the results showed that a composition of 20% fly ash enhanced the mechanical properties and refined the pores of the concrete samples. Al-Dulaijan [15] studied the deterioration of concrete mechanical properties under different sulfate solutions and the cycle of corrosion and found that the compressive strength first increased and then decreased with an increase in the number of dry-wet cycles and that the compressive strength loss rate generally increased as the concentration of the sulfate solution increased. Guo et al. [16] studied the effect of dry-wet cycles periods on the performance of concrete under sulfate attack and showed that the depth of sulfate corrosion increased with increasing dry-wet cycles periods under certain conditions, but excessive extension of dry-wet cycles periods did not significantly exacerbate the deterioration of concrete performance.
At present, the permeability of cement-based materials under the coupled activity of dry-wet cycles and sulfate attack is rarely researched, especially with regard to gas permeability under osmotic pressure corrosion. The permeability of cement-based materials is one of the most important indicators of long-term durability [17,18], and the transport of internal material is closely related to changes in the pore structure [19–21]. There are many methods for measuring the permeability of cement-based materials [22–26], and among them, the gas permeability test method is easy to operate and has high accuracy [27]. Under the coupled activity of dry-wet cycles and sulfate attack, the morphology of the internal pore structure and the connectivity of the pore diameters of cement-based materials change gradually, and this method can reflect the characteristics of the connected pore structure and microcrack changes more sensitively.
In addition, the damage mechanism under the coupled activity of dry-wet cycles and sulfate attack needs further study, and many scholars have investigated it by using microscopic test methods, such as nitrogen adsorption (NAD), scanning electron microscopy (SEM), nuclear magnetic resonance imaging (MRI), and X-ray diffraction (XRD) techniques [28–30]. Using computed tomography (CT) and XRD, Naik et al. [31] investigated the effect of cement type and water-cement ratio on the results of sulfate attack in concrete. Chen et al. [32] studied the microstructure of internal concrete exposed to combined chloride and sulfate attack under dry-wet cycles using XRD and thermal analysis. Jiang et al. [33] used SEM and CT to elucidate the damage evolution law and the analysis of the microstructure in concrete. Qi et al. [34] used XRD, ESEM, and XCT to study changes in the corrosion products and the microstructure of internal concrete.
In short, the study of cement mortar under the coupled activity of dry-wet cycles and sulfate attack is still necessary. In this paper, after subjecting specimens to simulated dry-wet cycles and sulfate attack conditions, the mortar mass loss rate, tensile strength, and permeability coefficient change law were compared and analyzed. At the microscopic level, changes in the internal pore structure of the mortar were analyzed via NAD, SEM, and XRD, and the types of corrosion products generated were differentiated and qualitatively compared. Studying the performance of cement mortar after exposure to different corrosion mechanism types under dry-wet cycles is helpful to understand the changes in cement-based sulfate materials and the coupling function of dry-wet cycles in some coastal and western regions.
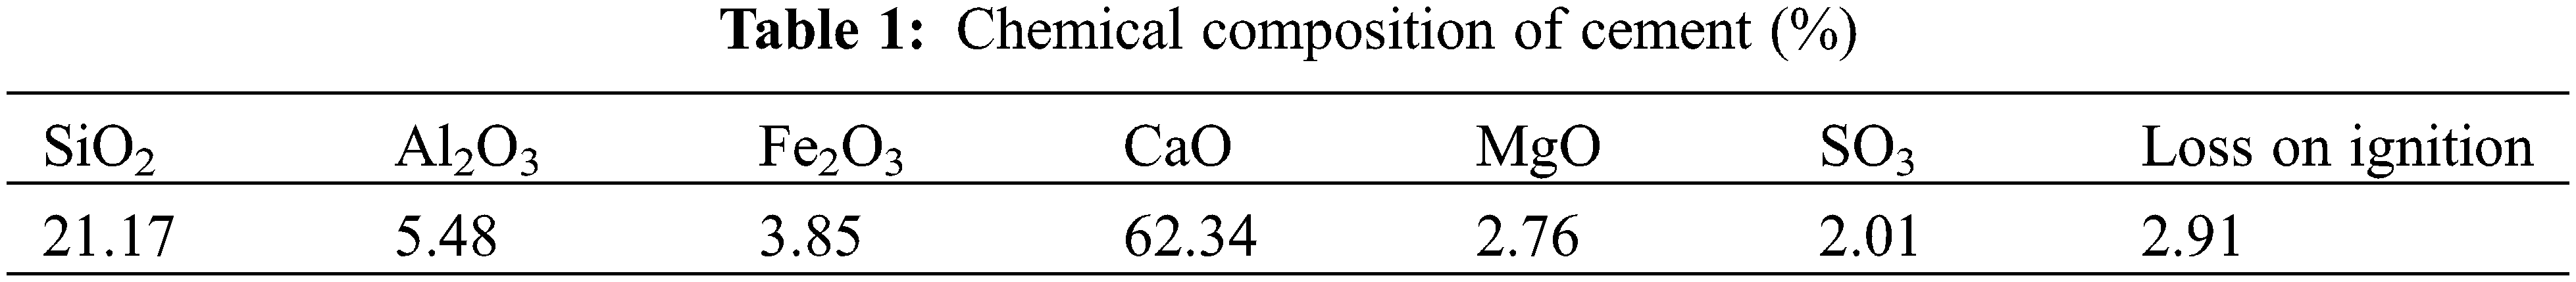
The cement used in this study was standard P.O42.5 ordinary Portland cement produced. The fine aggregate was river sand, the fineness modulus was 2.70, and both the mixing water and curing water were tap water. The chemical composition of the cement is shown in Table 1.
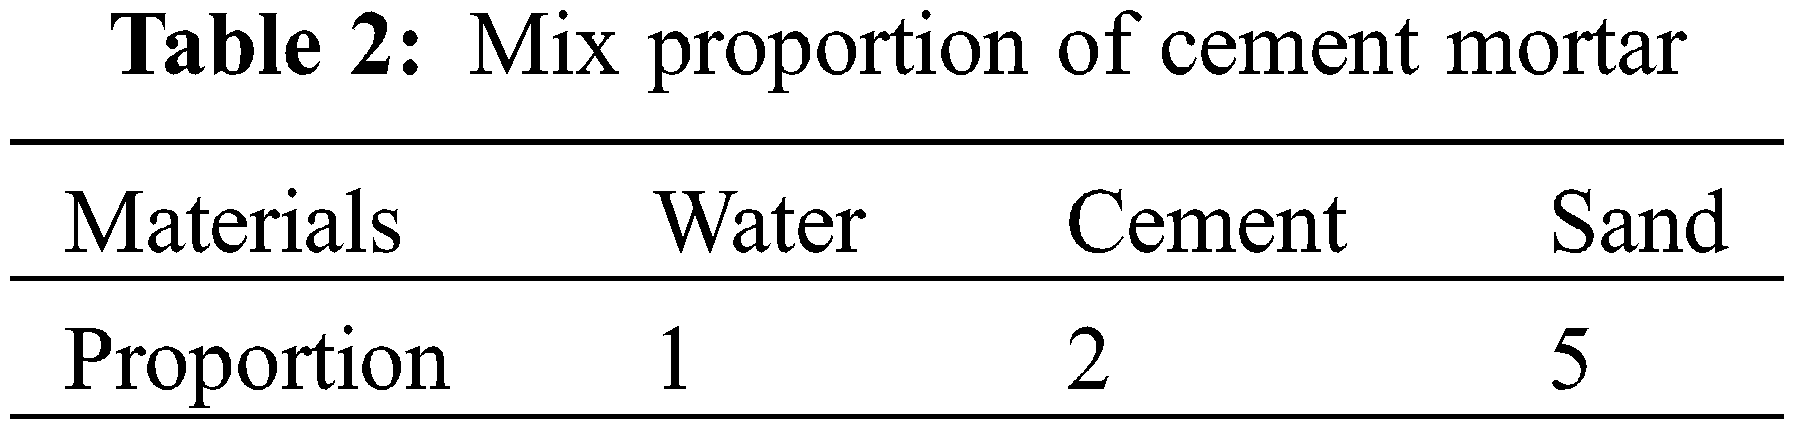
The mortar was made into a cylinder of Φ 50 mm × 100 mm. After curing in water at 24°C for 90 days, it was cut into 3 Φ 50 mm × 25 mm cylindrical specimens. The mix proportion of cement mortar is shown in Table 2.
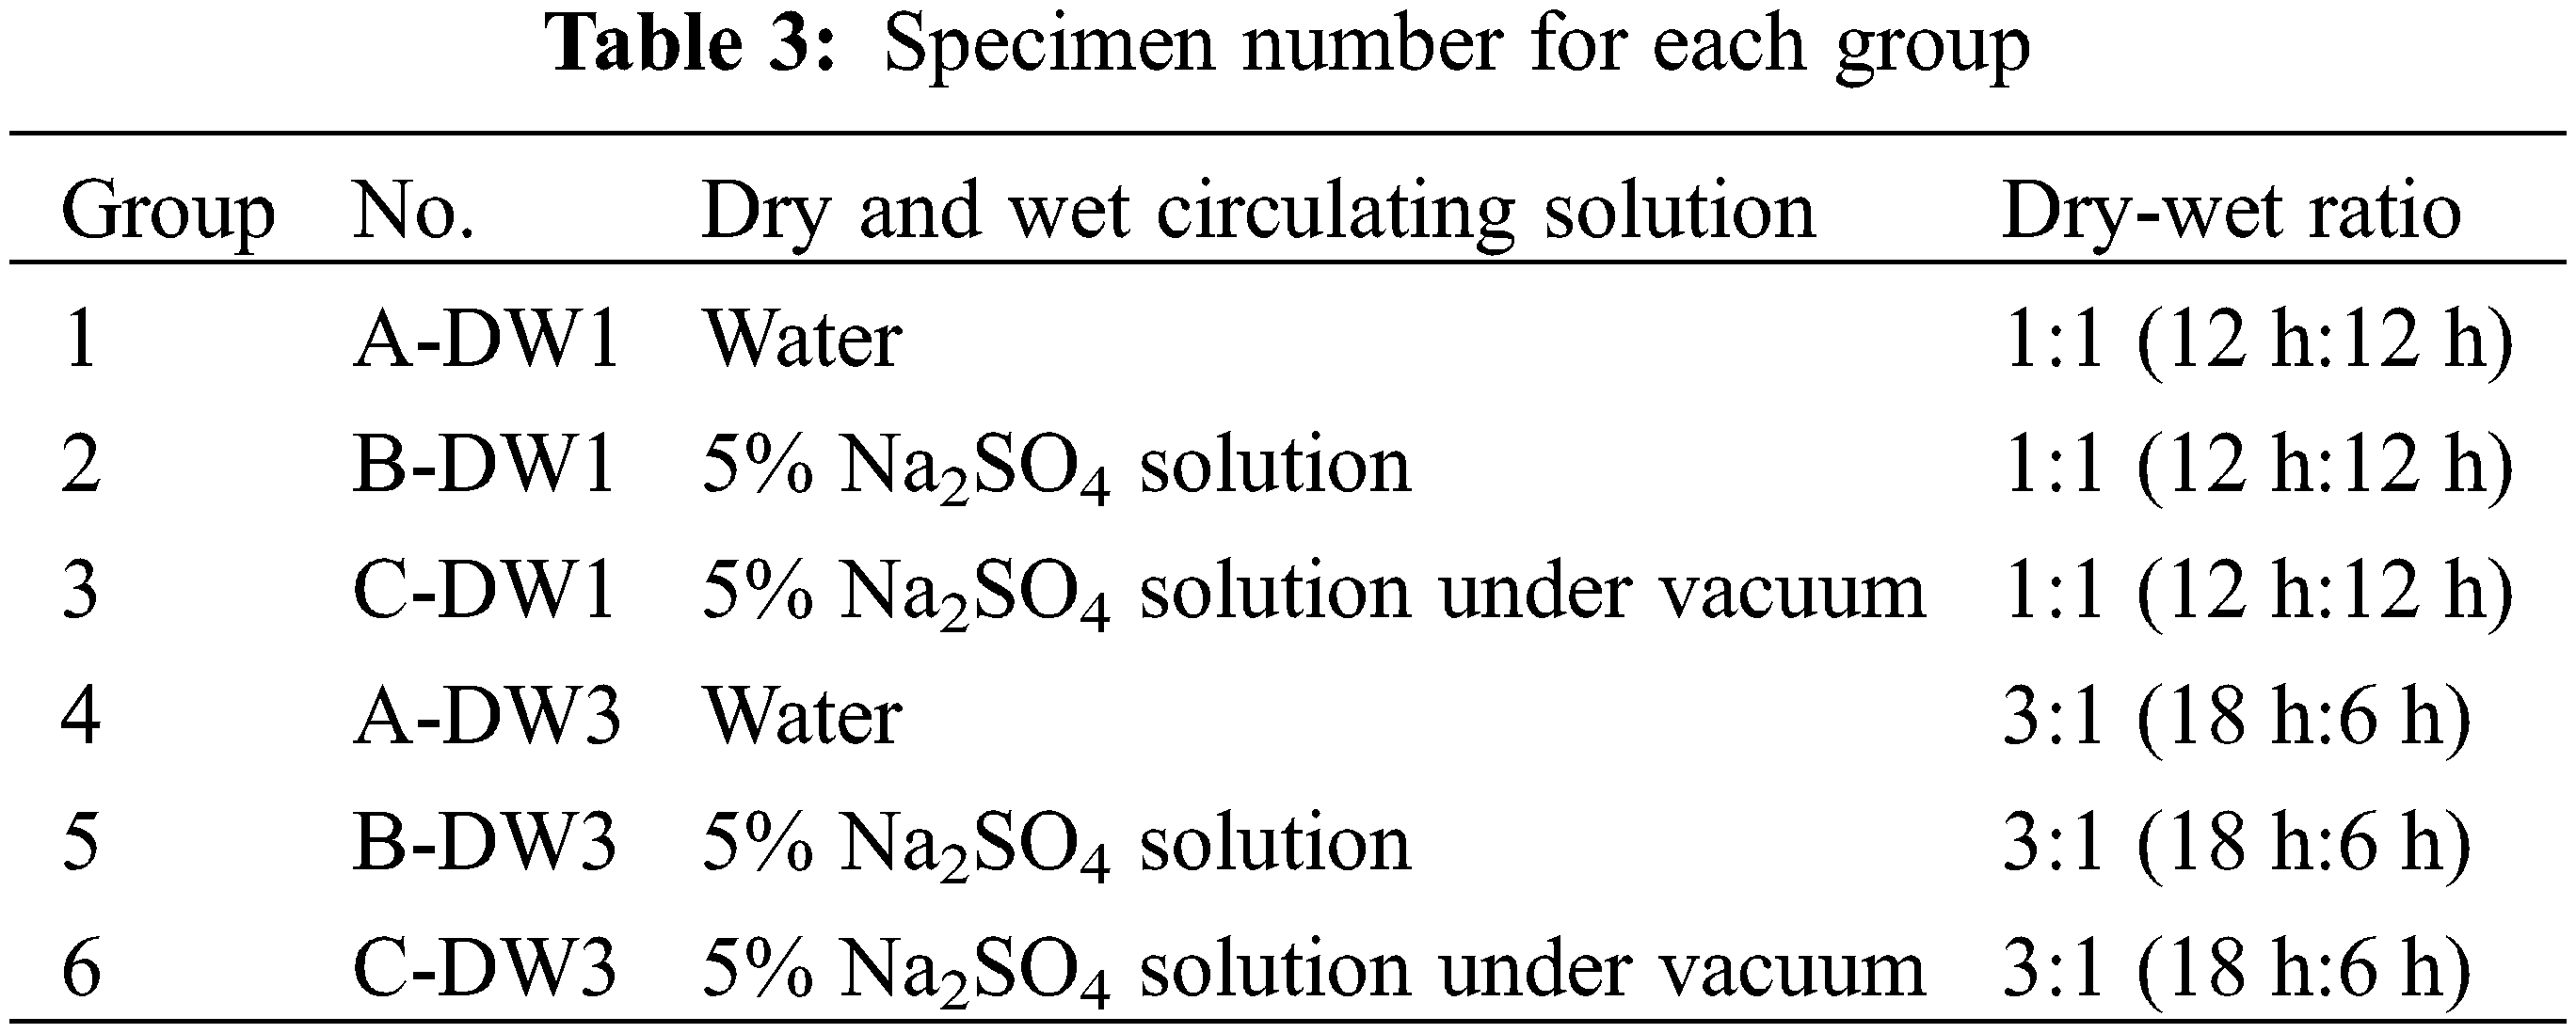
In accordance with the Standard for Test Methods of Long-term Performance and Durability of Ordinary Concrete (GB/T 50082-2009), this paper used a 5% Na2SO4 solution as the sulfate attack solution, and the test was divided into three attack environments, namely, aqueous solution, 5% Na2SO4 solution, and 5% Na2SO4 solution saturated by vacuum (which acts to accelerate corrosion). During the wetting period, the specimens were first placed in an attack environment of one of the 3 test solutions (temperature controlled at 24°C), The solutions reached above the top surface of the specimen (20 mm–30 mm) and were changed once every 5 days, and then, the specimens were air-dried for 1 h after removal from the attack environment. During the drying period, the specimens were placed in an oven (temperature controlled at 65°C) and subsequently cooled for 1 h to room temperature. In this study, the dry-wet cycle was fixed at 1 day, and the two groups were tested with different dry-wet ratios (1:1 and 3:1). After 0, 10, 20, and 30 dry-wet cycles, the specimens were placed in a 65°C oven to dry for 30 days until the mass remained unchanged. The mass loss rate, tensile strength, gas permeability coefficient, pore volume, pore size, and generated corrosion products were measured in the dried specimens. Each test result is reported as the average of the three samples tested. The specimen numbers for each group are shown in Table 3.
The mass loss rate ML of the cement mortar after dry-wet cycles was calculated using Eq. (1):
where M0 is the initial mass (g) and Mt is the mass of the specimen after cycling (g).
A universal testing machine was used to conduct a Brazilian splitting test. The specimen was placed on the testing machine and pressurized at a 0.05 mm/min loading rate until the specimen broke. To facilitate analysis of the effect of different types of corrosion mechanisms on the tensile strength of mortars, the relative value of tensile strength Rc was used as an evaluation index and was calculated according to Eq. (2):
where Rc is the relative value of the tensile strength of the specimen after cycling; fts0 is the initial tensile strength (MPa); and ftsn is the tensile strength of the specimen after cycling (MPa).
The gas permeability test was carried out under steady flow rate injection [35]. Argon was used for the test, which has a dynamic viscosity of 2.25 × 10⁻⁵ Pa⋅s at 20°C. In accordance with Qian et al. [36], who investigated how parameters such as inlet and confining pressure alter the gas permeability of concrete, the inlet pressure was set to 15 bar to ensure accuracy and safety, and the gas permeability was tested at 3 MPa, 5 MPa, and 10 MPa for each specimen. The gas permeability coefficient K (m2) was calculated according to Eq. (3), and the rate of change of permeability was calculated using Eq. (4):
where μ is the permeable gas viscosity coefficient (Pa⋅s); L is the specimen height (m); ΔP1 is the change in pressure at the air intake side (MPa); S is the cross-sectional area of the specimen (m2); Pmoy is the average value of the gas pressure over period Δt (MPa); P0 is the atmospheric pressure with a value of 0.1 MPa; Δt is the time difference (s); Ka is the rate of change of permeability; and k1 and k2 are the gas permeabilities measured under 3 MPa and 10 MPa, respectively.
The BET nitrogen adsorption test was performed using a Beishide 3H-2000PS1 specific surface area and pore size analysis instrument, with P/P0 set to 3 × 10⁻⁶∼0.99, and an N2 test gas. After grinding the specimen into a powder and sieving, it was subjected to a degassing treatment at 100°C for 5 h and then tested. The differential integral pore size distribution curve of the specimen was obtained using the BJH method. XRD was performed using a Rigaku Ultima IV X-ray diffractometer. Powder samples were first ground and sieved through a 320-mesh sieve after drying. The XRD test was conducted in a 5°–80° 2θ range. The voltage was 40 kV. The current was 40 mA, and the scanning speed was 2°/min. A ZEISS GeminiSEM 500 field emission scanning electron microscope was used to characterize the microstructure and morphology of the mortar specimens. For SEM measurements, small particles (5 mm × 5 mm × 2 mm in dimension) were cut from the cement mortar and kept submerged for 72 h in isopropanol. Then, they were further dried in an oven at a temperature of 65°C.
3.1 Mechanism of Sulfate Erosion
Sulfate attack is a complex physicochemical process [37]. During the wetting process, after SO42− enters inside the pores, it reacts with Ca(OH)2 and produces gypsum (CaSO4⋅2H2O) Eq. (5). After that, gypsum can react with hydrated calcium aluminate and produce ettringite (3CaO⋅Al2O3⋅3CaSO4⋅32H2O) (Eq. (6)) [38]. When the temperature exceeds 40°C, ettringite begins to lose free water, and 3CaO⋅Al2O3⋅3CaSO4⋅32H2O is dehydrated to form 3CaO⋅Al2O3⋅3CaSO4 [39]. Above 104°C, gypsum begins to lose free water. Therefore, the gypsum produced in this experiment is stable. The gypsum and ettringite contents are mainly determined by the concentration of sulfate ions. When the concentration is lower than 1 g/l, the erosion product is only ettringite, and when the concentration is greater than 8 g/l, the main product is gypsum [40]. This test employed a 5% Na2SO4 solution at a concentration greater than 8 g/l; thus, the chemical attack products are gypsum and ettringite. Filling in the internal pores makes the mortar structure more compact, but the corrosion products are easily expanded, resulting in an increase in the pore wall tension, which adversely affects the later performance of the mortar. During the drying process, the water on the surface of the mortar in the early stage is continuously evaporated, but the sulfate will not be lost, forming a high-concentration area. Under the action of the concentration gradient, SO42− diffuses and migrates to the inner low-concentration area until the sulfate precipitates. In this process, Na2SO4 and mirabilite are transformed into each other, but the mirabilite is unstable. As the humidity decreases and the temperature increases, the mirabilite rapidly dehydrates to form Na2SO4, which leads to salt crystallization and the formation of microcracks in the pores [41].
The mass loss rate in each group after different durations of dry-wet cycles was calculated according to Eq. (1), as shown in Fig. 1. Ye et al. [42] studied the effects of multiple heating-cooling cycles on the permeability and microstructure of a mortar. The study showed that after five heating-cooling cycles, the permeability increased by 40% compared with the initial permeability, which was considered to be caused by the generation of microcracks during the heating-cooling cycles. During the drying process, water escape can cause certain types of damage, such as the formation, convergence, and propagation of microcracks in the samples [43]. The principal types of water in concrete are crystal water, adsorbed water and free water. The water mass loss ratios of C20 concrete were 3.54% and 3.89%, respectively, at drying temperatures of 60°C and 80°C. The water loss of concrete is made up of free water and adsorbed water [44]. In this study, the dry-wet cycles essentially involved the process of heating and cooling several times. During the drying process at 65°C, there is still water inside the specimen that has not evaporated, and the mortar interior and the oven environment reach a state of humidity equilibrium. Microcracks are created during the dry-wet cycles, allowing more moisture to be absorbed during the wetting process. When the pore volume of the mortar increases, more water will be lost during the drying process to reach an equilibrium state. Therefore, the creation and evolution of microcracks caused by temperature fluctuation increased the mass loss with an increase in the repetition of the cycles.
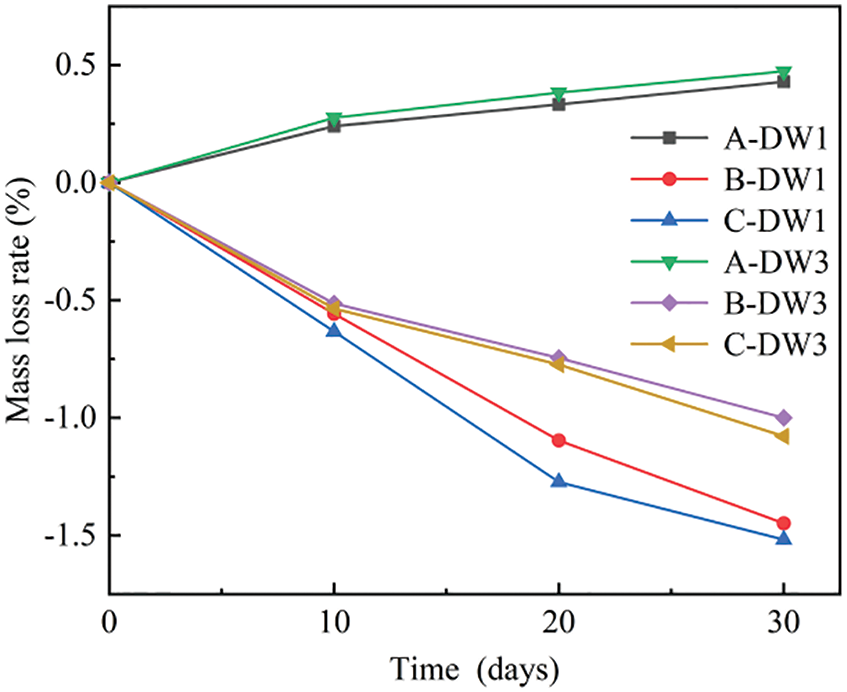
Figure 1: Mass loss rate for each group of specimens at different corrosion times
The mass of the four groups of specimens in the 5% Na2SO4 solution increased with an increase in the number of dry-wet cycles, and their mass loss rate could be divided into two stages: rapid decrease and slow decrease. The main reason for the rapid decrease is that SO42− enters the interior through the external pores in the early stages of the attack and reacts with Ca(OH)2 to form gypsum, which subsequently reacts with the internal hydration products to form ettringite. These corrosion products rapidly fill the pores, thus increasing the mortar mass of the specimens in the four groups by approximately the same amount in the early stages of the attack. These corrosion products eventually entirely fill the pores on the surface, which hinders the corrosion and diffusion of SO42− to a certain extent so that the generation rate of corrosion products is reduced, and the decrease in the mass loss rate will gradually slow. It was found that the smaller the dry-wet ratio was, the faster the mass growth rate. After 30 dry-wet cycles, the mass loss rate in Group C-DW1 was 1.4 times that in Group C-DW3 because the longer the immersion time was, the more obvious the SO42− attack was, resulting in more corrosion products; thus, the mass loss rate of the mortar increased more significantly. The mass growth rate in Group C specimens was faster than that in Group B. At the end of 30 dry-wet cycles, the mass loss rate in Group C was 1.08 times that in Group B because the internal pressure of the mortar was greater than that of the external solution in a vacuum environment, and while the internal gas is expelled, SO42− is more likely to invade the internal pores under the action of osmotic pressure, a phenomenon that was more evident in the Group DW1 specimens.
The relative tensile strength of each specimen after different corrosion times was calculated according to Eq. (2), as shown in Fig. 2. The tensile strength after 30 dry-wet cycles showed a decrease of 3%, and the tensile strength in Group A-DW3 was smaller than that in Group A-DW1. As previously mentioned, the temperature fluctuation degraded the pore structure during the drying stage. Yurtdas et al. [45] discovered that variations in concrete strength after drying are the result of a competing effect between the increase in material density. Due to capillary suction and hygral gradients, as well as drying-induced microcracking caused by material heterogeneities and differential shrinkage rates, the longer the drying time was, the greater the damage. The relative tensile strength in the four groups in 5% Na2SO4 solution increased and then decreased with an increase in the number of dry-wet cycles, and all groups reached their maximum tensile strength after 10–20 cycles, with the maximum peak strength of the specimens in Group C-DW1 being 1.21 times the initial strength. The rate of increase in the tensile strength of the specimens with a low dry-wet ratio was faster, which is consistent with the previously mentioned mass change. The tensile strength of the Group B-DW3 specimens still increased after 10 dry-wet cycles, while the tensile strength of the specimens in other three groups began to decrease; thus, the smaller the dry-wet ratio is, the faster the decline. After 20 dry-wet cycles, the tensile strength of the specimens in all four groups was still greater than the initial tensile strength, at which point, the tensile strength of the specimens in Group B-DW3 also began to decrease. After 30 dry-wet cycles, the tensile strength of all the specimens in Group DW1 was lower than the initial value, and the tensile strength of Group C-DW1 specimens decreased by 16% compared with the initial value, but the tensile strength of specimens in Group DW3 was greater than the initial value. Even with the faster decrease, Group C-DW3 still had a tensile strength 1.03 times greater than the initial tensile strength. Furthermore, the rates of increase and decrease in the tensile strength of Group C specimens were greater than those of Group B specimens, which is a phenomenon related to the osmotic pressure caused by the previously mentioned vacuum environment. Santhanam et al. [38] suggested that sulfate corrosion is divided into two stages: diffusion and swelling. SO42− enters the specimen through the pores in the early stages of sulfate attack, generating a small amount of gypsum and ettringite, which fills some of the large pores. The generated crystallization pressure is insufficient to destroy the internal structure of the mortar, but it causes densification, which leads to an increase in tensile strength. As the number of dry-wet cycles and corrosion time increase, an increasing number of crystals fill the internal pores, causing the internal expansion stresses to be greater than the tensile strength of the specimen, causing structural damage to the mortar and lowering the tensile strength.
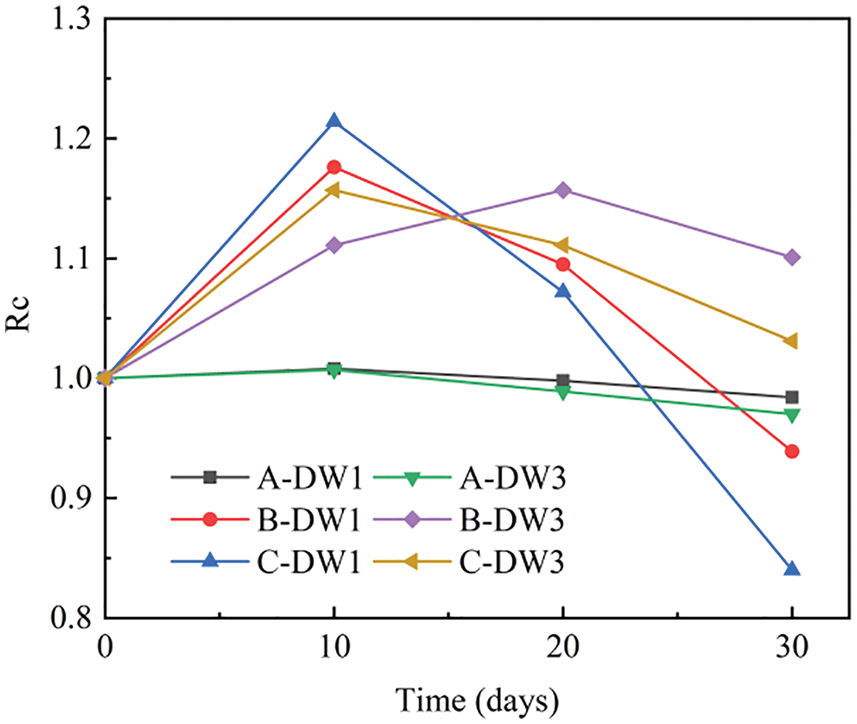
Figure 2: Rc for each group of specimens at different corrosion times
3.4.1 Gas Permeability at Different Confining Pressures
The permeability coefficients for each group at different confining pressures were calculated according to Eq. (3) and are shown in Figs. 3–5.
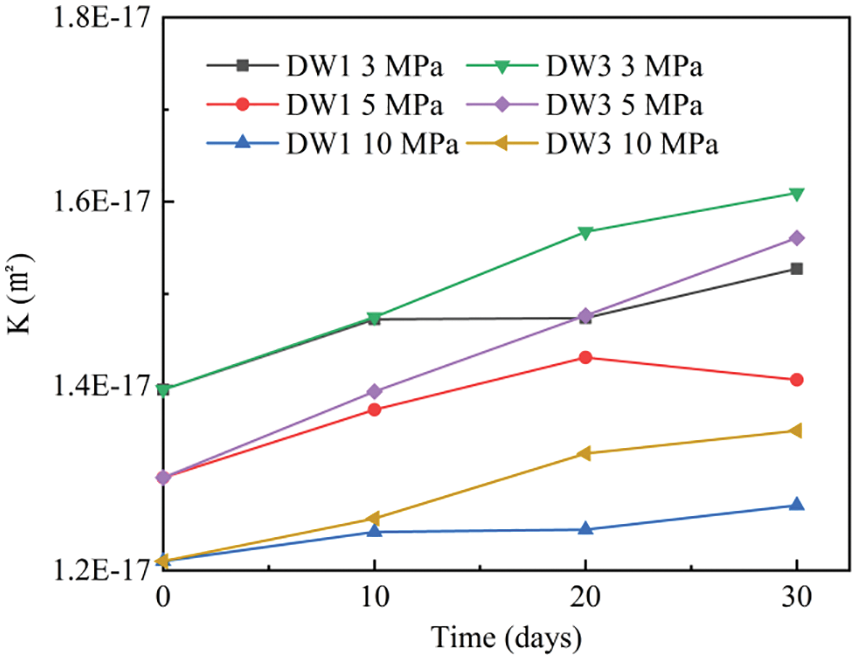
Figure 3: Variation curves of permeability coefficients for Group A specimens at different confining pressures
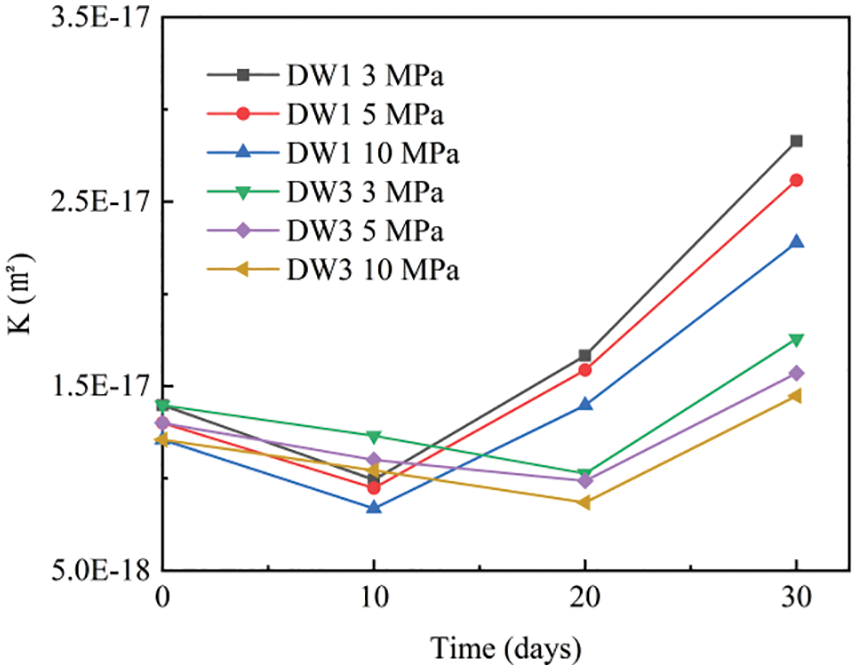
Figure 4: Variation curves of permeability coefficients for Group B specimens at different confining pressures
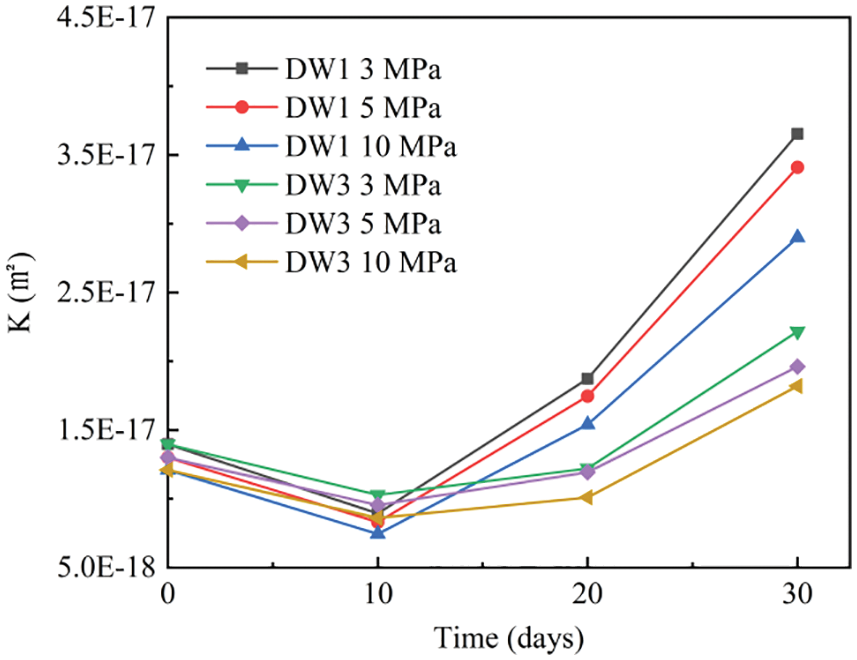
Figure 5: Variation curves of permeability coefficients for Group C specimens at different confining pressures
As shown in Fig. 3, the permeability of Group A specimens increased slightly with corrosion time at constant confining pressures. However, the permeability coefficients of all specimens were approximately 1.4 × 10⁻¹⁷ m2, and the permeability of specimens in Group DW3 was greater than that in Group DW1 specimens, indicating that a higher dry-wet ratio results in higher permeability under the same conditions, which shows that the longer the drying time, the more connected pores the specimen generates and the greater damage effect. This finding is consistent with the above test results. Ye et al. [42] have also confirmed this finding. The permeability decreases significantly as the confining pressure increases because the internal pore structure and penetrating fractures are compressed under the confining pressure, reducing the free path for the gas and thus reducing the gas flow [46].
The permeability for Group B specimens decreased and then increased significantly with corrosion time at the same perimeter pressure, as shown in Fig. 4. After 10 dry-wet cycles, the permeability of the Group DW1 specimens was 28.9% lower than that of the uncirculated specimens, the permeability increased significantly, and the growth rate gradually increased. The permeability of the specimen was more than twice that of the uncycled specimen after 30 dry-wet cycles. However, the specimens in Group DW3 reached their lowest permeability after 20 dry-wet cycles, and the rates of decrease and increase were significantly slower than Group DW1, which is consistent with the pattern of variation in the relative values of the tensile splitting strength Rc described above. This is due to the intrusion of SO42− in the early stages of corrosion, which produces small amounts of gypsum and calcium alum that fill in some of the large pores, reducing the porosity of the mortar and making the specimen denser. The increase in density impedes the passage of gases, resulting in improved permeability resistance and decreased permeability. However, after 30 dry-wet cycles, an increasing number of these corrosion products are produced, causing structural damage and the formation of microcracks in the mortar and increasing the permeability.
As shown in Fig. 5, the data for the specimens in Group C subjected to corrosion in a 5% Na2SO4 solution under vacuum are consistent with the overall change pattern observed in the Group B specimens. Under the same confining pressure, the permeability decreased significantly and then rapidly increased as the corrosion time increased, and all specimens reached their lowest permeability after approximately 10 cycles, which is 35.9% lower than that of the uncycled specimens. When compared to uncycled specimens, the permeability of the specimens increased by a factor of 2.6 after 30 dry-wet cycles.
3.4.2 Gas Permeability under Different Corrosion Conditions
To visually compare the gas permeability of the mortar under different corrosion mechanisms and to reduce the influence of the confining pressure on the permeability of the specimens, the gas permeability coefficient of specimens in each group was measured at a confining pressure of 3 MPa, and the variation in the permeability with corrosion time is shown in Fig. 6.
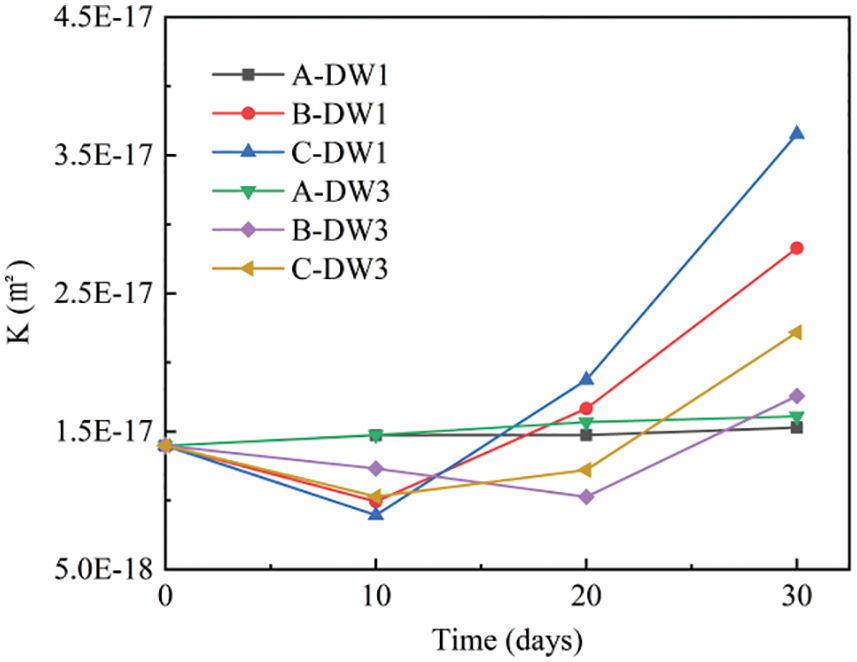
Figure 6: Variation curves of the coefficient of permeability for each group of specimens at different times of corrosion
As shown in Fig. 6, the permeability of the specimens in Group A increased only slightly after 30 dry-wet cycles, specifically by only 9% compared to before the dry-wet cycle. The permeability of the specimens in Groups B and C decreased and then increased, specifically experiencing a rapid increase after 20 dry-wet cycles, with only the specimens in Group B-DW3 reaching their lowest value after 20 cycles, while the rest of the groups reached their lowest value after approximately 10 cycles. The decrease and increase rates in Group C were greater than those in Group B, indicating that the rate of deterioration was faster in Group C than in Group B. After 30 dry-wet cycles, the permeability of Group C was 1.3 times higher than that of Group B, which is correlated with the fact that the osmotic pressure generated under the saturation of the evacuation mentioned above is more likely to allow SO42− to invade. The permeability of the DW1 specimens in Groups B and C was 1.6 times that of the DW3 specimens after 30 dry-wet cycles, indicating that the smaller the dry-wet ratio is, the faster the decrease in permeability due to the longer corrosion time; thus, the greater the amount of invading SO42− is, the greater the amount of generated corrosion products, which means the rate of deterioration becomes faster.
3.4.3 Gas Permeability Coefficient Change Rate
Fig. 6 shows that while the permeability coefficients for all groups were on the order of 10−17 m2 and the permeability decreases with increasing confining pressure for the same attack cycle in each group, the magnitude of the decrease varies. The permeability coefficient change rate is used to characterize the difference in permeability reduction, and data from the specimens in Group DW1 were selected for analysis. The permeability coefficient change rate of the DW1 specimens after different corrosion times was calculated using Eq. (4), and the results are shown in Table 4.
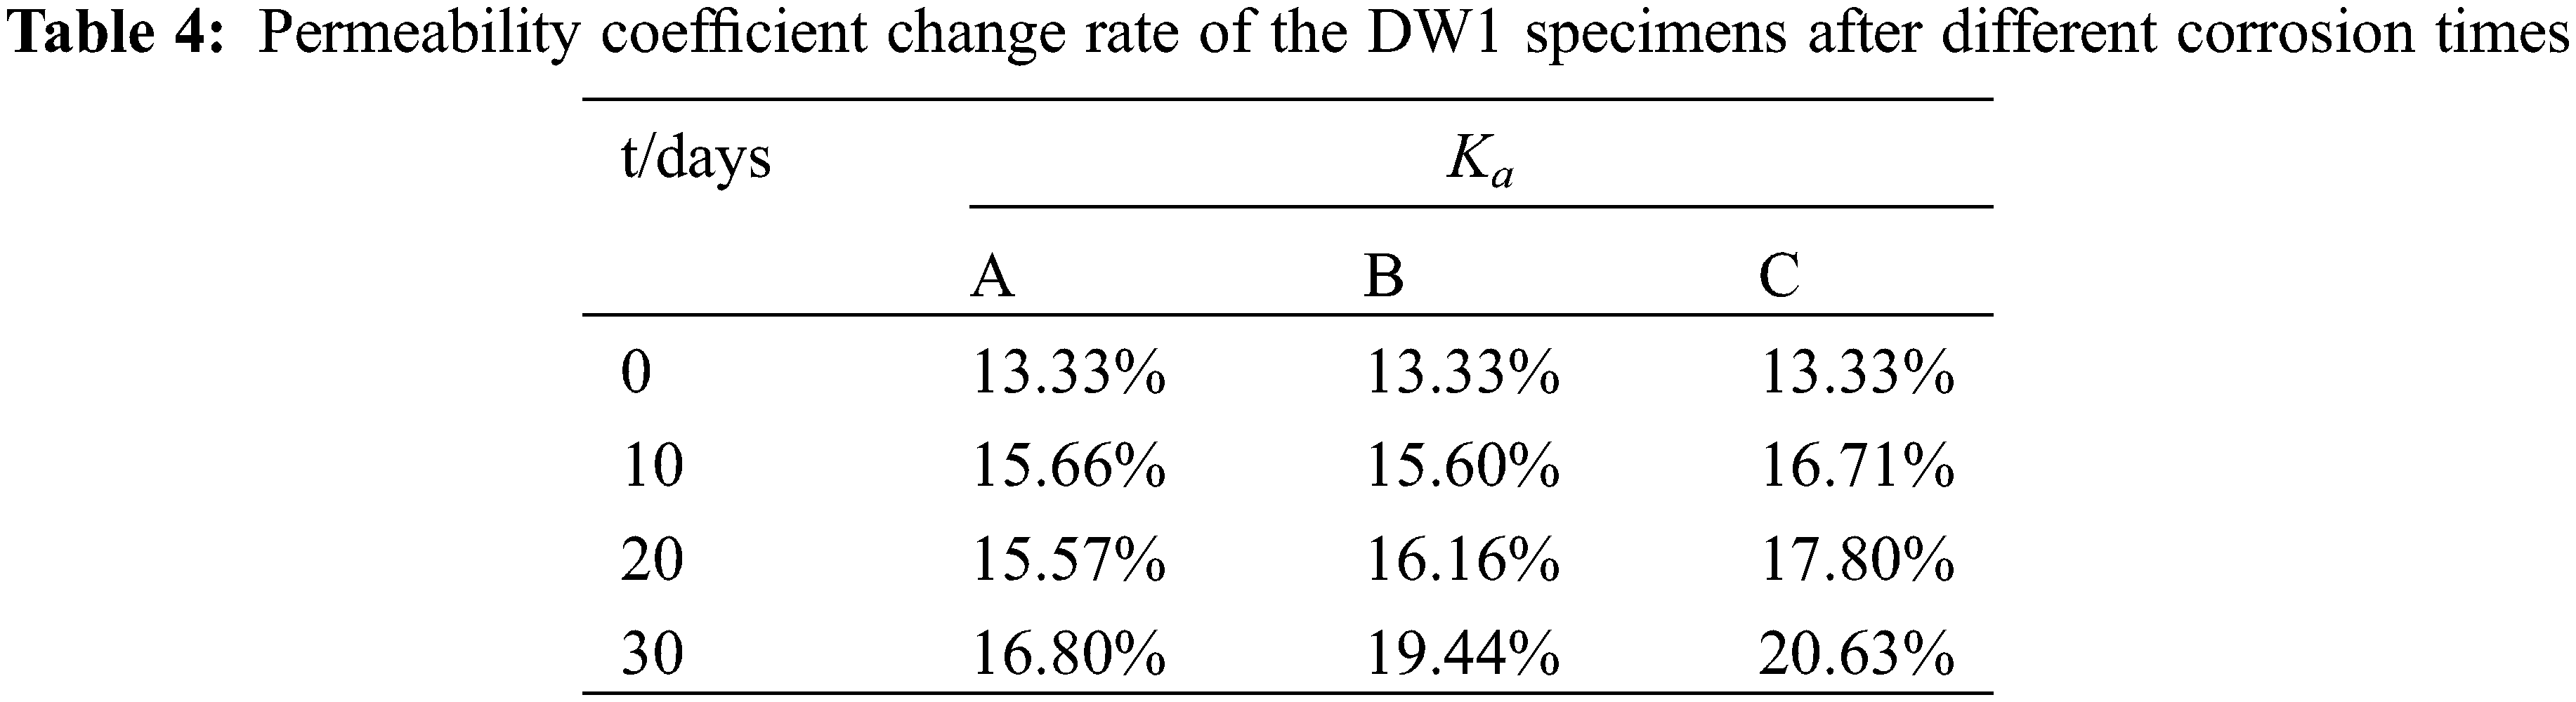
From Table 4, the permeability coefficient change rate increased from 13.33% to 16.80% (A), 19.44% (B), and 20.63% (C) after 30 days of corrosion in different solutions. The permeability of the Group C specimens decreased the most with increasing confining pressure and was greater than that of the uneroded specimens, indicating that the permeability is the most sensitive to confining pressure after corrosion. Although the production of corrosion products that fill the pores in the early stages of corrosion reduced permeability, the production of corrosion products necessitated the consumption of hydration products, resulting in the same reduction in the ability of the specimen skeleton to resist deformation as observed in Group A [47]. As a result, after corrosion in different solutions, the sensitivity of all three groups of specimens to the confining pressure increased.
3.5 Microstructural Alteration of Mortar
Due to the consistent pattern of variation in the four datasets under corrosion in 5% Na2SO4 solution and the large amount of data, only the C-DW1 dataset with the fastest attack rate was chosen for microstructural alteration analysis in this paper. Based on the type of hysteresis loop recommended by the International Union of Pure and Applied Chemistry (IUPAC), the analysis shows that the adsorption and desorption isotherms for this test are type H3. As shown in Figs. 7a and 8a, there is no restriction on adsorption in the higher P/P0 pressure region, and a hysteresis loop with a large hysteresis width occurs at P/P0 between 0.5 and 1, indicating a wide range of specimen pore size distributions. As shown in Fig. 7a, as the corrosion time increases, the adsorption and desorption isotherms of the specimens shift downward. This phenomenon indicates that sulfate erodes into the pore space and that the resulting products refine the pore structure inside the specimen, which is the reason for the decrease in adsorption and desorption at each relative pressure point. Fig. 7b depicts the differential integral pore size distribution diagram for Group C-DW1. As seen from the diagram, the pore size distribution curves under different attack cycles have similar trends, and the pore size distribution ranges from 2 nm to 150 nm, indicating that there are no micropores in the specimens and that the specimen mainly contain mesopores and macropores, with a higher proportion of pores with pore sizes between 10 nm and 80 nm. The number of pores in the specimens with a size of 4 nm to 80 nm gradually decreased as the corrosion progressed, while the pores with a size of 2 nm to 3 nm slightly increased, and the pores between the C-S-H gel particles were in the range of 3 nm to 12 nm, indicating that the consumption of C-S-H during sulfate attack caused significant changes in the pores between the gel particles. The other pore structure parameters of the specimens are shown in Table 5, which shows a significant reduction in the size of the BET specific surface area and total pore volume. After 30 dry-wet cycles, the specific surface area decreased by 40.1%, the total pore volume decreased by 44.4%, and the most likely pore size remained essentially unchanged and was distributed between 3.90 nm and 3.94 nm. This is because the generated corrosion products gradually fill the pores with a larger pore size, decreasing the empty volume of the pores and resulting in a reduction in the number of certain pore sizes, thereby reducing the specific surface area and pore volume. According to the adsorption and desorption isotherms in Fig. 8a, the differential integral pore size distribution diagram in Fig. 8b, and other pore structure parameters in Table 6, it can be seen that the variation between the corrosion velocities in each group is C-DW1 > B-DW1 > C-DW3 > B-DW3. The significant changes in pore size discussed above can reflect the test results for tensile strength and permeability.
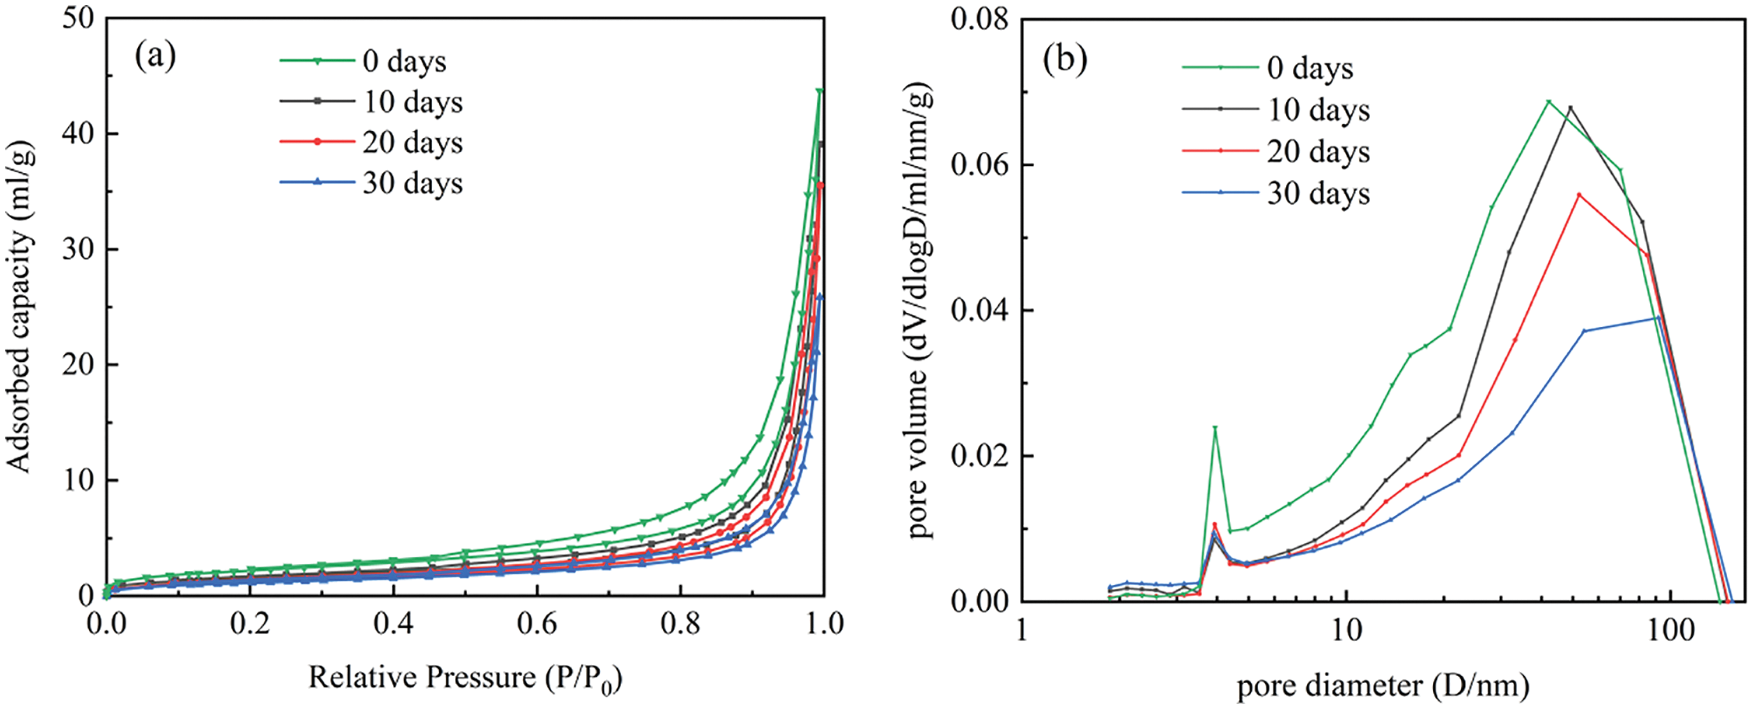
Figure 7: (a) Adsorption-desorption isotherms of specimens in Group C-DW1 after different corrosion cycles; (b) Differential integral pore size distribution of specimens in Group C-DW1 after different corrosion cycles
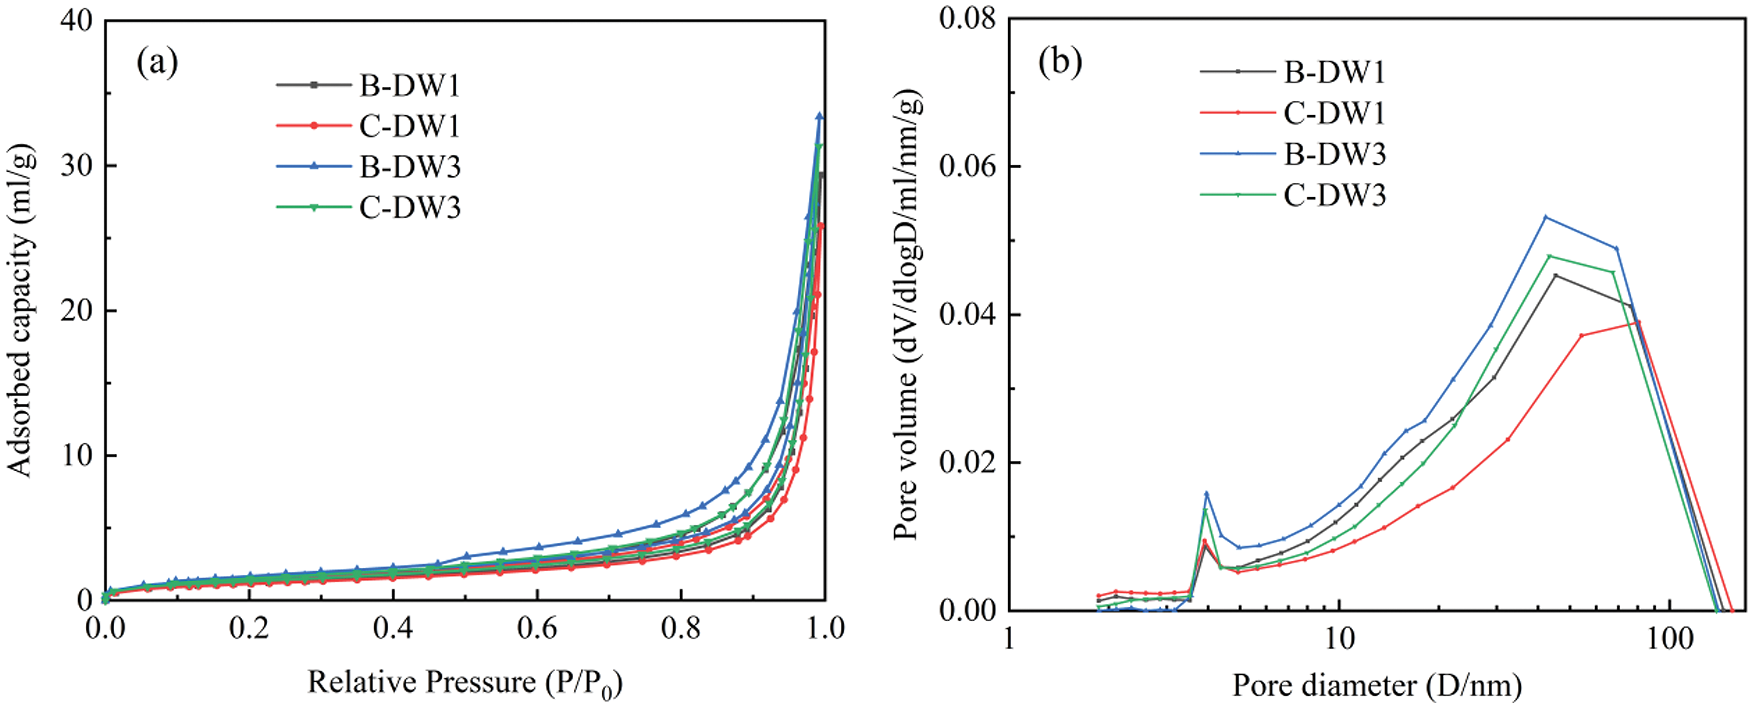
Figure 8: (a) 30-cycle adsorption-desorption isotherms of specimens in four groups in 5% Na2SO4 solution; (b) 30-cycle differential integral pore size distributions of specimens in four groups in 5% Na2SO4 solution
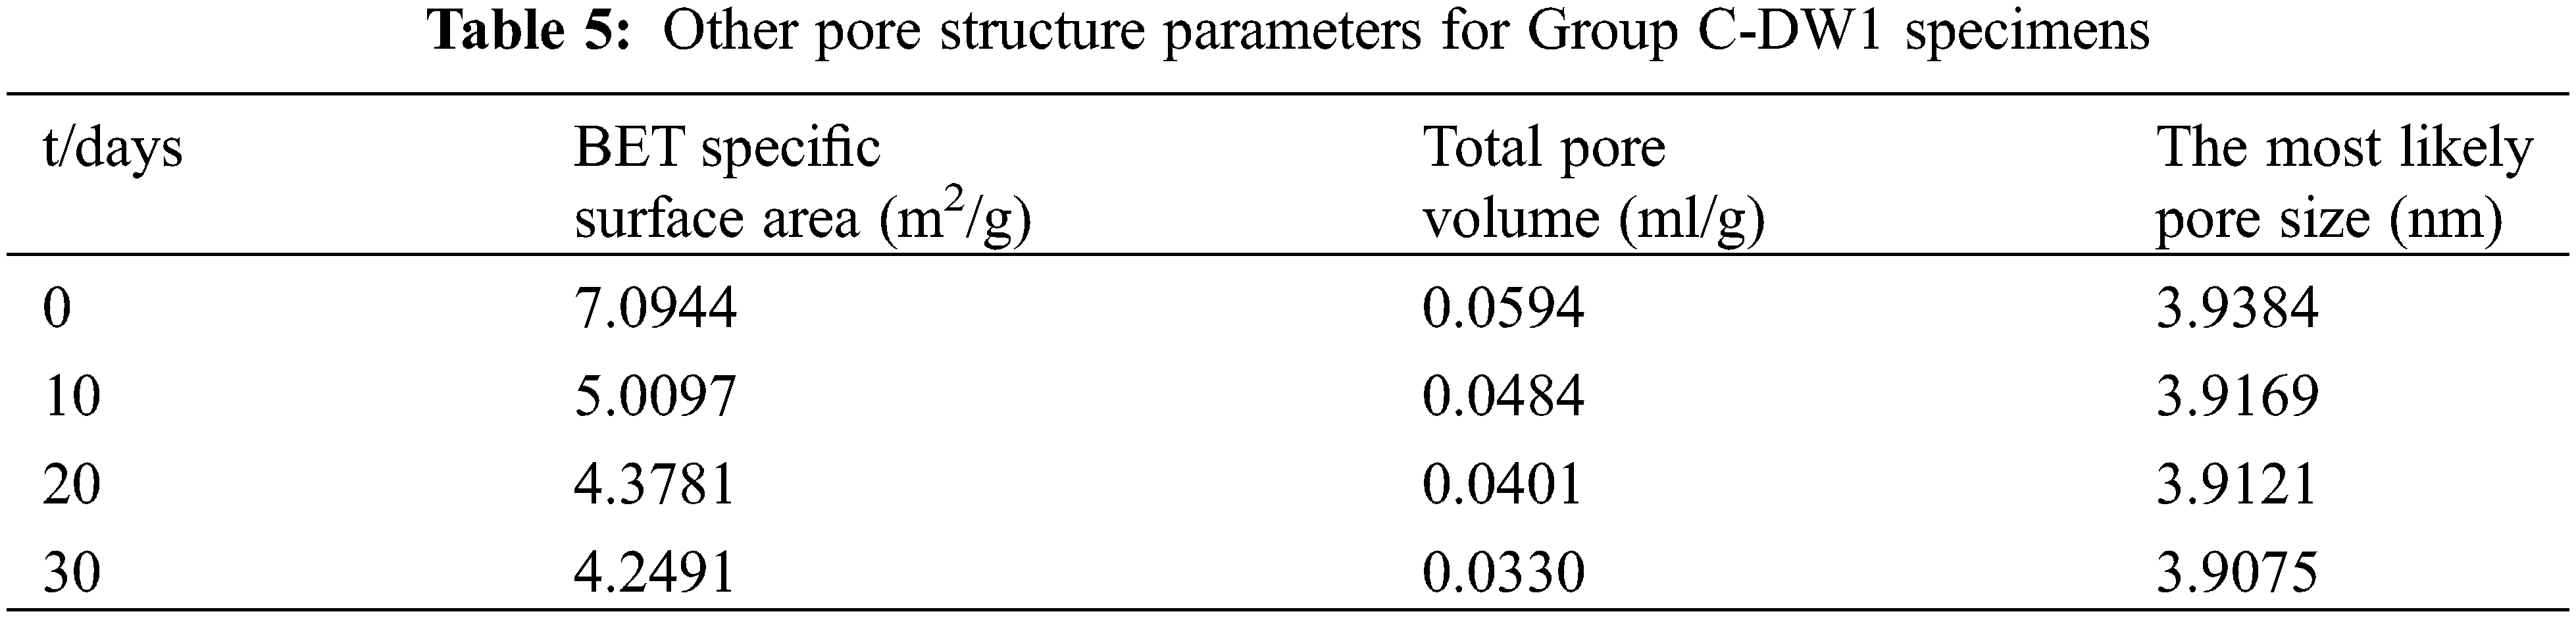
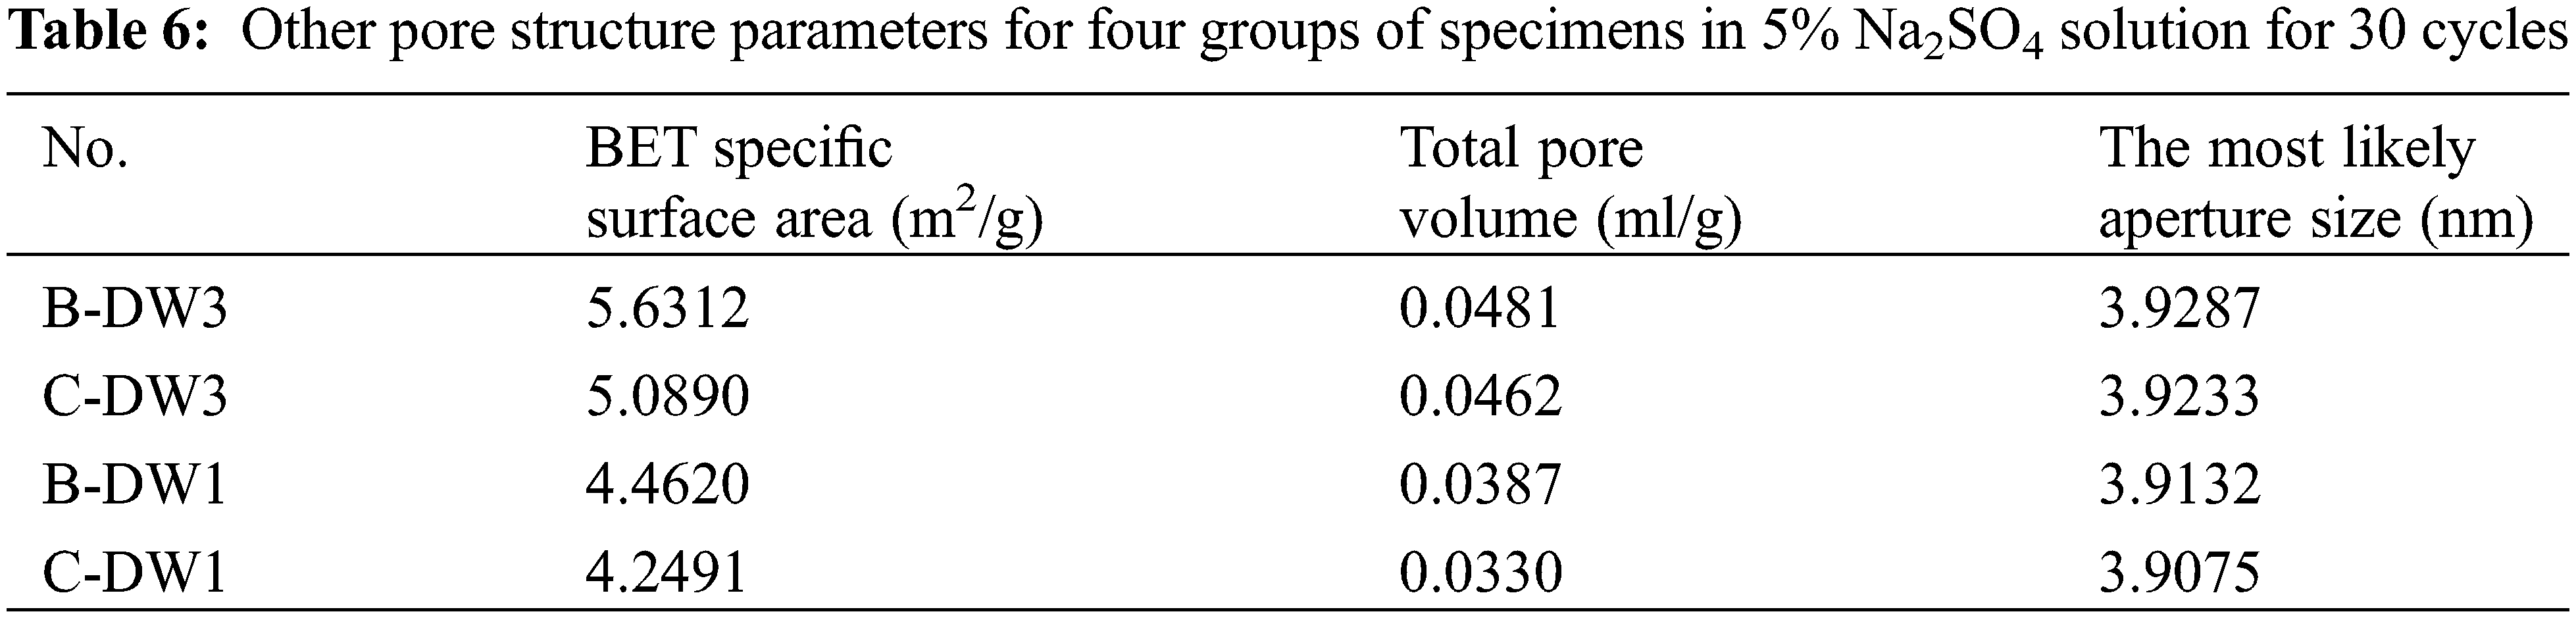
Fig. 9 shows the XRD diagram for this study. The graphs show a qualitative analysis of quartz, Ca(OH)2, CaCO3, gypsum, and ettringite. In this subsection, the XRD data of Group C-DW1 are still the only data taken for analysis. Fig. 9a shows the XRD pattern of Group C-DW1 mortar after 0, 10, and 30 days of dry-wet cycles. The peaks of gypsum and ettringite in the mortar are very small before the attack and gradually increase as the corrosion time increases. After 30 days of attack, the peaks of ettringite and gypsum caused by external sulfate attack can be seen, indicating that these are the main substances generated by corrosion. As Ca(OH)2 is a reactant in the production of gypsum, Ca(OH)2 is consumed while gypsum is produced, which is confirmed by the decrease in the Ca(OH)2 peak in Fig. 9a.
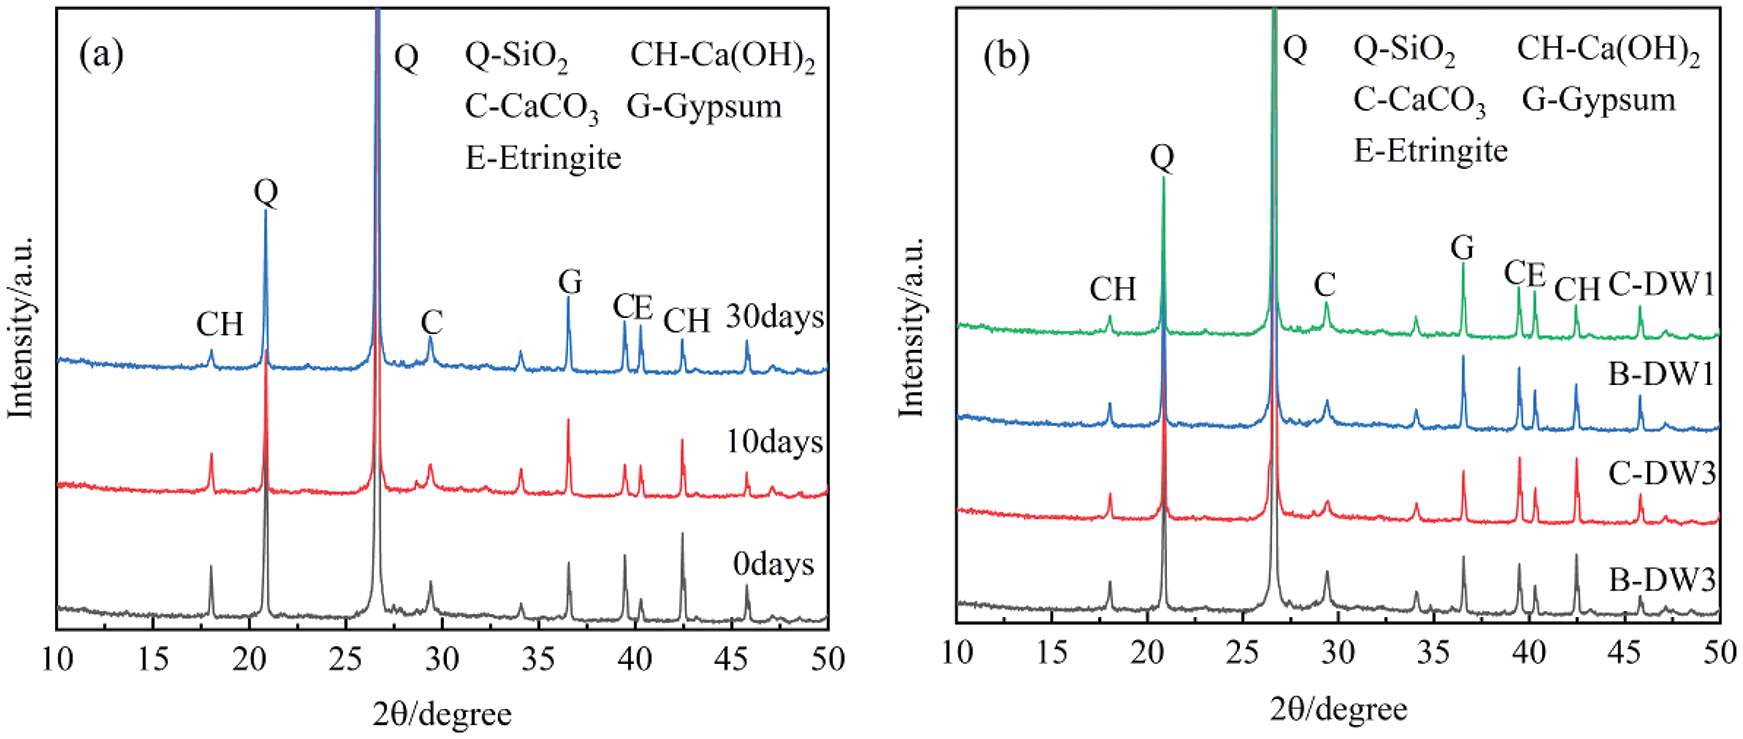
Figure 9: (a) XRD diagrams of Group C-DW1 specimens after different attack periods; (b) 30-cycle XRD patterns of four groups of specimens in 5% Na2SO4 solution
Fig. 9b shows the XRD patterns of the four groups of specimens in 5% Na2SO4 solution after 30 days. The main mineral differences between the four groups after dry-wet cycles of sulfate is the amount of ettringite and gypsum produced. In the same corrosion solution, the specimens in Group DW1 produced more ettringite and gypsum than those in Group DW3, while the amount of Ca(OH)2 decreased, indicating that sulfate attack was negatively correlated with the dry-wet ratio; that is, the smaller the dry-wet ratio was, the longer the corrosion time and the more favorable the generation of corrosion products. At the same dry-wet ratio, it can be observed that the peak intensities of ettringite and gypsum are higher in Group C specimens than in Group B specimens. This phenomenon is more prominent in the groups with smaller dry-wet ratios. According to the peak intensity of the corrosion products, it can be concluded that the variation in the corrosion rate of each group in descending order is C-DW1 > B-DW1 > C-DW3 > B-DW3, which is consistent with the above test results.
SEM was used to examine the microstructure of the mortars under the coupled activity of dry-wet cycles and sulfate attack. Sarkar et al. [48] showed that dry-wet cycles can only accelerate the rate of attack and that the microstructural changes are mainly due to the sulfate attack process. Fig. 10 illustrates the micromorphology changes during mortar erosion in Group C-DW1. As shown in Fig. 10a, the accumulation of Ca(OH)2 crystals and short, column-shaped crystals of gypsum can be observed in the pores in the early stages, and the needle-like crystals of ettringite are almost invisible. As shown in Fig. 10b, after 30 dry-wet cycles, the number and size of corrosion products increased, and the micromorphology became increasingly complex, with needle-like ettringite and visible microcracks being observed. The number of corrosion products increases as the corrosion time increases, while the hydration products C-S-H and Ca(OH)2 are constantly decomposed, destroying the bonding power between the mortar and the specimen and leading to cracking, which reduces the permeability resistance of the specimen. Fig. 11 shows a comparison of SEM images of specimens from the four groups in 5% Na2SO4 solution at 30 days and the different corrosion processes under different types of erosion mechanisms in terms of the generation of corrosion products and the degree of damage, with more gypsum and ettringite being generated in Group C specimens than in Group B specimens, which indicates a faster corrosion process. In addition, in Group DW1, more corrosion products and microcracks were generated than in Group DW3. In particular, for the specimens in Group C-DW1, the pores were almost filled with needle-like ettringite crystals, indicating that the smaller the dry-wet ratio is, the faster the corrosion rate, which is consistent with the above results.
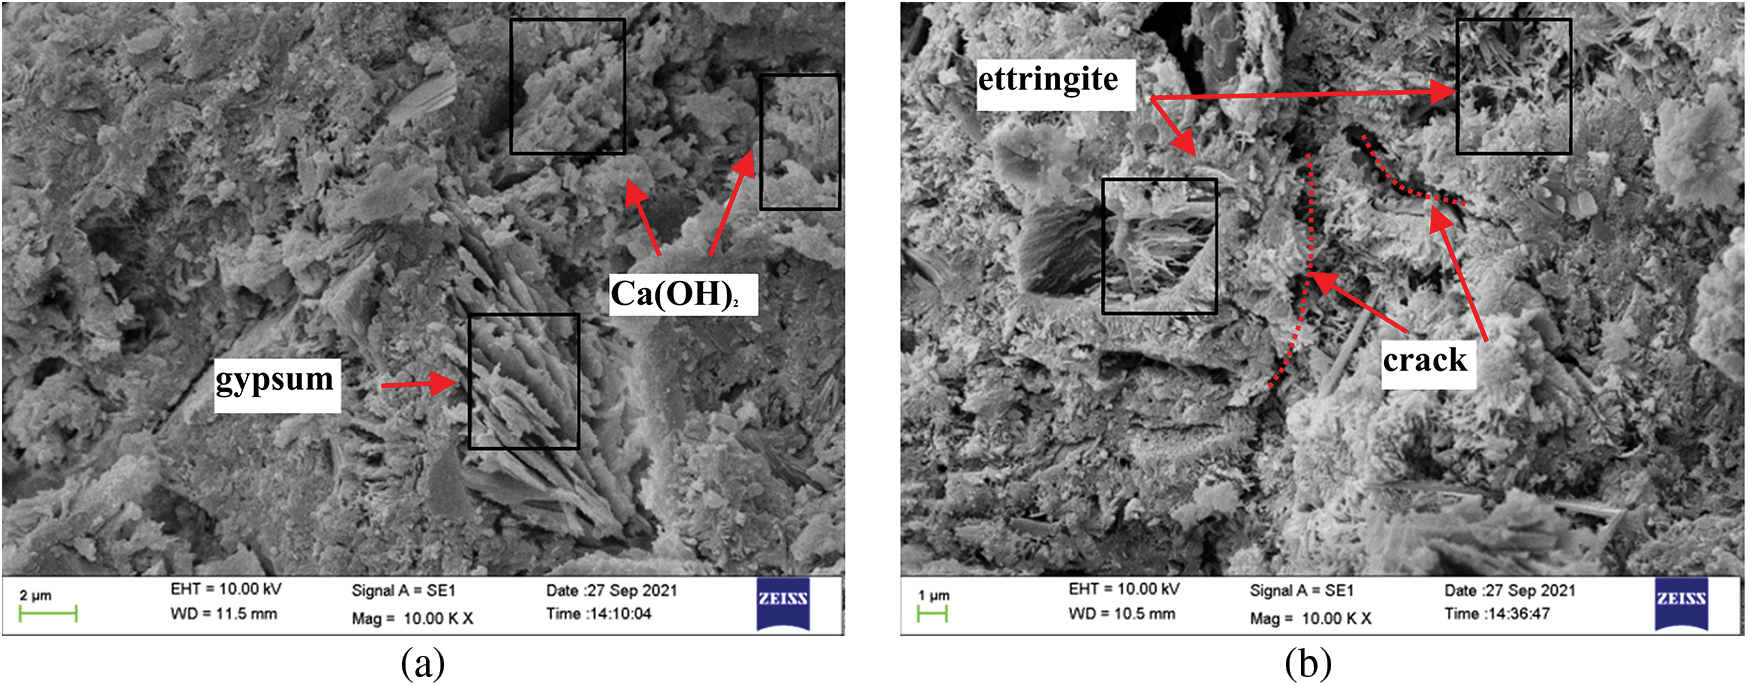
Figure 10: Comparative SEM images of specimens in Group C-DW1 after different erosion cycles of (a) 10 days and (b) 30 days
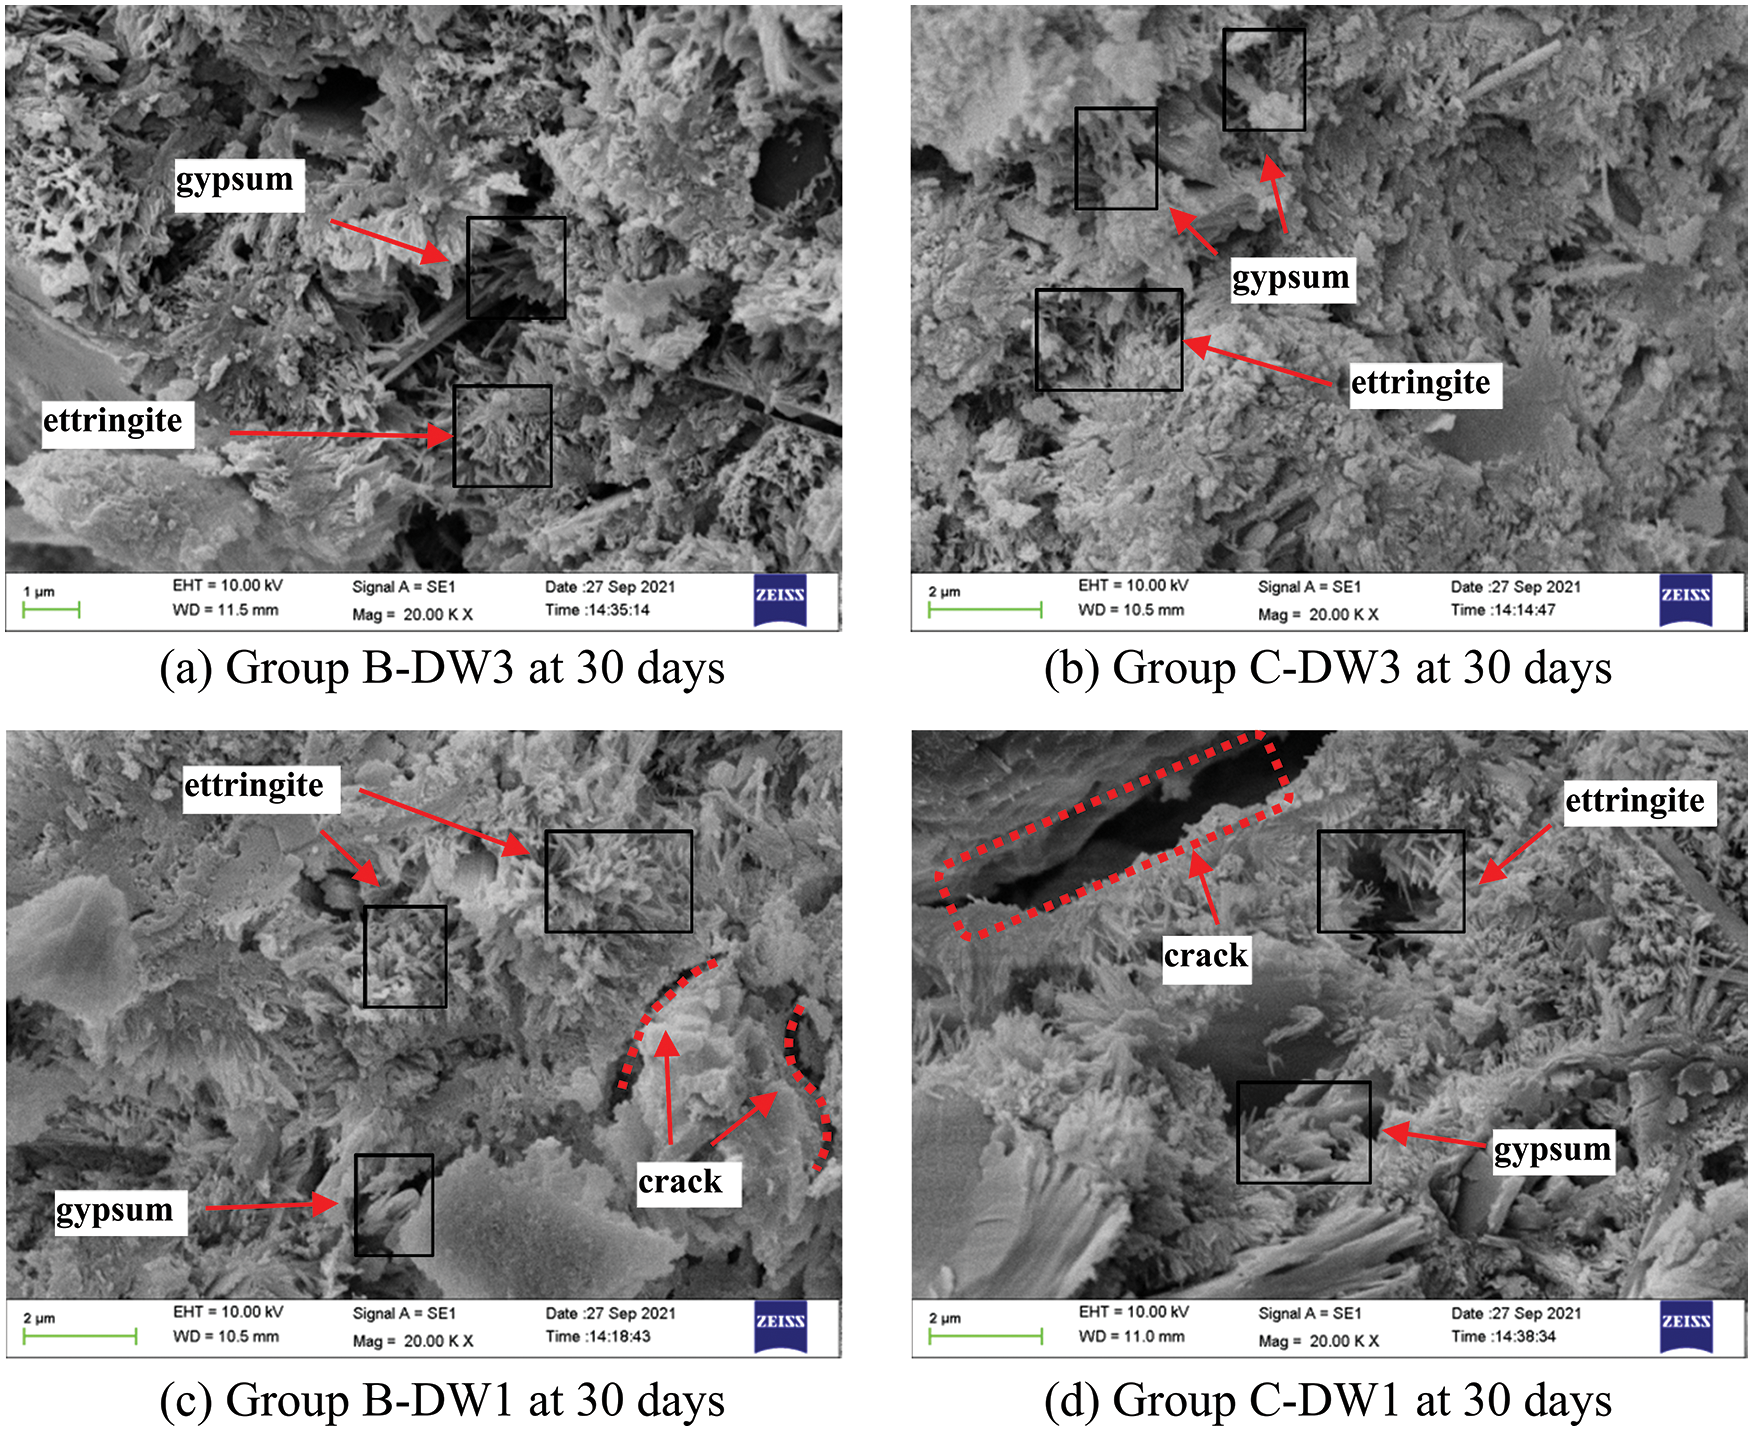
Figure 11: Comparison of the 30-day SEM images of the four groups of specimens in 5% Na2SO4 solution
In this paper, the macro- and micro-properties of cement mortars were studied to investigate the evolution of properties under different corrosion and dry-wet cycles. The following conclusions can be highlighted:
1. The deterioration of cement mortars in dry-wet cycles is closely related to the attack environment and the duration of the cycle. The deterioration in aqueous solution was relatively slow, but no significant deterioration was seen over the durations studied. Under the combined action of dry-wet cycles and sulfate attack, the tensile strength and gas permeability of cement mortar exhibit roughly the same change over time, with both showing a two-stage change pattern of first increasing and then decreasing; however, the gas permeability resistance of cement mortars is more sensitive to sulfate attack damage, which makes the deterioration degree greater in the later stage of corrosion.
2. The gas permeability of the cement mortars is strongly related to the confining pressure. At a constant corrosion time, the gas permeability gradually decreases with increasing confining pressure, and the sensitivity of the specimen to the confining pressure increases after a certain time of corrosion in different solutions.
3. The application of osmotic pressure in the process of sulfate attack and the vacuum environment inside and outside the specimen solution, which forms osmotic pressure, can accelerate SO42− migration and diffusion, promote the role of sulfate chemical attack, and increase the rate of damage to the specimen.
4. The dry-wet ratio is an important factor in the sulfate attack of cement mortars. The early performance of mortar with a small dry-wet ratio exhibits faster improvement. The longer immersion time has a greater impact on the later stage of corrosion due to structural damage and the formation of more microcracks in the mortar.
5. When compared to uneroded mortar, the sulfate-attacked mortar produced short column-shaped gypsum crystals and needle-like ettringite crystals. These corrosion products fill the internal pores, refine the pore structure of the specimen, reduce the mesopore and macropore content, and significantly reduce the size of the specific surface area and total pore volume, thus improving the performance of the specimen, while the most likely pore size remains essentially unchanged. The application of osmotic pressure and increasing immersion time can produce more corrosion products.
Funding Statement: This work is supported by the National Natural Science Foundation of China (No. 51709097).
Conflicts of Interest: The authors declare that they have no conflicts of interest to report regarding the present study.
References
1. Ragoug, R., Metalssi, O. O., Barberon, F., Torrenti, J. M., Roussel, N. et al. (2019). Durability of cement pastes exposed to external sulfate attack and leaching: Physical and chemical aspects. Cement and Concrete Research, 116, 134–145. DOI 10.1016/j.cemconres.2018.11.006. [Google Scholar] [CrossRef]
2. Sirisawat, I., Saengsoy, W., Baingam, L., Krammart, P., Tangtermsirikul, S. (2014). Durability and testing of mortar with interground fly ash and limestone cements in sulfate solutions. Construction and Building Materials, 64, 39–46. DOI 10.1016/j.conbuildmat.2014.04.083. [Google Scholar] [CrossRef]
3. Tian, W., Han, N. (2017). Experiment analysis of concrete’s mechanical property deterioration suffered sulfate attack and drying-wetting cycles. Advances in Materials Science and Engineering, 2017(3), 1–13. DOI 10.1155/2017/5673985. [Google Scholar] [CrossRef]
4. Zhang, H. R., Ji, T., Liu, H. (2020). Performance evolution of recycled aggregate concrete (RAC) exposed to external sulfate attacks under full-soaking and dry-wet cycling conditions. Construction and Building Materials, 248, 118675. DOI 10.1016/j.conbuildmat.2020.118675. [Google Scholar] [CrossRef]
5. Val, D. V., Stewart, M. G. (2003). Life-cycle cost analysis of reinforced concrete structures in marine environments. Structural Safety, 25(4), 343–362. DOI 10.1016/S0167-4730(03)00014-6. [Google Scholar] [CrossRef]
6. Haufe, J., Vollpracht, A. (2019). Tensile strength of concrete exposed to sulfate attack-sciencedirect. Cement and Concrete Research, 116, 81–88. DOI 10.1016/j.cemconres.2018.11.005. [Google Scholar] [CrossRef]
7. Neville, A. (2004). The confused world of sulfate attack on concrete. Cement and Concrete Research, 34(8), 1275–1296. DOI 10.1016/j.cemconres.2004.04.004. [Google Scholar] [CrossRef]
8. Steiger, M., Asmussen, S. (2008). Crystallization of sodium sulfate phases in porous materials: The phase diagram Na2SO4–H2O and the generation of stress. Geochimica et Cosmochimica Acta, 72(17), 4291–4306. DOI 10.1016/j.gca.2008.05.053. [Google Scholar] [CrossRef]
9. Aye, T., Oguchi, C. T. (2011). Resistance of plain and blended cement mortars exposed to severe sulfate attacks. Construction and Building Materials, 25(6), 2988–2996. DOI 10.1016/j.conbuildmat.2010.11.106. [Google Scholar] [CrossRef]
10. Nehdi, M. L., Suleiman, A. R., Soliman, A. M. (2014). Investigation of concrete exposed to dual sulfate attack. Cement and Concrete Research, 64, 42–53. DOI 10.1016/j.cemconres.2014.06.002. [Google Scholar] [CrossRef]
11. Yehia, S., Farrag, S., Abdelghaney, O. (2019). Performance of fiber-reinforced lightweight self-consolidating concrete exposed to wetting-and-drying cycles in salt water. ACI Materials Journal, 116(6), 45–54. DOI 10.14359/51716976. [Google Scholar] [CrossRef]
12. Ting, M. Z. Y., Wong, K. S., Rahman, M. E., Meheron, S. J. (2020). Deterioration of marine concrete exposed to wetting-drying action. Journal of Cleaner Production, 278, 123383. DOI 10.1016/j.jclepro.2020.123383. [Google Scholar] [CrossRef]
13. Al-Baghdadi, H. M. (2021). Experimental study on sulfate resistance of concrete with recycled aggregate modified with polyvinyl alcohol (PVA). Case Studies in Construction Materials, 14(11), e00527. DOI 10.1016/j.cscm.2021.e00527. [Google Scholar] [CrossRef]
14. Wei, Y. M., Chai, J. R., Qin, Y., Li, Y. L., Xu, Z. G. et al. (2021). Effect of fly ash on mechanical properties and microstructure of cellulose fiber-reinforced concrete under sulfate dry–wet cycle attack. Construction and Building Materials, 302, 124207. DOI 10.1016/j.conbuildmat.2021.124207. [Google Scholar] [CrossRef]
15. Al-Dulaijan, S. U. (2007). Sulfate resistance of plain and blended cements exposed to magnesium sulfate solutions. Construction and Building Materials, 21(8), 1792–1802. DOI 10.1016/j.conbuildmat.2006.05.017. [Google Scholar] [CrossRef]
16. Guo, J. J., Liu, P. Q., Wu, C. L., Wang, K. (2021). Effect of dry–wet cycle periods on properties of concrete under sulfate attack. Applied Sciences, 11(2), 888. DOI 10.3390/app11020888. [Google Scholar] [CrossRef]
17. Bhargava, A., Banthia, N. (2006). Measurement of concrete permeability under stress. Experimental Techniques, 30(5), 28–31. DOI 10.1111/j.1747-1567.2006.00082.x. [Google Scholar] [CrossRef]
18. Torres-Acosta, A. A. (2019). Water and chloride permeability of cement-based mortar with dehydrated cacti additions. Journal of Chemical Technology & Biotechnology, 94(11), 3488–3494. DOI 10.1002/jctb.5938. [Google Scholar] [CrossRef]
19. Linderoth, O., Johansson, P., Wadsö, L. (2020). Development of pore structure, moisture sorption and transport properties in fly ash blended cement-based materials. Construction and Building Materials, 261, 120007. DOI 10.1016/j.conbuildmat.2020.120007. [Google Scholar] [CrossRef]
20. Lu, X., Kharaghani, A., Tsotsas, E. (2020). Transport parameters of macroscopic continuum model determined from discrete pore network simulations of drying porous media. Chemical Engineering Science, 223, 115723. DOI 10.1016/j.ces.2020.115723. [Google Scholar] [CrossRef]
21. Mukiza, E., Zhang, L. L., Liu, X. M. (2020). Durability and microstructure analysis of the road base material prepared from red mud and flue gas desulfurization fly ash. International Journal of Minerals. Metallurgy and Materials, 27(4), 555–568. DOI 10.1007/s12613-019-1915-5. [Google Scholar] [CrossRef]
22. Solomon, F., Ekolu, S. O. (2020). Comparison of various permeability methods applied upon clay concretes-statistical evaluation. Journal of Testing and Evaluation, 48(4), 2639–2654. DOI 10.1520/JTE20160546. [Google Scholar] [CrossRef]
23. Khan, M. I. (2012). Comparison of chloride ion penetration and diffusion of high-performance concrete. KSCE Journal of Civil Engineering, 16(5), 779–784. DOI 10.1007/s12205-012-1237-x. [Google Scholar] [CrossRef]
24. Meziani, H. (2006). Gas permeability measurements of cement-based materials under hydrostatic test conditions using a low-transient method. Magazine of Concrete Research, 58(8), 489–503. DOI 10.1680/macr.2006.58.8.489. [Google Scholar] [CrossRef]
25. Zhan, Z., Chen, H., Zhang, Y., Cheng, R., Deng, G. (2022). A review of test methods for the determination of the permeability coefficient of gravelly soils used for embankment dams. Fluid Dynamics & Materials Processing, 18(1), 131–144. DOI 10.32604/fdmp.2022.017536. [Google Scholar] [CrossRef]
26. Kim, J., Kim, J., Jung, H., Ha, J. C. (2013). Experiment on gas entry pressure and gas permeability of concrete silo for a low- and intermediate-level waste disposal facility in Korea. Nuclear Engineering and Design, 265, 841–845. DOI 10.1016/j.nucengdes.2013.08.065. [Google Scholar] [CrossRef]
27. Abbas, A., Carcasses, M., Ollivier, J. P. (1999). Gas permeability of concrete in relation to its degree of saturation. Materials and Structures, 32(1), 3–8. DOI 10.1007/bf02480405. [Google Scholar] [CrossRef]
28. Gu, L., Visintin, P., Bennett, T. (2017). Evaluation of accelerated degradation test methods for cementitious composites subject to sulfuric acid attack; application to conventional and alkali-activated concretes. Cement and Concrete Composites, 87, 187–204. DOI 10.1016/j.cemconcomp.2017.12.015. [Google Scholar] [CrossRef]
29. Onuaguluchi, O., Banthia, N. (2019). Long-term sulfate resistance of cementitious composites containing fine crumb rubber. Cement and Concrete Composites, 104(5), 779–784. DOI 10.1016/j.cemconcomp.2019.103354. [Google Scholar] [CrossRef]
30. He, R., Zheng, S. N., Gan, V. J. L., Wang, Z. D., Fang, J. H. et al. (2020). Damage mechanism and interfacial transition zone characteristics of concrete under sulfate erosion and Dry-Wet cycles. Construction and Building Materials, 255(C), 119340. DOI 10.1016/j.conbuildmat.2020.119340. [Google Scholar] [CrossRef]
31. Naik, N. N., Jupe, A. C., Stock, S. R., Wilkinson, A. P., Lee, P. L. et al. (2006). Sulfate attack monitored by microCT and EDXRD: Influence of cement type, water-to-cement ratio, and aggregate. Cement and Concrete Research, 36(1), 144–159. DOI 10.1016/j.cemconres.2005.06.004. [Google Scholar] [CrossRef]
32. Chen, Y. J., Gao, J. M., Tang, L. P., Li, X. H. (2016). Resistance of concrete against combined attack of chloride and sulfate under drying–wetting cycles. Construction and Building Materials, 106, 650–658. DOI 10.1016/j.conbuildmat.2015.12.151. [Google Scholar] [CrossRef]
33. Jiang, L., Niu, D. T. (2016). Study of deterioration of concrete exposed to different types of sulfate solutions under drying-wetting cycles. Construction and Building Materials, 117, 88–98. DOI 10.1016/j.conbuildmat.2016.04.094. [Google Scholar] [CrossRef]
34. Qi, B., Gao, J. M., Chen, F., Shen, D. M. (2017). Evaluation of the damage process of recycled aggregate concrete under sulfate attack and wetting-drying cycles. Construction and Building Materials, 138, 254–262. DOI 10.1016/j.conbuildmat.2017.02.022. [Google Scholar] [CrossRef]
35. Chen, W., Han, Y., Agostini, F., Skoczylas, F., Corbeel, D. (2021). Permeability of a macro-cracked concrete effect of confining pressure and modelling. Materials, 14(4), 862. DOI 10.3390/MA14040862. [Google Scholar] [CrossRef]
36. Qian, R. S., Shi, J. S., Li, Y., Chen, W., Liu, G. J. et al. (2020). Investigation on parameters optimization for gas permeability testing of concrete: Inlet-gas pressure and confining pressure. Construction and Building Materials, 250(C), 118901. DOI 10.1016/j.conbuildmat.2020.118901. [Google Scholar] [CrossRef]
37. Najjar, M. F., Nehdi, M. L., Soliman, A. M., Azabi, T. M. (2017). Damage mechanisms of two-stage concrete exposed to chemical and physical sulfate attack. Construction and Building Materials, 137, 141–152. DOI 10.1016/j.conbuildmat.2017.01.112. [Google Scholar] [CrossRef]
38. Santhanam, M., Cohen, M. D., Olek, J. (2002). Modeling the effects of solution temperature and concentration during sulfate attack on cement mortars. Cement and Concrete Research, 32(4), 585–592. DOI 10.1016/s0008-8846(01)00727-x. [Google Scholar] [CrossRef]
39. Shimada, Y., Young, J. F. (2004). Thermal stability of ettringite in alkaline solutions at 80°C. Cement and Concrete Research, 34(12), 2261–2268. DOI 10.1016/j.cemconres.2004.04.008. [Google Scholar] [CrossRef]
40. Liu, P., Chen, Y., Yu, Z. W., Lu, Z. H. (2019). Effect of sulfate solution concentration on the deterioration mechanism and physical properties of concrete. Construction and Building Materials, 227, 116641. DOI 10.1016/j.conbuildmat.2019.08.022. [Google Scholar] [CrossRef]
41. Zhutovsky, S., Hooton, R. D. (2017). Experimental study on physical sulfate salt attack. Materials and Structures, 50(1), 54. DOI 10.1617/s11527-016-0936-z. [Google Scholar] [CrossRef]
42. Ye, B., Cheng, Z. R., Ni, X. Q. (2018). Effects of multiple heating-cooling cycles on the permeability and microstructure of a mortar. Construction and Building Materials, 176, 156–164. DOI 10.1016/j.conbuildmat.2018.05.009. [Google Scholar] [CrossRef]
43. Han, J. S., Li, Z. L., Liu, H. J., Zhang, G. H., Tan, C. et al. (2018). Study on the process of isothermal continuous drying and its effect on the strength of concrete of different strength grades. Construction and Building Materials, 187, 14–24. DOI 10.1016/j.conbuildmat.2018.07.167. [Google Scholar] [CrossRef]
44. Zhang, G. H., Li, Z. L., Zhang, L. F., Shang, Y. J., Wang, H. (2017). Experimental research on drying control condition with minimal effect on concrete strength. Construction and Building Materials, 135, 194–202. DOI 10.1016/j.conbuildmat.2016.12.141. [Google Scholar] [CrossRef]
45. Yurtdas, I., Burlion, N., Shao, J. F., Li, A. (2011). Evolution of the mechanical behaviour of a high performance self-compacting concrete under drying. Cement and Concrete Composites, 33(3), 380–388. DOI 10.1016/j.cemconcomp.2010.12.002. [Google Scholar] [CrossRef]
46. Wang, P., Zhang, X. (2022). Experimental study on seepage characteristics of a soil-rock mixture in a fault zone. Fluid Dynamics & Materials Processing, 18(2), 271–283. DOI 10.32604/fdmp.2022.017882. [Google Scholar] [CrossRef]
47. Feng, Y., Liu, Y., Chen, J., Mao, X. (2022). Simulation of the pressure-sensitive seepage fracture network in oil reservoirs with multi-group fractures. Fluid Dynamics & Materials Processing, 18(2), 395–415. DOI 10.32604/fdmp.2022.018141. [Google Scholar] [CrossRef]
48. Sarkar, S., Mahadevan, S., Meeussen, J. C. L., van der sloot, H., Kosson, D. S. (2010). Numerical simulation of cementitious materials degradation under external sulfate attack. Cement and Concrete Composites, 32(3), 241–252. DOI 10.1016/j.cemconcomp.2009.12.005. [Google Scholar] [CrossRef]
Cite This Article
 Copyright © 2023 The Author(s). Published by Tech Science Press.
This work is licensed under a Creative Commons Attribution 4.0 International License , which permits unrestricted use, distribution, and reproduction in any medium, provided the original work is properly cited.
 Downloads
 Citation Tools