
 Submit a Paper
 Propose a Special lssue
 Open Access
ARTICLE
Sand Production Prediction and Safe Differential Pressure Determination in a Deepwater Gas Field
1 CNOOC Research Institute, Ltd., Beijing, 100028, China
2 China University of Petroleum (East China), Qingdao, 266580, China
* Corresponding Author: Rui Zhang. Email:
Fluid Dynamics & Materials Processing 2023, 19(3), 579-592. https://doi.org/10.32604/fdmp.2022.020297
Received 16 November 2021; Accepted 12 May 2022; Issue published 29 September 2022
 View Full Text
 Download PDF
Abstract
Sand production is a critical issue during the development of offshore oil and gas fields. Certain gas fields (e.g. the AB gas field) have high porosity and high permeability, and with water at the bottom of the reservoir, the risk of sand production greatly increases at high differential pressures. Based on reservoir properties, geological conditions, production requirements, and well logging data, in this study an ultrasonic time difference method, a B index method, and a S index method are used together with a model of rock mass failure (accounting for water influx and pressure depletion) to qualitatively predict sand production. The results show that considered sample gas field has an overall high risk of sand production. The critical differential pressure (CDP) without water influx is in the range of 1.40 to 2.35 MPa, the CDP after water influx is from 0.60 to 1.41MPa. The CDP under pressure depletion is in the range of 1.20 to 1.92 MPa. The differential pressure charts of sand production are plotted, and the safe differential pressure windows with or without water influx are obtained. The model calculation results and the experimental results are consistent with the field production data, which indicates that the implemented prediction method could be taken as a reference for sand production prediction in similar deep water gas fields.Keywords
Nomenclature
| B | B index of sand production, MPa |
| E | Elastic modulus, MPa |
| µ | Poisson’s ratio |
| Δtp | Longitudinal wave time difference, μs/ft |
| ρ | Formation density, g/cm3 |
| Vp | Longitudinal wave speed, ft/μs |
| Vs | Shear wave speed, m/μs |
| R | S index of sand production, MPa2 |
| K | Bulk modulus of rock, MPa |
| G | Shear modulus of rock, MPa |
| Pw | Bottomhole pressure, MPa |
| Pp | Pore pressure, MPa |
| α1 | Effective stress factor |
| ϕ1 | Porosity |
| δ | Transition coefficient |
| α | Well angle, ° |
| β | Azimuth of Well Deviation (Take the minimum horizontal principal stress direction as 0), ° |
| θ | Well circumferential angle, ° |
| σ1 | Maximum principal stress, MPa |
| σ2 | Median principal stress, MPa |
| σ3 | Minimum principal stress, MPa |
| c | Cohesion force, MPa |
| φ | Friction angle, ° |
| c0 | Initial cohesion force, MPa |
| φ0 | Initial friction angle, ° |
| m0 | Deterioration degree of cohesion force |
| n0 | Deterioration degree of friction angle |
| cw | Cohesion force after water saturation, MPa |
| φw | Friction angle after water saturation, ° |
Sand production prediction involves multiple factors including rock strength, reservoir fluid dynamics, and flow properties, additionally with gas well production systems, well completion methods, etc. The current research on sand production prediction mainly focuses on two stages of production, the initial period, and the period where water influx and pressure depletion are encountered.
(1) Sand production prediction for initial production stage
Common sand production prediction methods for the initial production stage include on-site observation, empirical calculation, laboratory test, and numerical simulation.
In the early 1970s, sand production prediction was made by observing the rock porosity or the initial production performance data of oil and gas wells; this method can only qualitatively analyze whether oil and gas wells have sanding risk based on formation compaction degree. For well-compacted formation, the accuracy of a such method is insufficient. Stein used empirical equations to determine sanding risks. Based on logging data and rock mechanic test data, the ultrasonic time difference, combined modulus, B index, and Schlumberger index are calculated to predict whether the formation will produce sands [1]. Empirical equations are practical and straightforward and are widely used worldwide.
As for laboratory tests, Geertsma used a thick-walled hollow cylinder model to evaluate the initial failure of sandstone, but they could not explain the further behaviors such as borehole expansion or perforation [2].
The numerical simulation method studies the coupled situation of fluid and solid phases in the formation. Volonté established a dynamically coupled numerical model of rock and fluid mechanics [3]. The model parameters are complicated and difficult to obtain, and the calculation process is time-consuming. At present, CDP prediction models mainly include the Morita model, Empirical model, shear failure model, and Vaziri model. The Vaziri model, the shear failure model, and the Morita model do not consider hydrodynamic factors, while the empirical model can only be used after the production starts and necessary data have been collected.
(2) Sand production prediction for production period with pressure depletion and water influx
El-sayed derived a calculation method for maximum production under sand-free conditions using the stress distribution around horizontal wellbore with open-hole completions [4]. Kooijman made artificial sandstone samples for strength tests, analyzed the problems of wellbore collapse and sand production of horizontal wells in poorly compacted sandstone formations [5]. Budiningsih investigated the rock strength during the production process of directional wells, and analyzed wellbore collapse and sand production [6]. He proposed that differential pressure influences wellbore collapse and sand production, and correct differential pressure is essential for preventing sand production. Hoek conducted theoretical analysis and experiments on the relationship between sand and oil production in horizontal wells [7] Aiming at horizontal wells and extended reach wells, Nouri did a transient analysis of sand production in horizontal wells and proposed a sand production prediction model [8]. Dong assumed that gas flow in pores is in non-Darcy form, then analyzed the stress state of rock on the wellbore, derived elastic rock stress-strain equations and a gas well sand production prediction model based on the Mohr-Coulomb criterion [9]. The analytical solutions of CDP and sand production radius were obtained. Yang started from the three-dimensional force analysis of rock on horizontal wellbore, studied the sanding mechanism and wellbore stability in the reservoir, and used the Mohr-Coulomb criterion to calculate CDP for horizontal wells [10]. Wang studied the sand production radius of horizontal wells based on in-situ stress and CDP, considering in-situ stress distribution and rock strength parameters along the well trajectory [11]. There was a lack of research on the influence of water influx in sand production prediction. Zhang et al. established a CDP calculation model considering the influence of stress change after formation failure and rock strength change after water influx, and a full production cycle sand production prediction method for offshore pressure-depleted gas reservoirs was proposed [12].
2 Qualitative Sand Production Prediction
The qualitative methods are based on petrophysical properties and on-site experiences. These methods give prediction based on initial production data. The methods are simple to use and economical.
(1) Ultrasonic time difference method
The ultrasonic time difference is the reciprocal of longitudinal wave velocity in the wellbore direction. It reflects the rock compaction status; low speed represents small rock strength, indicating a high possibility of sanding. Specific critical time difference values are often used to determine the sanding risk.
This paper takes 105 μs/ft as the critical value for sanding prediction. If the time difference is greater than 105 μs/ft, sand control measures are necessary. When considering the actual conditions of oil and gas fields and processing requirements, 95∼105 μs/ft can be regarded as the critical value window for determining sanding risks.
(2) B index method
Due to the loose state of rock in formations, cores are usually difficult to be harvested and preserved as intact. Therefore, it is often unrealistic to determine the sand production situation by coring. Logging data can be used instead to determine the sanding risk to guide further operations.
The B index method can predict sand production by elastic modulus and Poisson’s ratio, or by the relationship between reservoir density and longitudinal wave time difference.
or
where
The B index has strong correlativity with elastic modulus, therefore indicating the strength of formation rock. Under a reasonable production system for oil and gas exploitation, when B is smaller than 2.0 × 10⁴ MPa, it is likely to produce sand. A smaller B index indicates a higher possibility of sand production and more severe sand production it would be, where the differential pressure for production should be limited.
(3) S index method
To estimate the strength of the rock more accurately, Schlumberger’s sand production index method is introduced, which defines the sand production index as follows:
The Schlumberger ratio R increases with rock strength. It is suggested that when R < 5.9 × 10⁷ MPa2, there is sanding risk in the formation.
The three sand production prediction methods above have good consistency in results, and the results calculated by the Schlumberger sand production index method can match well with logging data. However, the qualitative prediction methods consider only the logging data but not the actual working conditions in production; the prediction results can be taken as references but have limited practical value.
3 Quantitative Sand Production Prediction
3.1 CDP Prediction after Pressure Depletion
The decrease of pore pressure will lead to an effective stress increase in the formation. When the bottom hole pressure (BHP) is constant, the maximum radial stress on the wellbore or perforated hole increases with the decrease of differential pressure, and the possibility of shear yielding rises.
Therefore, reservoir pressure depletion is one key reason for sand production increase in formation. The stress distribution and formation strength changes after pressure depletion need to be analyzed to predict CDP.
(1) Stress distribution after pressure depletion
The reservoir pressure depletion can result in wellbore stress changes, especially the two principal stresses in a horizontal direction. The change in ground stress makes CDP prediction more complicated.
The horizontal stresses of the reservoir in the middle and late stages of development are as Eq. (6):
(2) CDP prediction
Taking one open-hole section of an inclined well as the object to analyze the stress distribution of surrounding rock near the wellbore. The force analysis of the surrounding rock is shown in Fig. 1.
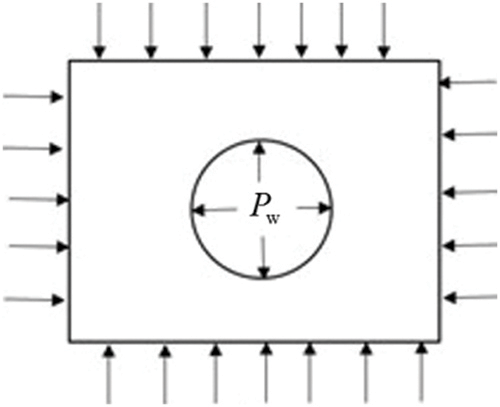
Figure 1: Near wellbore formation force analysis
The stress distribution of wellbore surroundings is:
where
Determine the maximum principal stress by sorting σi, σj, σk. Maximum principal stress σ1 = max{σi,σj,σk}, minimum principal stress: σ3 = min{σi,σj,σk}, median principal stress σ2 = median{σi,σj,σk}
Mogi-Coulomb criterion:
where
When Eq. (9) is satisfied, the wellbore starts to break and produce sand. The calculation of CDP is:
3.2 CDP Prediction after Water Influx
The rock strength deterioration mechanisms by water influx mainly include two aspects. Firstly, water influx changes the capillary forces in pores and weakens the rock strength. Secondly, the clay content swells when exposed to water, enlarging the grain spacing and weakening the cohesion of the rock.
The cohesion and friction angle after water influx can be evaluated by water-saturated rock test. To calculate the CDP, it is necessary to evaluate the deterioration degrees of cohesion and friction angle after water influx. The deterioration degrees can be calculated as:
The CDP under water influx can then be calculated by merging deteriorated cohesion and friction angle into Eq. (9).
4 Sand Production Prediction of a Deepwater Gas Field
AB gas field has an average water depth of 1220~1560 m. The unconsolidated sandstone reservoirs in the AB gas field are mostly bottom water gas reservoirs, and a few edge water gas reservoirs.
An indirect way to acquire the rock properties is to calculate Young’s modulus, Poisson’s ratio, and cohesion force by logging data. These parameters are a comprehensive reflection of the rock properties of the target formation.
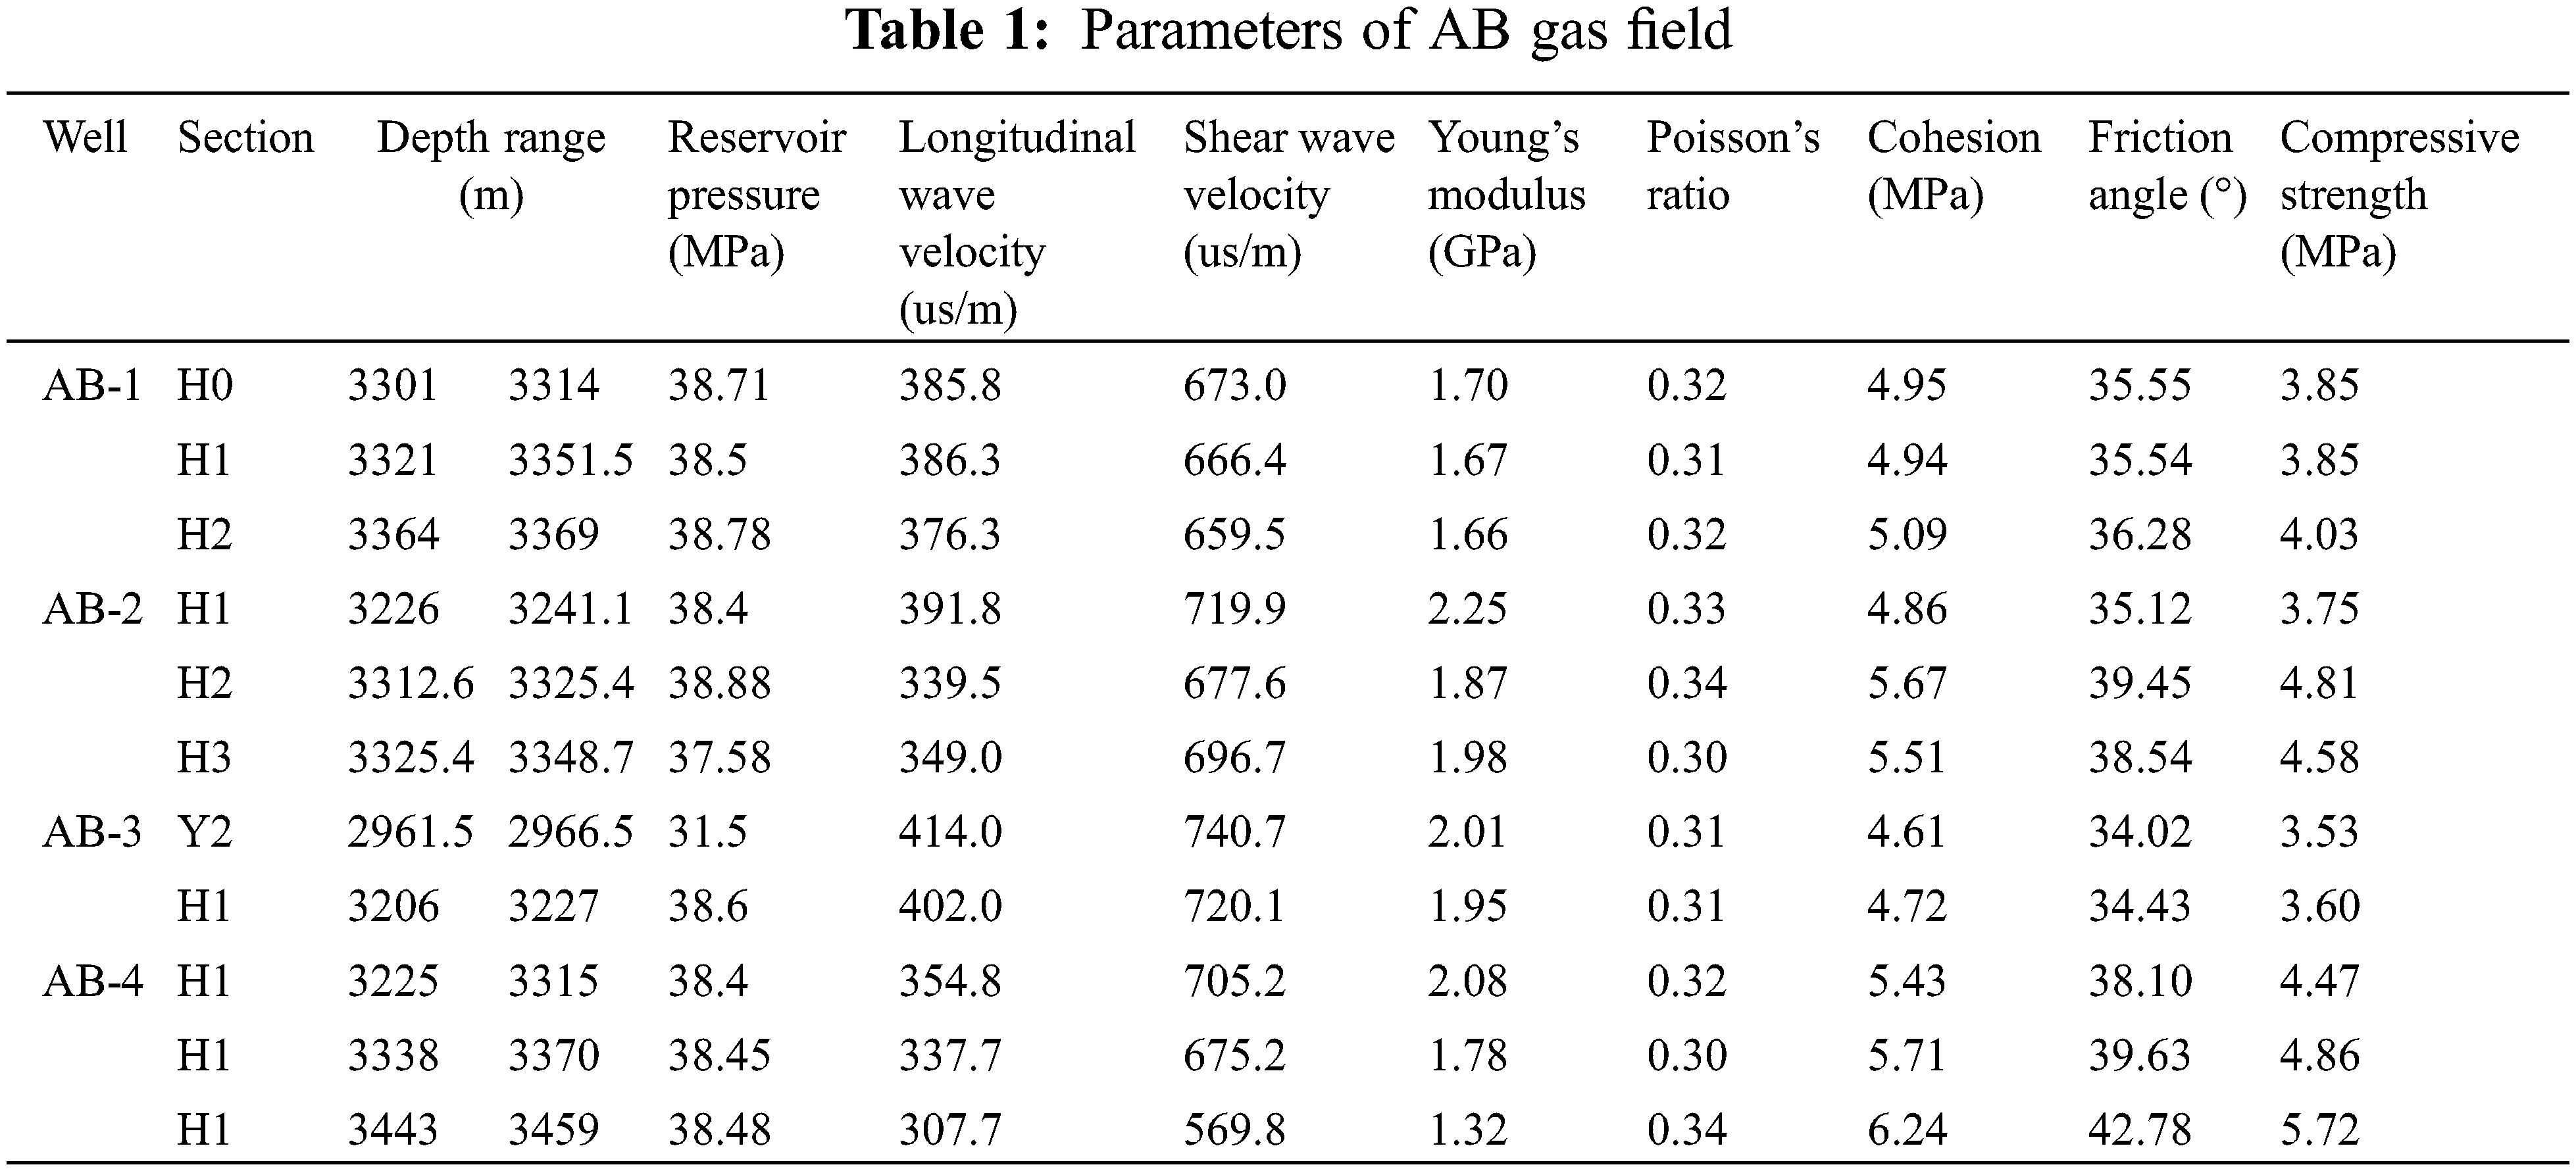
The basic data of the AB gas field are shown in Table 1.
The parameter profiles calculated from the basic data of AB gas field are shown in Fig. 2.
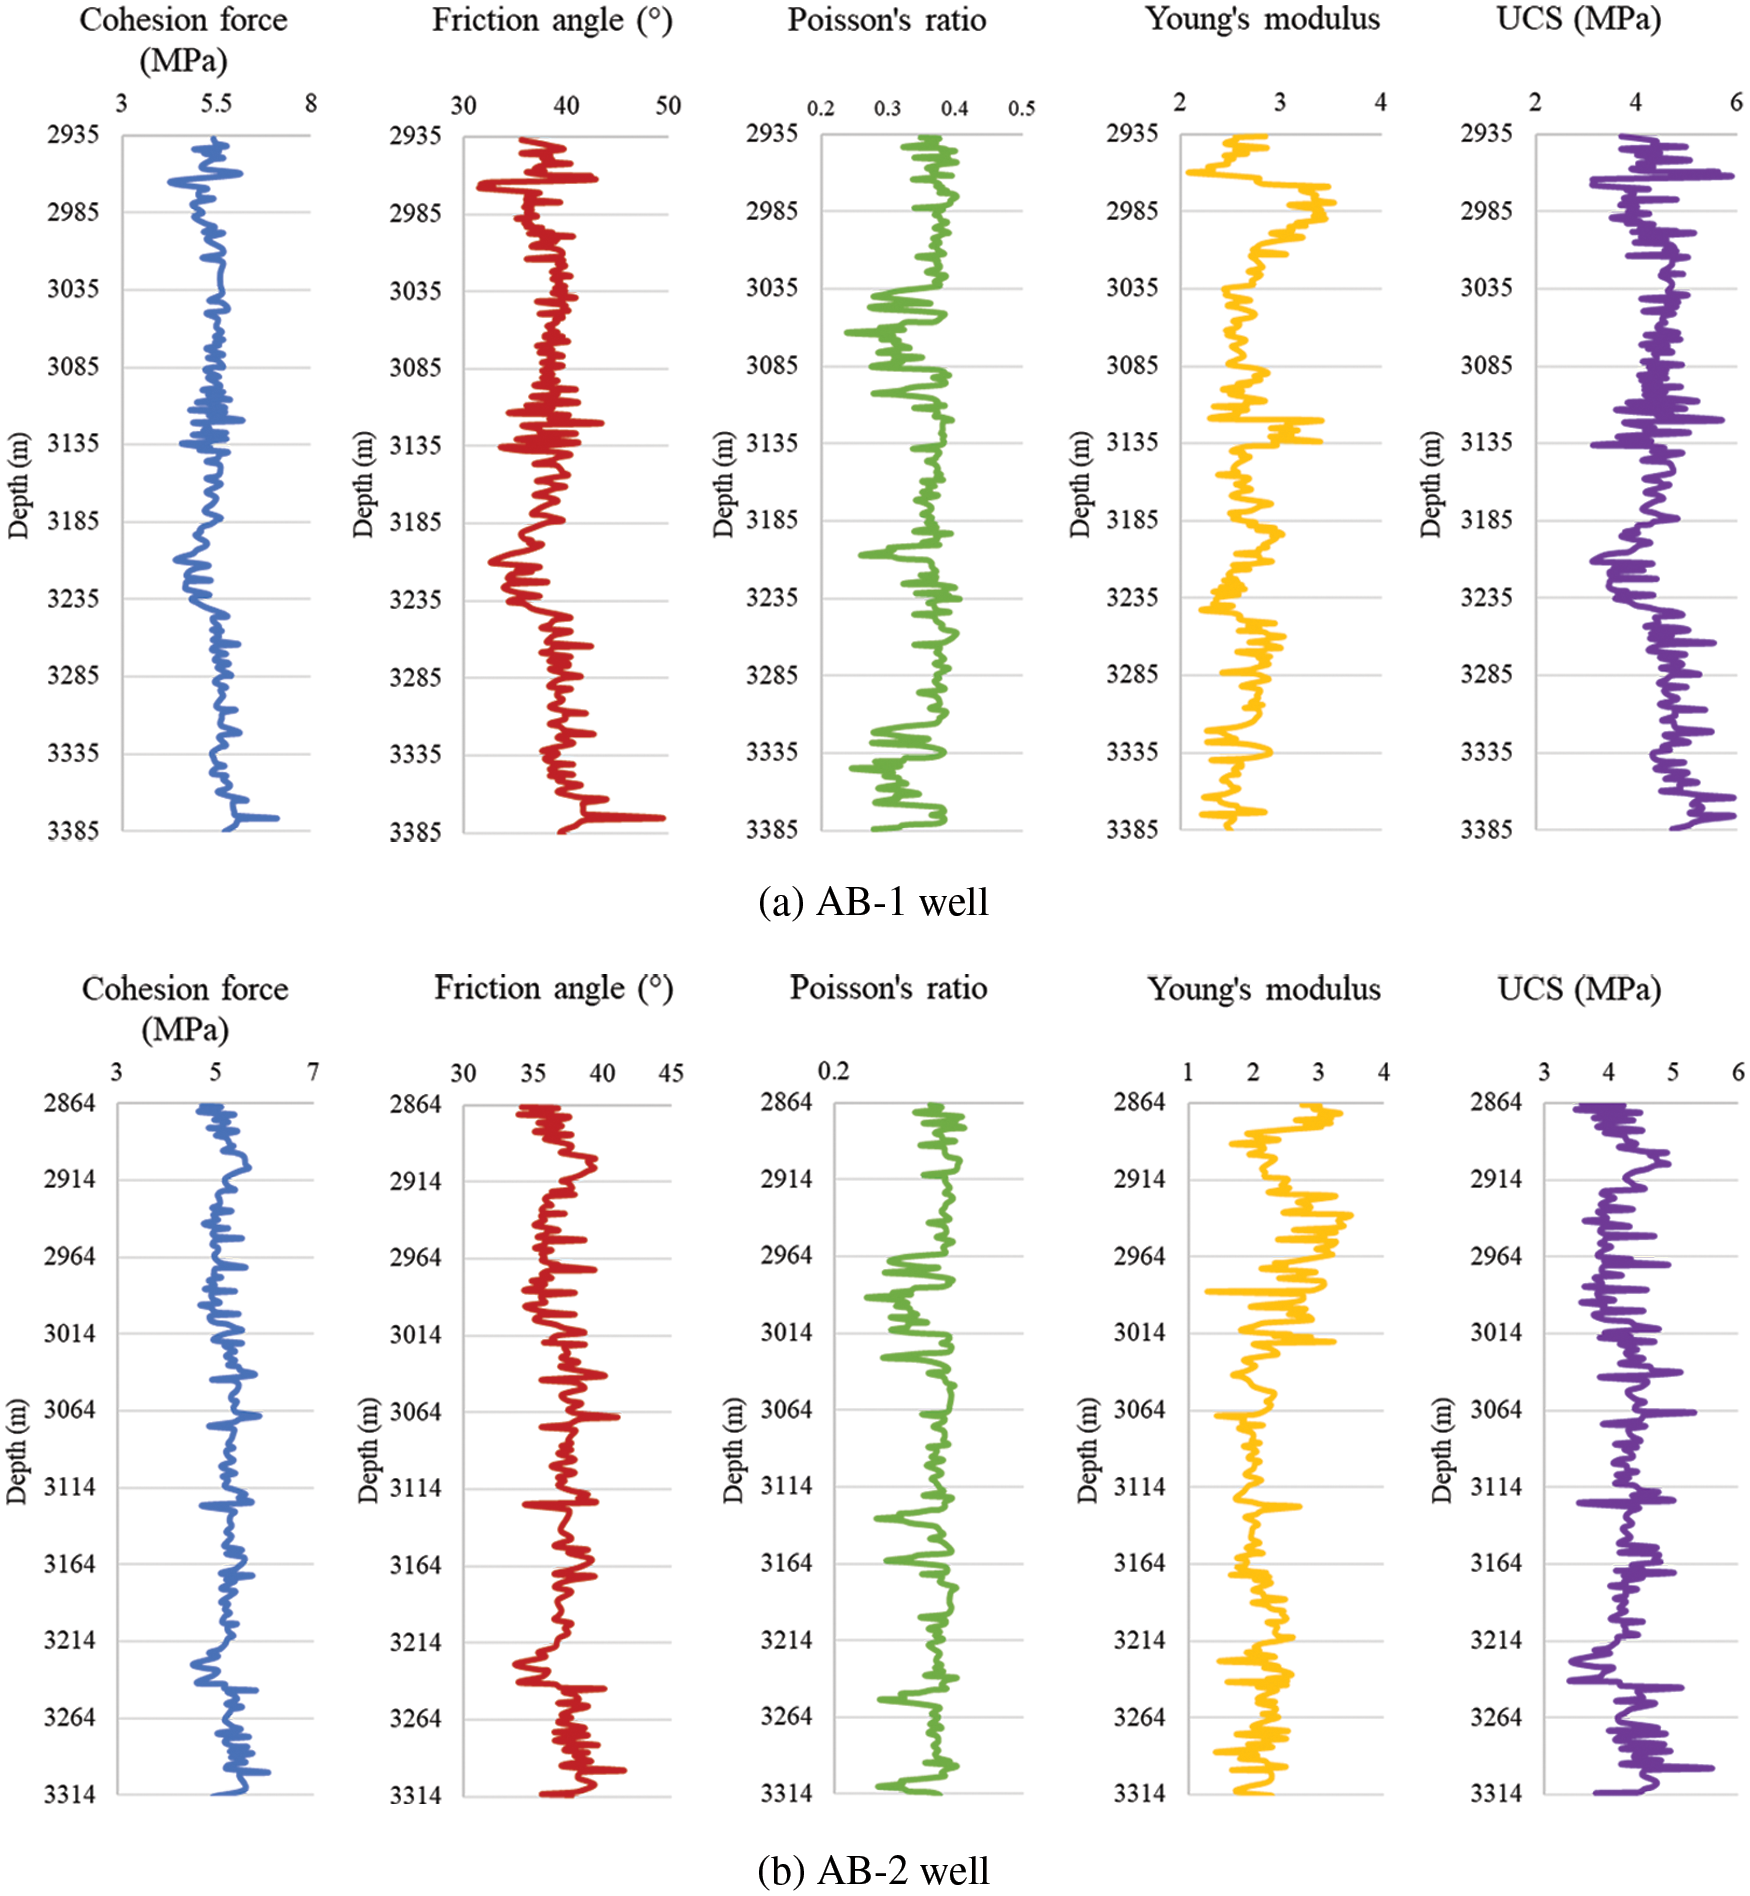
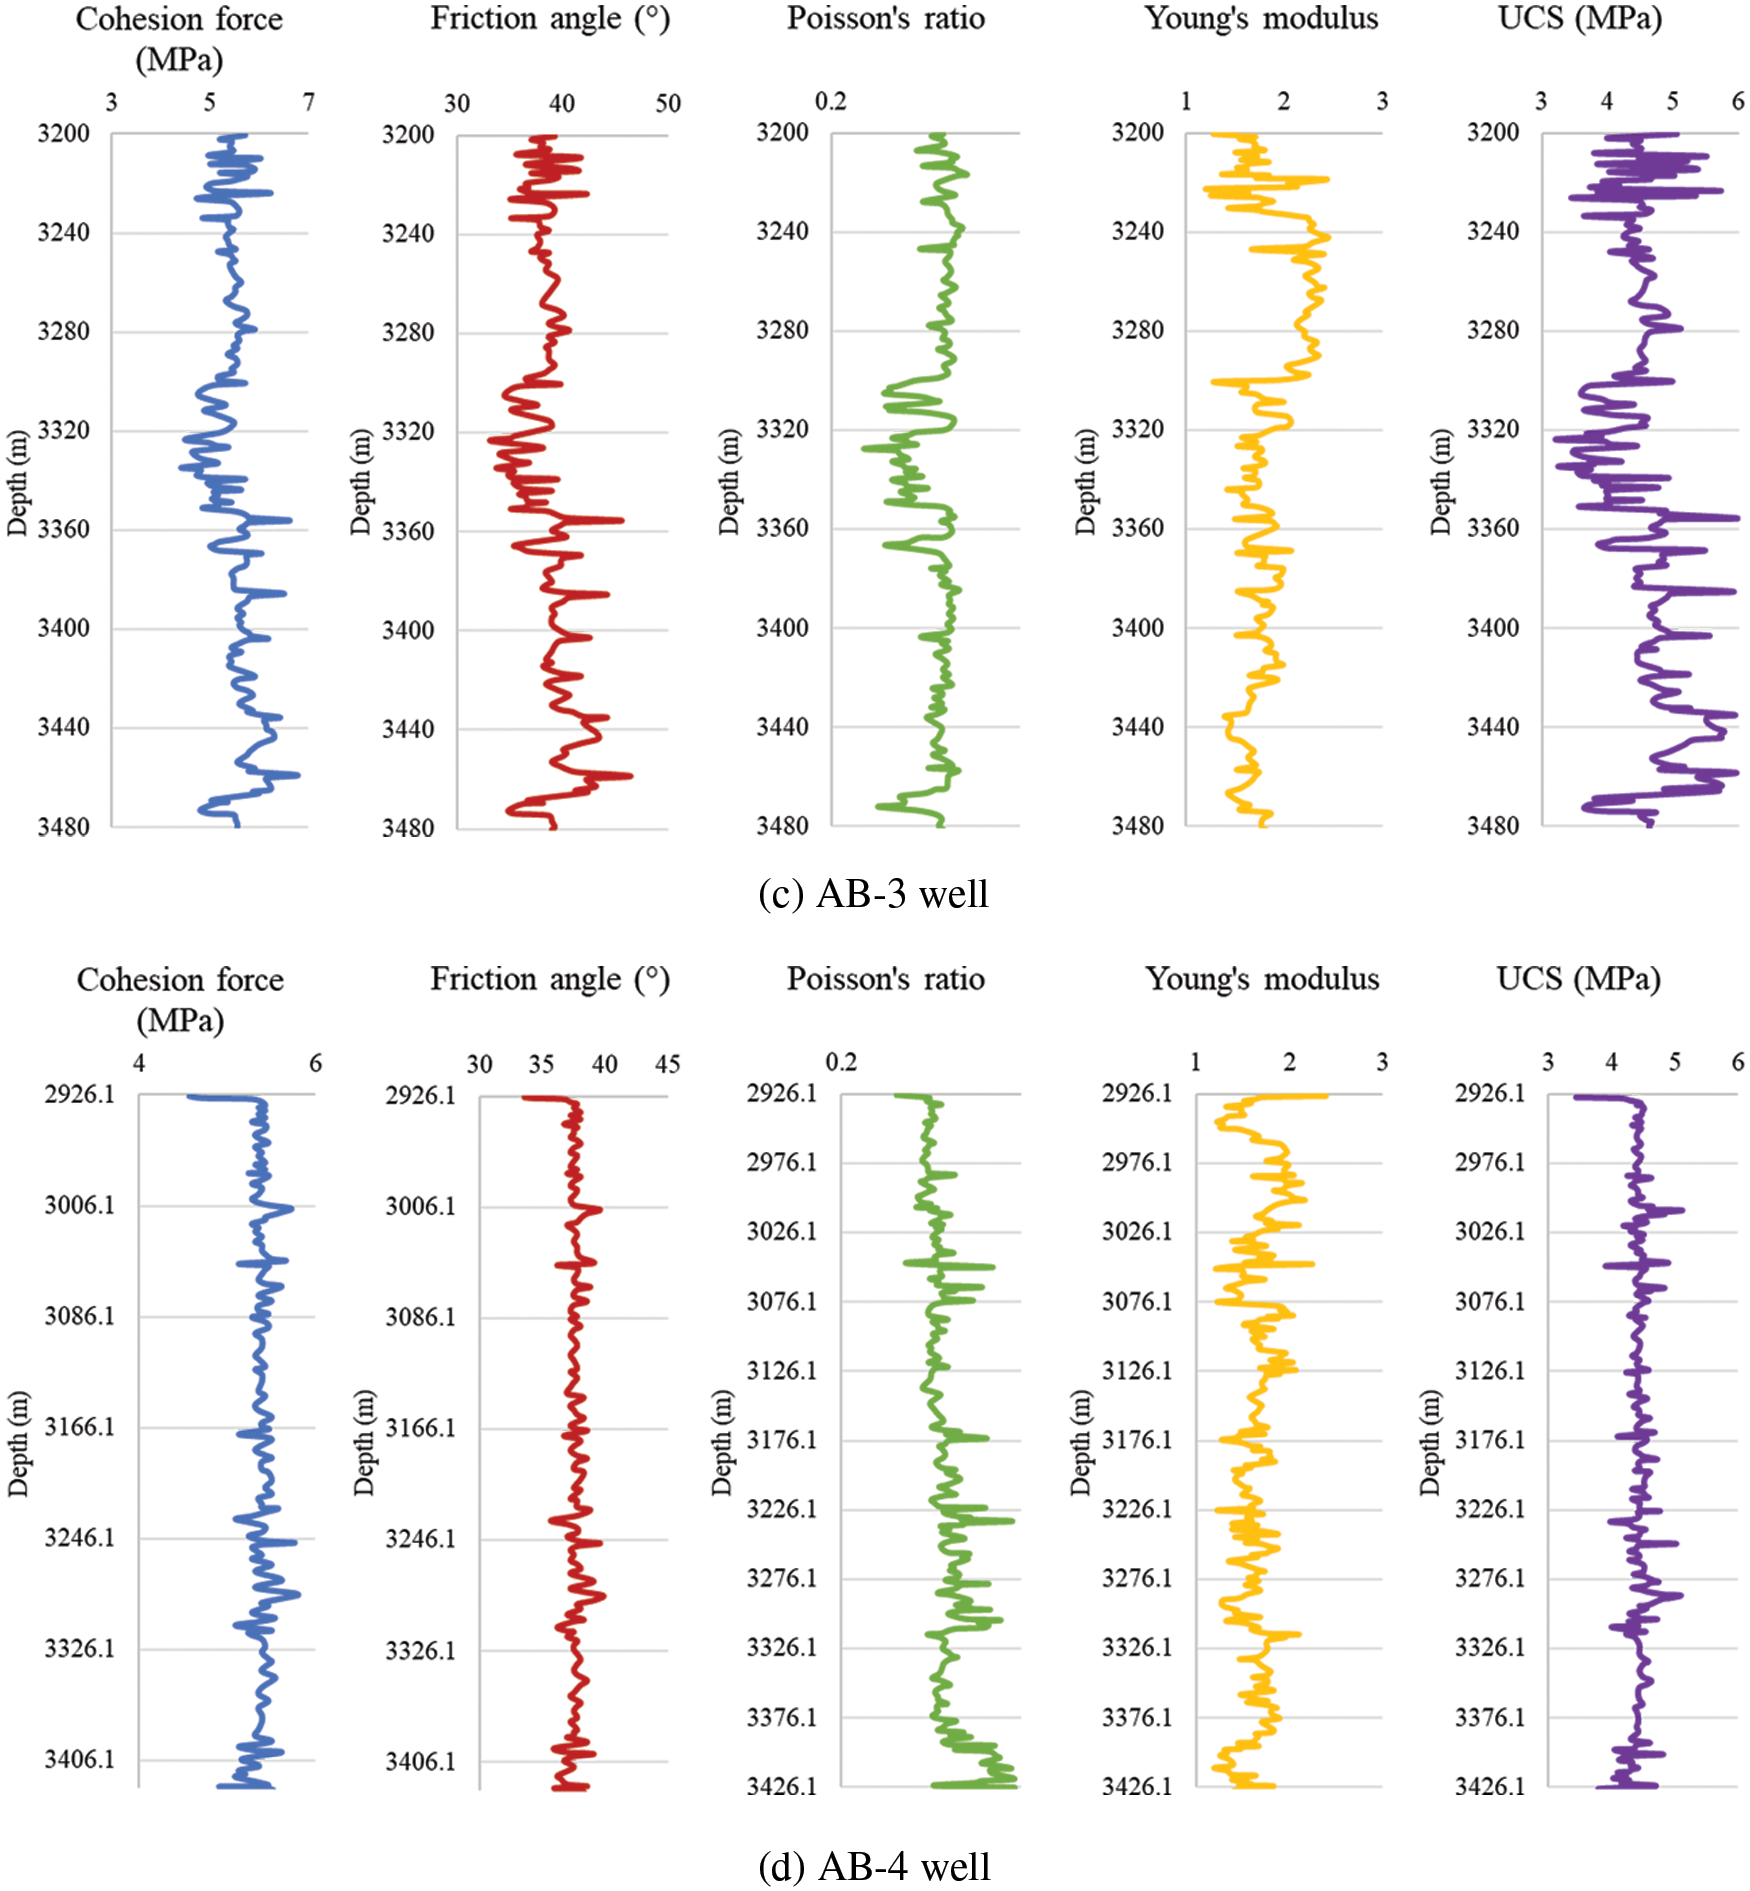
Figure 2: Rock property profiles of each well in AB gas field
The cohesion force of the formation rock of AB gas field is around 5 MPa, the friction angle is in the range of 35° to 50°, the Poisson’s ratio is in the range of 0.22 to 0.50, the Young’s modulus is in the range of 1.04 to 3.41 GPa, and the UCS is in the range of 3.02 to 5.96 MPa.
4.3 Qualitative Prediction Results
Based on the well logging data and the core acoustic test data, qualitative predictions of sand production in the AB gas field reservoir are acquired. The curves of different methods are shown in Figs. 3–6.
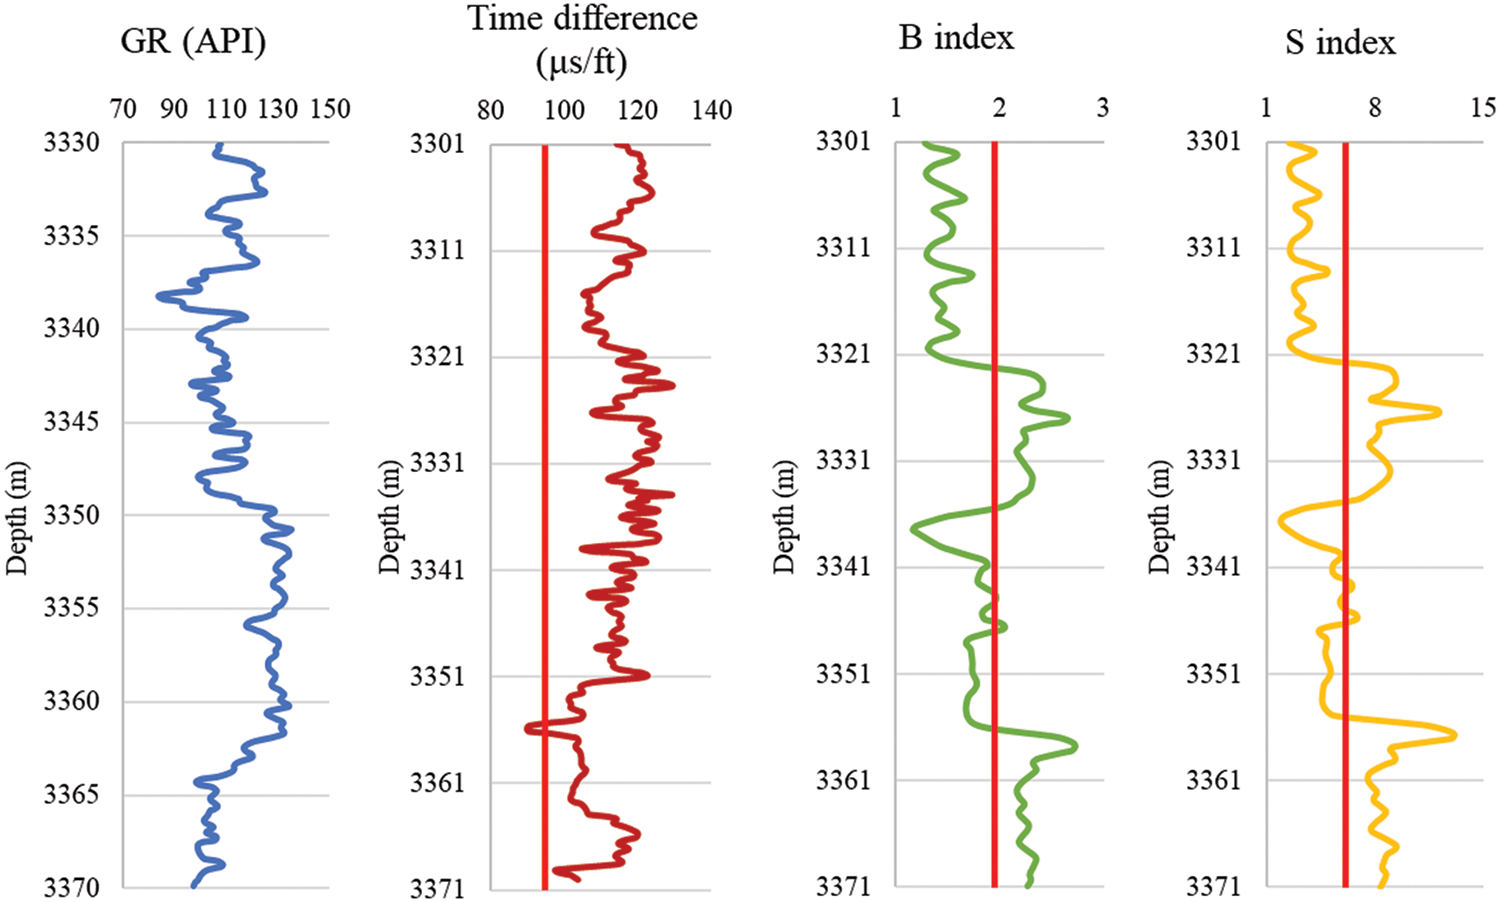
Figure 3: AB-1 well qualitative prediction results
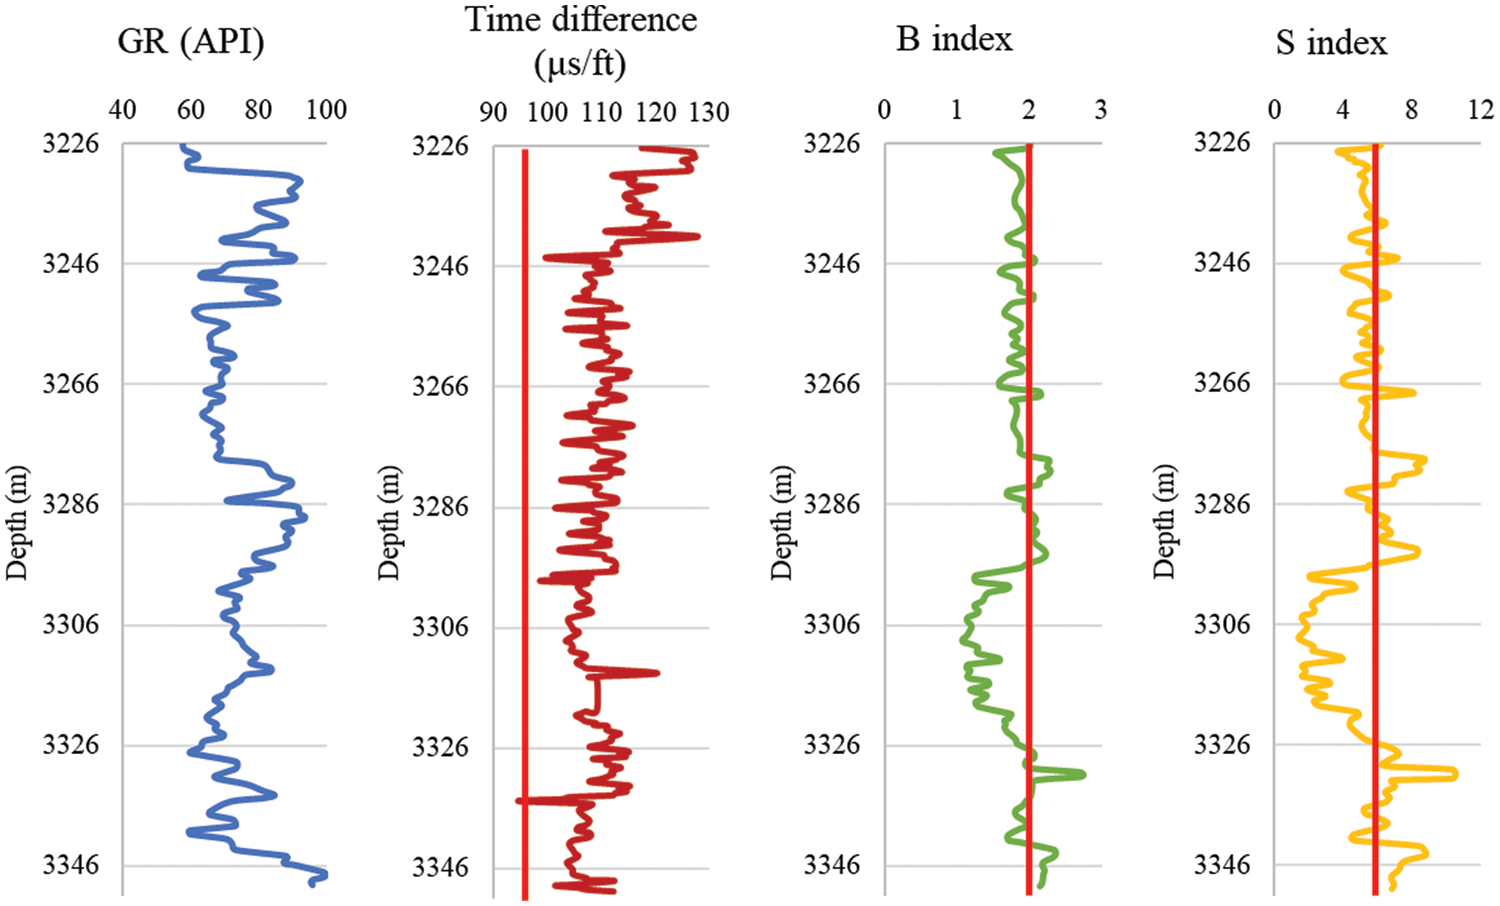
Figure 4: AB-2 well qualitative prediction results
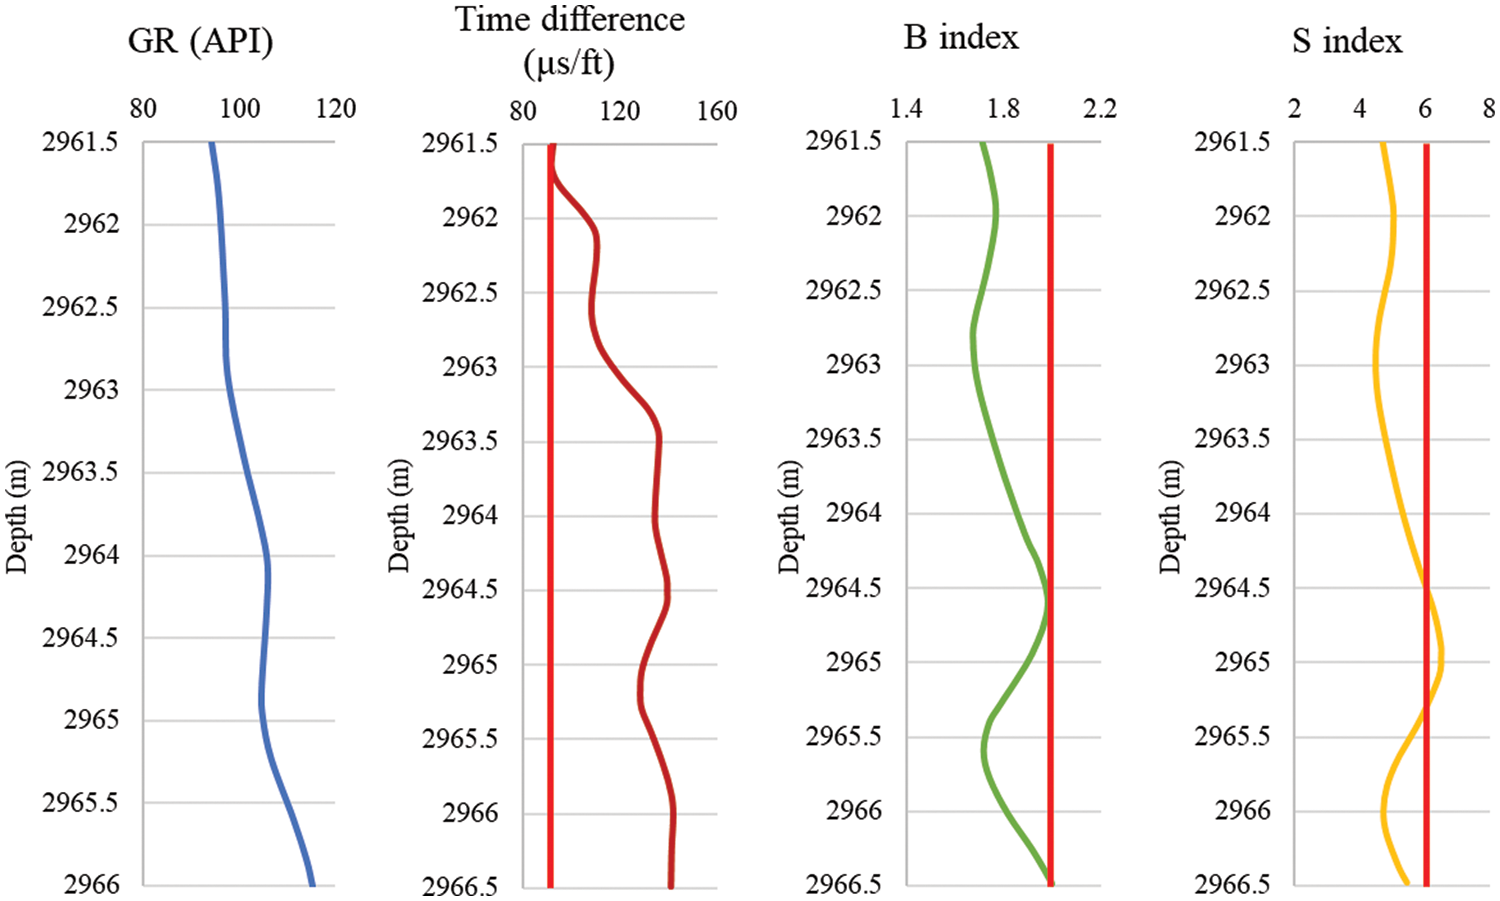
Figure 5: AB-3 well qualitative prediction results
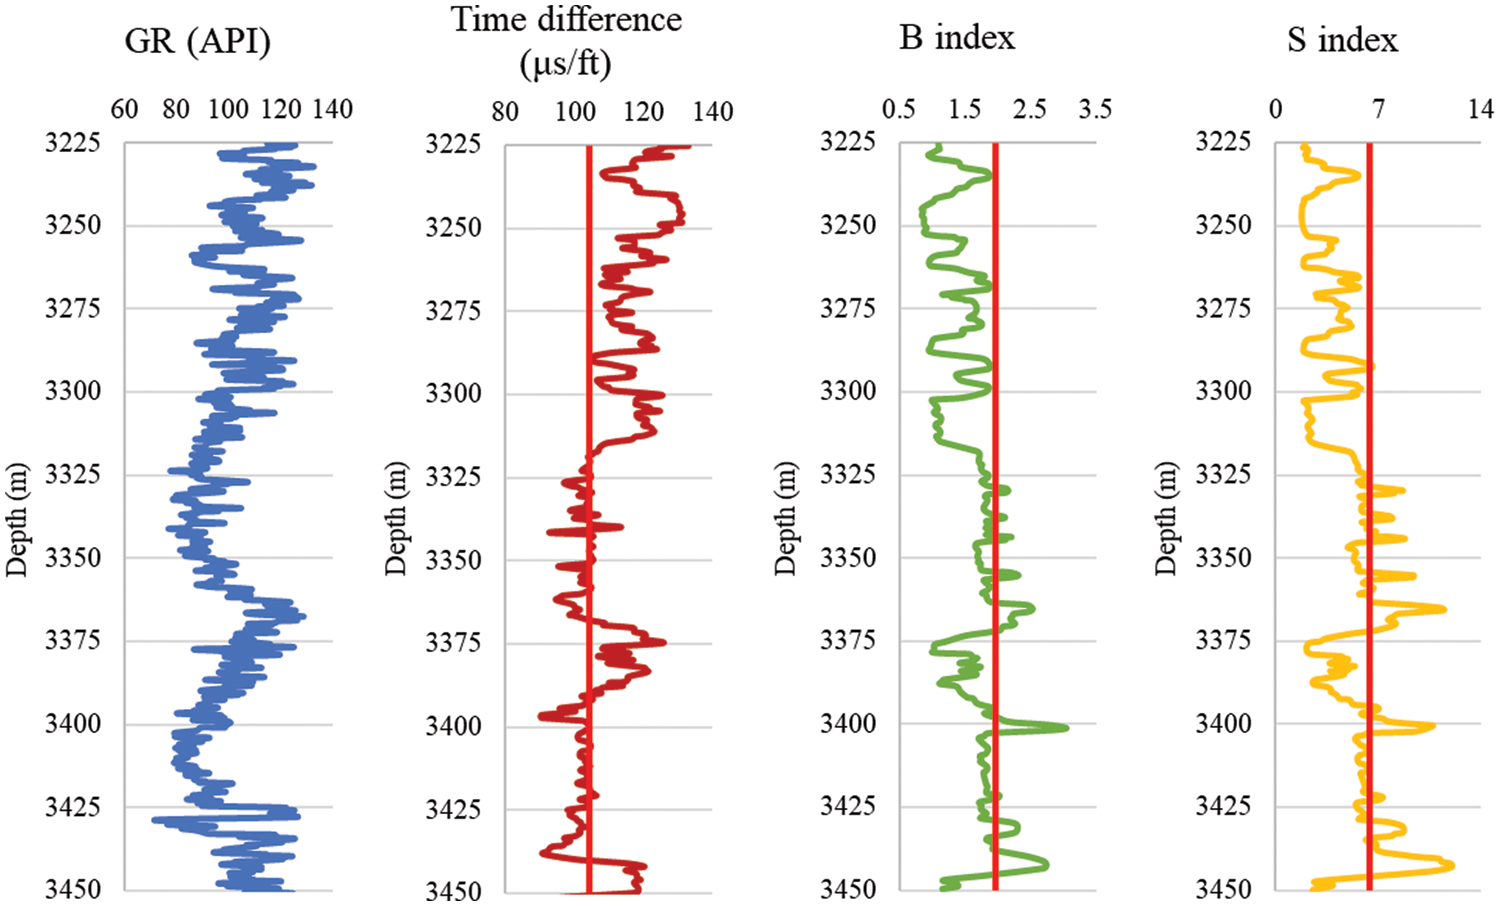
Figure 6: AB-4 well qualitative prediction results
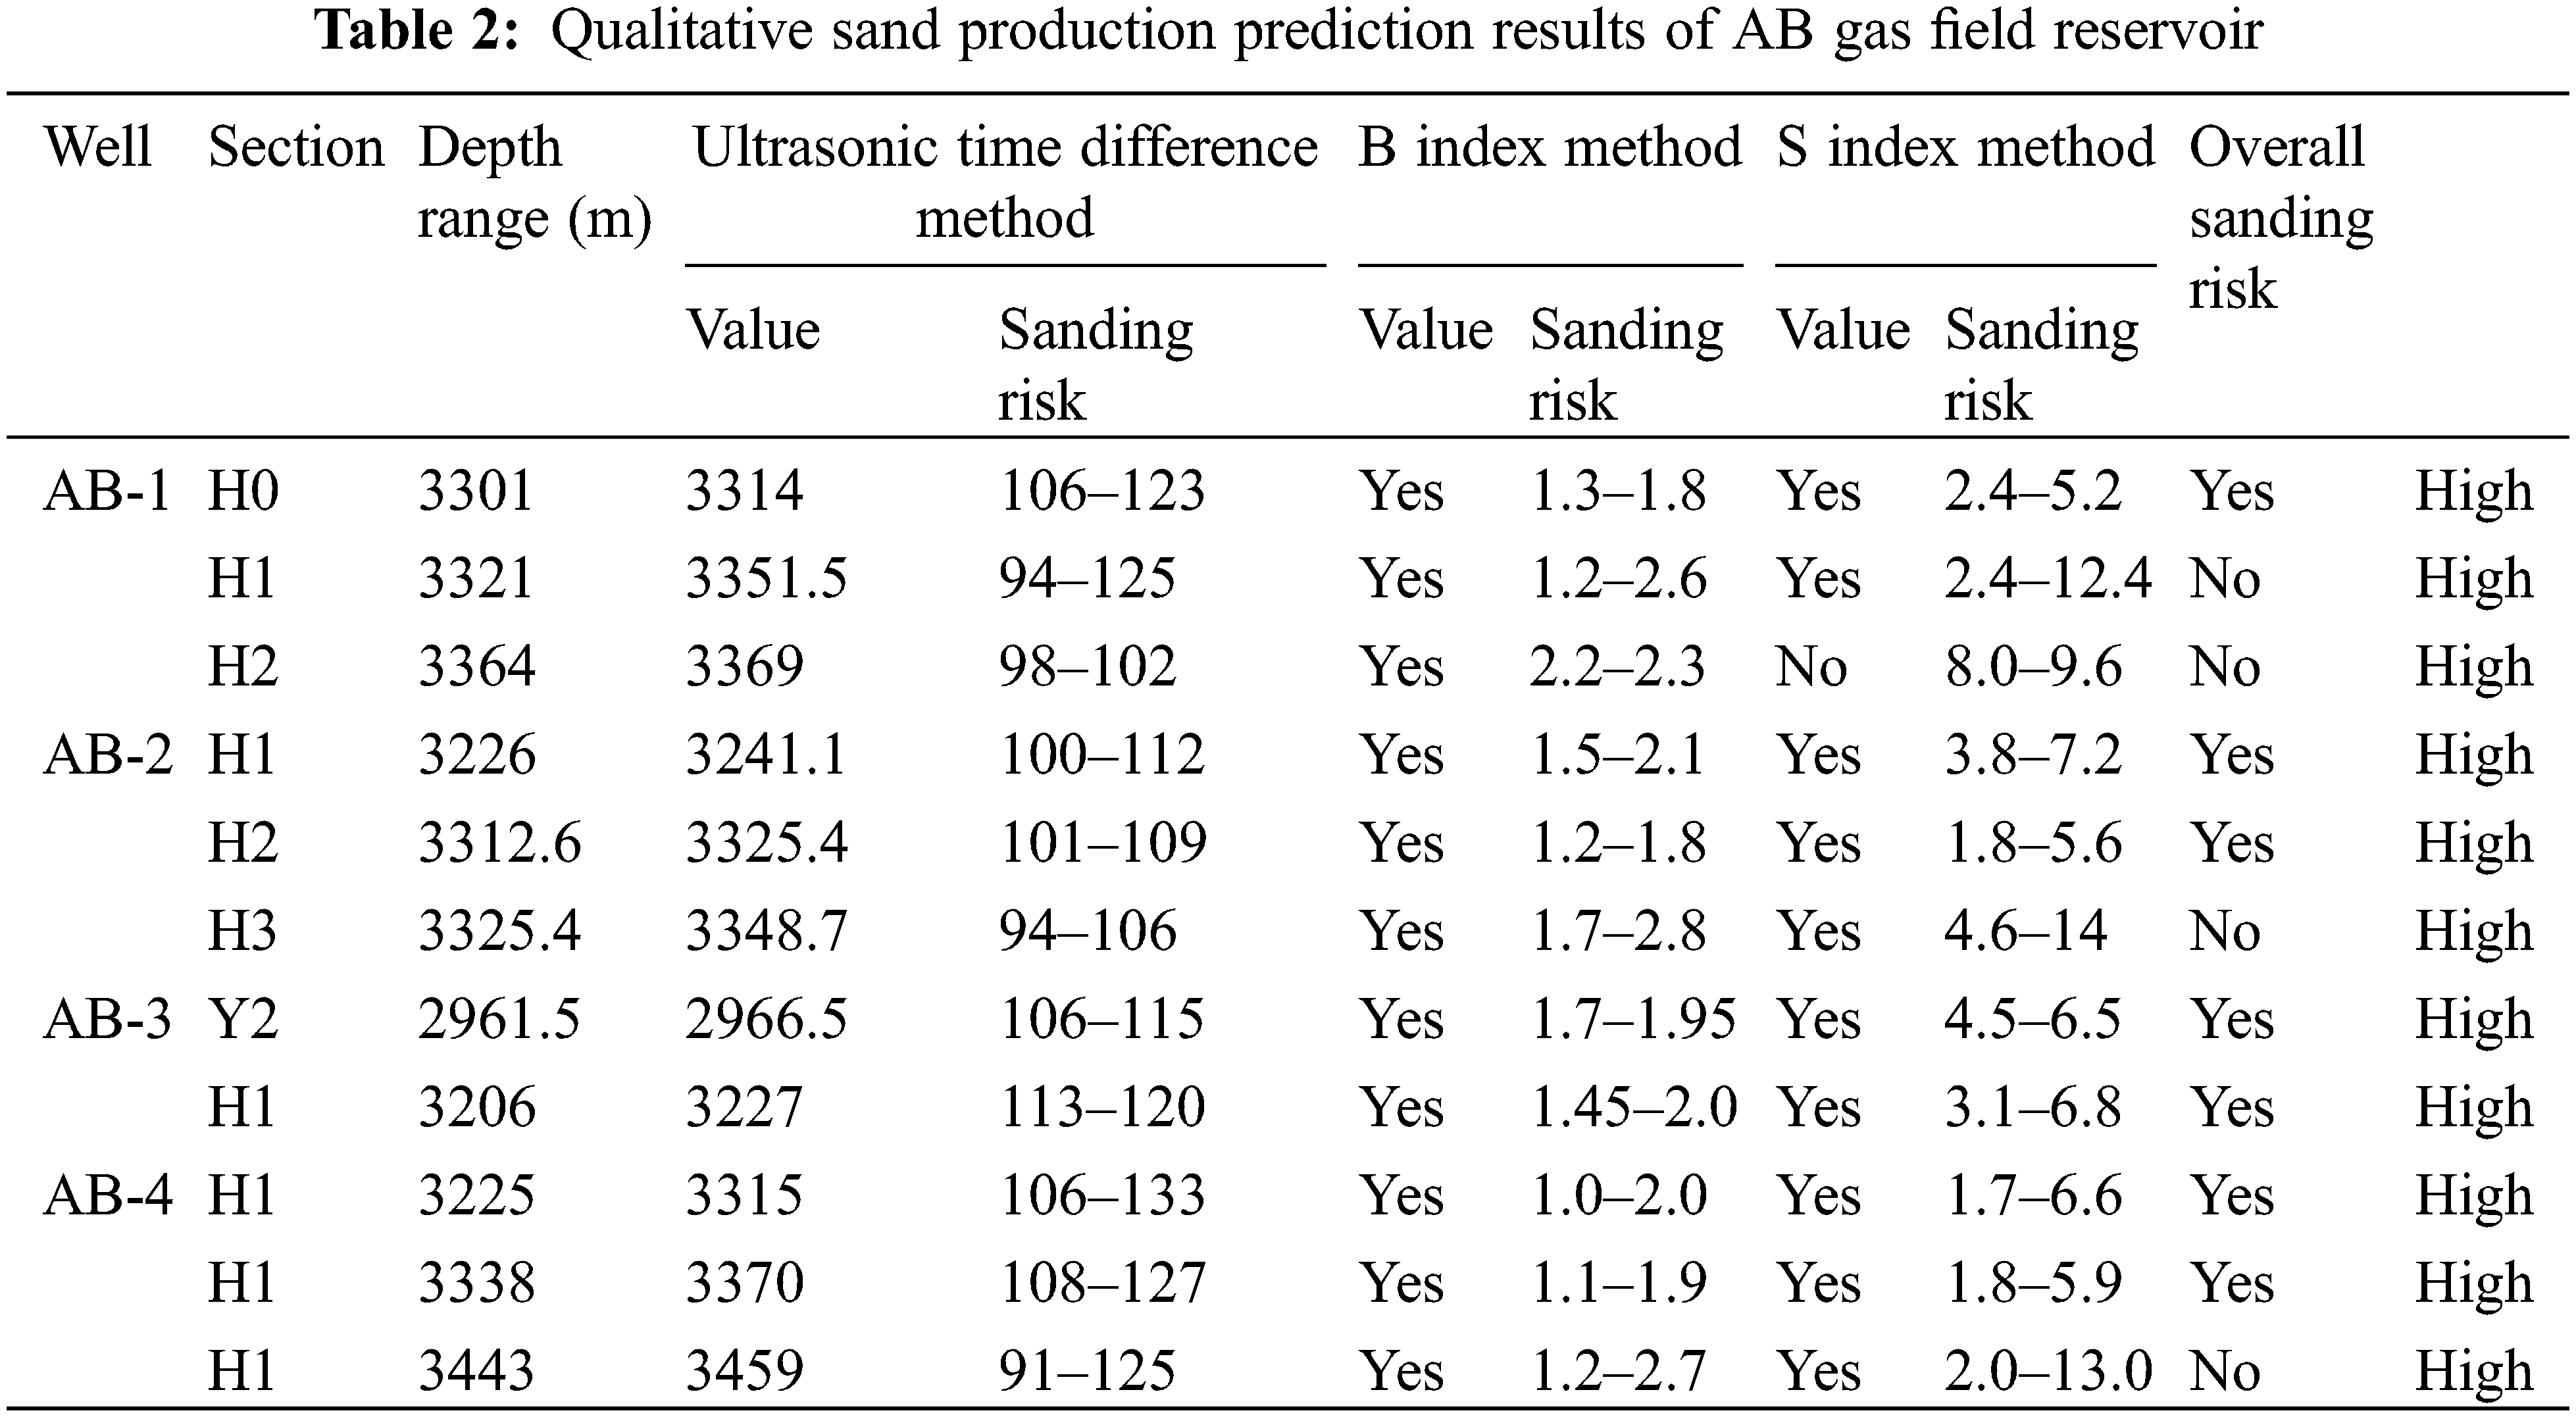
The qualitative prediction results of all wells are shown in Table 2.
4.4 Quantitative Prediction Results
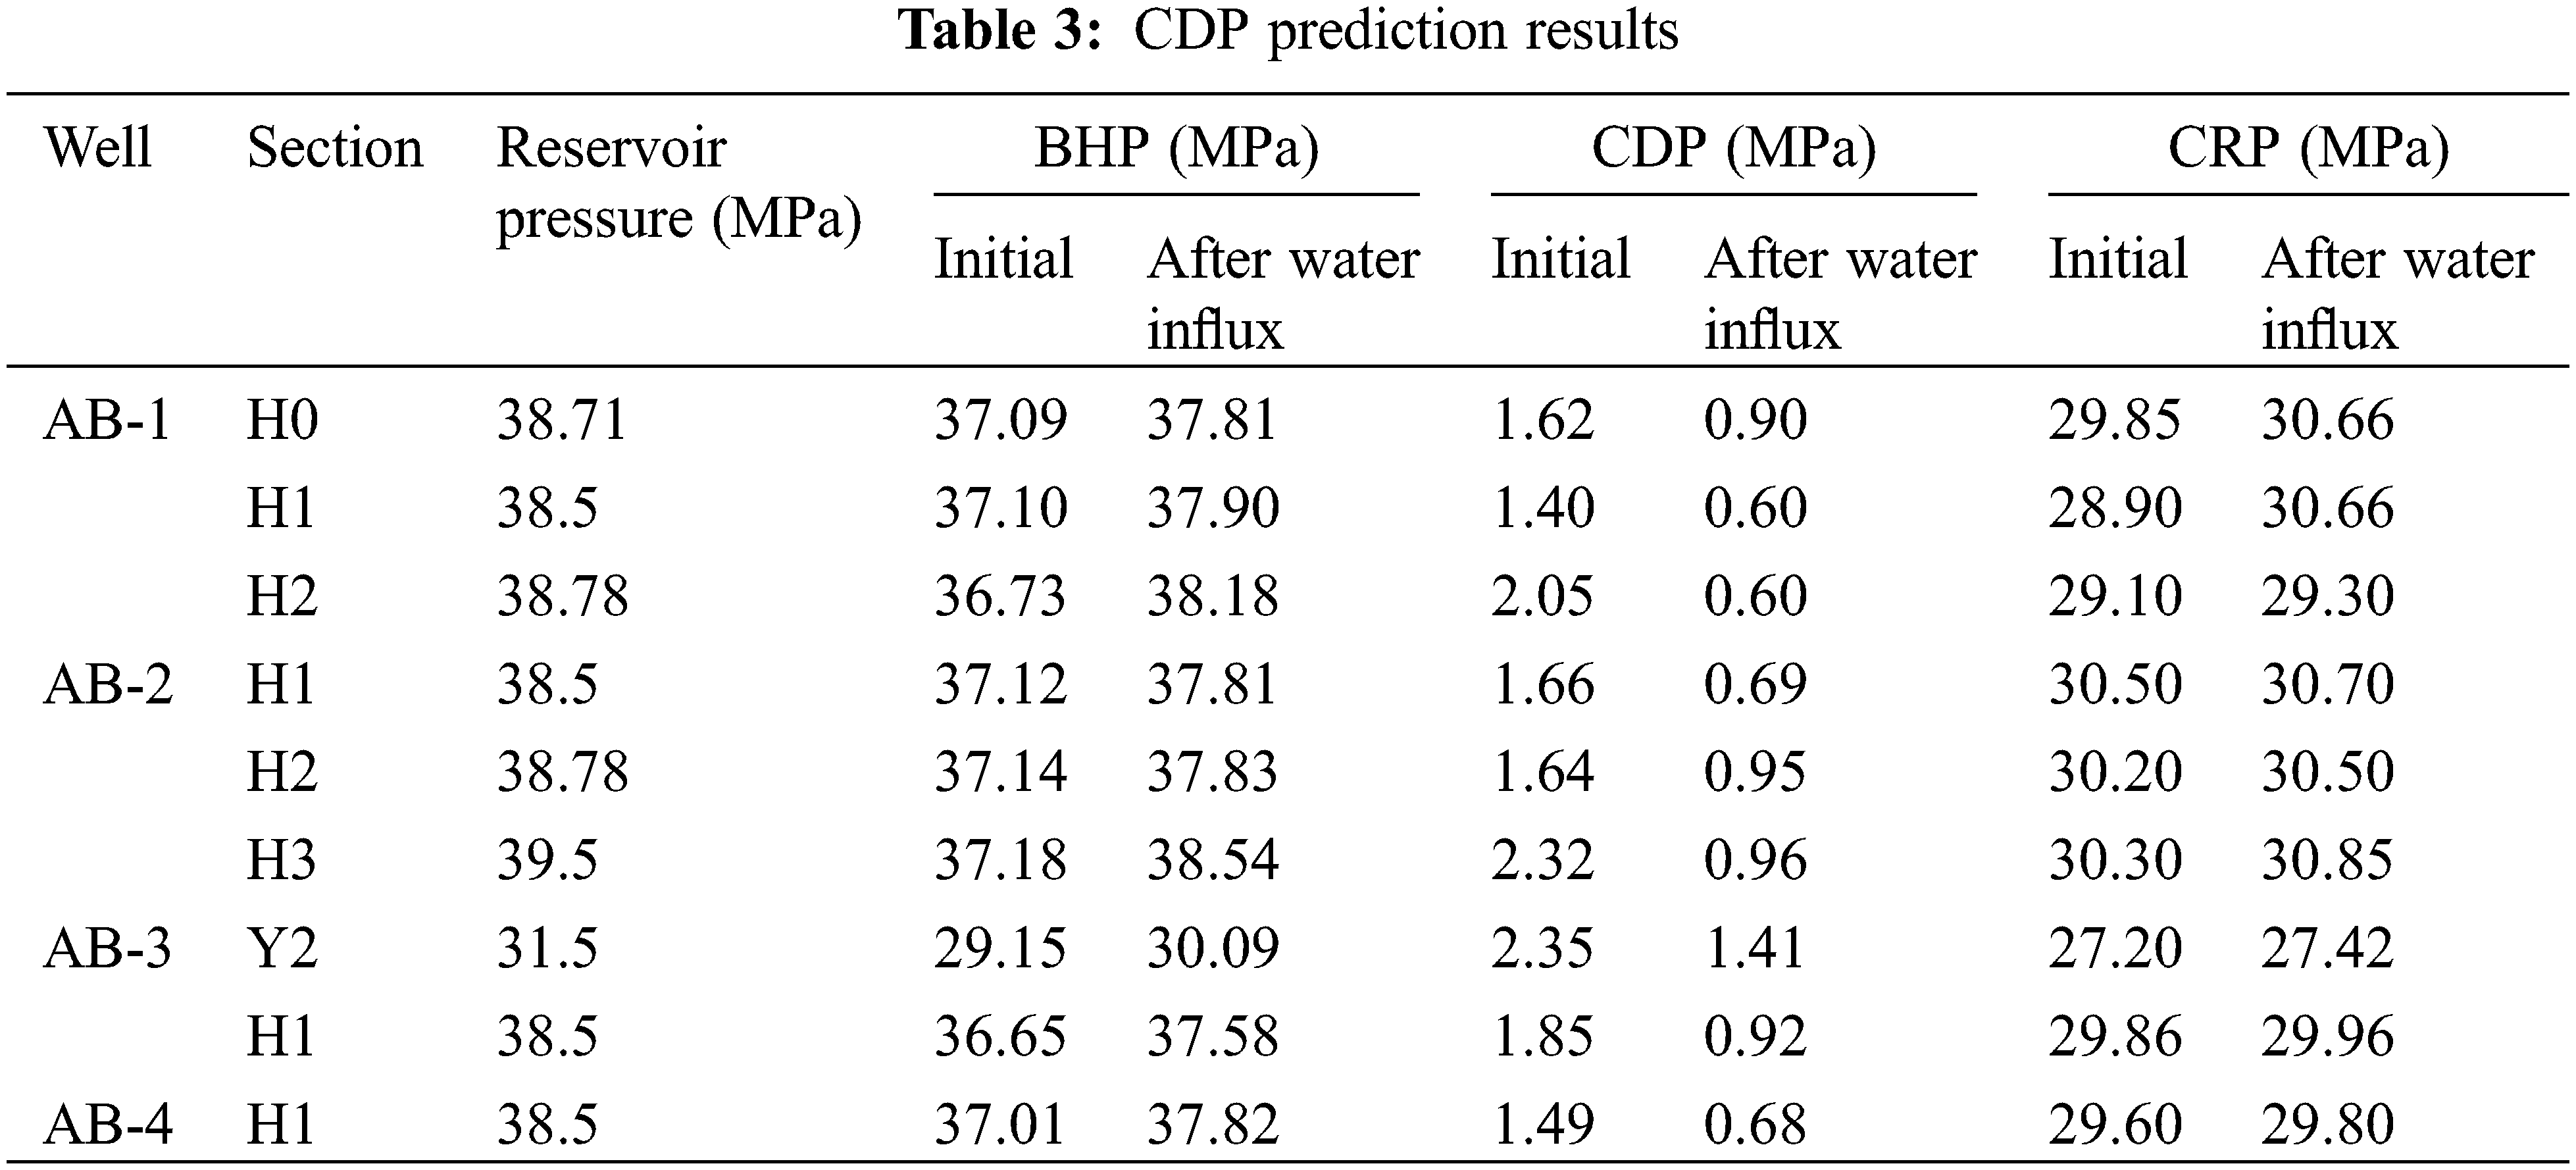
Combine the influences of water influx and pressure depletion, calculate and plot CDP of different wells at different development stages. The reservoir pressure, CDP, BHP, and critical reservoir pressure (CRP) are shown in Table 3. CRP is a critical point of reservoir pressure during pressure depletion. When reservoir pressure is below the CRP, the formation has sanding risk regardless of BHP.
CDP charts of different wells are as shown in Figs. 7 to 10.
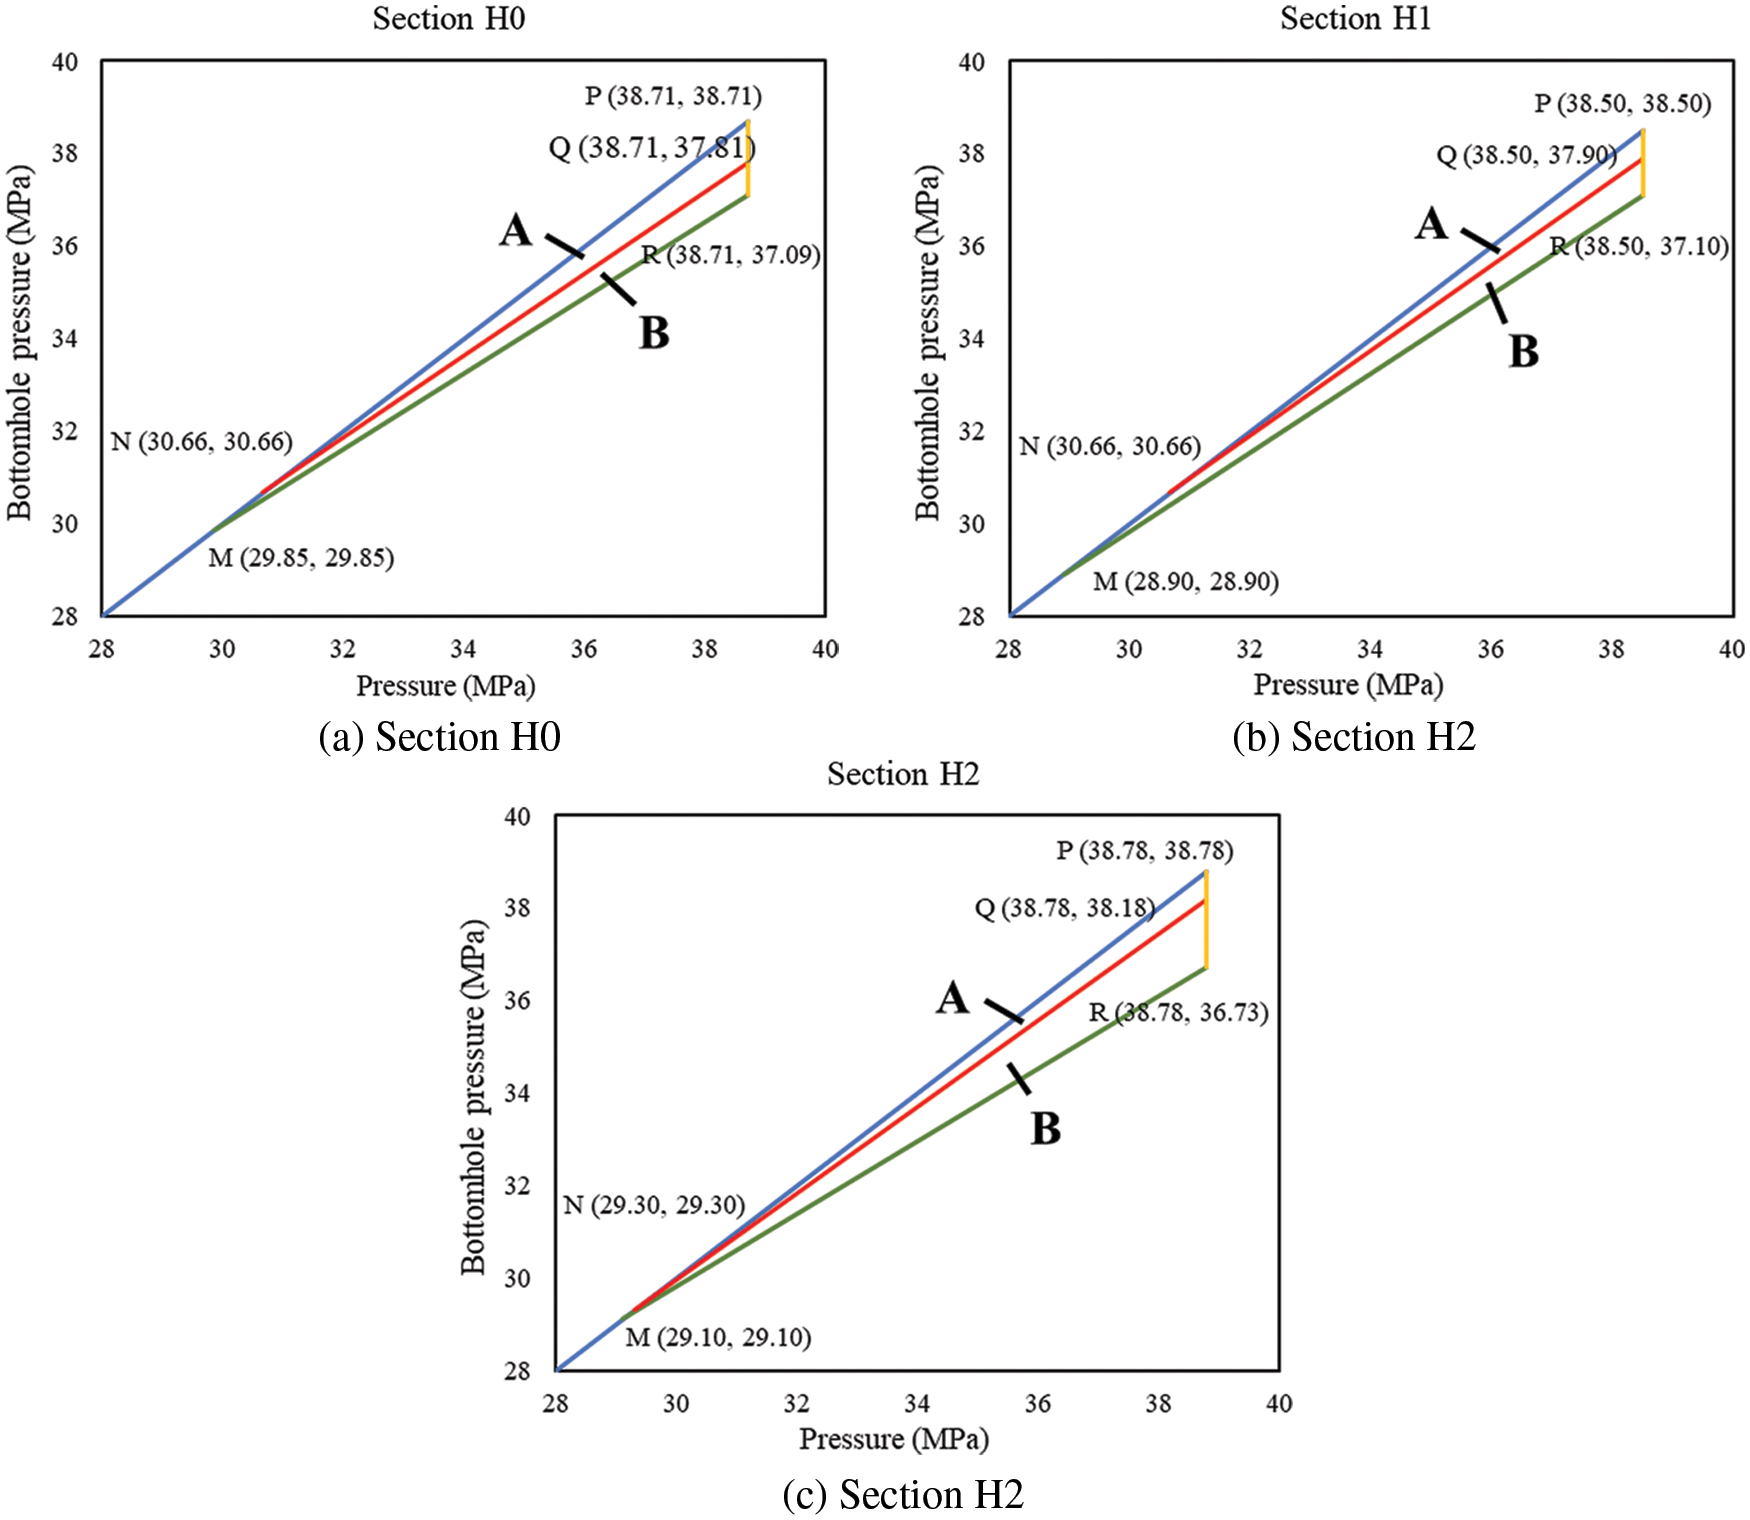
Figure 7: Differential pressure charts of well AB-1
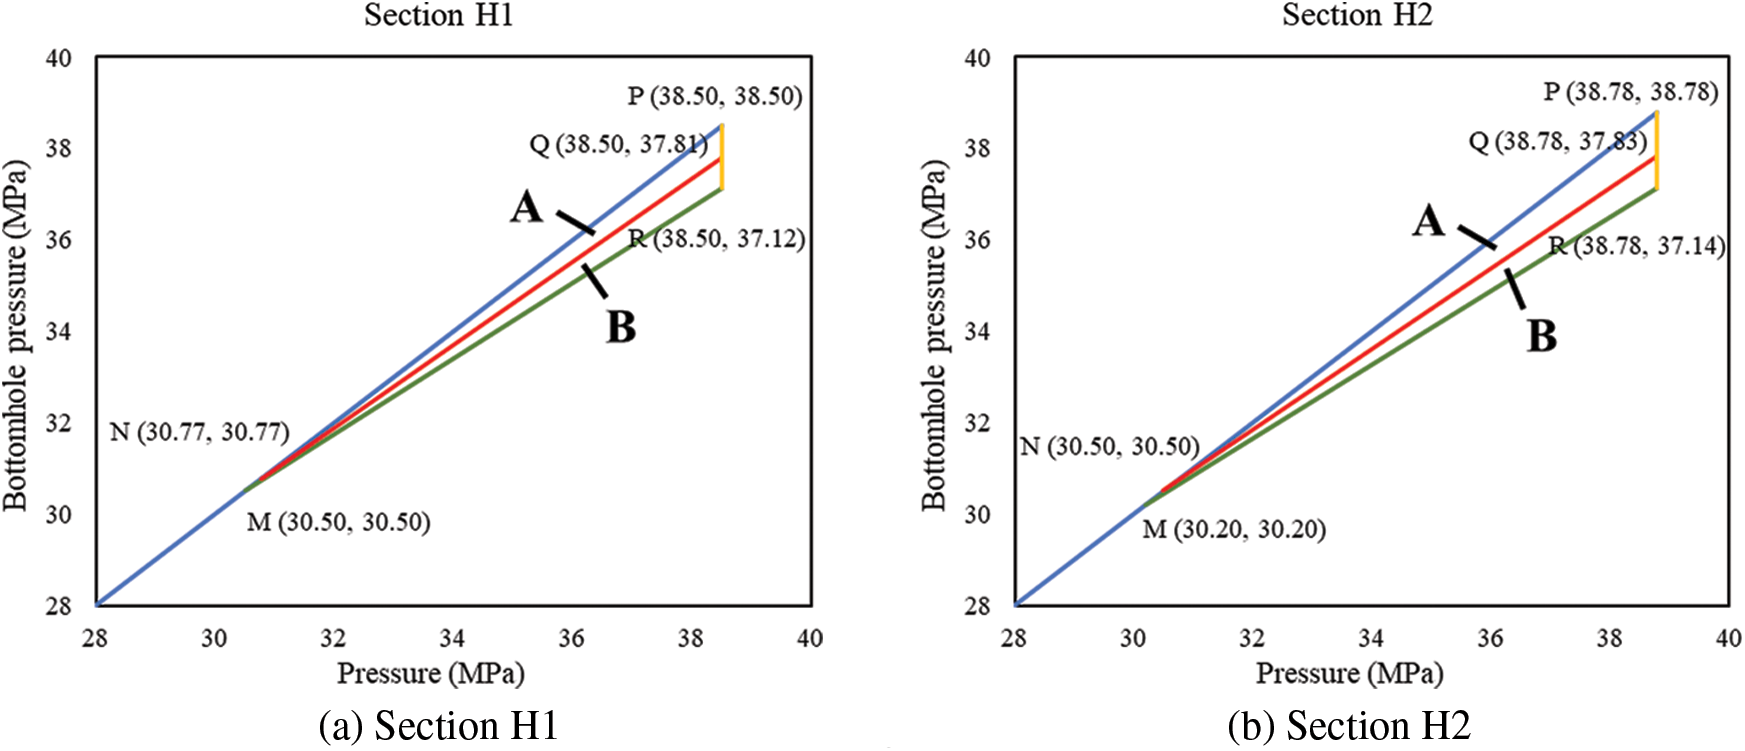
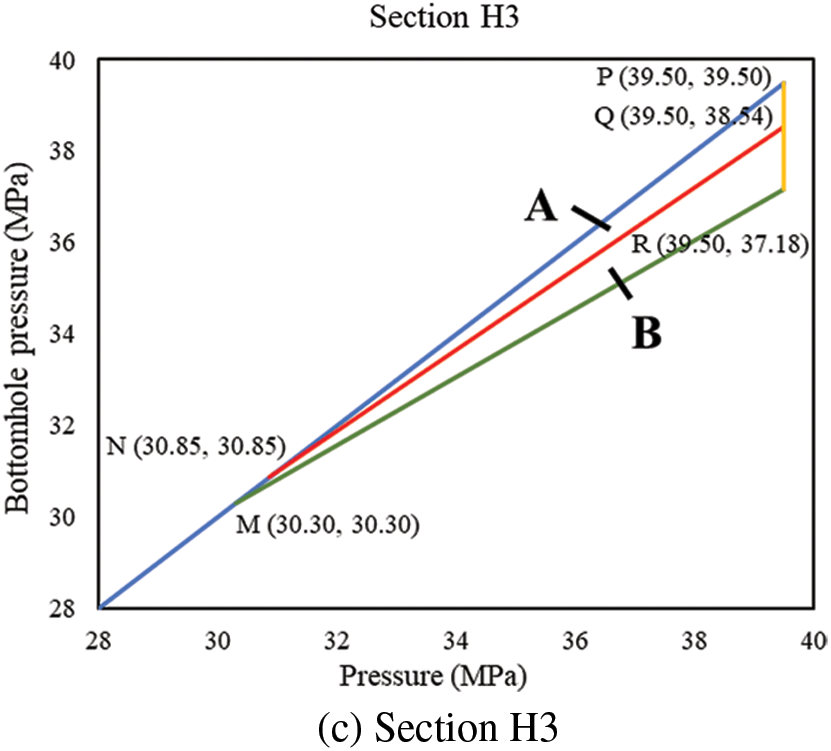
Figure 8: Differential pressure charts of well AB-2
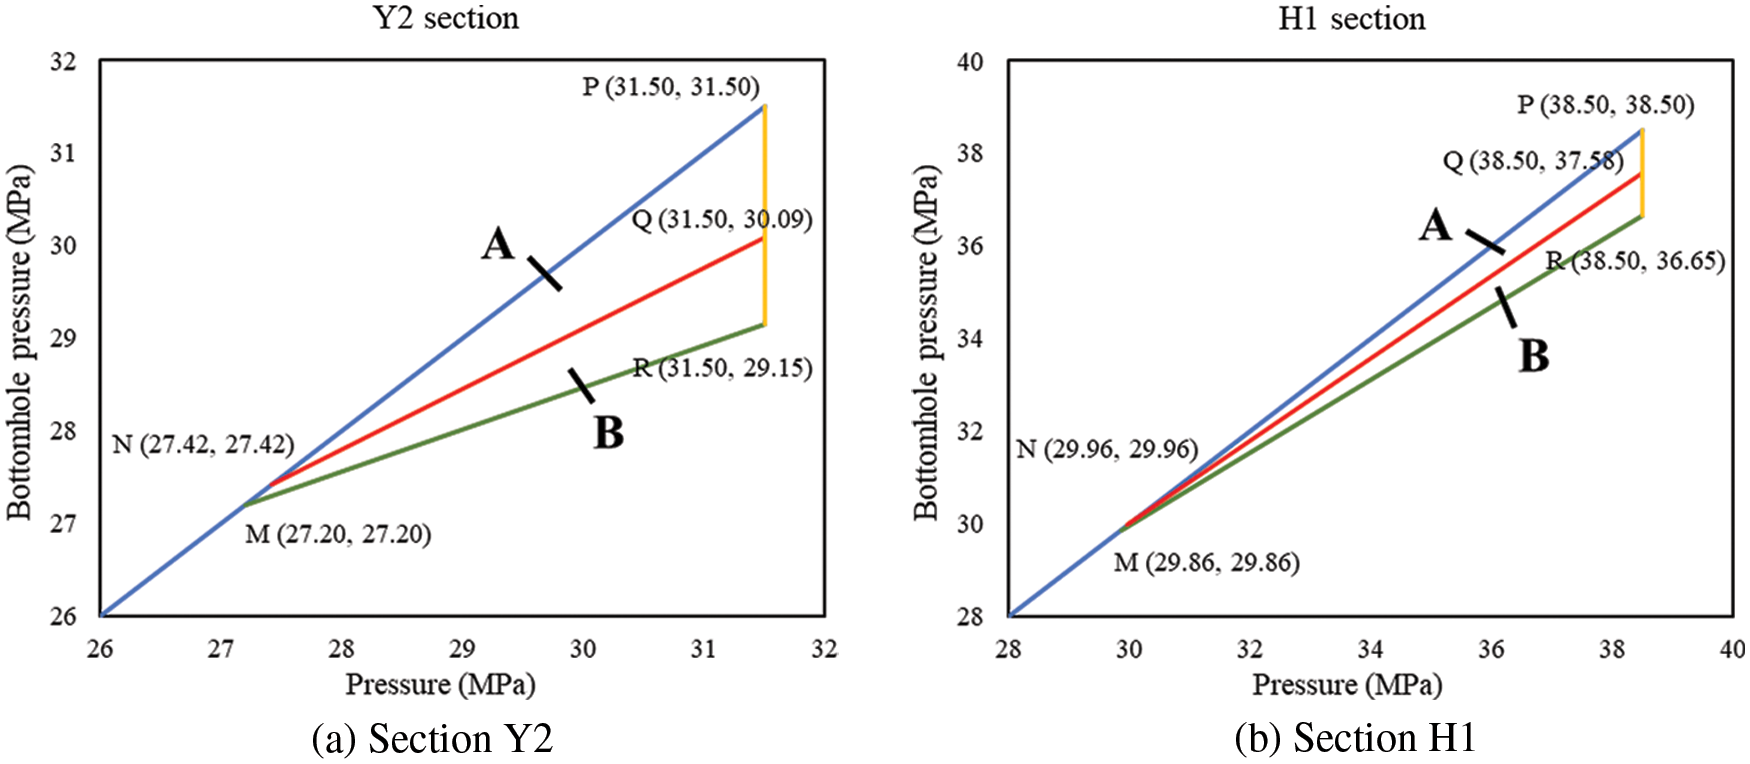
Figure 9: Differential pressure charts of well AB-3
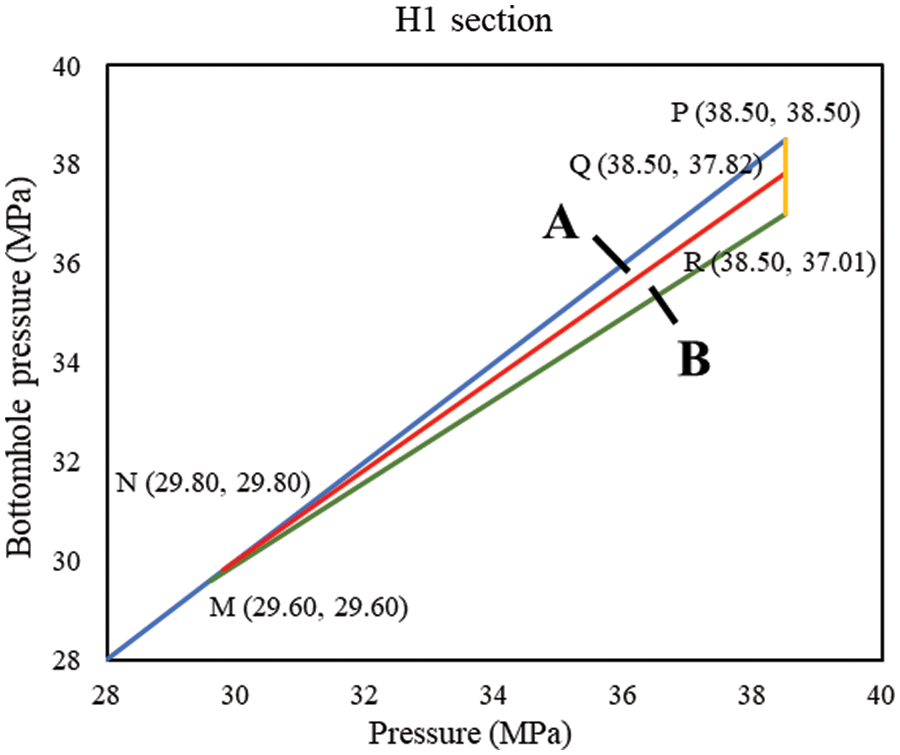
Figure 10: Differential pressure charts of well AB-4
In the CDP charts of the four wells, point M represents the initial CRP, point N represents the CRP after pressure depletion. Point R represents the initial critical BHP, and point Q represents the critical BHP after water influx. Area A ∪ B is decided by the initial CDP and CRP of the reservoir, representing the BHP window that will cause no sand production when there is no water influx and no pressure depletion. After water influx and pressure depletion, CRP rises to point N, and CDP decreases, the safe production pressure window narrows down. Area A represents the BHP that will cause no sand production after water influx and pressure depletion.
(1) The rock properties and ground stresses are calculated and analyzed according to reservoir parameters and logging data. Impacts of water influx and pressure depletion are measured by the deterioration degrees of cohesion and friction angle, then merged into the Mogi-Coulomb criterion. Based on ground stress distribution, a sand production prediction method based on rock failure under water influx and pressure depletion is obtained.
(2) The ultrasonic time difference method, B index method and S index method are used to predict the sand production risk qualitatively. The prediction results of the AB gas field indicate an overall high risk of sand production.
(3) Based on local ground stress distribution and production data, the CDP and CRP of four wells in the AB gas field are calculated according to the sections. The CDP decreases after the water influx; the overall CDP window narrows from 1.40∼2.35 MPa down to 0.60∼1.41 MPa. By pressure depletion, the CRP drops from 31.5∼39.5 MPa to 27.42∼30.85 MPa. With water influx, the CRP drops to 27.2∼30.5 MPa.
Funding Statement: This research is financially supported by the National Natural Science Foundation of China (Grant No. 52174015) and supported by the Program for Changjiang Scholars and Innovative Research Team in University (IRT_14R58).
Conflicts of Interest: The authors declare that they have no known competing financial interests or personal relationships that could have appeared to influence the work reported in this paper.
References
1. Stein, N., Kelly, J., Baldwin, W. F., Mcneely, W. E. (1972). Sand production determined from noise measurements. Journal of Petroleum Technology, 24(7), 803–806. DOI 10.2118/3498-PA. [Google Scholar] [CrossRef]
2. Geertsma, J. (1985). Some rock-mechanical aspects of oil and gas well completions. Society of Petroleum Engineers Journal, 25(6), 848–856. DOI 10.2118/8073-PA. [Google Scholar] [CrossRef]
3. Volonté, P., Scarfato, F., Brignoli, M. (2013). Sand prediction: A practical finite-element 3D approach for real field applications. SPE Production & Operations, 28(1), 95–108. DOI 10.2118/134464-PA. [Google Scholar] [CrossRef]
4. El-Sayed, A. (1991). Maximum allowable production rates from openhole horizontal wells. SPE Middle East Oil Show, Bahrain. [Google Scholar]
5. Kooijman, A. P., Halleck, P. M., de Bree, P., Veeken, C. A. M., Kenter, C. J. (1992). Large-scale laboratory sand production test. SPE Annual Technical Conference and Exhibition, Washington, USA. [Google Scholar]
6. Budiningsih, Y., Hareland, G., Boonyapaluk, P., Guo, B., (1995). Correct production rates eliminate sand production in directional wells. SPE Asia Pacific Oil and Gas Conference, Malaysia. [Google Scholar]
7. van den Hoek, P. J., Hertogh, G. M. M., Kooijman, A. P., de Bree, P., Kenter, C. J. et al. (2000). A new concept of sand production prediction: Theory and laboratory experiments. SPE Drilling & Completion, 15(4), 261–273. DOI 10.2118/65756-PA. [Google Scholar] [CrossRef]
8. Nouri, A., Vaziri, H., Belhaj, H., Islam, M. R. (2007). Comprehensive transient modeling of sand production in horizontal wellbores. SPE Journal, 12(4), 468–474. DOI 10.2118/84500-PA. [Google Scholar] [CrossRef]
9. Dong, C., Zhang, Q., Rao, P. (2005). Model of systematic sanding prediction and its application for gas wells. Natural Gas Industry, 25(9), 98–100. DOI 10.3321/j.issn:1000-0976.2005.09.032. [Google Scholar] [CrossRef]
10. Yang, L., Zhang, Z., Liu, N. (2010). Prediction of critical drawdown pressure for horizontal well of unconsolidated sand. Inner Mongolia Petrochemical Industry, 36(13), 136–137. DOI 10.3969/j.issn.1006-7981.2010.13.063. [Google Scholar] [CrossRef]
11. Wang, A. (2011). Research on the stress distribution and sanding prediction model for horizontal wells (Master Thesis). China University of Petroleum (East China). DOI 10.7666/d.y1876562. [Google Scholar] [CrossRef]
12. Zhang, R., Shi, X., Zhu, R., Zhang, C., Fang, M. et al. (2016). Critical drawdown pressure of sanding onset for offshore depleted and water cut gas reservoirs: Modeling and application. Journal of Natural Gas Science & Engineering, 34, 159–169. DOI 10.1016/j.jngse.2016.06.057. [Google Scholar] [CrossRef]
Cite This Article
 Copyright © 2023 The Author(s). Published by Tech Science Press.
This work is licensed under a Creative Commons Attribution 4.0 International License , which permits unrestricted use, distribution, and reproduction in any medium, provided the original work is properly cited.
 Downloads
 Citation Tools