
 Submit a Paper
 Propose a Special lssue
 Open Access
ARTICLE
A Novel Method for Wet Gas Flow Measurements Based on an Over-Reading Principle
Shanghai Vocational College of Agriculture and Forestry, Shanghai, 201699, China
* Corresponding Author: Jia Li. Email:
Fluid Dynamics & Materials Processing 2023, 19(2), 303-313. https://doi.org/10.32604/fdmp.2022.020723
Received 08 December 2021; Accepted 15 March 2022; Issue published 29 August 2022
 View Full Text
 Download PDF
Abstract
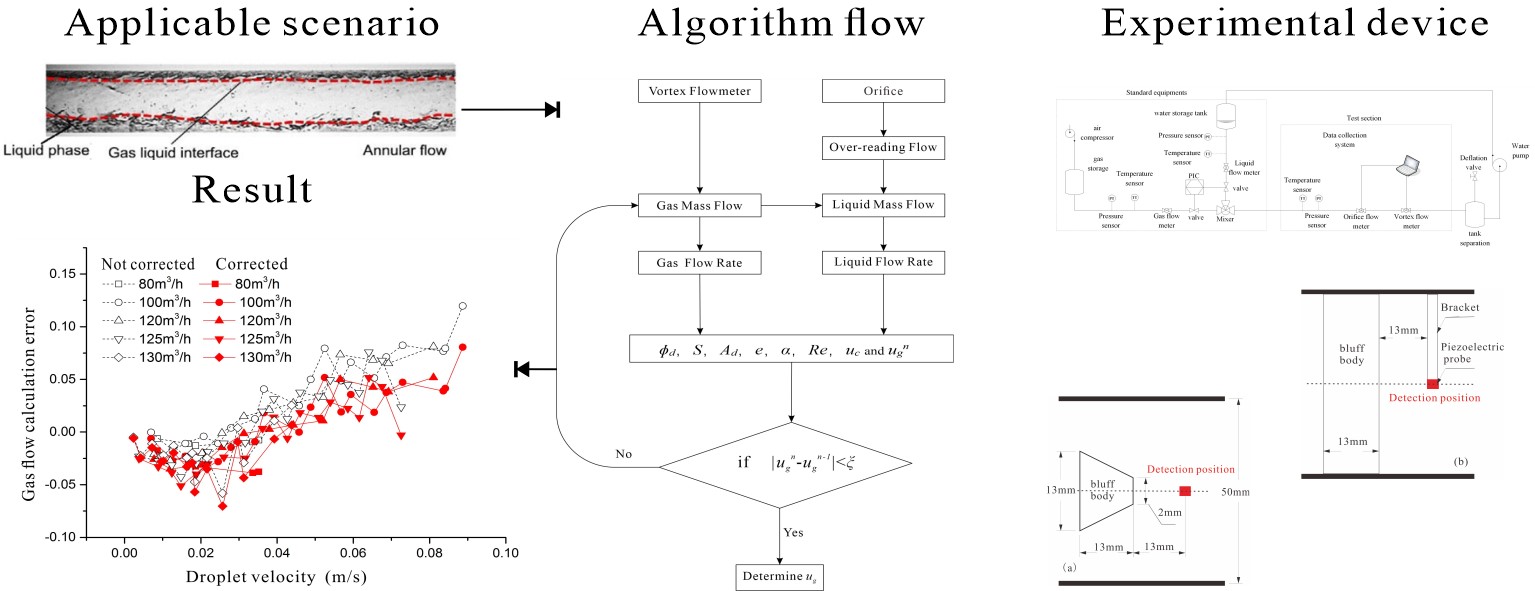
A novel method to measure the flow rate in a wet gas is presented. Due to the presence of liquid, there is a deviation in the measurement of the gas volume flow rate obtained with standard vortex flow-meters. The proposed method is based on a correction factor determined through the application of an over-reading approach to a bluff body in mist flow. The correction factor is obtained from the slip velocity ratio, i.e., the ratio of droplet velocity to gas velocity, based on the analysis of the fluid velocity distribution in the pipeline section. It also takes into account relevant theoretical arguments. It is shown that the predicted results fit the experimental results well.
Graphic Abstract
Keywords
Nomenclature
| XLM = | Lockhart–Martinelli parameter |
| ρg = | gas density |
| ρl = | liquid density |
| ρ = | mixture density |
| ml = | liquid mass flow rate |
| mg = | gas mass flow rate |
| OR = | over-reading coefficient |
| mg, approximate = | over-reading flow rate |
| C = | calculation parameters for over-reading |
| ϕd = | droplet diameter |
| D = | pipe diameter |
| W = | width of bluff body |
| We = | Weber number |
| σ = | surface tension |
| S = | slip velocity ratio |
| Stk = | Stokes number |
| Ad = | area occupied by droplets |
| Ag = | area occupied by gas |
| Ac = | area occupied by gas core |
| α = | void fraction |
| uc = | average flow rate of gas core |
| ug = | gas flow rate |
| ul = | liquid flow rate |
| n = | calculation parameters for uc |
| Re = | Reynolds number |
| μ = | viscosity of mixture |
| μg = | viscosity of gas |
| μl = | viscosity of liquid |
| e = | entrained liquid fraction |
| ugn−1 = | the n−1th calculated value of ug |
| ugn = | the nth calculated value of ug |
| ξ = | iterative algorithm threshold |
| Qcorr = | corrected gas volume flow rate |
| Qsingle = | flow rate measured by vortex flow meter |
| γ = | correction ratio |
Wet gas is a mixture of water and gas. Its flow takes the form of a gas-liquid two-phase flow. The measurement of this two-phase flow is an unsolved problem that is more complicated than that of a single-phase flow, due to the spatial distribution of the phase interface and the change in the flow structure over time. In recent years, flow measurements of gas-liquid two-phase flows have been a research hotspot, with measurement accuracy being important for natural gas production.
Jones’ summary report described the measurement technology for gas-liquid two-phase flows in detail [1]. Accurate two-phase flow measurements cannot be achieved by a single flow meter, but the measurement accuracy can be greatly improved with the combination of two or more flow meters.
Differential pressure flow meters are the most commonly used instruments for two-phase flow measurements and include the orifice, Venturi, and V-cone variations. They account for 80% of the field of volumetric flow measurements of gas-liquid two-phase flows. The orifice devices are the most popular flow meters used in wet gas measurements and are composed of an orifice and a pressure transmitter used to detect the pressure difference between the upstream and downstream of the choke element. The fluid mass flow can be calculated by using the pressure difference, the outflow coefficient, and the fluid density. When the fluid flows through the orifice, the pressure difference at both ends of the orifice increases. The pressure can be obtained on both sides of the orifice plate when the machined throttle plate is placed in the center of the pipe. The uncertainty of the orifice flow meter is 0.5%, its size is designed in accordance with ISA 1932, and its processing and installation methods are strictly implemented in accordance with ISO 5167. The uncertainty associated with an orifice flow meter can be calculated when the additional uncertainty associated with the pressure transmitter is known. This is a unique advantage of an orifice flow meter for wet gas measurements, because it does not need on-site calibration, and its uncertainty can be calculated from the measurement regulations. The orifice flow meter can be used in combination with other throttling flow meters to measure gas-liquid two-phase flows using the differences in the over-reading models between the two flow meters. The measurement error for wet gas will be very large when using a combination of two throttling flow meters, due to the small content of the liquid phase in the wet gas and the difference between the two over-reading models being small.
The measurement principle of a vortex flow meter is different from that of an orifice flow meter, and the over-reading model it uses to measure gas-liquid two-phase flows is also different. This difference is not affected by the quantity of liquid. The combination of orifice and vortex flow meters is suitable for engineering purposes because both have high temperature resistance, are convenient to maintain, and have simple structures with no movable parts [2–6].
Some research has been carried out on the correction of vortex flow meters for two-phase flow measurements. Hussein’s method can be used universally with an accuracy of ±2% while the dryness fraction is increased to above 95% for a vortex flow meter [7]. Jia’s model showed that a new correlation could predict vortex flow meter measurements satisfactorily for liquid volume fractions from 0% to 0.13%, with an error within ±10% [8]. Li’s research indicated that their proposed model provides a uniform prediction for the meter over-reading, with relative deviations within a ±1.0% error band [9].
This paper introduces the combination of two kinds of flow meter and puts forward an instrument correction factor model for vortex flow meter gas-liquid two-phase flow measurements. The correction effect is verified with a real flow experiment based on air-water two-phase flow.
The principle behind measuring wet gas with a combination of an orifice and a vortex flow meter is that the gas phase volume flow is measured by the vortex flow meter and brought into the over-reading model of the orifice flow meter. The liquid phase volume flow is then calculated from the over-reading flow, as shown in Fig. 1.
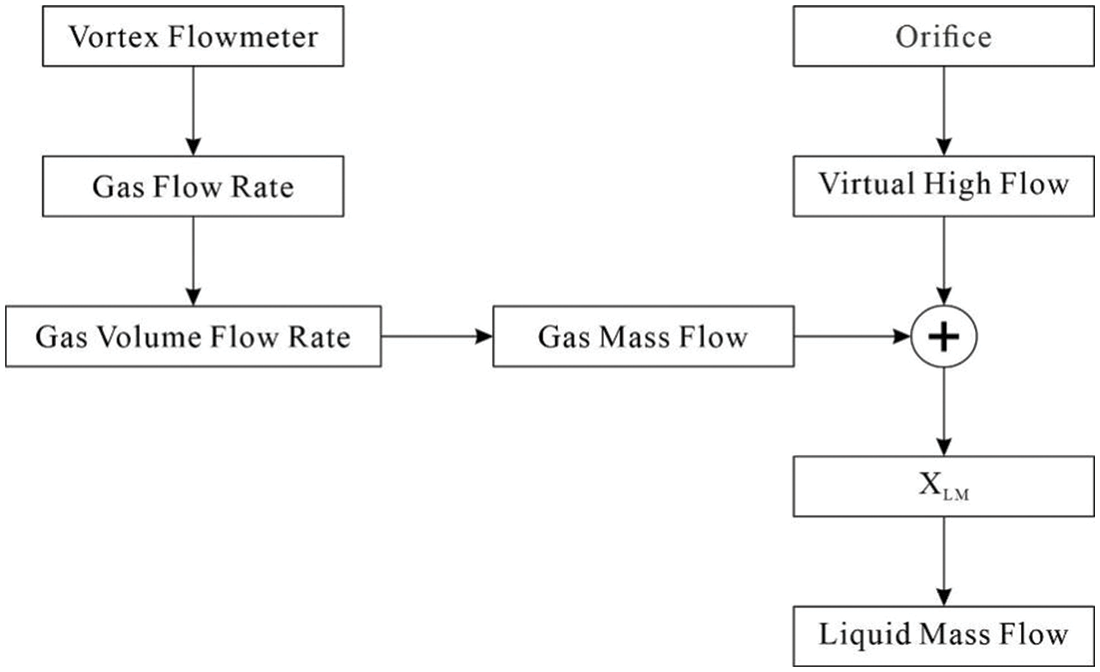
Figure 1: A schematic diagram of the combined measurement with the orifice and vortex flow meters
Orifice flow meters have been studied for many years, and their application to single-phase flow measurements was defined in ISO 5167. Between 1967 and 1977, Chisholm studied the characteristics of orifice flowmeters for two-phase flow measurements and put forward the ratio of the flow rate by weight during two-phase flow to the flow rate during single-phase flow with a two-phase pressure drop [10,11]. Until 2007, the experimental data of Skea et al. [12] and Steven et al. [13] confirmed the correctness of the Chisholm over-reading model.
Over-reading is defined as the positive deviation between the calculated value of the gas phase flow and the actual value caused by the liquid phase. Wet gas has the typical flow pattern of a gas-liquid two-phase flow. The key parameter for wet gas is the Lockhart Martinelli parameter XLM, which is defined as [14]:
The deviation between the calculated gas mass flow rate and the actual value is caused by the velocity difference and the density difference between the gas and the liquid. An uncorrected gas mass flow rate is called the over-reading flow rate, expressed as mg,approximate. The over-reading, OR, is the ratio of the over-reading flow rate to real gas mass flow rate, expressed as:
The over-reading equation established by Chisholm defines it as the ratio of the flow rate by weight during two-phase flow to the flow rate during single-phase flow with a two-phase pressure drop [10]. Chisholm believed that the ratio of an orifice flow meter is a function of the Lockhart–Martinelli parameter and the ratio of the gas-liquid density for other flow patterns. He also stated that the ratio can be calculated in terms of the gas flow rates using the following formula:
The over-reading formula can be used to modify the gas flow rate. Further mathematical derivation shows that the over-reading formula and the gas flow rate can be used to predict the liquid flow rate.
As shown in Fig. 2, part of the liquid flows in the form of a liquid film along the pipe wall, and the other part of the liquid is entrained in the form of droplets in the gas core area. The droplet diameter ϕd is calculated by simplifying the empirical formula proposed by Yoon [15].
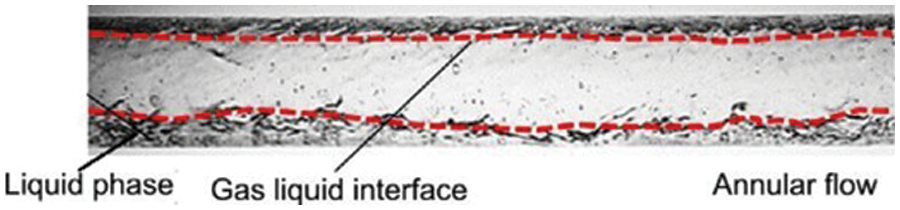
Figure 2: A schematic diagram of annular flow
The droplet flow rate and gas flow rate are different. Azzopardi’s experimental results showed that the droplet flow rate is 20% lower than the gas flow rate [16], and Yoon also pointed out that the droplet flow rate is 12–15% lower than the apparent gas flow rate [15]. It is necessary to consider the influence of the velocity difference. The slip velocity ratio is the ratio of the droplet flow rate to the gas flow rate, which can be calculated using the Rahman model:
The calculation formula for the Stokes number is [17]:
Due to the fluid viscosity, the flow rate in the center of the pipeline is high, and the flow rate near the wall is zero. The velocity distribution is shown in Fig. 3. The velocity profile follows a power exponential distribution related to the Reynolds number, so the average flow rate uc can be calculated with the velocity u detected by the vortex flow meter.
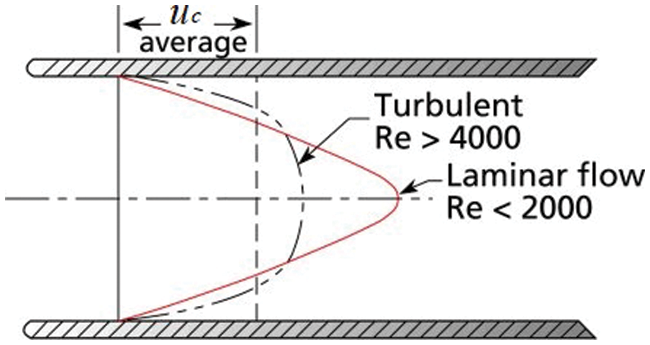
Figure 3: The flow rate distribution in the pipe
Using a geometric derivation, the relationship between the velocity at the edge of the generator and the average velocity is given as follows:
n is calculated using the empirical formula:
The relationships between the average gas flow rate, the droplet flow rate in the center of the gas core area in the pipeline, and the gas volume flow rate are as follows:
The entrained liquid fraction can be calculated using Cioncolini’s formula [18]:
The equations are coupled by the parameters ϕd, S, Ad, e, α, Re, uc, and ug. These equations cannot be solved analytically but can be solved using an iterative algorithm. The solution flow chart is shown in Fig. 4. The condition for the end of this calculation process is:
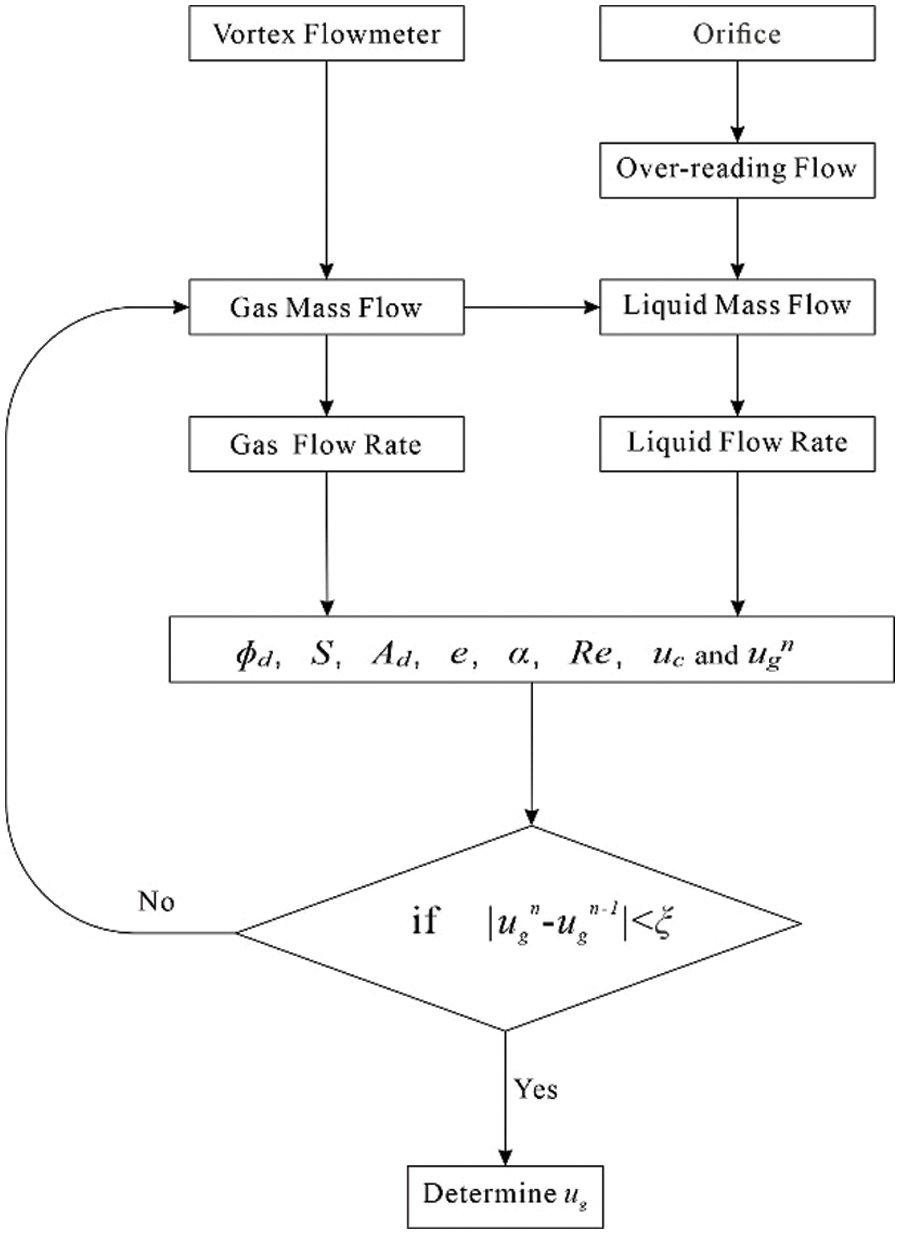
Figure 4: The iterative method for solving the equations
3.2 The Effect of Two-Phase Parameters on the Correction Factor
The relationship between the uncorrected gas flow rate and the output of the vortex flow meter is shown in Eq. (24). The gas flow rate can be obtained by correcting the output of the vortex flow meter according to the algorithm given in Section 3.1.
Qcorr is the gas volume flow rate, which is calculated using the algorithm provided in Section 3.1. γ is the ratio of the corrected value to the uncorrected value. The gas volume flow rate of a gas-liquid two-phase flow needs to be corrected to account for a deviation in its measurement with a vortex flow meter due to the liquid effect.
At a fixed flow rate, when the cross-section gas content is low, the gas flow area and gas volume flow rate are both small shown in Fig. 5. The value of γ is less than one when the void fraction is small. With increasing void fraction, the two-phase flow tends toward a single-phase flow, so γ approaches one. The smaller the droplet radius, the more uniform the mixture in the gas core region. That is, the velocity of a droplet is closer to the velocity of the gas, so the velocity measured by the vortex flow meter is closer to the real velocity of the gas. With increasing droplet radius, the velocity difference between the gas and the droplet increases so that the velocity measured by the vortex flow meter is smaller than the real velocity of the gas phase. Therefore, as the droplet radius increases, γ decreases. Similarly, when the entrainment is small, the proportion of gas is large in the gas core area, so the velocity measured by the vortex flow meter is closer to the real velocity of the gas phase. On the contrary, when the entrainment is large, the flow velocity measured by the vortex flow meter deviates from the real gas velocity, so the correction ratio is small. The smaller the slip velocity ratio of the gas phase and droplets in the gas core area, the greater the velocity difference between the droplets and gas, and the greater the deviation between the measured velocity from the vortex flow meter and the real velocity of the gas. As the droplet velocity approaches the gas velocity, the velocity measured by the vortex flow meter becomes closer to the real gas velocity.
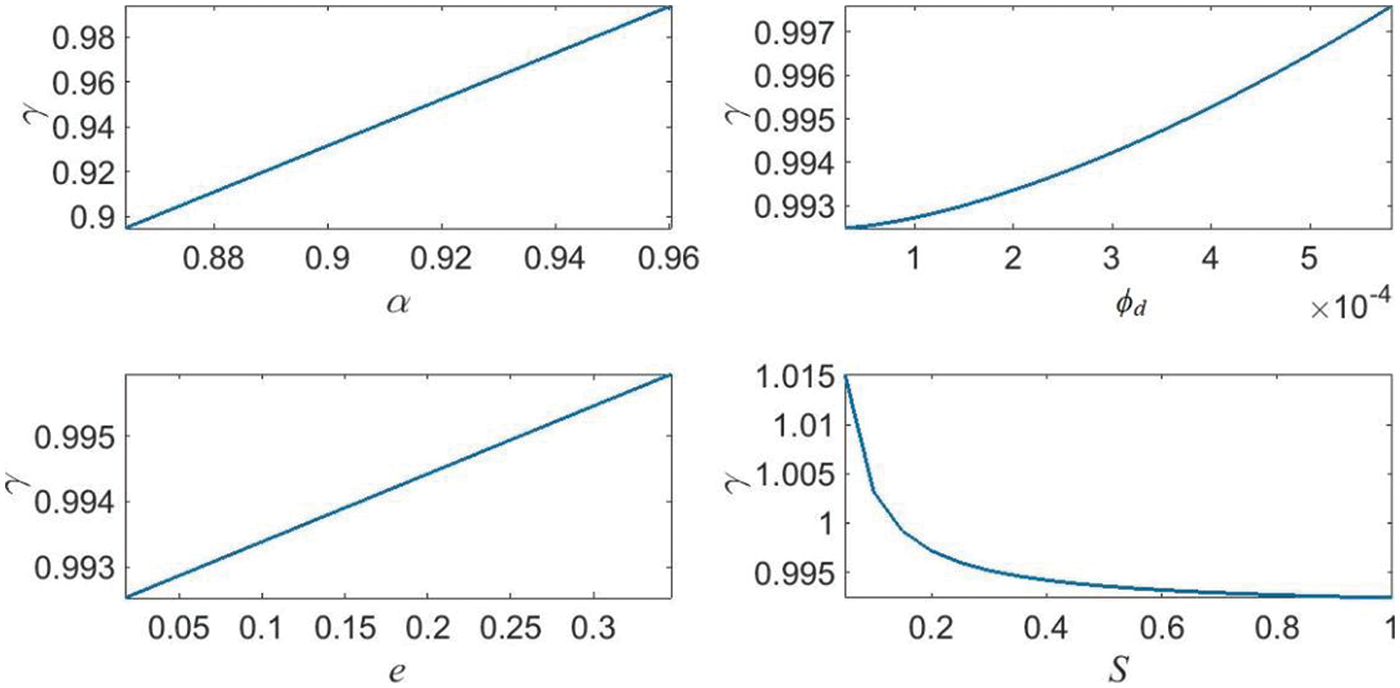
Figure 5: The relationship between the correction ratio and the two-phase parameters
4 Verification of the Modified Algorithm
4.1 Experimental Equipment and Method
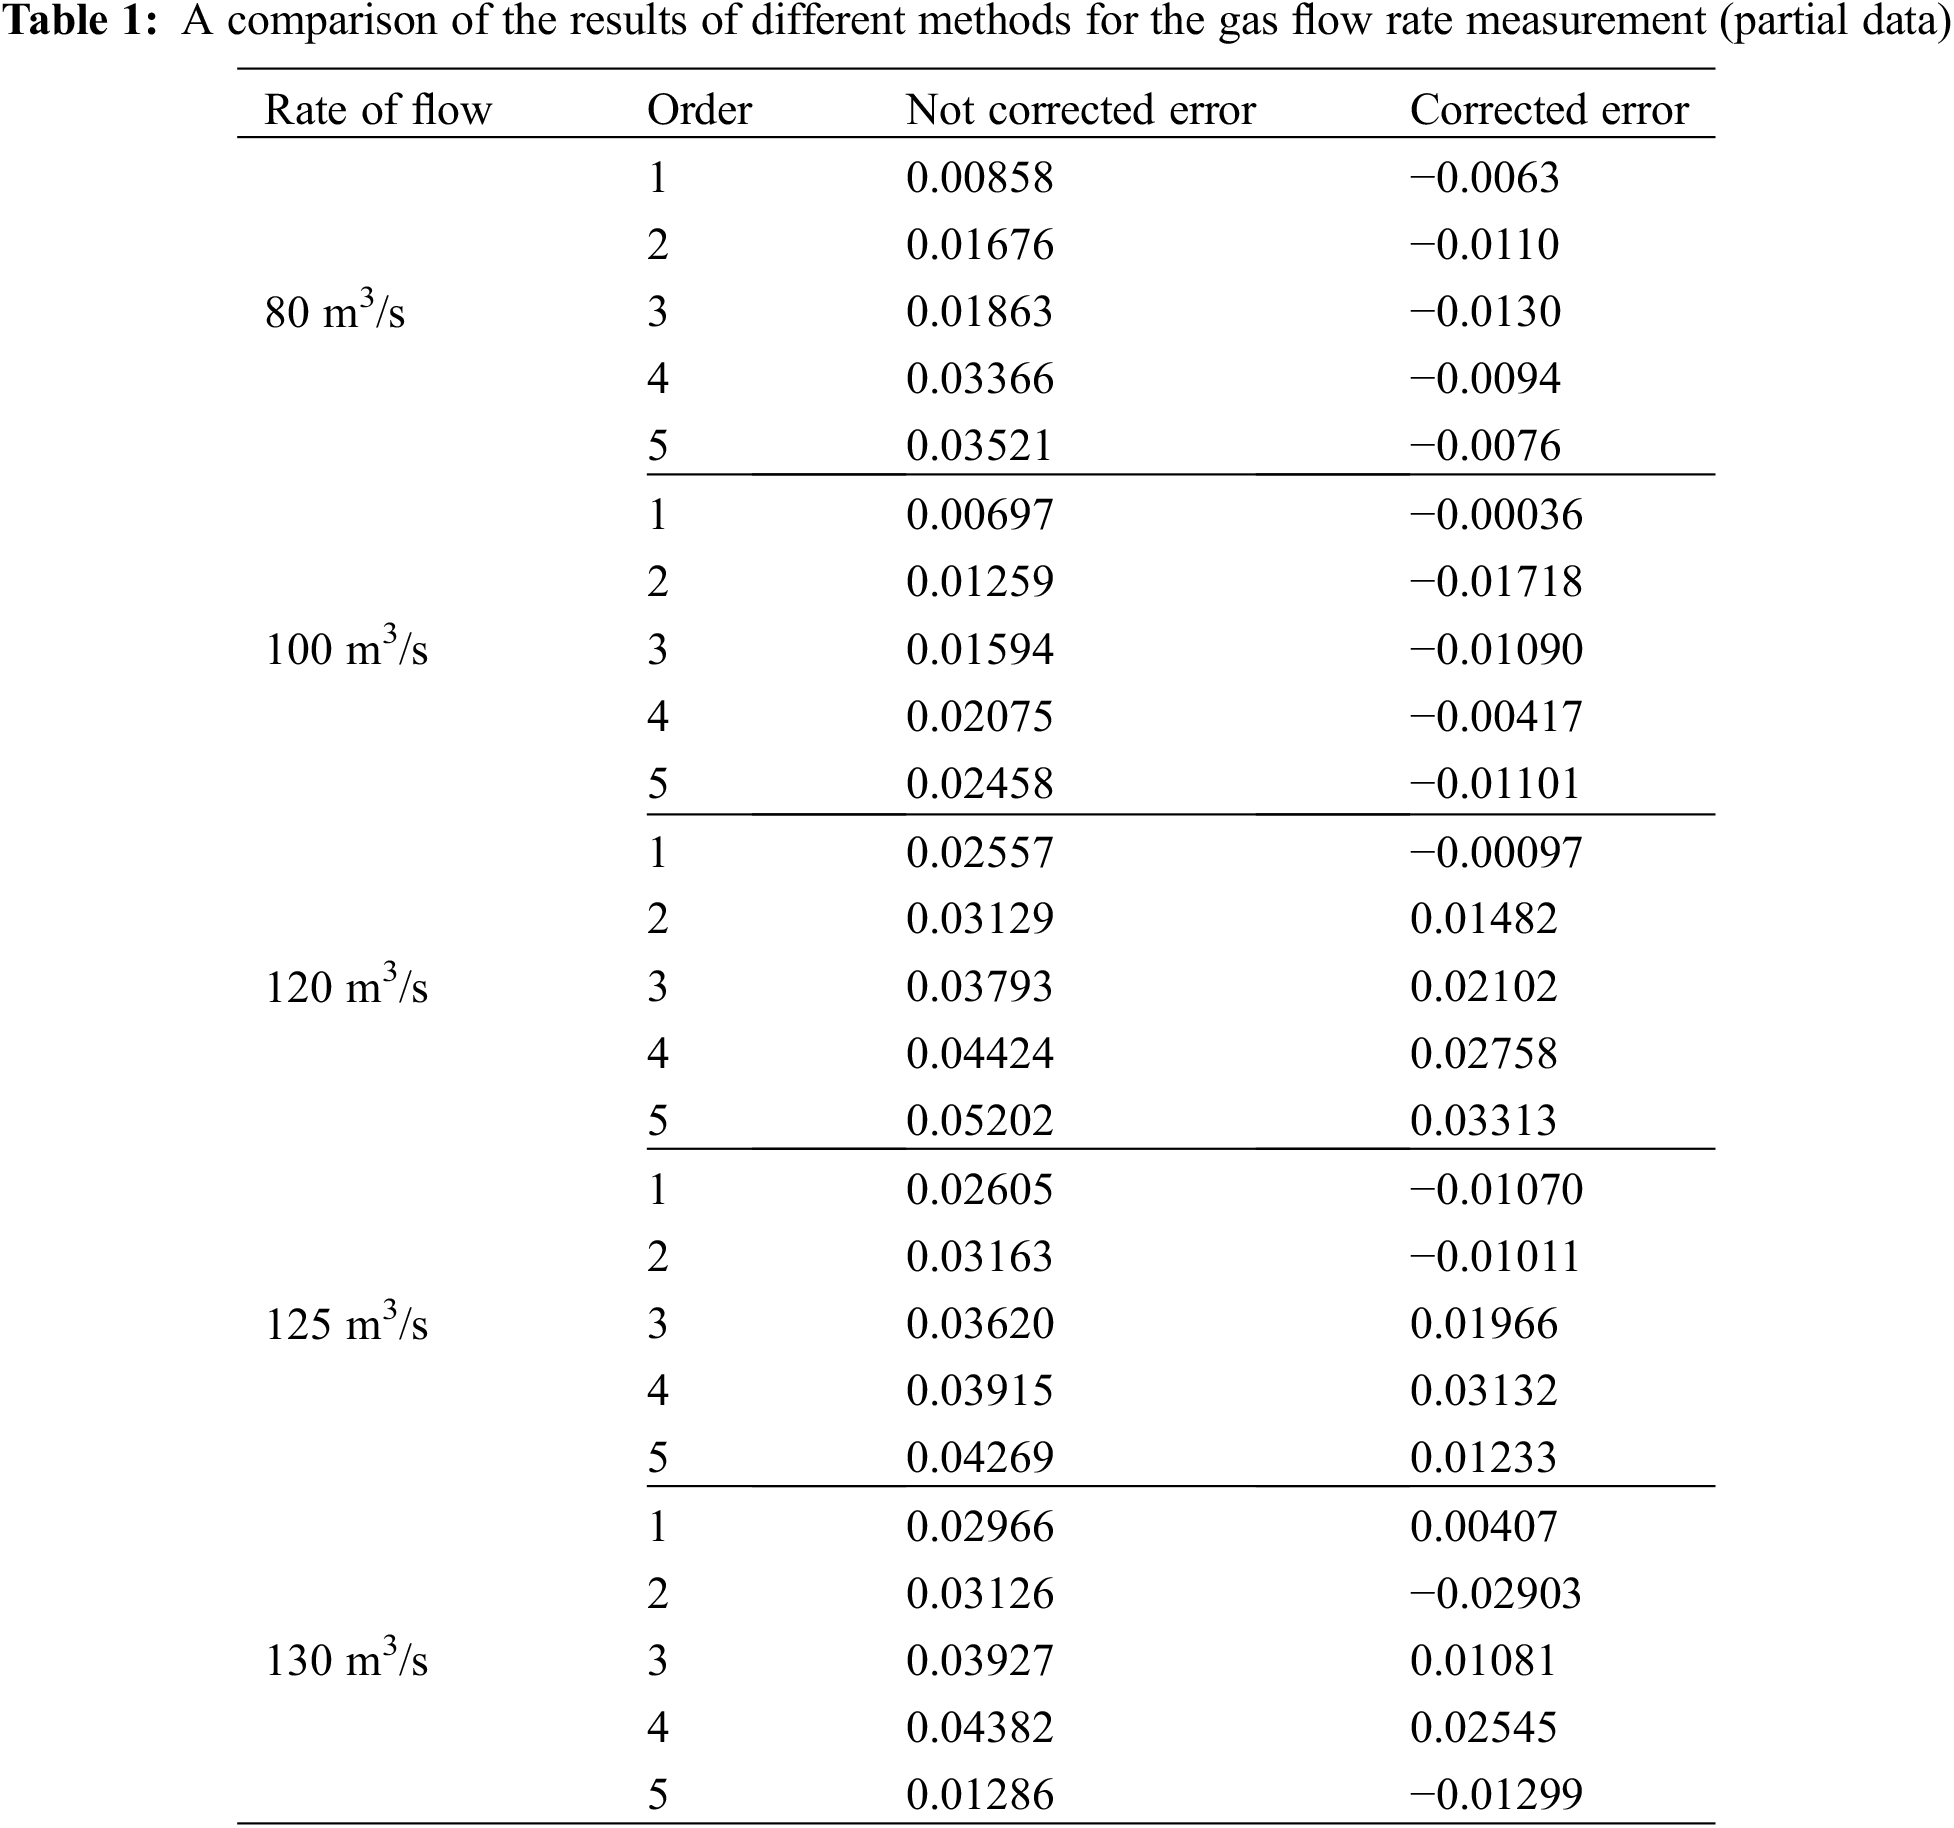
Experiments were carried out using the horizontal atmospheric two-phase flow equipment shown in Fig. 6 and using a DN50 vortex flow meter as shown in Fig. 7. The measurement accuracy of the vortex flow meter is ±0.5% for a single-phase flow. The fluid media were air and water, and three pressure points of 200 kPa, 300 kPa, and 400 kPa were considered, along with five gas-phase flow rates of 80 m3/h, 100 m3/h, 120 m3/h, 125 m3/h, and 130 m3/h. The liquid-phase flow rate range was 0–0.09 m/s. The gas flow rate was corrected after being output from the vortex flow meter according to the algorithm in Section 3.1. The liquid flow rate was obtained by calculating the standard value output from the orifice according to the algorithm provided in Section 2.2. The experimental results are shown in Table 1.
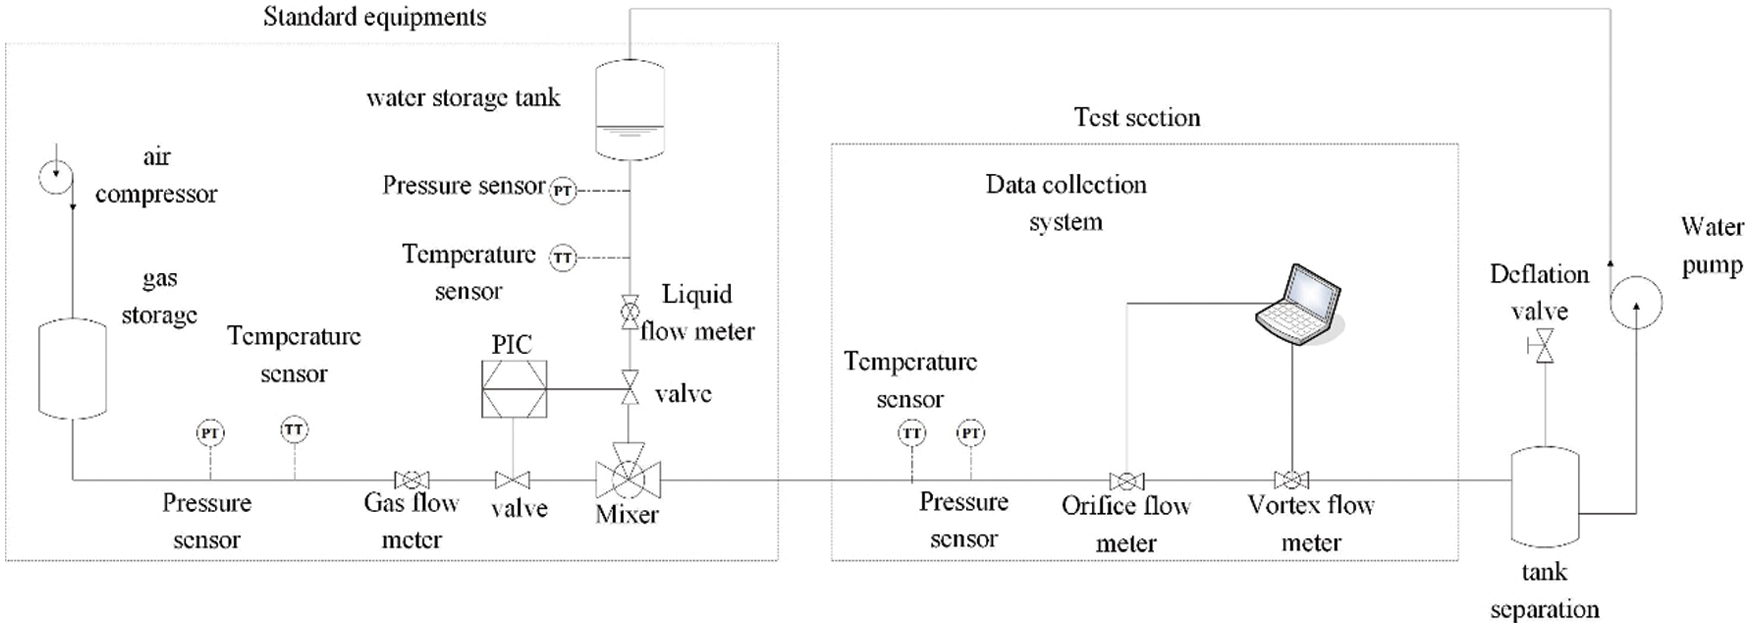
Figure 6: A schematic diagram of the two-phase flow rate measurement device
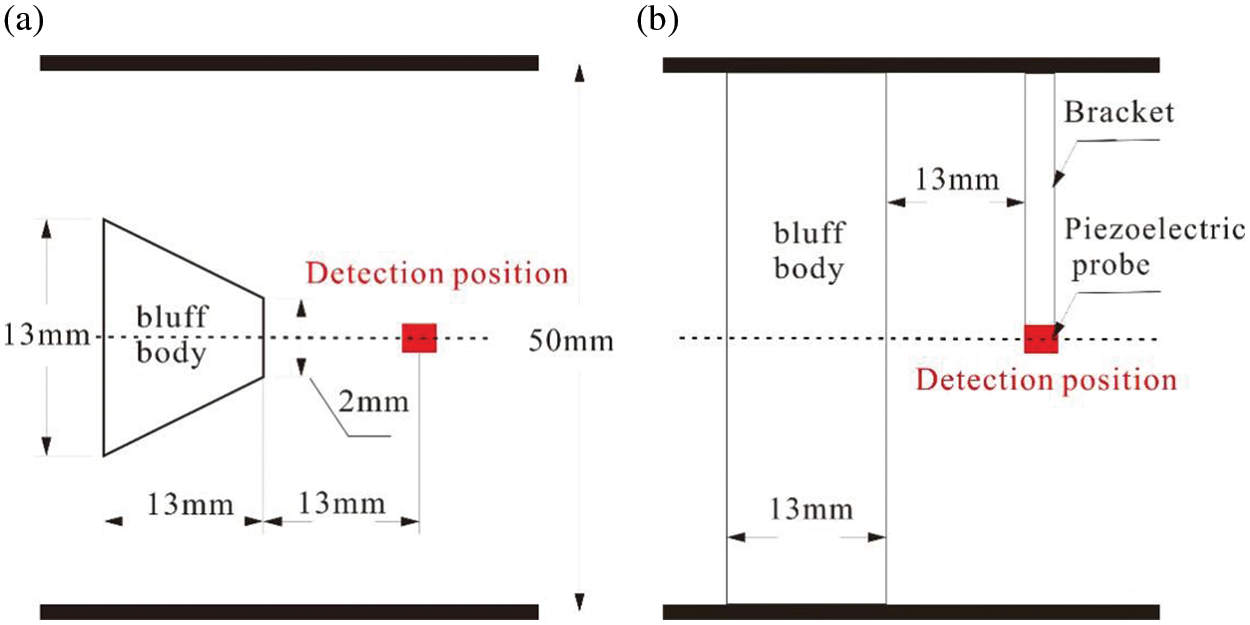
Figure 7: The structure of the vortex flow meter
4.2 Experimental Data Analysis
Using the algorithm to correct the gas flow rate, the result from the model agrees well with the experimental data, as shown in Fig. 8. The relative error of the corrected gas flow rate is within 5% for most of the experimental data. This result is acceptable because the error associated with the void fraction model is 5%, and the relative error associated with the entrainment model is 30%.
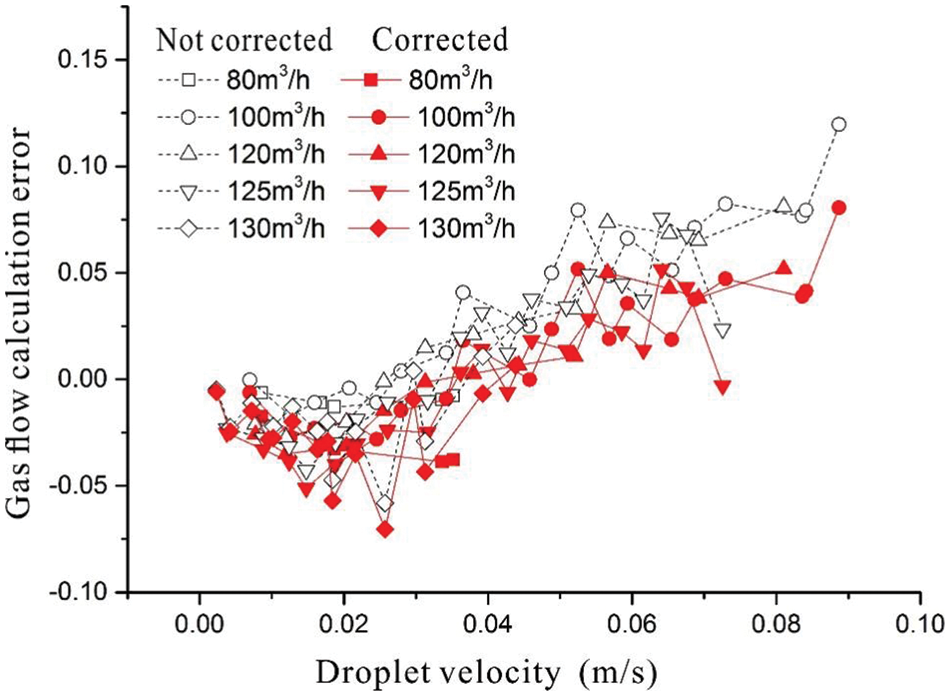
Figure 8: A comparison of the correction algorithm results
The corrected and uncorrected errors are the ratios of the calculated flow rates to the real flow rate, where the real flow rate is obtained from the flow meter in the standard equipment shown in Fig. 6.
When the liquid velocity is small, the relative error is small, so the correction effect is not obvious. The relative error increases with increasing liquid velocity, as does the error associated with the calculation formula for the void fraction. It is possible that the main reason for the error lies in the calculation errors of the models, such as for the void fraction, entrainment, sliding speed ratio, and droplet diameter. The percentage of data points within a 5% error for the uncorrected gas flow rate is 78.5%, but the percentage of data points within a 5% error for the corrected gas flow rate is 88.6%. When the liquid velocity is large, the error on the uncorrected data is large, and the correction effect is significant. This shows that the modified algorithm can improve the measurement accuracy of vortex flow meters for gas-liquid two-phase flows.
Unlike Hussein’s method [7], this correction effect can also be applied when the dryness is less than 95%. We can now compare this model with those of other researchers. Although Li’s method makes more accurate predictions, it uses image recognition technology, which requires more complex equipment and has limited adaptability [9]. The accuracy of the method proposed in this paper is somewhat weaker, but it has a wider range of applicability.
This paper has proposed a metering scheme for measuring gas-liquid two-phase flows by combining orifice and vortex flow meters. The liquid flow rate is calculated using the gas flow rate output from the vortex flow meter and this is brought into the over-reading model of the orifice flow meter. The liquid flow rate is then used to determine the corrected gas flow rate using the void fraction, droplet entrainment, gas-liquid slip ratio, and other two-phase parameters obtained from empirical formulae. The modified algorithm has been verified using a real gas-liquid two-phase flow experiment. When the liquid content is large, the error associated with the uncorrected data is large, but the corrected error is significantly reduced. The experimental results show that the modified algorithm is effective.
Funding Statement: It is supported by the Leading Talent Training Project for Young and Middle-Aged Teacher (A2-0265-22-41).
Conflicts of Interest: The authors declare that they have no conflicts of interest to report regarding the present study.
References
1. Jones, O. C., Zuber, N. (1975). The interrelation between void fraction fluctuations and flow patterns in two-phase flow. International Journal of Multiphase Flow, 2(3), 273–306. DOI 10.1016/0301-9322(75)90015-4. [Google Scholar] [CrossRef]
2. Zhao, L. A., Wang, T. L. (2021). On the influence of vortex-induced resistance on oil-shale particle-slurry flow in vertical pipes. Fluid Dynamics & Materials Processing, 17(2), 413–426. DOI 10.32604/fdmp.2021.011205. [Google Scholar] [CrossRef]
3. Zhou, Z. Q. (2021). Numerical study on the blade channel vorticity in a Francis turbine. Fluid Dynamics & Materials Processing, 17(5), 1091–1100. DOI 10.32604/fdmp.2021.016618. [Google Scholar] [CrossRef]
4. Redchyts, D. O., Shkvar, E. A., Moiseienko, S. V. (2019). Control of Karman vortex street by using plasma actuators. Fluid Dynamics & Materials Processing, 15(5), 509–525. DOI 10.32604/fdmp.2019.08266. [Google Scholar] [CrossRef]
5. Zhang, J., Zhang, T. (2015). Research on signal amplitude of the Kármán vortex street in gas-liquid two-phase flow with high void fraction. Flow Measurement and Instrumentation, 41(5), 158–164. DOI 10.1016/j.flowmeasinst.2014.12.001. [Google Scholar] [CrossRef]
6. Zhang, J., Zhang, T. (2015). Parameter-induced stochastic resonance based on spectral entropy and its application to weak signal detection. Review of Scientific Instruments, 86, 25005. DOI 10.1063/1.4908129. [Google Scholar] [CrossRef]
7. Hussein, I. B., Owen, I. (1991). Calibration of flowmeters in superheated and wet gas. Flow Measurement and Instrumentation, 2, 209–215. DOI 10.1016/0955-5986(91)90003-A. [Google Scholar] [CrossRef]
8. Jia, Y. F., Kong, D. R. (2009). Fog two-phase flow correlation for vortex flow meter based on theory of vortex street wave. CIESC Journal, 60, 601–607. [Google Scholar]
9. Li, J. X., Ding, H. B., Wang, C., Sun, H. J. (2021). A new overreading model for wet gas vortex metering considering entrained droplet flow parameters. Journal of Beijing University of Aeronautics and Astronautics, 1–13. DOI 10.13700/j.bh.1001-5965.2021.0364. [Google Scholar] [CrossRef]
10. Chisholm, D. (1967). Flow of incompressible two-phase mixtures through sharp-edged orifices. Journal of Mechanical Engineering Science, 9(1), 72–78. DOI 10.1243/JMES_JOUR_1967_009_011_02. [Google Scholar] [CrossRef]
11. Chisholm, D. (1977). Research note: Two-phase flow through sharp-edged orifices. Journal of Mechanical Engineering Science, 3(3), 128–130. DOI 10.1243/JMES_JOUR_1977_019_027_02. [Google Scholar] [CrossRef]
12. Skea, A. F., Hall, A. W. R. (1999). Effects of water in oil and oil in water on single-phase flowmeters. Flow Measurement and Instrumentation, 10(3), 151–157. DOI 10.1016/S0955-5986(98)00054-5. [Google Scholar] [CrossRef]
13. Steven, R., Hall, A. (2009). Orifice plate meter wet gas flow performance. Flow Measurement and Instrumentation, 20(4–5), 141–151. DOI 10.1016/j.flowmeasinst.2009.07.001. [Google Scholar] [CrossRef]
14. Lockhart, R. W., Martinelli, R. C. (1949). Proposed correlation of data for isothermal two-phase two-component flow in pipes. Chemical Engineering Progress, 45, 39–48. [Google Scholar]
15. Yoon, S. S. (2005). Droplet distributions at the liquid core of a turbulent spray. Physics of Fluids, 17(3), 035103. DOI 10.1063/1.1852577. [Google Scholar] [CrossRef]
16. Azzopardi, B. J., Piearcey, A., Jepson, D. M. (1991). Drop size measurements for annular two-phase flow in a 20 mm diameter vertical tube. Experiments in Fluids, 11(2–3), 191–197. DOI 10.1007/BF00190300. [Google Scholar] [CrossRef]
17. Li, D. S., Zhao, Z. X., Li, Y. R., Wang, Q. W., Li, R. N. et al. (2018). Effect particle Stokes number on wind turbine airfoil erosion. Applied Mathematics and Mechanics, 39(5), 639–652. DOI 10.1007/s10483-018-2267-6. [Google Scholar] [CrossRef]
18. Cioncolini, A., John, R. T. (2010). Prediction of the entrained liquid fraction in vertical annular gas-liquid two-phase flow. International Journal of Multiphase Flow, 36(4), 293–302. DOI 10.1016/j.ijmultiphaseflow.2009.11.011. [Google Scholar] [CrossRef]
Cite This Article
 Copyright © 2023 The Author(s). Published by Tech Science Press.
This work is licensed under a Creative Commons Attribution 4.0 International License , which permits unrestricted use, distribution, and reproduction in any medium, provided the original work is properly cited.
 Downloads
 Citation Tools