
 Submit a Paper
 Propose a Special lssue
 Open Access
ARTICLE
Analysis of Channeling-Path Phenomena in a Complex Fault-Block Reservoir with Low Recovery Factor and High Water-Cut Ratio
1 Jidong Oilfield Company Ltd. Exploration and Development Research Institute, Tangshan, 063000, China
2 Unconventional Oil and Gas Institute, China University of Petroleum (Beijing), Beijing, 102249, China
3 College of Petroleum Engineering, China University of Petroleum (Beijing), Beijing, 102249, China
* Corresponding Author: Tongjing Liu. Email:
Fluid Dynamics & Materials Processing 2023, 19(2), 361-377. https://doi.org/10.32604/fdmp.2022.020358
Received 18 November 2021; Accepted 06 April 2022; Issue published 29 August 2022
 View Full Text
 Download PDF
Abstract
Current methods for the analysis of channeling-path phenomena in reservoirs cannot account for the influence of time and space on the actual seepage behavior. In the present study, this problem is addressed considering actual production data and dynamic characteristic parameters quantitatively determined in the near wellbore area by fitting the water-cut curve of the well. Starting from the dynamic relationship between injection and production data, the average permeability is determined and used to obtain a real-time quantitative characterization of the seepage behavior of the channeling-path in the far wellbore area. For the considered case study (Jidong oilfield), it is found that the seepage capacity of the channeling-path in the far wellbore area is far less (10 times smaller) than that of the channeling-path in the near wellbore area. The present study and the proposed model (combining near wellbore area and far wellbore area real-time data) have been implemented to support the definition of relevant adjustment measures to ultimately improve oil recovery.Keywords
The complex fault-block reservoirs in Jidong Oilfield have many characteristics, such as small area (the percentage of oil reservoirs with an area of less than 0.3 km2 is 83.2%), numerous layers (the average number of layers in the reservoirs is 48), and strong heterogeneity (the variation coefficient of the average permeability of the reservoirs is greater than 0.7). At present, the overall development characteristics are as follows: predominance of medium- and low-permeability reservoirs, deteriorating development effect, and “three highs and two lows”. The so-called “three highs and two lows” refer to high comprehensive water cut (average, 86.2%), high operating cost (average, 1072 yuan/ton), high natural decline rate (average, 20%/year), low oil recovery rate from geological reserves (average, 0.58%/year), and low recovery degree of geological reserves (average, 14.5%). How to effectively identify channeling channels in such reservoirs is of great practical significance in terms of improving the development effect of the reservoirs, prolonging the development life of the reservoirs, rationally formulating the development adjustment measures, and improving the ultimate oil recovery of the reservoirs [1–3].
Channeling channels are also referred to as dominant (seepage) channels. Existing channel identification methods can be categorized into five types based on the data used, i.e., production logging data, coring well data, tracer monitoring data, well test data, and production performance data [4–6]. Compared with other data, production dynamic data are not limited by the development conditions or construction period, and are the easiest to obtain. Based on the data screening and analysis method used, the method of using production dynamic data to identify channeling channels can be further categorized into the gray correlation method [7,8], fuzzy comprehensive evaluation method [9–11], cluster analysis method [12–14], characteristic curve method [15–17], and dynamic comprehensive analysis method [18–20].
The gray correlation and fuzzy comprehensive evaluation methods can quantitatively explain the degree of development of the channeling channel (volume, radius, permeability, development level); however, the weighting value is strongly influenced by subjective factors [21,22]. Based on these two methods, the cluster analysis method introduces a classification method for fuzzy similarity relationships. It not only overcomes the drawback of the strong influence of subjective factors but also provides a better solution to the problem of rationality of boundary values. However, it cannot reflect the effects of time and space on channeling channels [23,24]. The characteristic curve and dynamic comprehensive analysis methods can qualitatively identify the existence of channeling channels by fitting the corresponding relationship between injection and production wells. Moreover, they can reflect the influence of time on channeling channels; however, they can neither reflect the influence of space on channeling channels nor explain the channeling flow. The effect of the channel development degree on the seepage capacity is different in different parts of the reservoir [25–27].
The spatiotemporal properties of the channeling channel influence the entire development process. On the one hand, the interpretation result of the channeling channel without considering the influence of time is an instantaneous value that only reflects the developmental state of the channeling channel corresponding to a certain time point. However, the overall development of channeling channels is a dynamic process, and a channeling channel does not change once it is formed. On the other hand, the interpretation result of the channeling channel without considering the influence of space is a local value that cannot reflect the spatial difference in the seepage capacity of the reservoir. However, logging data have confirmed that once a channeling channel exists between the injection and production wells, the seepage capacities of the channel development part and other parts of the reservoir are different. Therefore, to gain a better understanding of the dynamic development characteristics of channeling channels as well as their influence on the development effect, we must establish a dynamic identification method for channeling channels that comprehensively considers the effects of time and space.
This study considers a typical complex fault-block reservoir in Jidong Oilfield as an example to investigate a channeling-path identification method that comprehensively considers the influence of time and space. Based on the theory of mass transfer and diffusion, the development characteristics of channeling channels between injection and production wells are dynamically characterized by fitting the water cut of the production wells. Further, based on Darcy’s formula and the potential superposition principle, the reservoir seepage capacity under the influence of channeling channels is dynamically characterized through the inversion of the dynamic production relationship between oil and water wells. This approach provides a scientific basis for comprehensively understanding the development characteristics and seepage capacity of channeling channels under the influence of time and space. Moreover, it has great practical significance for the rational formulation of development adjustment measures as well as for the improvement of the ultimate oil recovery.
2 Dynamic Identification Method for Channeling Channels
2.1 Characteristic Parameter Fitting of Channeling Channels
Development practice has shown that when channeling channels exist in a reservoir, certain measures are adopted by the water well and the corresponding response is produced by the oil well. Therefore, according to the dynamic response relationship of the oil-water well production, it is possible to qualitatively determine not only whether a channeling channel exists but also the development direction of the channeling channel. Among the production dynamic data identification methods that can reflect the influence of time on the channeling channel, the channeling channel quantification method based on the mass transfer diffusion theory is a fast identification method that can realize quantitative interpretation of key parameters such as the channel thickness and permeability gradient [28].
To solve complex and challenging problems involving 3D mathematical models, the quantification method for channeling channels in medium- and high-permeability reservoirs based on the theory of mass transfer and diffusion employs the concept of dimensionality reduction. Thus, the 3D physical model of the channeling channel between the injection and production wells is transformed into a superposition of two 2D physical models (plane and section). Then, based on the similarity between the spindle-shaped distribution of the injected water on the plane and the injected chemical concentration distribution, as well as the monotonic correlation of the injection rate, water saturation, and permeability change rate, a plane mathematical model including the water content is established.
Laboratory experiments and theoretical research results have shown that the channeling channel has a spindle shape on the plane as well as obvious characteristics of a thief layer in the vertical direction. Therefore, a 3D physical model of the channeling channel between the injection and production wells is established, as shown in Fig. 1. For the perforated sublayer (the colorless plane in the figure), the initial vertical heterogeneity allows most of the injected water to enter the lower sublayer, and the continuous scouring eventually forms a planar spindle-shaped channel (the blue area); consequently, the permeability of the lower sublayer continues to increase and this layer finally exhibits the characteristics of a thief layer.
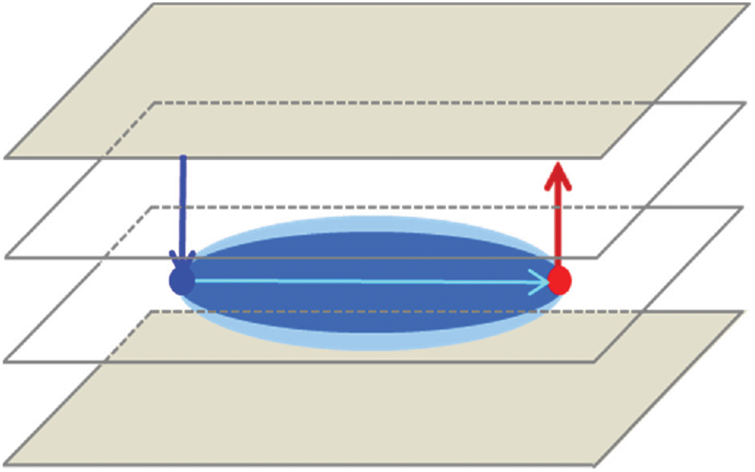
Figure 1: The 3D physical model of the channeling channel between the injection and production wells
On the plane, the change factor of the reservoir permeability is positively correlated with the water injection factor. The channeling channels and injection streamlines formed by scouring have similar shapes on the plane, i.e., both have a spindle shape. Vertically, the initial vertical heterogeneity leads to an uneven distribution of the injected water, and the degree of development of the channeling channels in each layer varies considerably, resulting in the formation and intensification of the thief layer. Therefore, after dimensionality reduction, the 3D physical model of the channeling channel between the injection and production wells becomes a superposition of two 2D physical models (plane and section), as shown in Fig. 2.
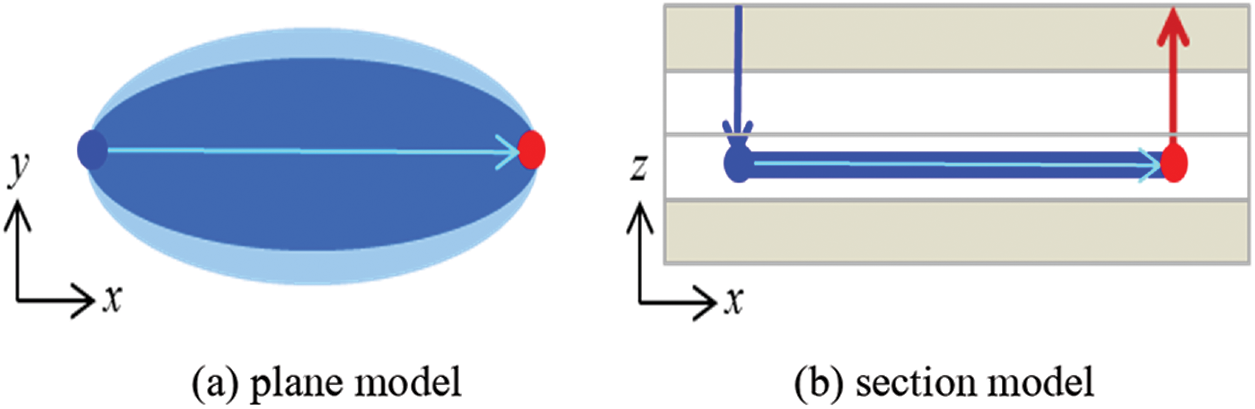
Figure 2: The 2D physical model of the channeling channel between the injection and production wells
According to the similarity between the distribution shape (spindle shape) at the injection level and the distribution shape of the injected chemical agent concentration, as well as the monotonic correlation of the water injection ratio, water saturation, and permeability change ratio, the concept of the equivalent diffusion coefficient based on the saturation difference is proposed. The spindle-shaped distribution of the injection-production streamline and its influence on the reservoir permeability are equivalent to the influence of the axial and lateral mass transfer and diffusion of injected water.
Based on the theory of mass transfer and diffusion, the following basic mathematical model is established by considering the equivalent mass transfer and diffusion in the case of 1D flow:
where D is the equivalent diffusion coefficient (cm2/s), fw is the water content at the output end (f), x is the seepage distance (cm), u is the seepage velocity of the injected fluid (cm/s), t is the time (s), and Sw is the bound water saturation (f).
Considering the continuous and stable injection from time t = 0, the initial and boundary conditions in the 1D case are expressed as follows:
where fw0 is the water content corresponding to the initial oil saturation of the reservoir (f).
In view of the characteristic that the thief layer is the main channel of the invalid water cycle, the dilution factor α is introduced to correct the mathematical model. The definition function of α is expressed as follows:
where α is the dilution factor (f), Tk is the permeability gradient of the channeling channel (f), b is the proportion of the thickness of the layer in which the channeling channel is located to the thickness of the production layer (%), μw is the water viscosity (mPa∙s), and μo is the oil phase viscosity (mPa∙s).
The correction time t′ is defined as
Substitute Eqs. (4) and (5) into Eqs. (1)–(3) and perform the Laplace transform for time t′ to obtain the Laplace space solution. Then, use the inverse Laplace transform for inversion in order to obtain the analytical solution of the water cut at the output end as follows:
where erfc(x) is the Gaussian error function.
This model can realize rapid quantification of the channel thickness, permeability gradient, and equivalent diffusion coefficient. The equivalent diffusion coefficient obtained by interpretation can characterize the fingering degree and channeling flow caused by the microscopic heterogeneity of the reservoir and the oil-water viscosity ratio. The size of the wave-affected area.
2.2 Inversion of the Seepage Capacity between the Injection and Production Wells
According to the production dynamic response relationship of the oil and water wells, and based on Darcy’s formula and the potential superposition principle, the average permeability of the reservoirs between the injection and production wells is inverted [29,30]. By analyzing the change in the reservoir seepage capacity between the injection and production wells, we can judge whether there are channeling channels between the injection and production wells; in addition, we can quantitatively analyze the development direction and development degree of the channeling channels.
A mathematical model of the seepage capacity between one injection well and one production well is established by assuming that (1) the injection and production of these wells are not affected by other wells and (2) the wellbore radii of the injection and production wells are the same. A schematic diagram of the pressure drop between the injection and production wells is shown in Fig. 3.
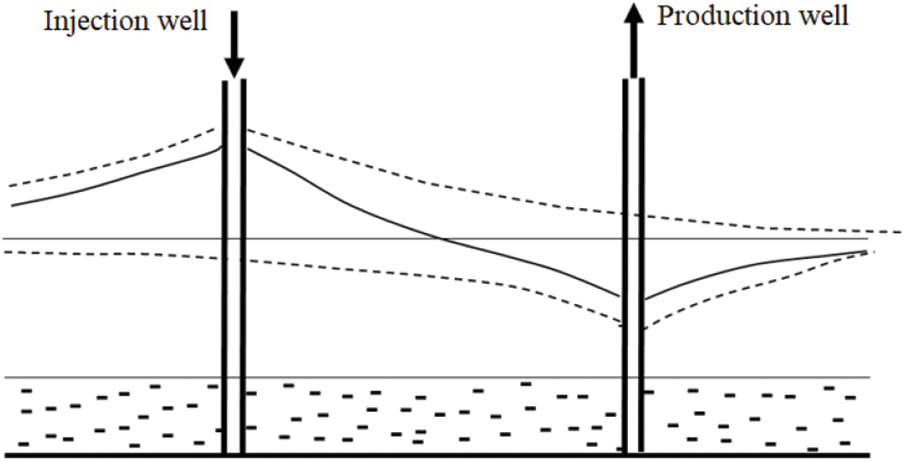
Figure 3: Schematic diagram of the pressure drop between the injection and production wells
Laboratory experiments and theoretical research results have shown that the phase permeability curve changes with the seepage capacity between the injection and production wells during the injection-production process. Therefore, the apparent fluidity μ is introduced to characterize the change in the phase permeability curve. The definition function of μ is expressed as follows:
where μ is the apparent fluidity (mPa∙s), krw is the relative permeability of the water phase (f), kro is the relative permeability of the oil phase (f), fw is the water cut at the production end (f), μw is the formation water viscosity (mPa∙s), and μo is the viscosity of crude oil (mPa∙s).
Based on Darcy’s formula and the potential superposition principle, the pressure drop functions at the injection well and production well points of the injection-production model shown in Fig. 3 can be obtained [12].
The pressure drop function at the injection well point is expressed as
where ΔP1 is the injection well pressure drop (atm), ΔP2 is the production well pressure drop (atm), L is the well spacing (cm), rw is the wellbore radius (cm), Q1 is the water injection (cm3), Q2 is the oil production (cm3), μ is the apparent fluidity (mPa∙s), k is the reservoir permeability (D), and h is the reservoir thickness (cm).
The pressure drop function at the production well point is expressed as
By combining Eqs. (8) and (9), the pressure difference function between the injection and production wells is obtained as follows:
where ΔP is the production pressure difference (atm).
Thus, the average permeability of the reservoir between the injection and production wells is expressed as follows:
Eq. (11) is expressed in the Darcy unit system, which is not convenient for engineering calculations. After conversion to the SI unit system, the following expression is obtained:
where k is the reservoir permeability (mD), Q1 is the water injection (m3), Q2 is the oil production (m3), μ is the apparent fluidity (mPa∙s), h is the reservoir thickness (m), ΔP is the production pressure difference (MPa), L is the well spacing (m), and rw is the wellbore radius (m).
3 Reservoir Overview and Development Characteristics
3.1 Reservoir Overview in the Study Area
The study area is a typical complex fault-block reservoir. Many faults cut the study area into multiple fault blocks. Each fault block has a small area, and the water energy at the edge and bottom is weak. Further, 50% of the fault blocks have a trap area of less than 1 km2. The reservoir lies at a depth of 1500–4000 m, with multiple sets of oil-bearing layers developed vertically, and the oil-water relationship is complex. The stratigraphic lithology is dominated by sandstone with finer lithology, and the reservoir type is dominated by complex fault-block reservoirs with a layered structure.
The study area is a sandstone reservoir with medium porosity and permeability; the porosity ranges from 6.6% to 42.2% (average 26.2%) and the permeability ranges from 0.3 to 3970 × 10-3 µm2 (average, 590 × 10-3 µm2). The development of the reservoirs is dominated by a positive rhythm, the distribution of the reservoirs on the plane is unstable, and the phase transition is fast. The intra-layer permeability variation coefficient is 0.54–0.86, the inrush coefficient is 2.8–11.3, the permeability gradient is 8.3–367, and the intra-layer heterogeneity is high. The inter-layer region is relatively developed, the thickness of the inter-layer region is generally 5–10 m, the permeability variation coefficient is 0.2–2.2, the heterogeneity coefficient is 1.9–4.5, and the single-layer inrush coefficient is 1.9–3.7. The overall heterogeneity is moderate to strong.
The original formation pressure in the study area is 20.84–26.19 MPa (average, 23.04 MPa), the average pressure coefficient is 1, and the reservoir temperature is 85.5°C–95.5°C (average, 89.7°C). The main layer is a conventional light-oil reservoir, the surface crude-oil density is 0.8368 g/cm3, and the surface crude-oil viscosity is 4.17 mPa∙s. The density and viscosity of the formation crude oil are 0.5999–0.7522 g/cm3 and 1.1–2.66 mPa∙s, respectively. The gas-oil ratio of single degassing is 54.2–284.2 m3/m3. The total salinity of the formation water is 5775 mg/l, and the water type is NaHCO3.
3.2 Development Dynamic Analysis
Fault block M is a typical “three highs and two lows” complex fault-block reservoir in the NB study area, with an oil-bearing area of 0.94 km2. It was put into production in 2008, with depletion production in the early stages, and water injection began in 2011. There are 13 production wells and 6 injection wells. The entire development process is divided into three stages: the trial production and production capacity construction stage (July 2008–December 2011), the low-speed development stage (January 2012–December 2015), and the injection-production improvement adjustment stage (January 2016–present). As of October 2020, the average water content of the fault block was 95%, the water retention rate was 0.5, and the recovery degree was only 9.9%.
There are four injection-production well groups in the fault block. Considering well group MX as an example, the development dynamic characteristics of the three production wells in this well group (MX1, MX2, and MX3) are analyzed (see Table 1).
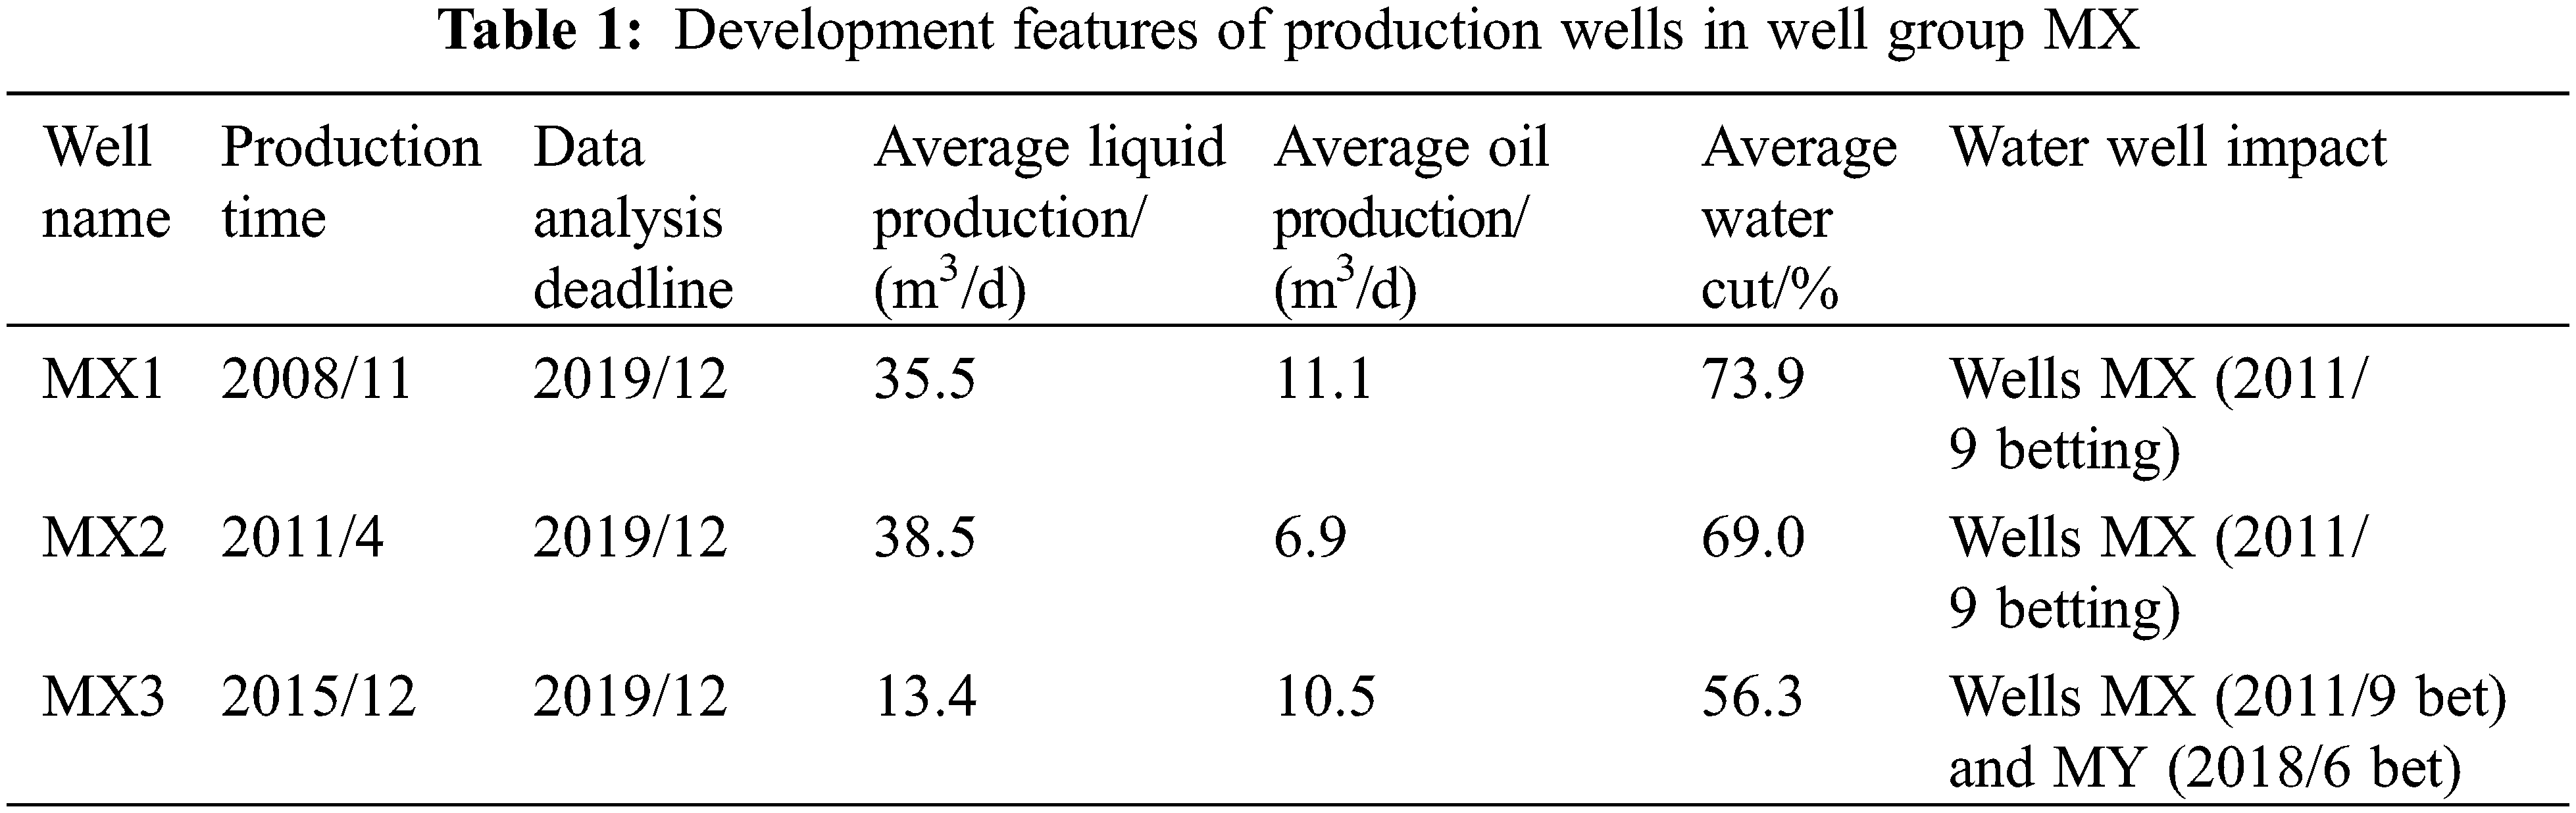
MX1: The initial production capacity was relatively high. After the development became stable, the production capacity was low whereas the water cut increased rapidly. In the later stages, owing to the water injection of MX, the liquid production volume gradually increased (mainly water production; no oil increase), and the water cut was close to 100%. During the entire development period, the average liquid production was 35.5 m3/d, the average oil production was 11.1 m3/d, and the average water cut was around 74%.
MX2: The production time was similar to the water well injection time. The entire development process was affected by the water injection of the water well. The oil production declined gradually, the oil production was low, and the water cut increased rapidly. The water cut exceeded 90% after 4 years of production. During the entire development period, the average liquid production was 38.5 m3/d, the average oil production was 6.9 m3/d, and the average water cut was 69%.
MX3: The production time was relatively late. In the early stages of development, owing to the water injection of MX, the oil production declined gradually and the oil production was not high. After 2 years of production, the water cut increased rapidly, and it was close to 80% when the well was shut in October 2018. The well was reopened in December 2018. Owing to the water injection of water well MY, the effect of water control and oil increase was obvious. The oil production and liquid production changed synchronously, i.e., they first increased and then decreased, and the water cut decreased significantly. During the entire development period, the average liquid production was 13.4 m3/d, the average oil production was 10.5 m3/d, and the average water cut was 56.3%.
In general, well group MX frequently faced problems such as low oil production rate, low liquid production rate, and rapid water cut increase during development. The production performance indicates that the well group may have witnessed the formation of an inter-well channeling path owing to the strong heterogeneity of the reservoir, which resulted in uneven water flooding sweep or ineffective water flooding.
3.3 Characteristic Parameter Analysis
The reservoir development performance can intuitively reflect the reservoir seepage capacity and reservoir development effect. Therefore, by analyzing the development performance characteristics, we can preliminarily determine not only whether channeling channels exist but also their development direction and horizon. This facilitates efficient and reliable qualitative judgment for the dynamic identification of channeling channels in complex fault-block reservoirs with “three highs and two lows”. Considering the actual development performance data of well group MX as an example, six development performance characteristic parameters were selected and analyzed [9,10].
(1) Average water cut: It is the average value of the water cut of each well in the well group before adjustment and flooding.
where fw is the water cut (f), i denotes the i-th well (i = 0, 1, 2, …, N) (f), and N is the total number of wells (f).
(2) Non-uniformity coefficient of the water cut: It is used to characterize the difference in the water cut of each well in the well group; the larger the value, the greater is the difference in the water cut of each well.
where fw is the water cut (f), i denotes the i-th well (i = 0, 1, 2, …, N) (f), N is the total number of wells (f), and Cw is the water cut non-uniformity coefficient (f).
(3) Non-uniformity coefficient of the monthly liquid production: It is used to characterize the difference in the monthly liquid production of each well in the well group; the larger the value, the greater is the difference in the monthly liquid production of each well.
where CL is the daily fluid production non-uniformity coefficient (f), N is the total number of wells (f), i denotes the i-th well (i = 0, 1, 2, …, N) (f), and QL is the monthly fluid production (m3/month).
(4) Cumulative injection-production ratio: It is the ratio of the cumulative water injection volume to the cumulative liquid extraction volume.
where R is the cumulative injection-production ratio (f), Wi is the cumulative water injection (m3), and WL is the cumulative liquid extraction (m3).
(5) Water retention rate: It refers to the ratio of the accumulated water injection amount stored in the ground but not recovered to the total accumulated water injection amount, and it is used to characterize the utilization degree of the injected water. The larger the value, the higher is the utilization rate of the injected water.
where Wf is the water storage rate (f), Wi is the cumulative water injection (m3), and Wp is the cumulative water extraction (m3).
(6) Water flooding index: It refers to the ratio of the accumulated water injection amount stored underground but not recovered to the volume of underground crude oil recovered.
where S is the water flooding index (f), Wi is the accumulated water injection (m3), Wp is the cumulative water production (m3), Bo is the crude oil volume coefficient (f), and Np is the cumulative oil production (m3).
Thus, based on the aforementioned characteristic parameters of the development performance, and considering the actual development performance data of well group MX as an example, the average water cut, cumulative injection-production ratio, non-uniformity coefficient of the water cut, non-uniformity coefficient of the monthly fluid production, water storage ratio, and water flooding index were calculated. The relationship between the calculation results of each parameter and time is shown in Fig. 4.
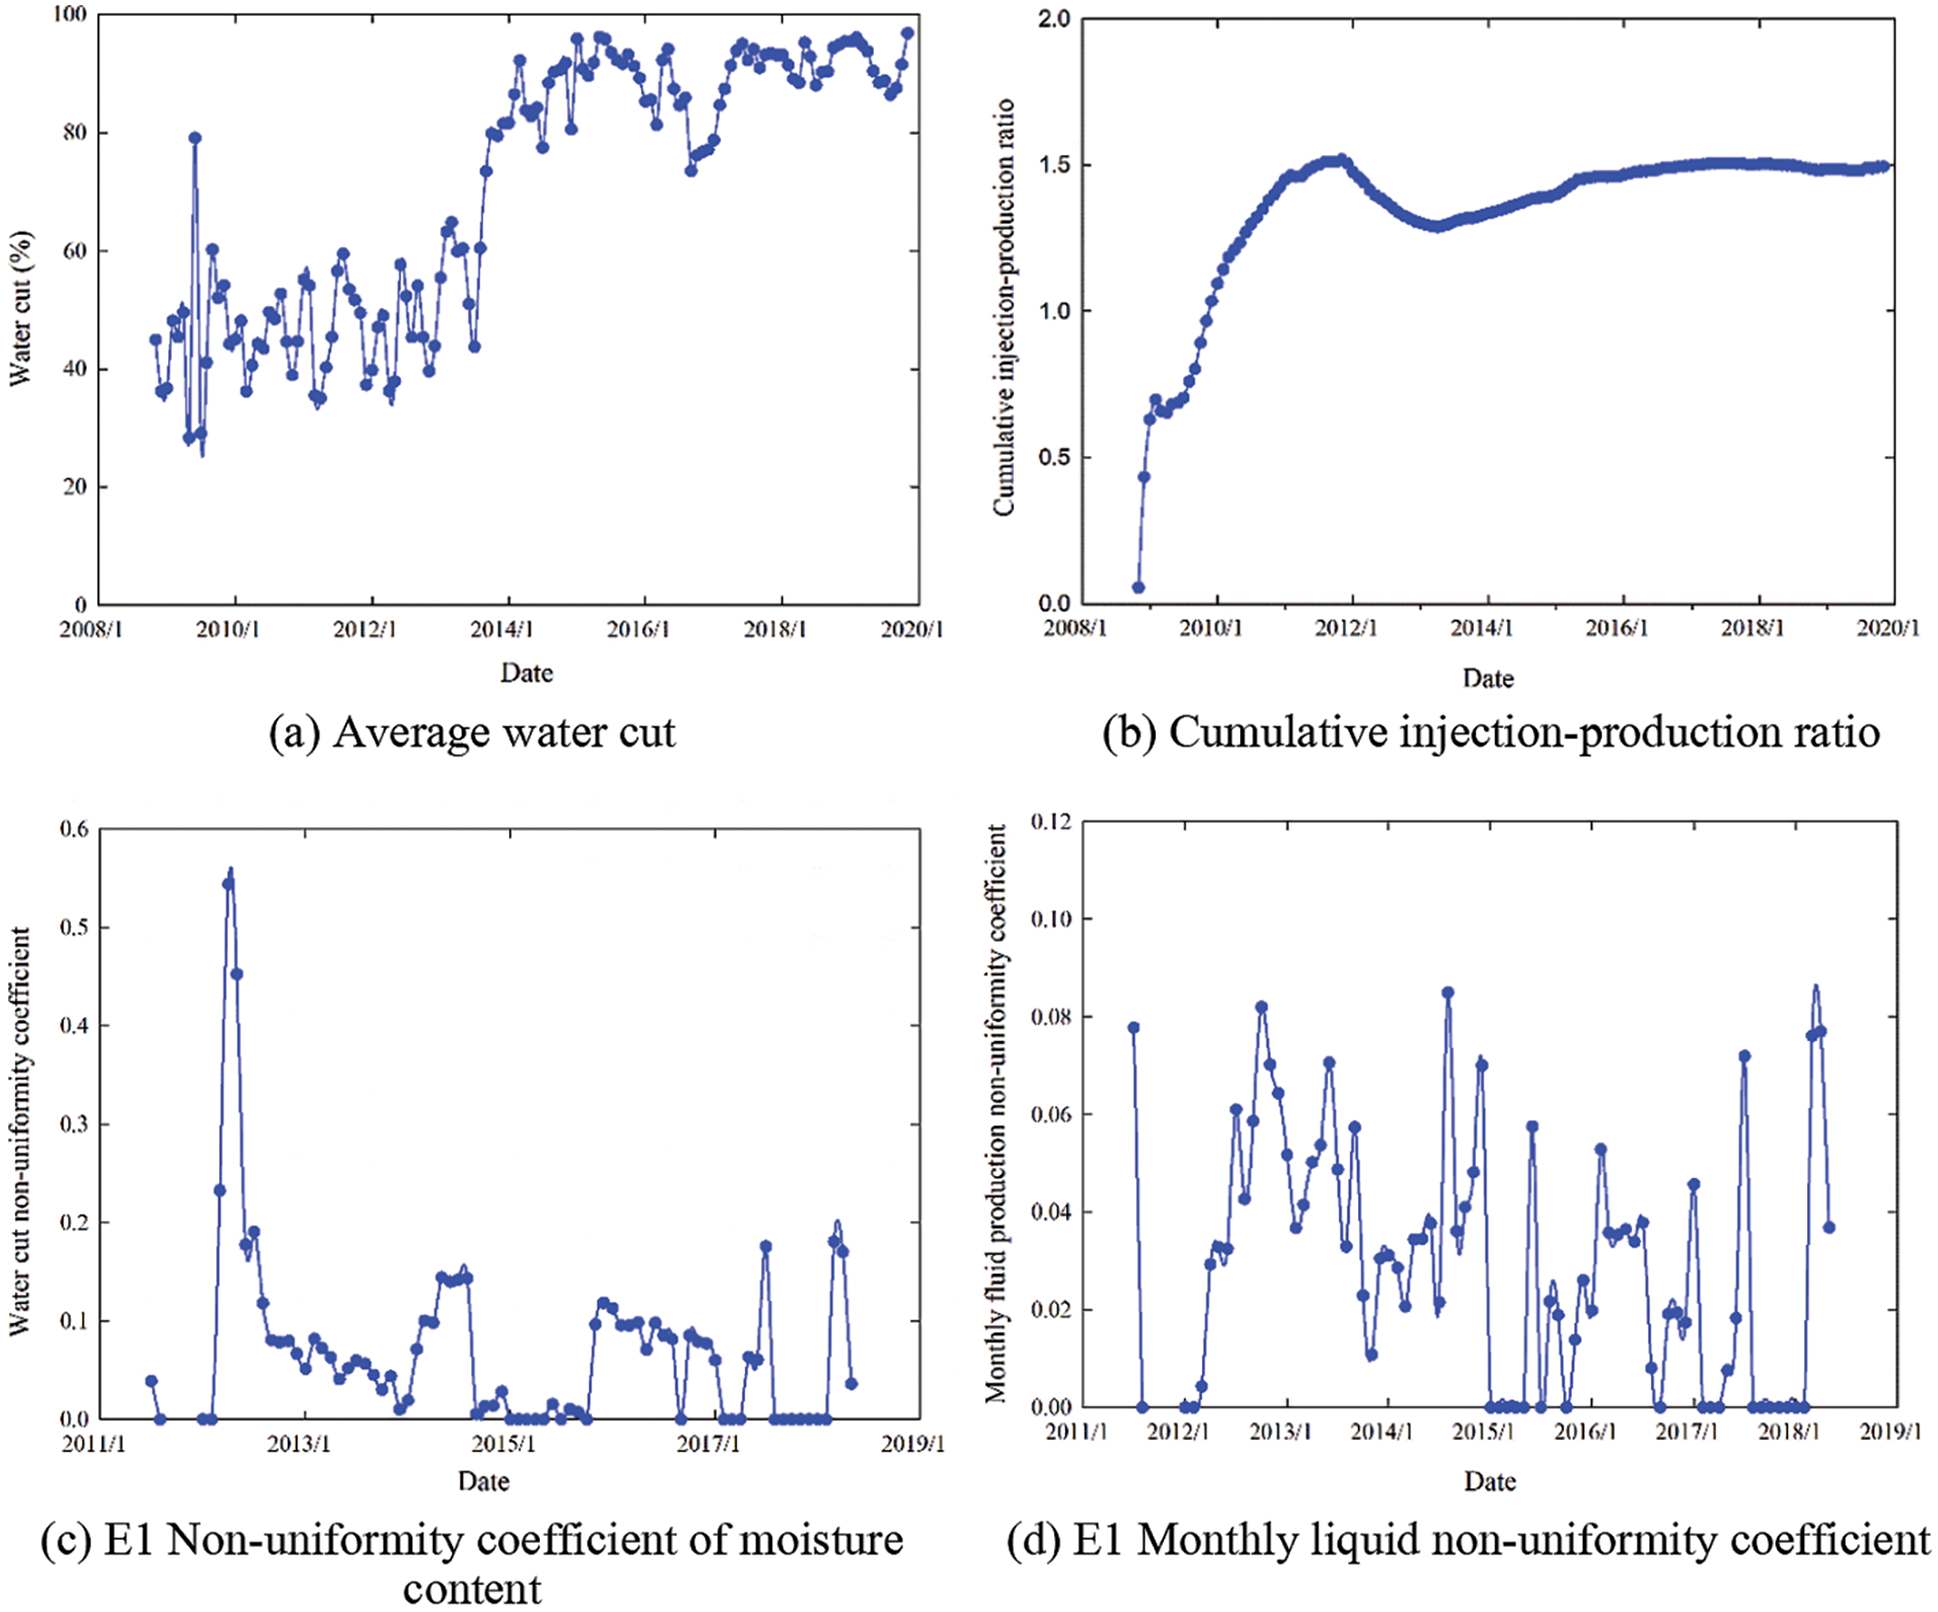
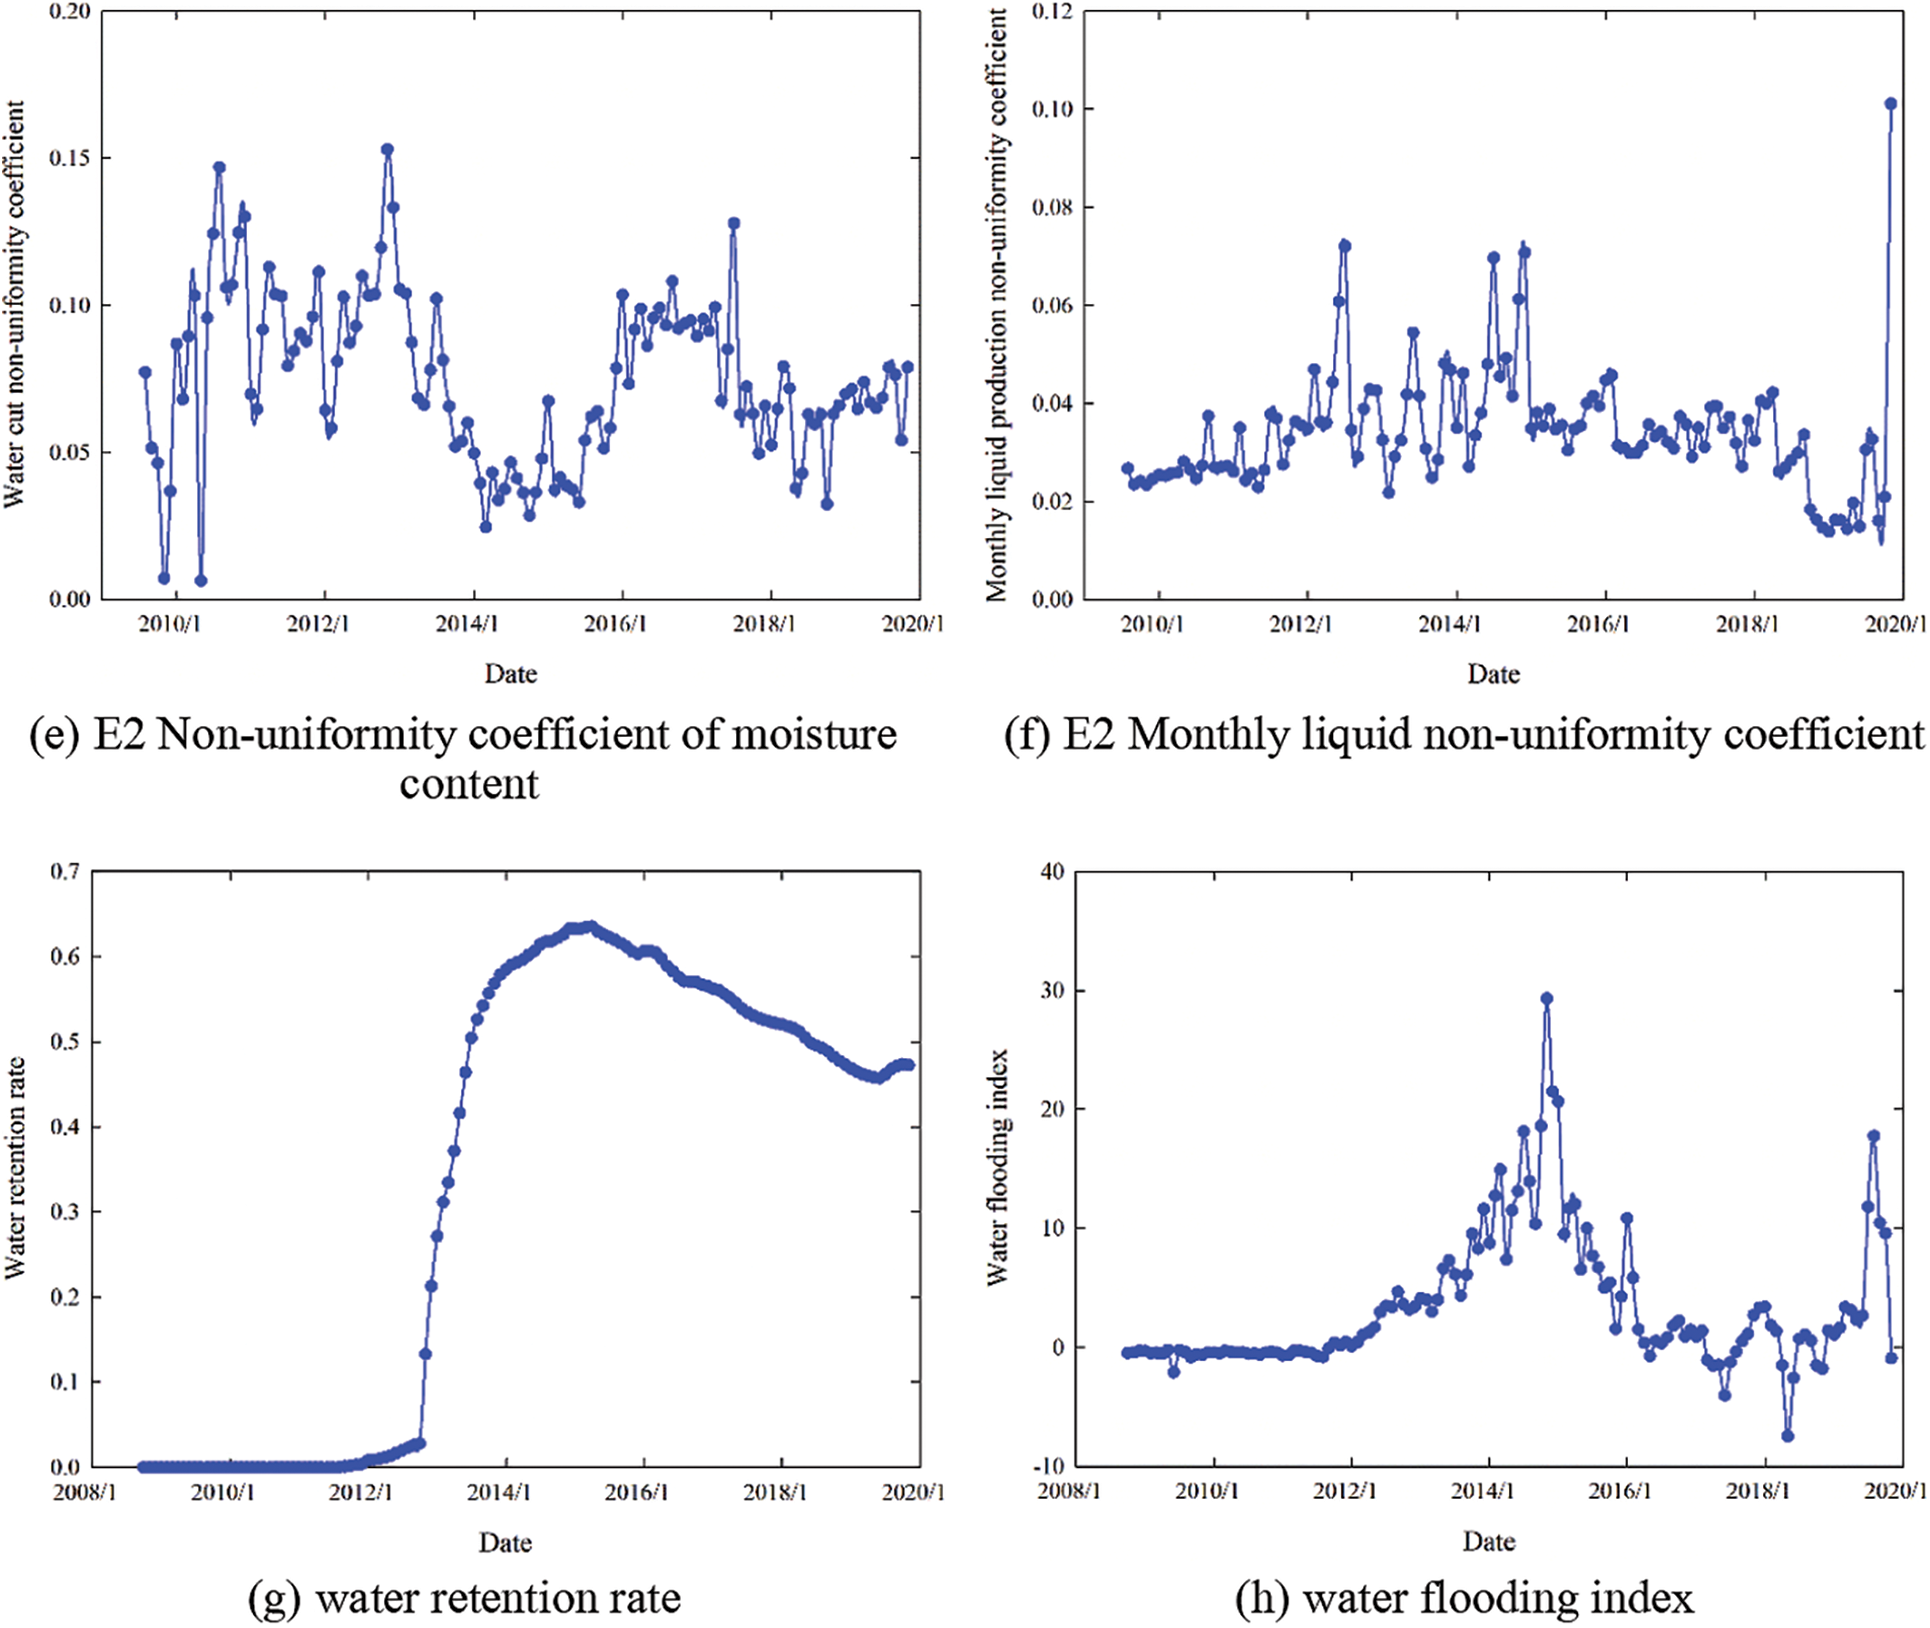
Figure 4: Calculation results of the dynamic characteristic parameters of well group MX
Comparing Fig. 4b with Figs. 4a, 4g, and 4h, we can see that the cumulative injection-production ratio affects the variation law of the water storage ratio, water flooding index, and average water content significantly. The cumulative injection-production ratio of well group MX was 0 at the initial stage of production, the water storage ratio was 0, the water flooding index was negative, and the average water cut fluctuated around 50%. As the cumulative injection-production ratio increased, the water storage rate, water flooding index, and average water content all increased in steps. Thus, the injection capacity exceeded the output capacity at this time, and channeling channels may have been generated. Therefore, the cumulative injection-production ratio has been gradually decreasing since 2016, and the water storage rate has fallen significantly during the development period. Although the water flooding index and average water content have been controlled to a certain extent, the values remain high. By 2019, as the cumulative injection-production ratio increased again, the water retention rate and water flooding index increased further, and the average water content exceeded 95%.
Comparing Fig. 4b with Figs. 4c–4f, we can see that the variation law of the non-uniformity coefficient of the water content and the non-uniformity coefficient of the monthly liquid production is virtually unrelated to the cumulative injection-production ratio. This is due to the effect of reservoir heterogeneity. Fault block M is vertically divided into two sub-layers, E1 and E2, and the reservoir heterogeneities of these two layers are different to some extent. The variation ranges of the water cut non-uniformity coefficient and monthly liquid production non-uniformity coefficient of layer E1is obvious and the value is large, whereas that of layer E2 is not as obvious and the value is small. Thus, the reservoir heterogeneity of layer E1 is stronger than that of layer E2, and channeling channels between injection and production wells are more likely to be formed in layer E1.
4 Example of Dynamic Identification of Channeling Channels
4.1 Dynamic Fitting of the Channel Characteristic Parameters
According to the analysis results of the development performance and characteristic parameters, channeling channels may exist between the injection and production wells in layer E1 of well group MX, especially in wells MX and MX2. The channeling channel characteristic parameter fitting method established in this study is used to fit the water cut curve of each production well in order to obtain the quantitative results of the channeling channel characteristic parameters between the injection and production wells. The fitting results are shown in Fig. 5.
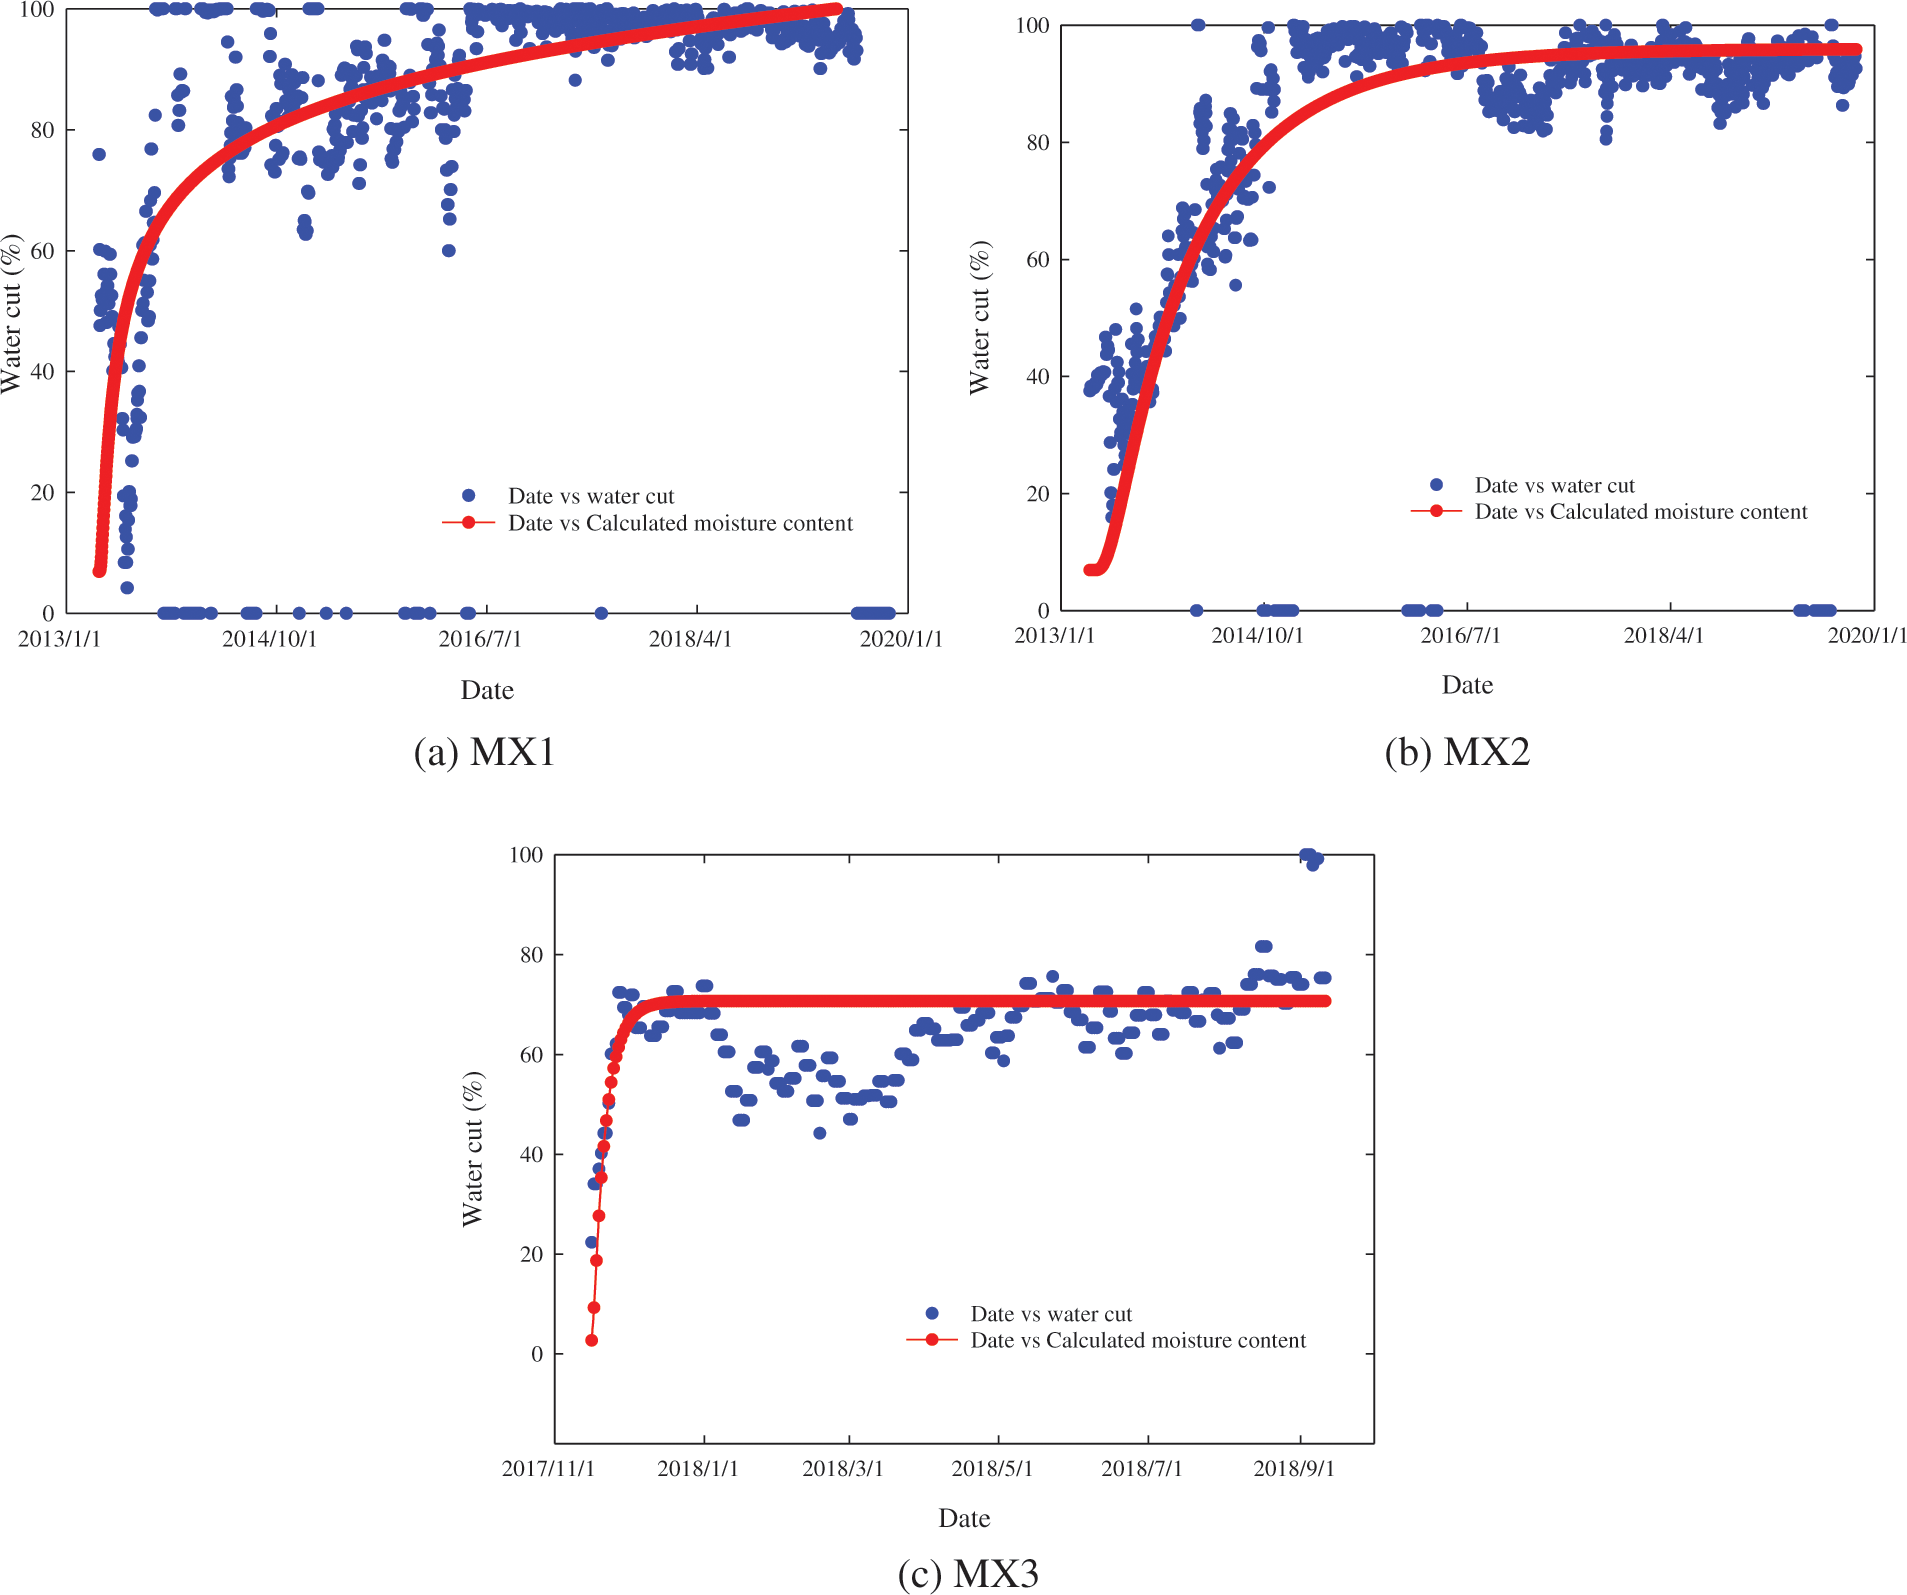
Figure 5: Water-cut matching results of the production wells in well group MX
By matching the water cut of each production well in well group MX, we can obtain parameters such as the channeling channel permeability, permeability gradient, channeling channel thickness, and ratio of the channel thickness to the connected pay layer thickness. The fitting results are summarized in Table 2.
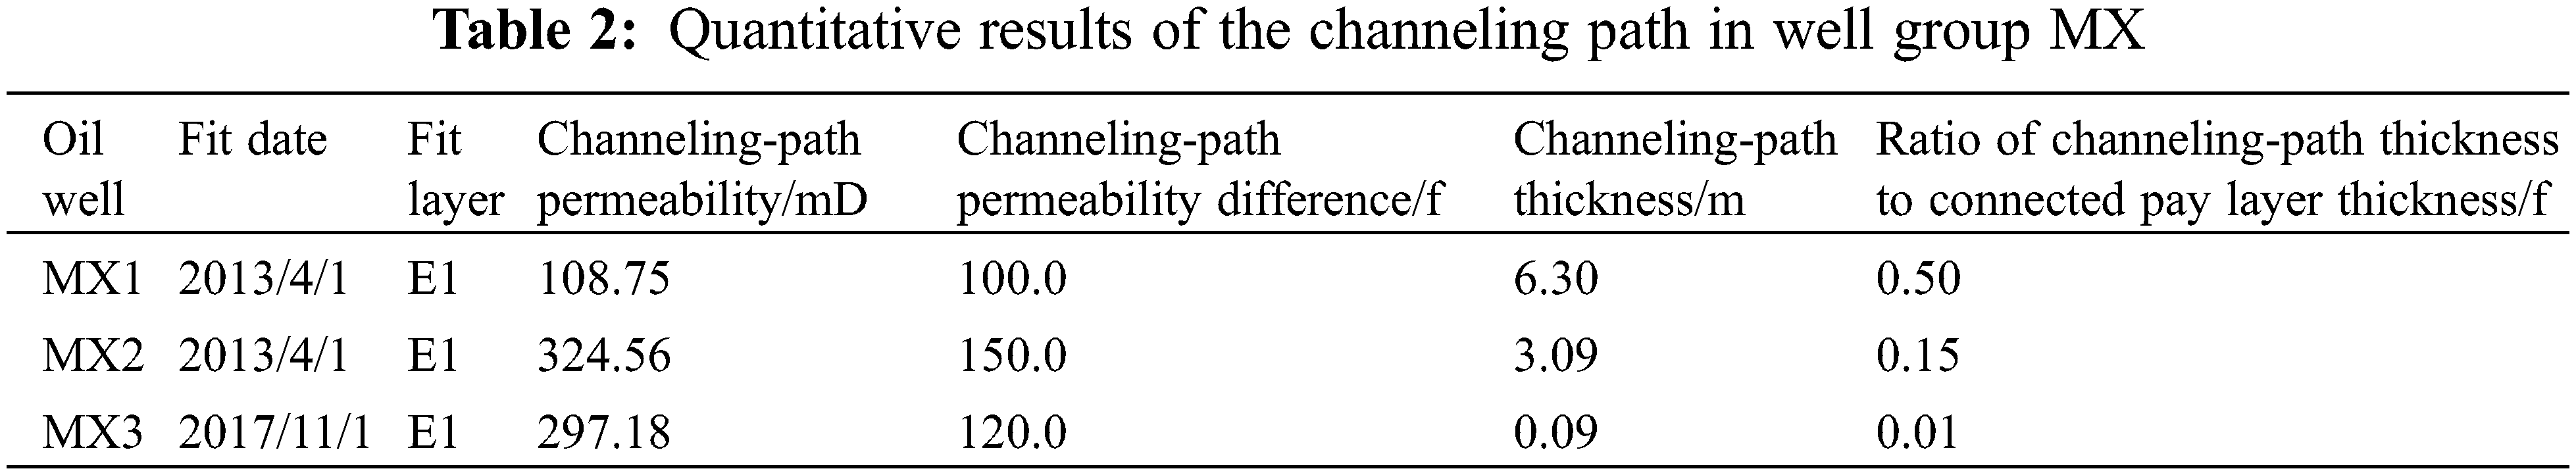
Through water-cut matching, we can determine that there are channeling paths between the injection and production wells in well group MX. The value ranges of the channeling channel quantification results in layer E1 of this well group are as follows: the permeability of the channeling path is 108–297 mD, the channeling path permeability difference is 100–150, the channeling path thickness is 0.1–6.3 m, and the ratio of the channeling path thickness to the connected pay layer thickness is 0.01–0.5.
Based on the quantitative results of the channeling path, the development of the channeling channel in the MX well group occurs as follows. There is a channeling channel between well MX and well MX1, the channeling channel is thicker, the permeability is lower, and the channeling channel development is relatively weak. There is a channeling channel between well MX and well MX2, the permeability and permeability of the channeling channel differ considerably, and the channeling channel is well developed. There is a channeling channel between well MX and well MX3. The thickness of the channeling channel is small, whereas the permeability is high; hence, the water flooding sweep speed is high and the development of the channeling channel is relatively strong.
In summary, the development degree of channeling channels between injection and production wells in well group MX is as follows: well MX2 (strongest), well MX3, and well MX1 (weakest).
4.2 Dynamic Inversion of the Reservoir Seepage Capacity between the Injection and Production Wells
Using the inversion method of the reservoir seepage capacity between the injection and production wells established in this study, and considering the actual reservoir parameters of well group MX as an example, the average permeability of the reservoirs between the injection and production wells of layers E1 and E2 was obtained. The inversion results are shown in Fig. 6.
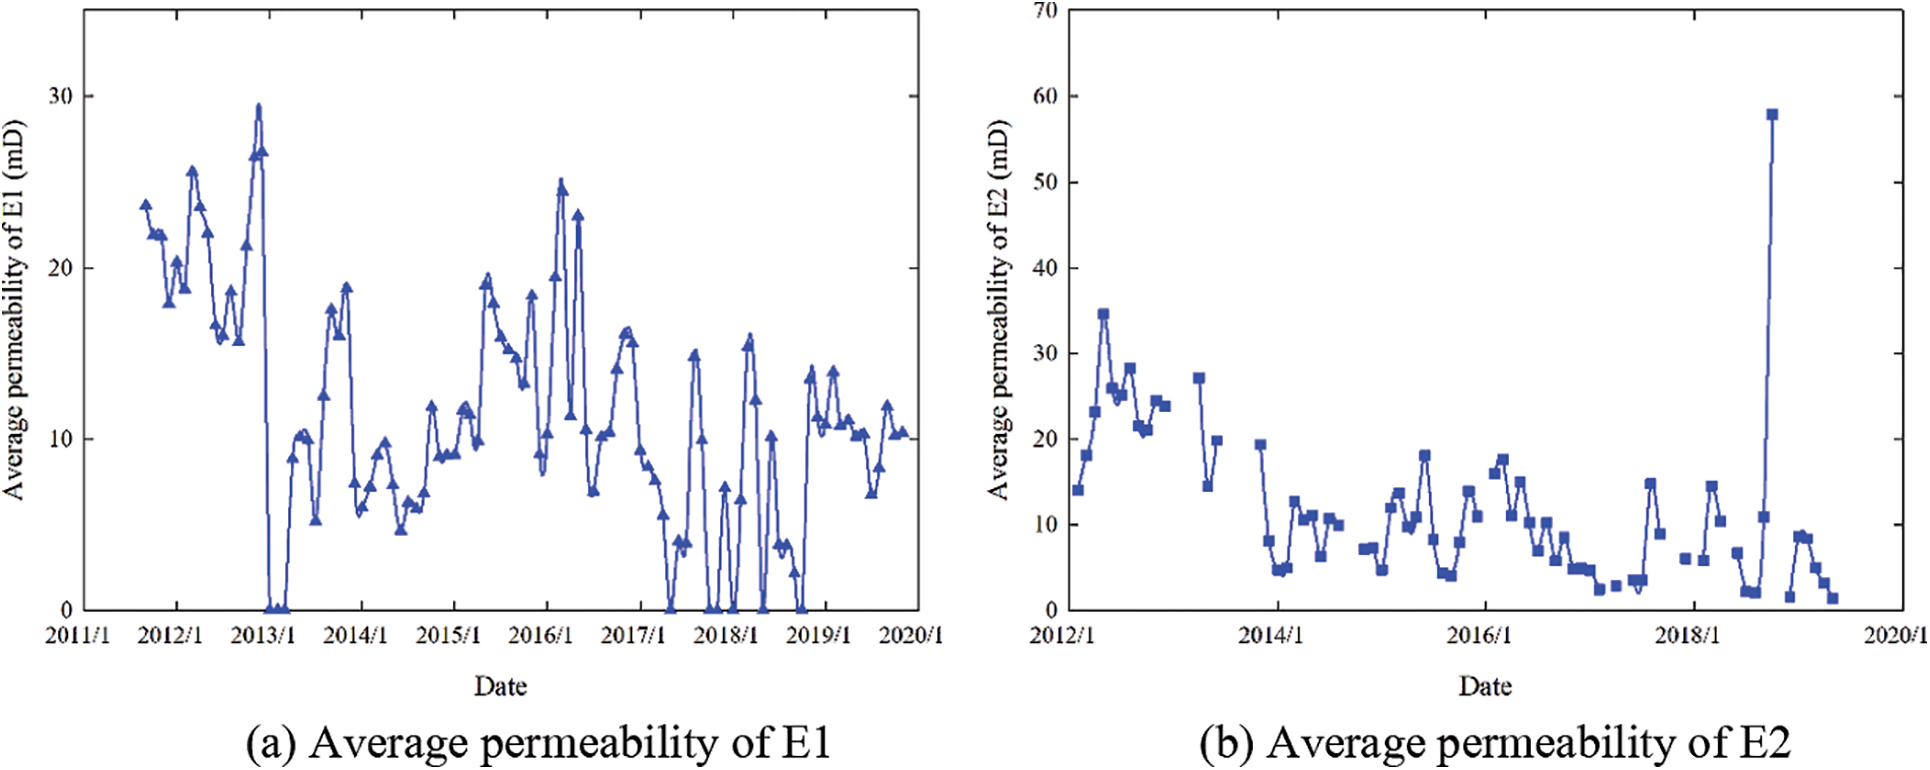
Figure 6: Inversion results of the average permeability of the reservoirs between the injection and production wells in well group MX
As can be seen from Fig. 6, the average permeability of the reservoirs between the injection and production wells of layers E1 and E2 does not differ significantly, whereas the variation law during the development period is significantly different. The average permeability of the reservoirs between the injection and production wells in layer E1 fluctuates significantly during the entire development period, and the fluctuation trend is dominated by a sudden increase in permeability, indicating that channeling channels may have been generated at this time. The average permeability of the reservoirs between the injection and production wells in layer E2 has a small fluctuation range during the entire development period, and the fluctuation trend is mainly characterized by a gradual decrease in permeability. Thus, the development of this interval is in accordance with the routine process, and it is less likely to generate larger channeling channels.
Comparing Fig. 6 and Table 2, we can see that the average permeability of the reservoirs between the injection and production wells obtained on the basis of the production performance inversion method is much smaller than the permeability of the channeling channel obtained on the basis of the water-cut fitting method. This is because the former is the inter-well permeability, which comprehensively reflects the seepage capacity of the reservoir in the developed and undeveloped parts of the channeling channel, whereas the latter is the near-well permeability, which only reflects the seepage capacity of the reservoir where the channeling channel is developed. There is a significant difference between the two values, indicating that there is a channeling channel between the injection and production wells of well group MX.
According to the dynamic inversion results of the average permeability of the reservoirs between the injection and production wells of well group MX, the relationship between the plane permeability heterogeneity coefficient and the longitudinal permeability heterogeneity coefficient with time can be obtained, as shown in Fig. 7.
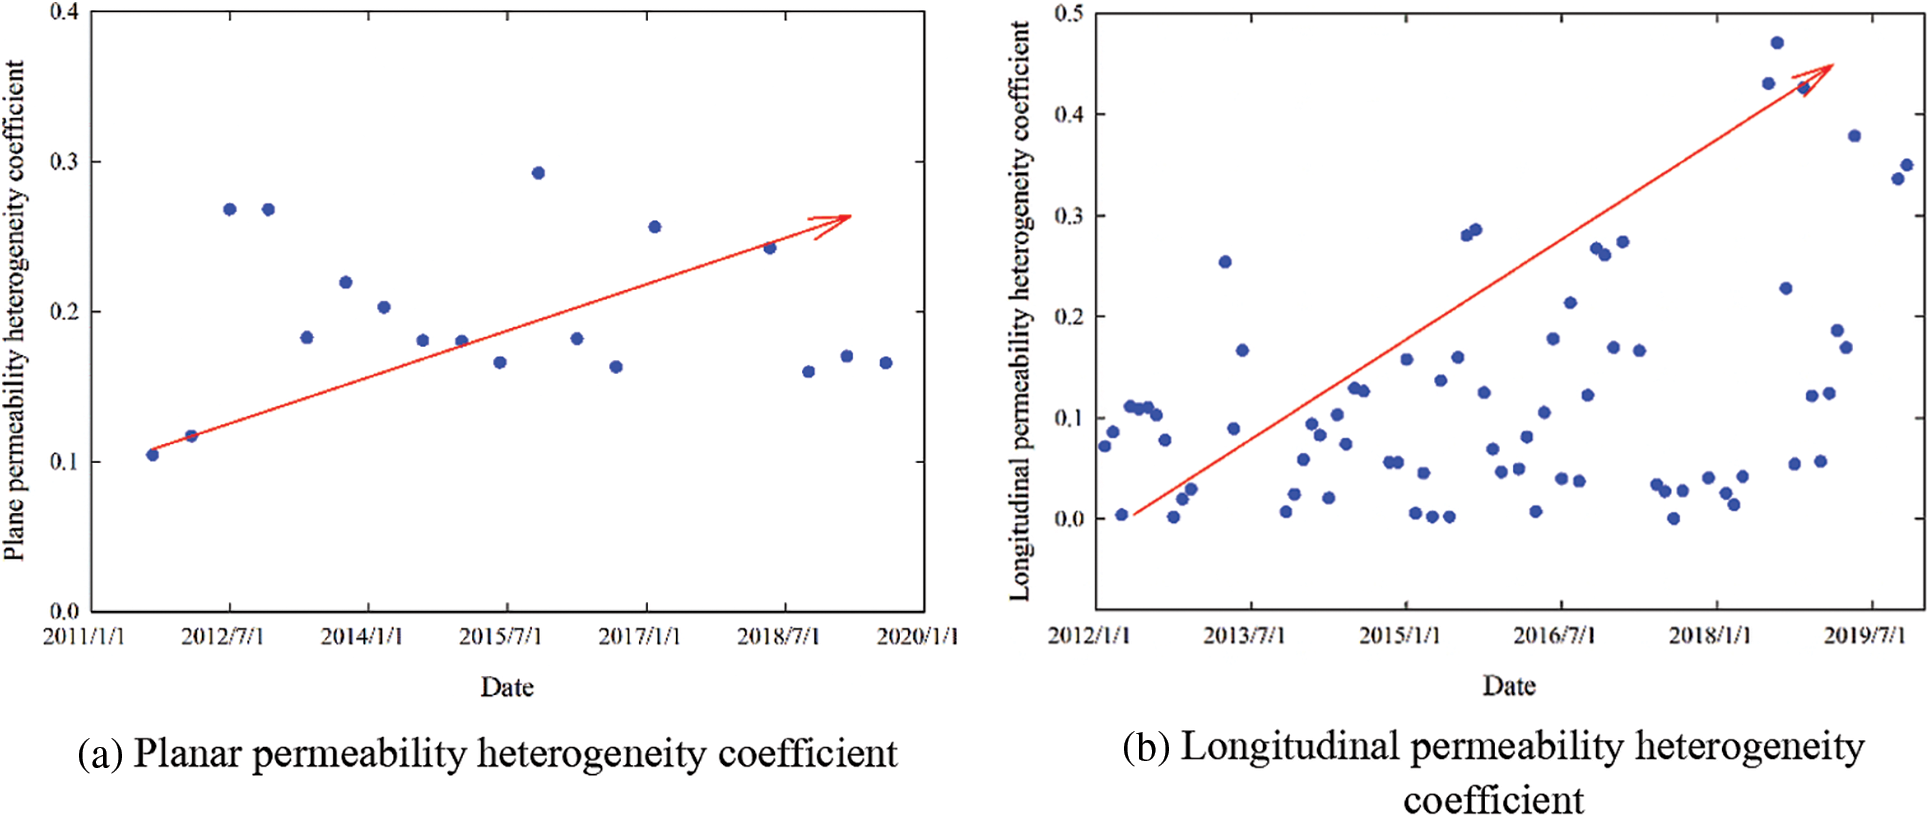
Figure 7: Calculation results of the permeability heterogeneity coefficient of fault block M
As can be seen from Fig. 7, the plane heterogeneity coefficient of well group MX is 0.1–0.33, and the longitudinal heterogeneity coefficient ranges from 0 to 0.48. During the production period, both the plane heterogeneity coefficient and the longitudinal heterogeneity coefficient gradually increase, as indicated by the arrows in Fig. 7. Thus, as the development progresses, the reservoir plane heterogeneity and vertical heterogeneity increase.
Furthermore, although the plane heterogeneity and vertical heterogeneity of the reservoir in well group MX show a gradually increasing trend, the enhancement degree of the longitudinal heterogeneity is significantly greater than that of the planar heterogeneity. Thus, the seepage capacity of the reservoirs between the injection and production wells is gradually enhanced with the development of the channeling channels; however, the main contribution is due to the vertical channeling channels during the development process. It can be seen that the channeling channels were initially generated in the layers. With the development of the reservoir, and owing to the longitudinal heterogeneity of the reservoir, the difference in the seepage capacity between the layers increased, resulting in the generation of new channeling channels that can be connected vertically between the layers.
4.3 Comparison of the Tracer Analysis Results
According to the analysis results of the development performance and characteristic parameters between the injection and production wells of well group MX, there may have been channeling channels in layer E1 since 2015; hence, tracer monitoring was carried out in 2019. The monitoring results showed that the average water flooding rate between the injection and production wells in layer E1 of well group MX was 2.7 m/d and the average agent breakthrough time was 107 d. Fig. 8 shows the distribution of tracers in layer E1 of well group MX.
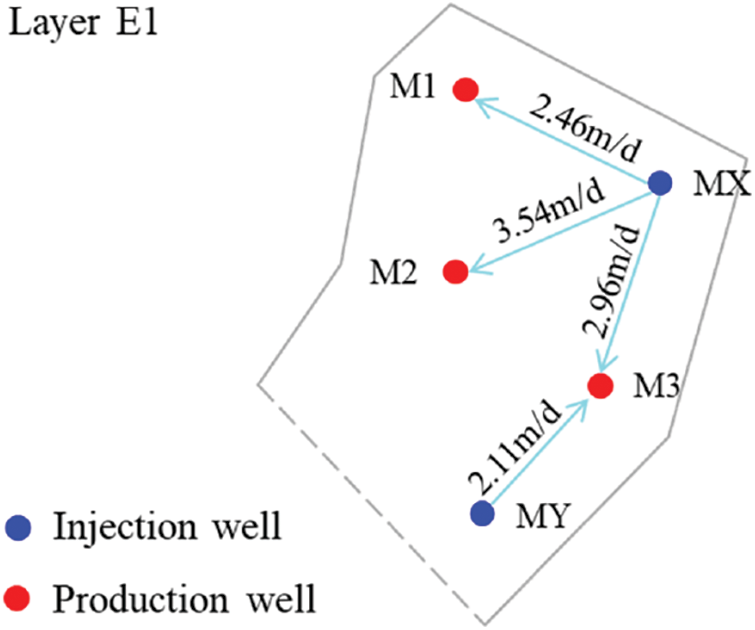
Figure 8: Distribution of tracers in layer E1 of well group MX
As can be seen from Fig. 8, the three production wells in well group MX have different degrees of water channeling. The agent penetration rate of well M1 is 2.46 m/d, whereas that of well M2 is 3.54 m/d. Well M3 is affected not only by injection well MX but also by injection well MY in the adjacent well group. The breakthrough velocity of the tracer from well MX was 2.96 m/d, whereas that from well MY was 2.11 m/d.
It can be seen that the degree of development of the channeling channels between the injection and production wells in well group MX is as follows: well MX2 (strongest), well MX3, and well MX1 (weakest). This conclusion is consistent with the results of the dynamic identification of the channeling channels obtained previously, which implies that the dynamic identification method for channeling channels established in this study has good reliability.
(1) Based on the reservoir production dynamic data, the dynamic identification of channeling paths was investigated by considering the influence of time and space. Considering the influence of space, the channeling path between the injection and production wells can be divided into two parts, i.e., near-well and between-well parts, and the permeability of the channel development part and other parts of the reservoir can be obtained, respectively. Considering the influence of time, the seepage capacity between the injection and production wells, which changes with time, can be obtained, and a comprehensive understanding of the development and changes of channeling channels can be gained.
(2) Based on the method of quantifying the characteristic parameters of the channeling path according to the theory of mass transfer and diffusion, quantitative characterization of the characteristic parameters of the channeling channel in the near-wellbore zone was realized by fitting the water cut of the production well. Based on Darcy’s formula and the potential superposition principle, the average permeability between the injection and production wells was inverted on the basis of the production dynamic response relationship between the oil and water wells in order to realize real-time characterization and quantitative evaluation of the seepage capacity between the injection and production wells under the influence of the channeling channels.
(3) Considering well group MX of fault block M in the typical “three highs and two lows” complex fault-block reservoirs in Jidong Oilfield as an example, first, through analysis of the development performance and characteristic parameters, we preliminarily judged that well group MX has inter-well channeling channels in layer E1. Then, the channeling channel dynamic identification method was used to obtain the channeling channel characteristic parameters and the average permeability of the reservoirs between the injection and production wells. The degree of development of the channeling channels was obtained as follows: well MX2 (strongest), well MX3, and well MX1 (weakest). This conclusion is consistent with the tracer monitoring results.
(4) Research on the dynamic identification method for channeling channels showed that the seepage capacity of the reservoirs between the injection and production wells is much smaller than that of the channeling channel, and the significant difference between the two values is a powerful basis for judging the existence of channeling channels between the injection and production wells. For lithologic reservoirs with strong intra-layer and inter-layer heterogeneity, the channeling channels are initially produced in the inter-layer region, and as the development progresses, the difference in the seepage capacity between the layers increases, resulting in inter-layer flow. New channeling channels are created, and they can communicate longitudinally.
Acknowledgement: All authors contributed to the conception and design of the study, interpretation of data, and preparation of the article. All authors have given approval to the final version of the manuscript.
Funding Statement: This work was supported by Bohai Oilfield Efficient Development Demonstration Project (2016ZX05058-003-011).
Conflicts of Interest: The authors declare that they have no conflicts of interest to report regarding the present study.
References
1. Gong, J. J., Tang, X. Y., Li, B. W., Li, H. D., Liu, Y. P. (2014). Quantitative description and simulation of preferential migration passage in loose sandstone reservoir. Petroleum Geology and Engineering, 28(3), 88–91. [Google Scholar]
2. Wang, P. F., Zhang, X. Y. (2022). Experimental study on seepage characteristics of a soil-rock mixture in a fault zone. Fluid Dynamics & Materials Processing, 18(2), 271–283. DOI 10.32604/fdmp.2022.017882. [Google Scholar] [CrossRef]
3. Lu, X., Wang, Y., Tian, F. (2017). New insights into the carbonate karstic fault system and reservoir formation in the Southern Tahe area of the Tarim Basin. Marine and Petroleum Geology, 86(9), 587–605. DOI 10.1016/j.marpetgeo.2017.06.023. [Google Scholar] [CrossRef]
4. Wang, N. (2017). Application of tracer monitoring technology in oil-field adjustment. Chemical Enterprise Management, 5, 25. [Google Scholar]
5. Li, S. Q. (2013). Investigation and application of integration approaches for thief zone identification (Master Thesis). China: China University of Petroleum (East China). [Google Scholar]
6. Lei, X. L. (2018). Studying the advantage channels of water flooding reservoir by using reservoir engineering methods (Master Thesis). China: China University of Petroleum (Beijing). [Google Scholar]
7. Guo, T. K., Luo, Z. L., Mou, S. B., Chen, M., Gong, Y. Z. et al. (2022). Numerical simulation of prop pant dynamics in a rough inclined fracture. Fluid Dynamics & Materials Processing, 18(2), 431–447. DOI 10.32604/fdmp.2022.017861. [Google Scholar] [CrossRef]
8. Huang, B., Sun, X. W., Hu, Y. P., Sun, H. P., Liu, D. D. (2019). A fast comprehensive identification method for channeling channel. Chemical Engineering & Equipment, 1, 28–29. DOI 10.19566/j.cnki.cn35-1285/tq.2019.01.011. [Google Scholar] [CrossRef]
9. Zhang, Y. P., Yang, Z. M., Li, D. J., Liu, X. W., Zhao, X. L. (2021). On the development of an effective pressure driving system for ultra-low permeability reservoirs. Fluid Dynamics & Materials Processing, 17(5), 1067–1075. DOI 10.32604/fdmp.2021.016725. [Google Scholar] [CrossRef]
10. Sun, M., Li, Z. P. (2009). Identification and description of preferential percolation path for water flooding. Fault-Block Oil & Gas Field, 16(3), 50–52. [Google Scholar]
11. Li, C. L. (2021). Study on fine identification method of flooding channeling channel in low permeability fractured reservoir. Journal of Petrochemical Universities, 34(3), 38–44. [Google Scholar]
12. Shen, W. J., Zhao, H., Liu, W., Xu, L. F., Liao, M. L. (2018). Identification method of dominant channeling in fractured muggy carbonate reservoir based on connectivity model. Fault-Block Oil & Gas Field, 25(4), 459–463. [Google Scholar]
13. Feng, Y. L., Liu, Y. T., Chen, J., Mao, X. L. (2022). Simulation of the pressure-sensitive seepage fracture network in oil reservoirs with multi-group fractures. Fluid Dynamics & Materials Processing, 18(2), 395–415. DOI 10.32604/fdmp.2022.018141. [Google Scholar] [CrossRef]
14. Jiang, H. Q. (2000). Principle and method of reservoir engineering (Master Thesis). China: China University of Petroleum (East China). [Google Scholar]
15. Wang, L. S., Guan, Y., Liu, C. J., Jin, Y. X., Shi, S. B. (2013). A method of describing preferential flowing path by reservoir engineering principles. Science Technology and Engineering, 13(5), 1155–1159. [Google Scholar]
16. You, Z., Badalyan, A., Bedrikovetsky, P. (2013). Size-exclusion colloidal transport in porous media-stochastic modeling and experimental study. SPE Journal, 18(4), 620–633. DOI 10.2118/162941-PA. [Google Scholar] [CrossRef]
17. Guan, C., Shi, C. F., Wang, M. C. (2015). Quantitative characterization of the invalid water cycle’s formation time in high water cut stage. Science Technology and Engineering, 15(31), 188–193. [Google Scholar]
18. Oliveira, M. A., Alexandre, S. L. V., Fernando, D. S., Yang, Y. L., You, Z. J. et al. (2014). Slow migration of mobilized fines during flow in reservoir rocks: Laboratory study. Journal of Petroleum Science and Engineering, 122(1), 534–541. DOI 10.1016/j.petrol.2014.08.019. [Google Scholar] [CrossRef]
19. Zeinijahromi, A., Ai-Jassasi, H., Begg, S., Bedrikovetski, P. (2015). Improving sweep efficiency of edge-water drive reservoirs using induced formation damage. Journal of Petroleum Science and Engineering, 130, 123–129. DOI 10.1016/j.petrol.2015.04.008. [Google Scholar] [CrossRef]
20. Suri, Y., Islam, S. Z., Stephen, K., Donald, C., Thompson, M. et al. (2020). Numerical fluid flow modelling in multiple fractured porous reservoirs. Fluid Dynamics & Materials Processing, 16(2), 245–266. [Google Scholar]
21. Li, C. L., Han, H. (2018). Gray fuzzy comprehensive evaluation method was used to identify the channel of CO2 gas channeling at the initial stage of gas injection. Daqing Petroleum Geology and Development, 37(6), 117–120. DOI 10.19597/j.issn.1000-3754.201801094. [Google Scholar] [CrossRef]
22. Ding, S. W., Yi, X., Jiang, H. Q. (2017). quantitative identification method of injection production dominant channel in a marine sandstone reservoir. The International Field Exploration and Development Conference (IFEDC), pp. 704–727. [Google Scholar]
23. Sun, Z. X., Yang, X. G., Wang, X. G., Tan, T., Feng, J. W. (2021). Identification method of karst channels in fracture-cavity reservoirs based on frequency domain analysis. Petroleum Geology and Recovery Efficiency, 28(1), 57–63. DOI 10.13673/j.cnki.cn37-1359/te.2021.01.007. [Google Scholar] [CrossRef]
24. Ding, S. W., Jiang, H. Q., Zhao, J., Li, J. J., Zhou, D. Y. (2015). General description of preferential migration passage in water-flood sandstone reservoir. Petroleum Geology and Engineering, 29(5), 132–136. [Google Scholar]
25. Chen, C. L., Niu, W., Guo, L. F., Wang, Z., Li, J. X. (2014). Characterization of thief zones using interwell dynamic connectivity in low permeability reservoir. Science Technology and Engineering, 14(26), 41–44. [Google Scholar]
26. Zheng, Q., Liu, H. Q. (2012). Calculating the interwell connected volume in water flooding reservoirs. Science Technology and Engineering, 12(28), 7194–7197. [Google Scholar]
27. Zheng, Q., Liu, H. Q., Li, F., Zhang, J., Zhang, B. (2012). Quantitative identification of breakthrough channel in water flooding reservoirs at later stage. Petroleum Drilling Techniques, 40(4), 92–95. [Google Scholar]
28. Liu, Y. G., Wang, C. J., Meng, X. H., Zhang, Y. B., Li, Y. Y. (2017). Quantitative method of channeling-path by diffusion theory in high permeability reservoir. Oil Drilling & Production Technology, 39(4), 393–398. DOI 10.13639/j.odpt.2017.04.001. [Google Scholar] [CrossRef]
29. Liu, T. J., Diwu, P. X., Zhao, X. S., Hu, G. X. (2020). Dynamic inversion method of percolation characteristic parameters after gas injection in tight reservoirs. Petroleum Geology and Recovery Efficiency, 27(1), 93–100. DOI 10.13673/j.cnki.cn37-1359/te.2020.01.014. [Google Scholar] [CrossRef]
30. Zhang, S. M. (2020). Study on identification method for gas channeling of CO2 flooding in low permeability reservoirs. Petroleum Geology and Recovery Efficiency, 27(1), 101–106. DOI 10.13673/j.cnki.cn37-1359/te.2020.01.015. [Google Scholar] [CrossRef]
Cite This Article
 Copyright © 2023 The Author(s). Published by Tech Science Press.
This work is licensed under a Creative Commons Attribution 4.0 International License , which permits unrestricted use, distribution, and reproduction in any medium, provided the original work is properly cited.
 Downloads
 Citation Tools