
 Submit a Paper
 Propose a Special lssue
 Open Access
ARTICLE
Tubing Dimension Optimization for the Development of an Offshore Gasfield
1 Zhanjiang Branch Company, CNOOC, Zhanjiang, 524057, China
2 School of Petroleum Engineering, China University of Petroleum (East China), Qingdao, 266580, China
* Corresponding Author: Rui Zhang. Email:
Fluid Dynamics & Materials Processing 2023, 19(2), 315-327. https://doi.org/10.32604/fdmp.2022.020221
Received 12 November 2021; Accepted 25 April 2022; Issue published 29 August 2022
 View Full Text
 Download PDF
Abstract
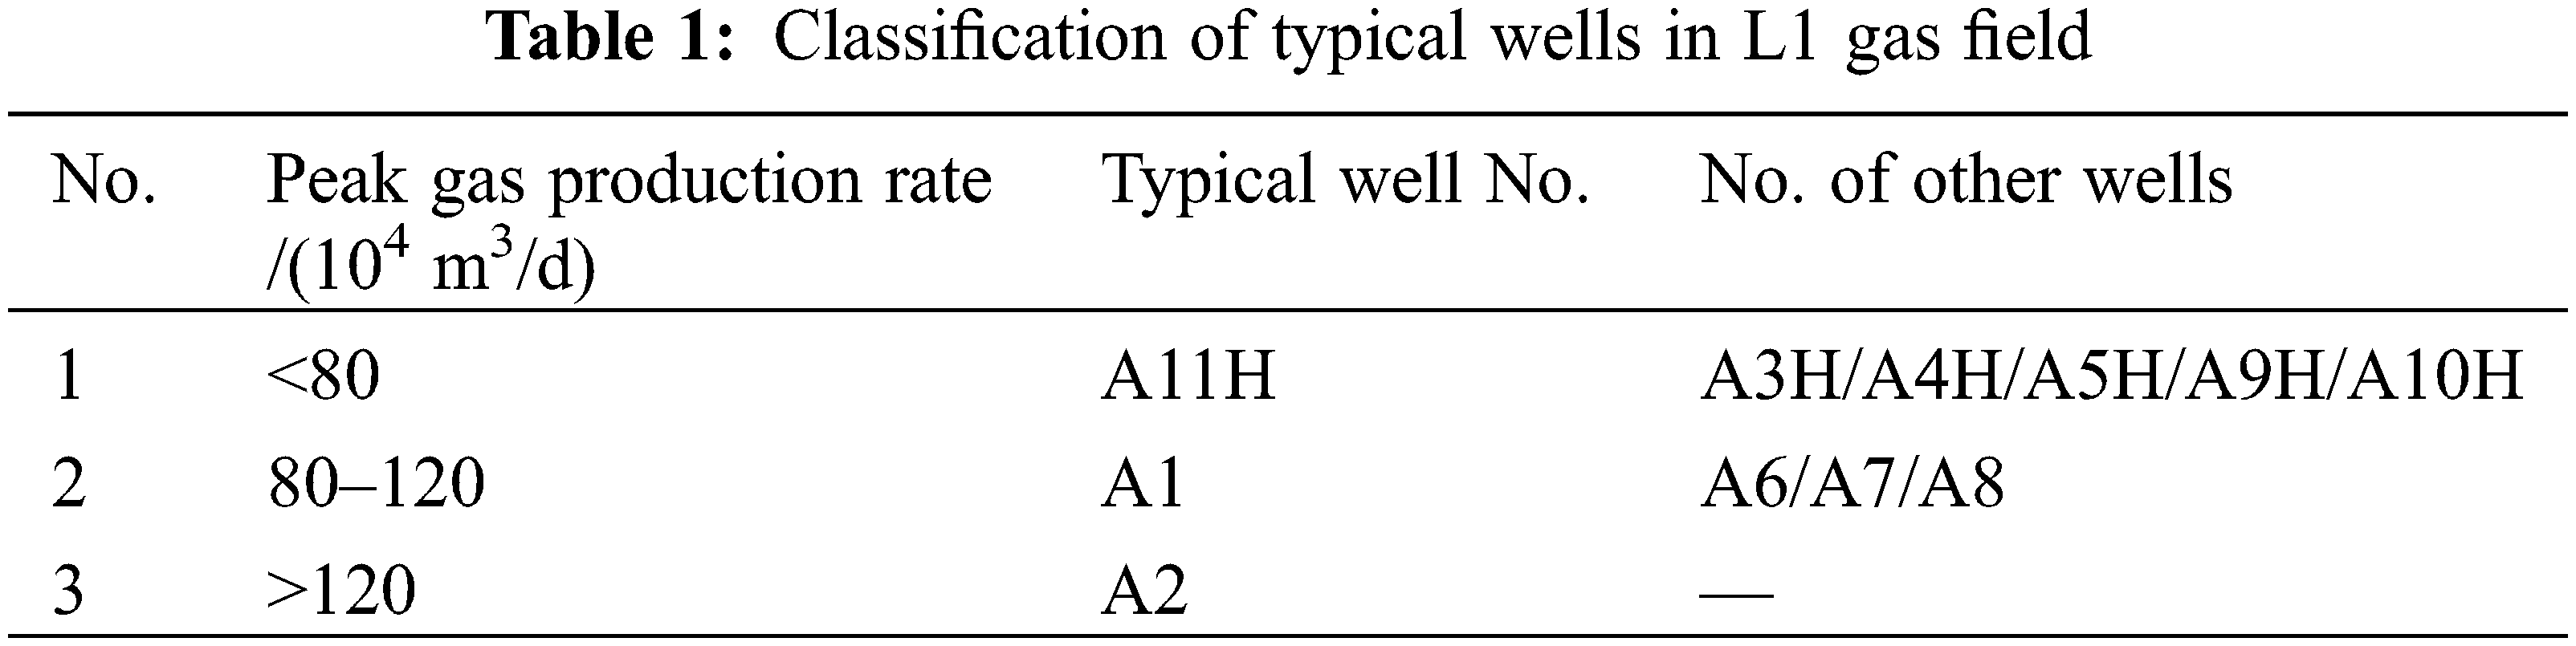
L1 is one of the largest offshore gas fields currently under development. In order to optimize the related design, nodal analysis is applied (including proper consideration of the plant productivity, sensitivity to the tubing size, erosion effects, liquid carrying performance, and tubing string). As a result of such approach, it is shown that 13Cr material should be chosen as the appropriate tubing material. Moreover, 3-1/2 inches 9.3 lb/ft N80 tubing, 4-1/2 inches 12.75 lb/ft N80 tubing, 5-1/2 inches 17 lb/ft N80 tubing should be used for a gas production rate under 80 × 104 m3/d, between 80 × 104 m3/d and 120 × 104 m3/d and above 120 × 104 m3/d, respectively.Keywords
With the rapid development of science and technology. Great breakthroughs have been made in petroleum exploration and development during the past years. Offshore oil and gas resources have gained more and more attention all around the globe. For an offshore oil or gas field, the high production rate, long-lasting production period and bad working environment are their common characteristics. Moreover, as the depletion drive diminishes, the flow conditions of a gas well are changing continuously. All these factors may bring higher challenges to well bore integrity than that of onshore development. As one of the most important indicators of well bore integrity, the adaptability of completion string should be strictly qualified. As the first state-owned deep water gas field, L1 gas field bears our hope of self-sufficiency in petroleum resources.
At present, the optimization of tubing is mainly based on subjective experience analysis and nodal analysis method [1], analyzing the influence of different factors according to different regions and environments [2–8]. Completion string design was performed for DF gasfield by Wen et al. with an emphasis on the influence of high-pressure and high-temperature effects [9]. Stresses on completion string were analyzed by Sun et al. [10] under the condition of high annulus pressure and the equivalent stresses on completion string were calculated with the finite element method. Material selection chart and nodal analysis method were applied to BH oilfield by Gong et al. [11] to determine the optimum tubing properties. However, the selection of tubing is a systematic and complicated evaluation process, using empirical analysis only cannot take all factors into account, and there is no in-depth research on tubing size, corrosion effect and other factors. Therefore, it is necessary to establish a more systematic and scientific tubing optimization method for offshore oil and gas fields according to the special offshore environmental characteristics. The method should comprehensively consider the influence of various factors, so as to achieve the goal of cost reduction and efficiency increase.
Aiming at the challenges of offshore gas field development, this paper, on the basis of previous studies, comprehensively considers the factory capacity, tubing size sensitivity, erosion effect, liquid-carrying performance and the influence of tubing string [12], nodal analysis method is applied to determine the optimum completion tubing size. A reliable conclusion can be drawn by using the method above, it is that whether one tubing size can serve the life of the well or a size change is recommended in a later time. The field application in L1 gas field proves the effectiveness of this method in reducing investment and improving efficiency [13]. This paper introduces the design and application of completion string in this gas field in detail.
Water depth is 1220–1560 m and the average air temperature is 26.2°C. The surface water temperature is 17°C–29°C and the near-bottom water temperature is 2°C–3.5°C.
The reservoir temperature is 92.9°C, and the geothermal gradient is 3.87°C/100 m. The pressure coefficient is 1.19–1.21, and the reservoir pressure is 39.0–40.3 MPa, both of which belong to a normal pressure system.
Hydrocarbon content is 98.2%–99.52%, CO2 content is 0.18%–1.72% and hydrogen sulfide is not contained. The relative density of natural gas is 0.622.
(1) The reservoir allocation requirements can be met under the given surface engineering conditions.
(2) No tubing erosion occurs within the given production period.
(3) The gas slippage and friction loss should be reduced and the liquid is carried by full using the energy of the gas well itself.
(4) The material and wall thickness should be selected from the economic and safe perspective, and favor the field operation.
Based on the calculation, the differential pressure of CO2 is 0.08–0.69 MPa and the highest reservoir temperature is 92.9°C. H2S is not contained in the gas composition, hence, preventive measures against H2S are not considered. Following the recommended practices for tubing and casing material selection chart of CNOOC and to minimize the frequency of workover in the later stage, 13Cr is selected as the material of tubing.
The determination of tubing size involves several indicators such as reservoir properties, production details, completion string requirement, and even the on-site availability of tubing. Specific steps include productivity analysis and sensitivity analysis, and then erosion and liquid carrying capacity analysis should be performed. For the details of productivity and sensitivity analysis processes, refer to Well-completion design [1].
There are a total of 11 gas wells in the L1 gas field. According to the gas production profiles (Fig. 1), the maximum gas production for a single well is 203 × 104 m3/d; in the later stage, the gas production for a single well is within 15 × 104 m3/d. Based on the range of the gas production rate, 11 gas wells are divided into three types (Table 1). As the production speed and bottom hole pressure are the main basis of tubing size selection. Under the condition that a certain wellhead pressure is met, small-sized tubing is preferred.
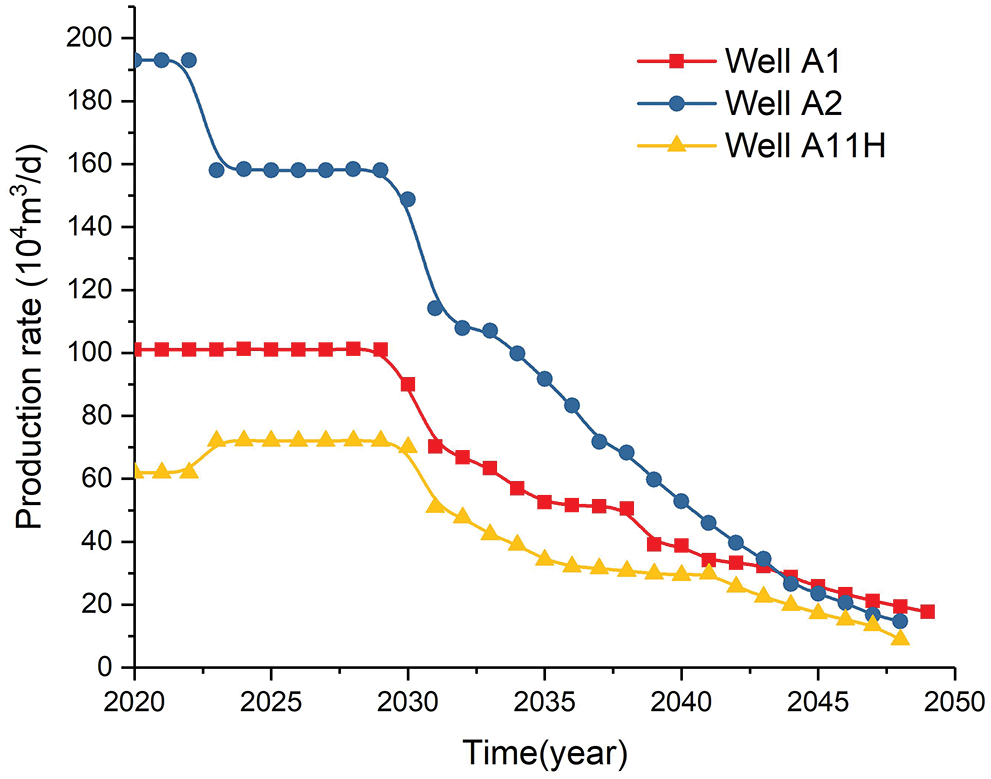
Figure 1: Gas production prediction of typical wells
3.3.2 Sensitivity Analysis of Tubing Size
In accordance with the tubing size recommended by Offshore Well Completion, the 2-7/8″ tubing is applicable for the maximum gas production of 70 × 104 m3/d, while the 3-1/2″ tubing is applicable for the maximum gas production of 110 × 104 m3/d. First, the required tubing sizes are calculated according to the production rate. Then, based on the calculation results of production rate, erosion rate, and critical liquid carrying flow rate, the optimal tubing sizes are selected.
According to the calculation of wellhead pressure in three typical wells (A1, A2, and A11H) using different tubing sizes (Fig. 2), for A1 which has the peak gas production of about 105 × 104 m3, natural flow to the wellhead cannot be realized during 2030–2035 by using 3-1/2″ tubing, and the wellhead pressure cannot be met during most of the production years, while the wellhead pressure can be met using 4-1/2″ and 5-1/2″ tubing. For A2 which has the peak gas production of about 203 × 104 m3, the wellhead pressure cannot be met in some years when 4-1/2″ tubing is used, but the wellhead pressure in the whole production period can be met when 5-1/2″ tubing is used. For A11H which has the peak gas production of about 72 × 104 m3, natural flow to the wellhead can not be realized during 2030–2037 by using 2-7/8″ tubing, while the wellhead pressure can be met in the whole production period when 3-1/2″ tubing is used. The sensitivity analysis of tubing sizes for 11 wells indicates that the tubing with the size of 3-1/2″ and above used for the gas wells with daily gas production lower than 80 × 104 m3 can meet the wellhead pressure required; the tubing with the size of 4-1/2″ and above used for the gas wells with daily gas production between 80 × 104 m3 and 120 × 104 m3 can meet the wellhead pressure required; the tubing with the size of 5-1/2″ and above used for the gas wells with daily gas production higher than 120 × 104 m3 can meet the wellhead pressure required.
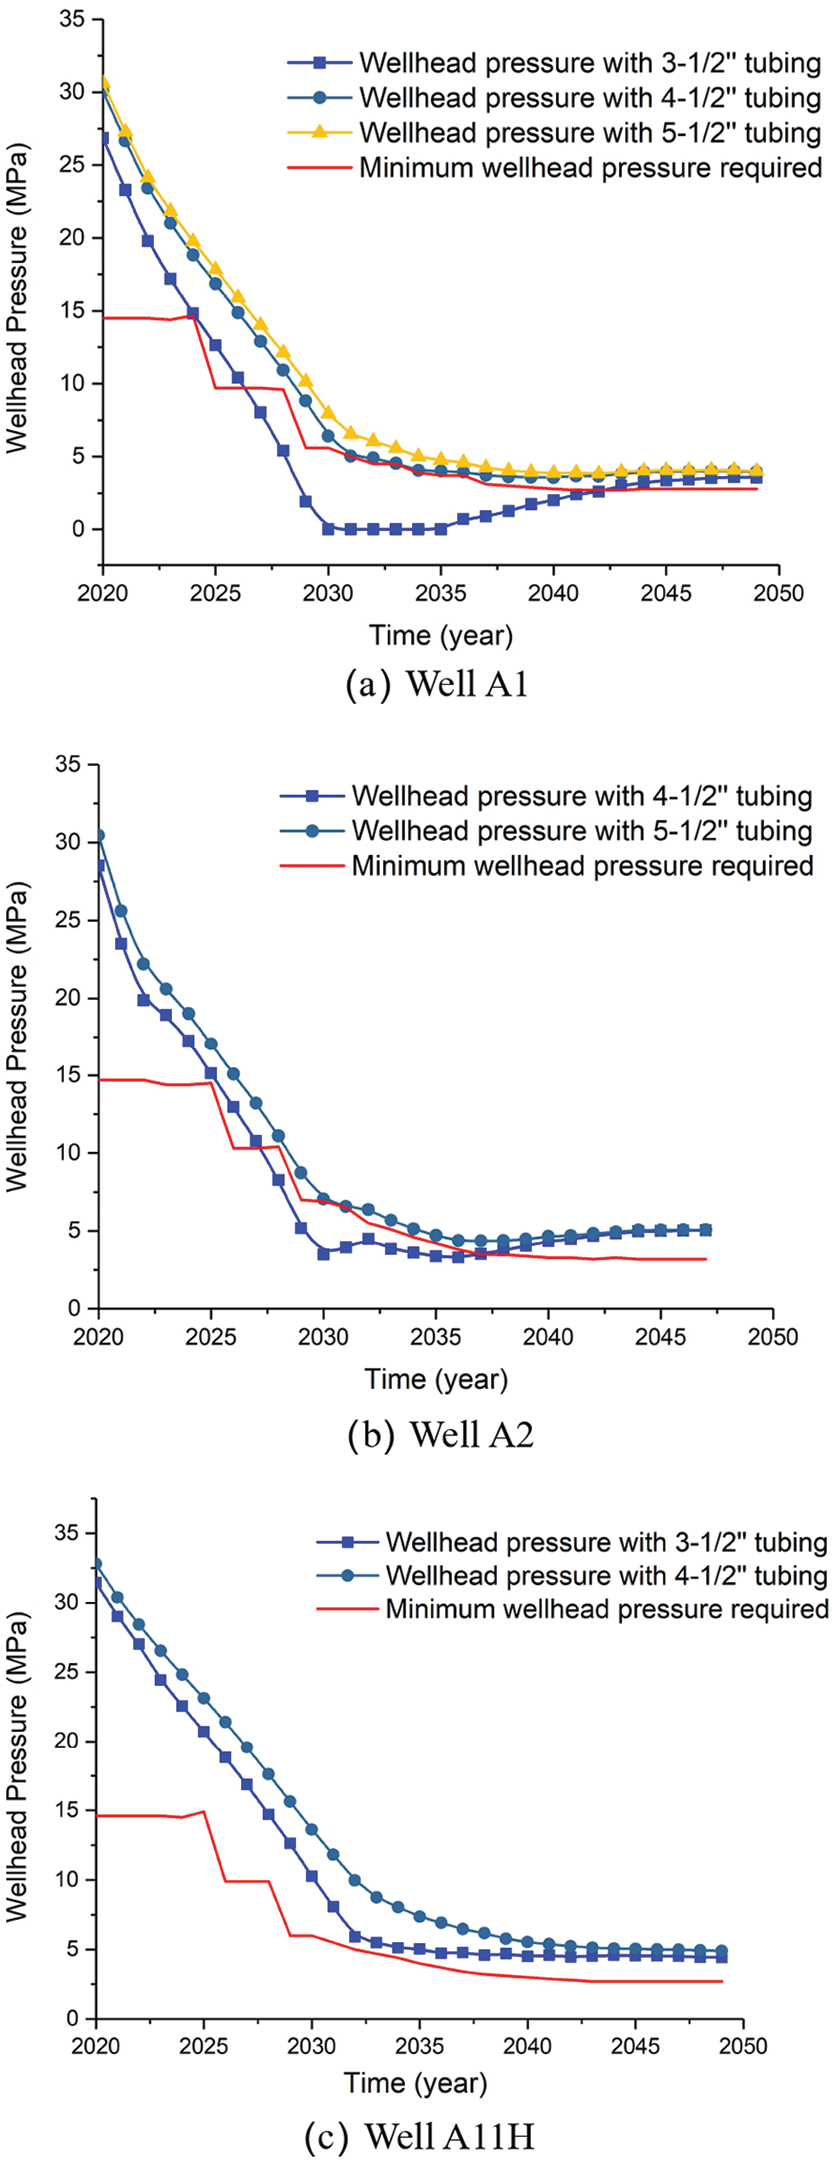
Figure 2: Wellhead pressure prediction of typical wells
Erosion velocity is one of the important factors affecting the security of tubing. When the fluid passes through the tubing quickly, erosion occurs [14–16]. This phenomenon is especially outstanding when the gas production is huge and the flow rate is more than 60–70 ft/s. Gas erosion velocity may be calculated by using PipeSim software and the calculation equation is as follows [17,18]:
where, Ve-erosion velocity, ft/s;
K-empirical coefficient.
On the premise that there are no solid particles in the wellbore, and the anti-corrosion requirements are met, when the gas well is in continuous production, the K value is taken as 150–200. When the gas well is in intermittent production, the K value is taken as 250 [19,20]. Considering that high-grade anti-corrosion material has been used for the tubing of various wells in L1 gas field to control corrosion and conservative and reliable sand control methods are used for continuous production, Therefore, K value is recommended as 200.
Erosion velocity ratio is the ratio between critical erosion velocity and actual velocity. If the ratio is more than 1, erosion will occur. If the ratio is less than 1, erosion will not occur [21,22]. The erosion calculation results are shown in Fig. 3. It can be seen that the erosion will not happen to the tubing with selected sizes based on the present reservoir index.
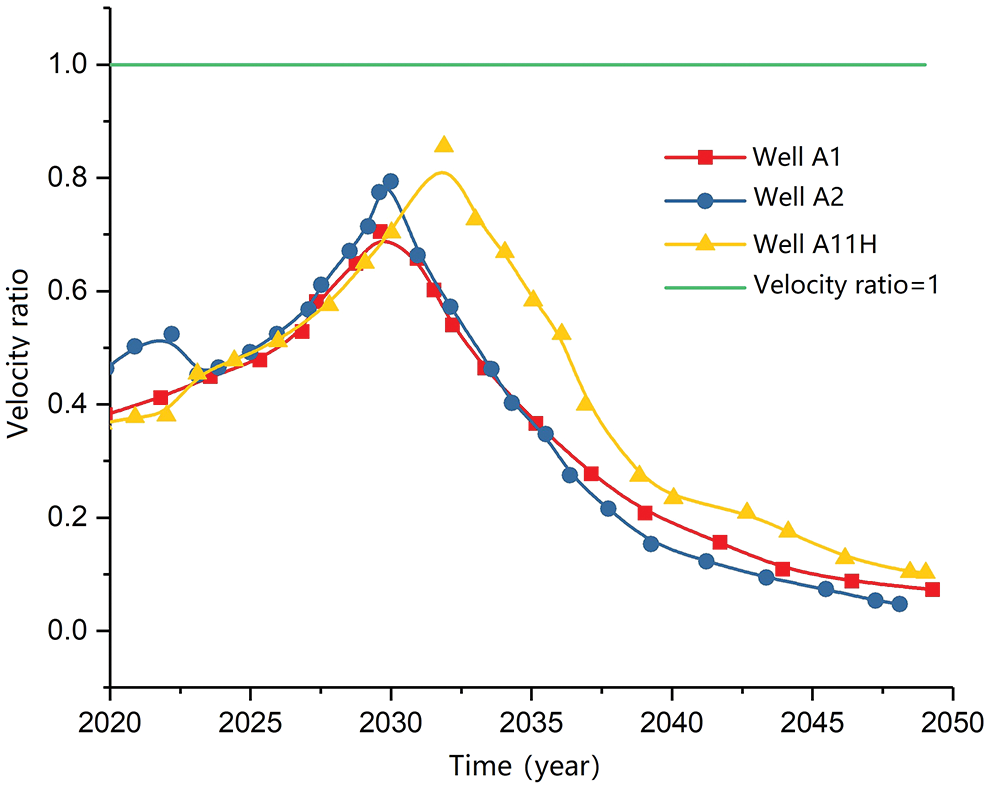
Figure 3: Tubing erosion calibration
3.3.4 Calculation for Liquid Carrying
There are two kinds of liquid sources for the gas wells of L1 gas fields. One is the free water and hydrocarbon condensate liquid in the formation. The other is the condensate water which occurs in the wellbore due to the temperature drop of the natural gas containing water vapor in the formation for the heat loss. When the gas production is low, the velocity of the gas phase cannot make the liquid in the wellbore continuously flow out of the wellhead, and then liquid loading will occur in the gas well. At this moment, the minimum flow rate of the gas is defined as the critical liquid carrying flow rate of the gas wells and the corresponding flow rate is the critical liquid carrying flow rate for the gas wells [23,24].
The minimum flow rate and the critical liquid carrying flow rate are calculated by using PipeSim software and the Turner model (1969) [25]. The calculation equation for the critical liquid carrying flow rate is as follows:
where, ρg-gas density (lbm/ft3);
ρL-liquid density (lbm/ft3);
σ-interfacial tension (dynes/cm);
vt-critical flow rate (ft/s);
E-correction coefficient, 1.2 is recommended by the software.
The critical liquid carrying flow rate ratio is the ratio between the critical liquid carrying flow rate and the actual velocity. If the ratio is more than 1, the liquid loading will occur. If the ratio is less than 1, the liquid loading will not occur. The liquid carrying calculation results for the typical wells are shown in Fig. 4. It can be seen that if the tubing with the size of 4-1/2″ and below are used for A1, no liquid loading risk will occur in the wellbore within the production life; but if the tubing with the size of 5-1/2″ is used for A1, the liquid loading risk will occur in the later stage of production. As for A2, if the tubing with the size of 3-1/2″ is used, no liquid loading risk will occur; if the tubings with the sizes of 4-1/2″ and 5-1/2″ are used, the liquid loading risk will occur in the last 2–4 years. As for A11H, if the tubings with the size of 3-1/2″ and below are used, no liquid loading risk will occur; if the tubings with the sizes of 4-1/2″ are used, the liquid loading risk will occur in the last 3 years.
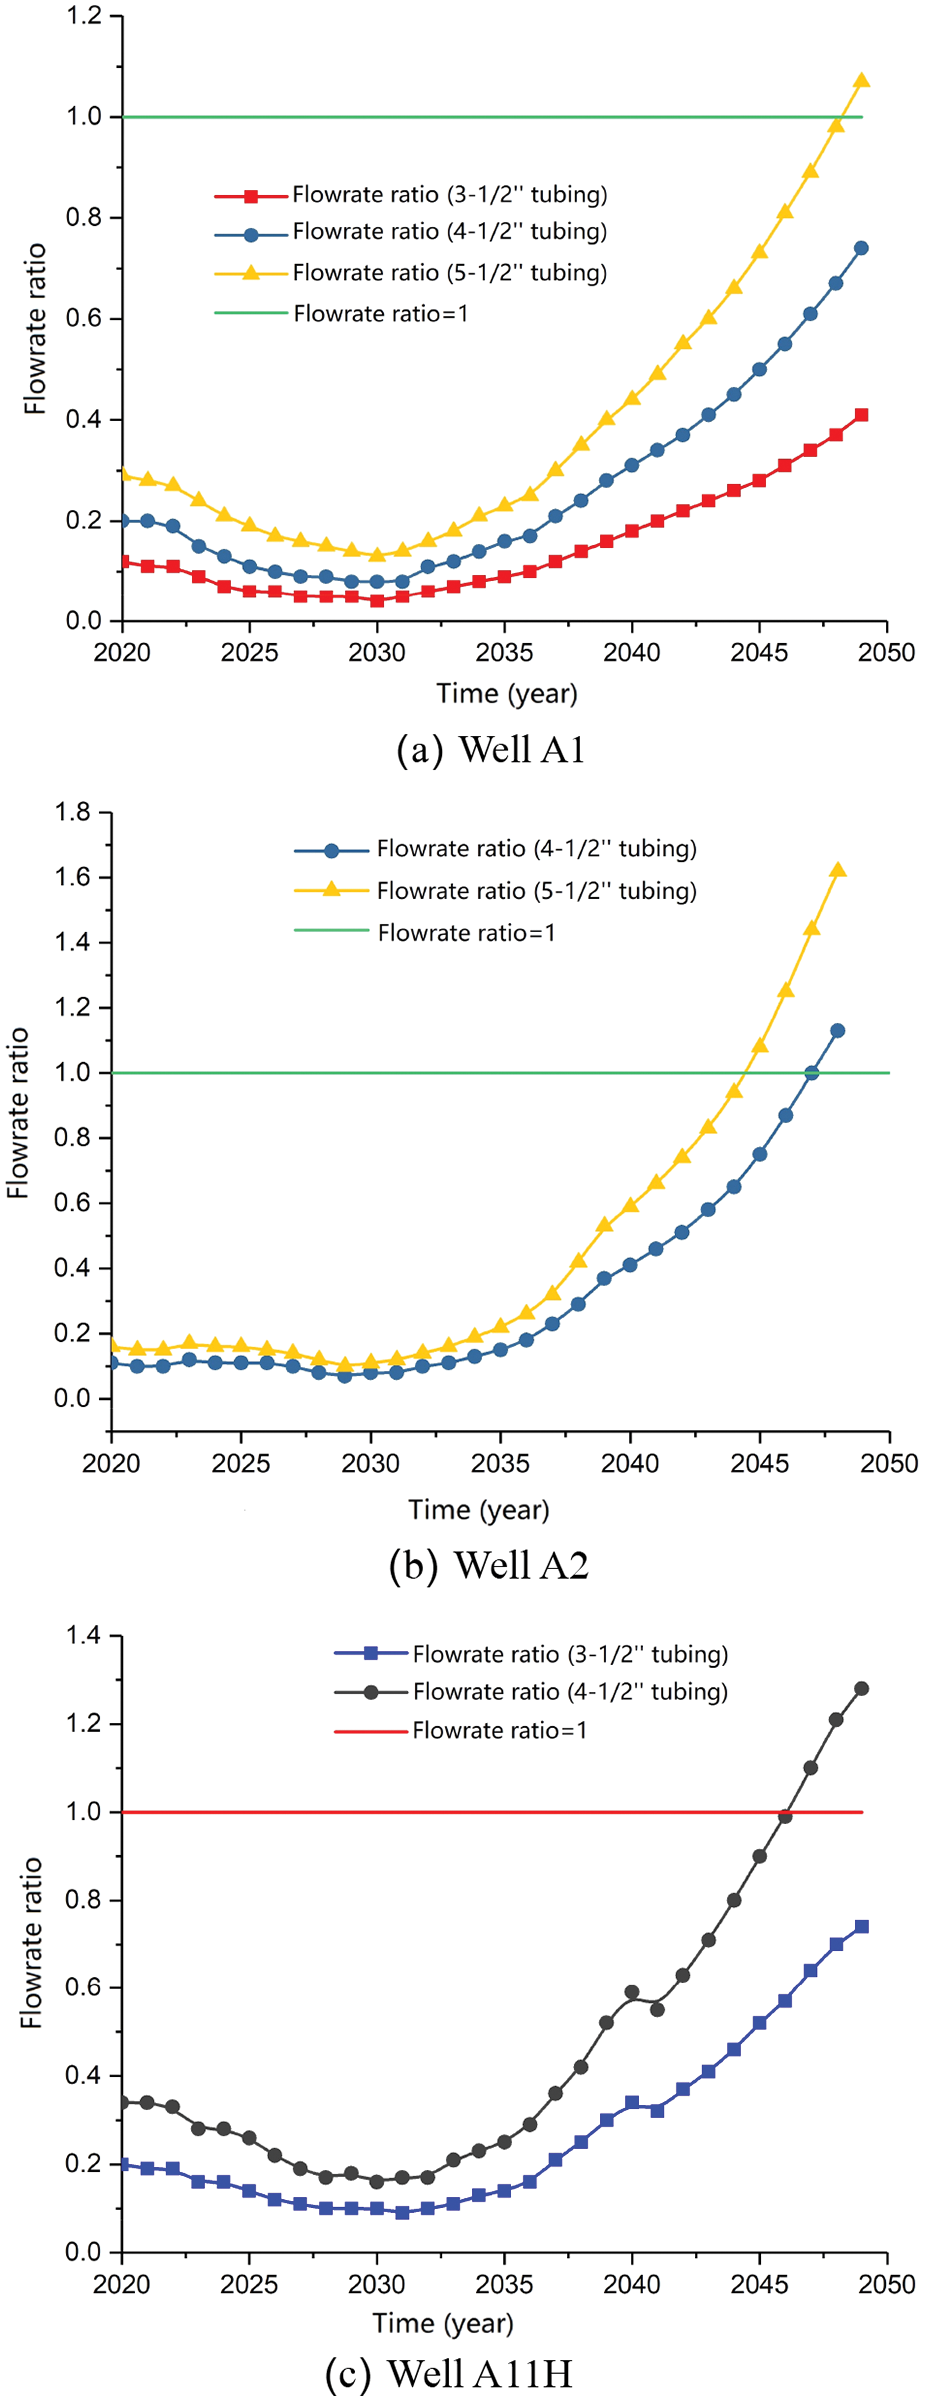
Figure 4: Liquid carrying flowrate ratio
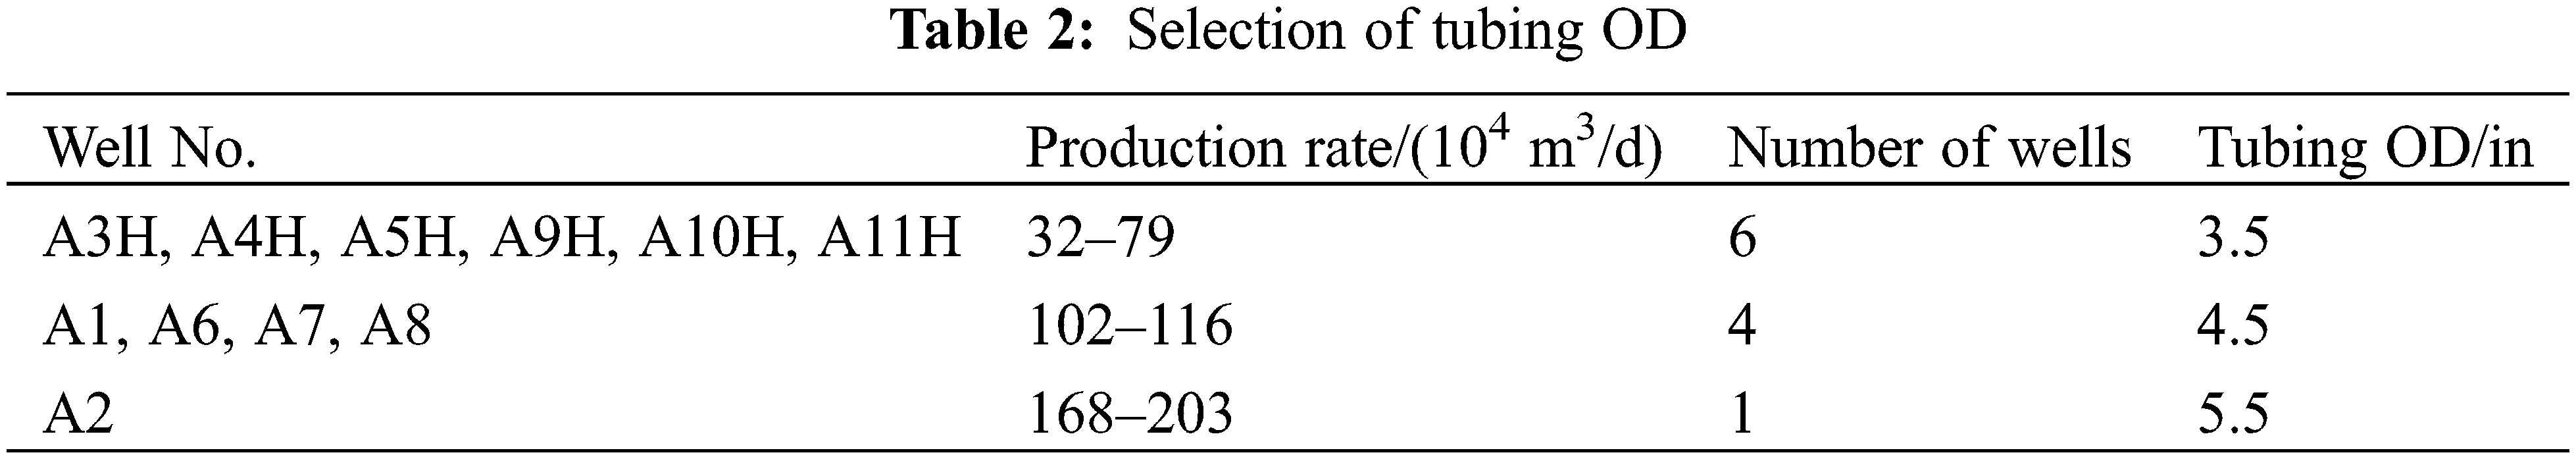
Based on the above sensitivity analysis of the tubing sizes and in the case of meeting the wellhead pressure required, the small-sized tubing is preferred in order to reduce the liquid loading risk in the wellbore within the production period. According to this principle, the tubing sizes for wells are determined (Table 2).
Once the tubing material and dimension have been determined, further validations should be performed on a specific tubing configuration to ensure safe operation during the production interval. Specific scenarios were chosen to evaluate whether the tubing configuration meets the field condition or not.
4.1 Considerations in the Tubing Strength Design
1) Anti-collapse yield strength, internal pressure-resistant yield strength, tensile strength, and triaxial strength are considered in the tubing strength design.
2) The most unfavorable situations that the tubing is fully empty and the tubular annulus is full of killing fluid are considered for the anti-collapse load of the tubing.
3) The working conditions of a shut-in, pressure test, and others are considered for the internal pressure-resistant load of the tubing.
4) The tubing weight, friction, and releasing force are considered for the tensile load.
5) The steel grade and the wall thickness of the tubing are selected from an economic and safe perspective and the favor of the field operation.
Referring to the safety factors used for the tubing strength design in the relevant oil field and considering the load condition of the tubing similar to that of the production casings, the tubing strength is calibrated by using the following design safety factors for the strength:
The safety factor of the anti-collapse yield strength: 1.125
The safety factor of the internal pressure-resistant yield strength: 1.10
The safety factor of the tensile yield strength: 1.60
The safety factor of the triaxial strength: 1.25
4.2 Tubing Strength Calculation
Calculation conditions:
Based on the wellbore trajectory of the well, the parameters such as vertical depth and horizontal displacement, which are related to the tubing strength, are considered.
Necessary working conditions:
(1) Initial production of gas wells: According to the reservoir allocation, the production data in the year with the highest production rate is taken as the basic data.
(2) Gas well shut-in: The maximum probable bottom hole pressure and highest transient wellhead pressure are taken as the basic data.
(3) Packer releasing: Releasing force is 20 tons.
(4) Tubing evacuation: The tubing is fully empty.
(5) The later production stage of gas well: The gas well can produce for 20 years.
(6) Annular leakage: The fluid leaks off in the casing-tubing annulus.
4.3.1 Gas Wells by Using 3-1/2″ Tubing
A11H with a true vertical depth of 3417 m is selected as the typical well, with the subsea wellhead and water depth of 1252 m. The tubing is run down to the top of the reservoir. By using WellCat software, 3-1/2″9.3b/ft J55 and N80 tubings are calibrated for strength and the calibration results are shown in Figs. 5 and 6.
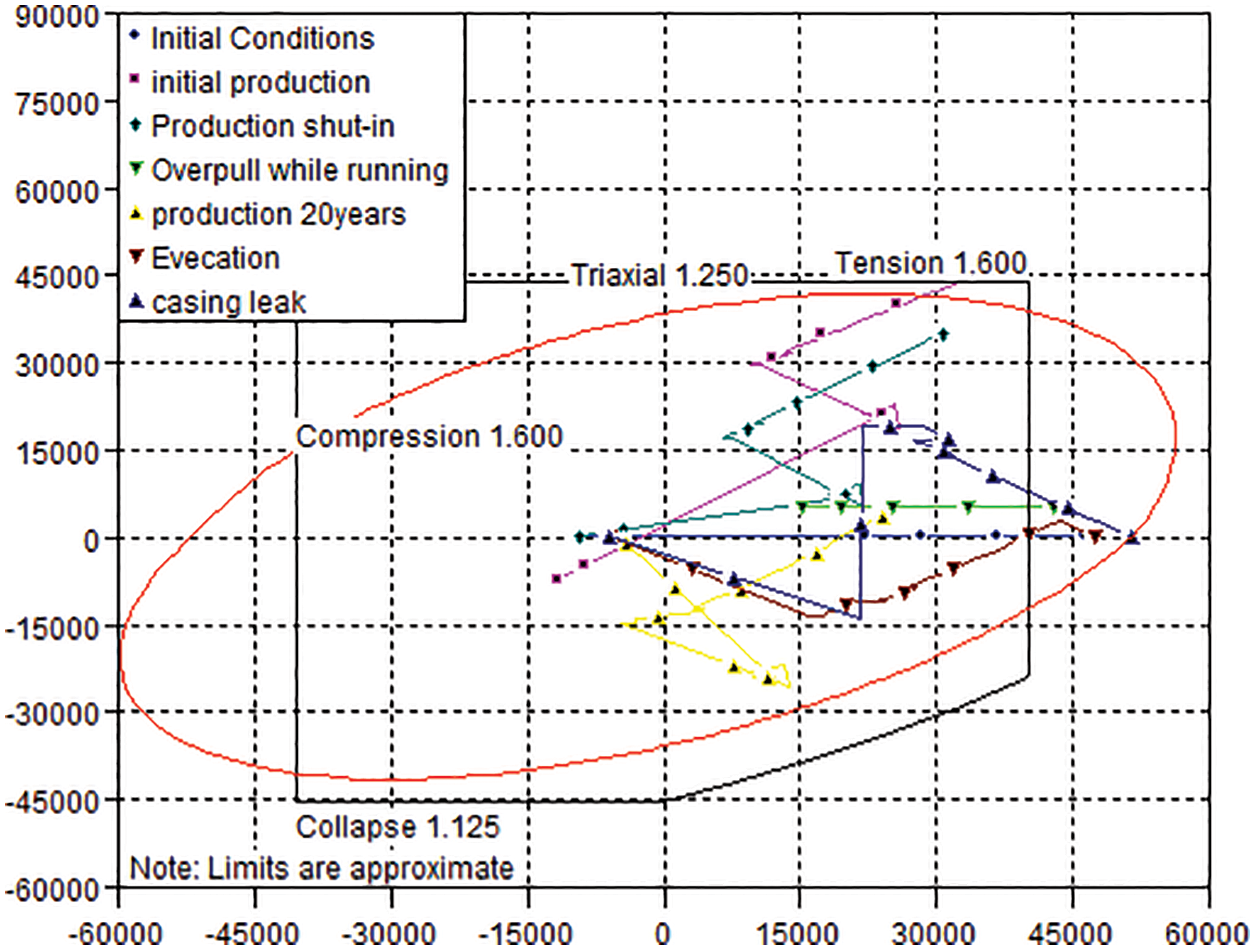
Figure 5: Strength calculation results of 3-1/2″ 9.3 lb/ft J55 tubing of A11H
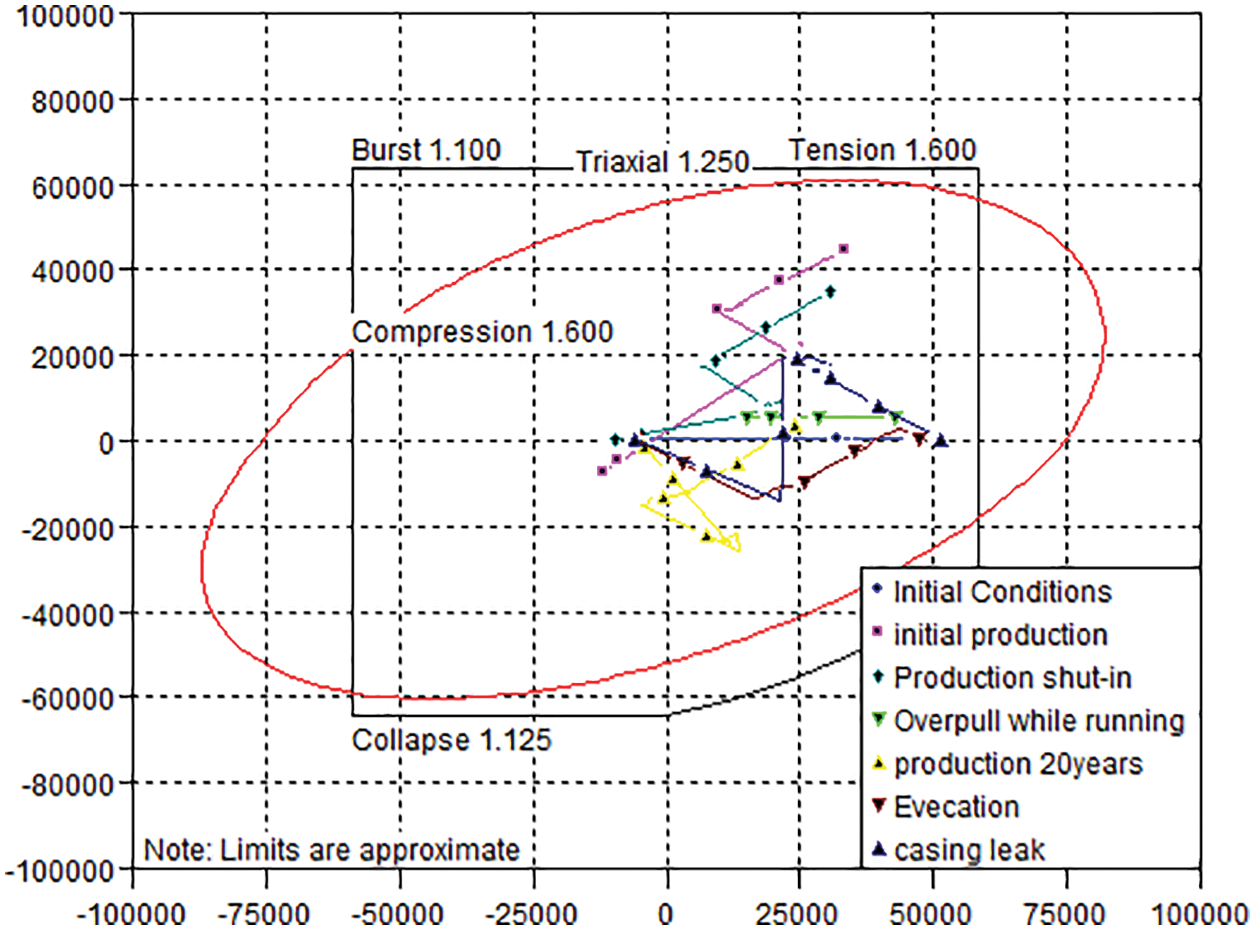
Figure 6: Strength calculation results of 3-1/2″ 9.3 lb/ft N80 tubing of A11H
4.3.2 Gas Wells by Using 4-1/2″ Tubing
A1 with a true vertical depth of 3488 m is selected as the typical well, with the subsea wellhead and water depth of 1466 m. The tubing is run down to the top of the reservoir. By using WellCat software, 4-1/2″12.75 b/ft J55 and N80 tubings are calibrated for strength, and the calibration results are shown in Figs. 7 and 8.
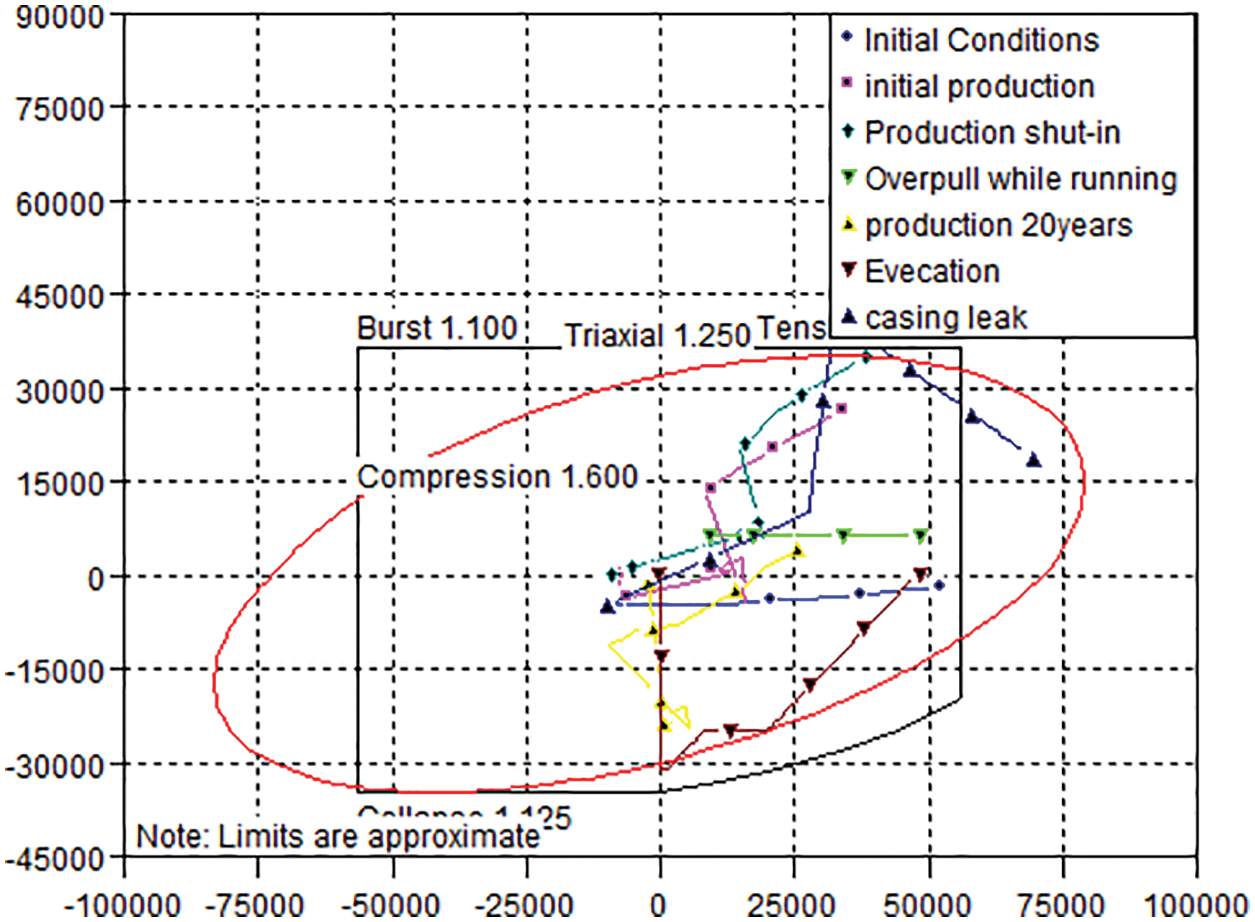
Figure 7: Strength calculation results of 4-1/2″12.75 lb/ft J55 tubing of A1
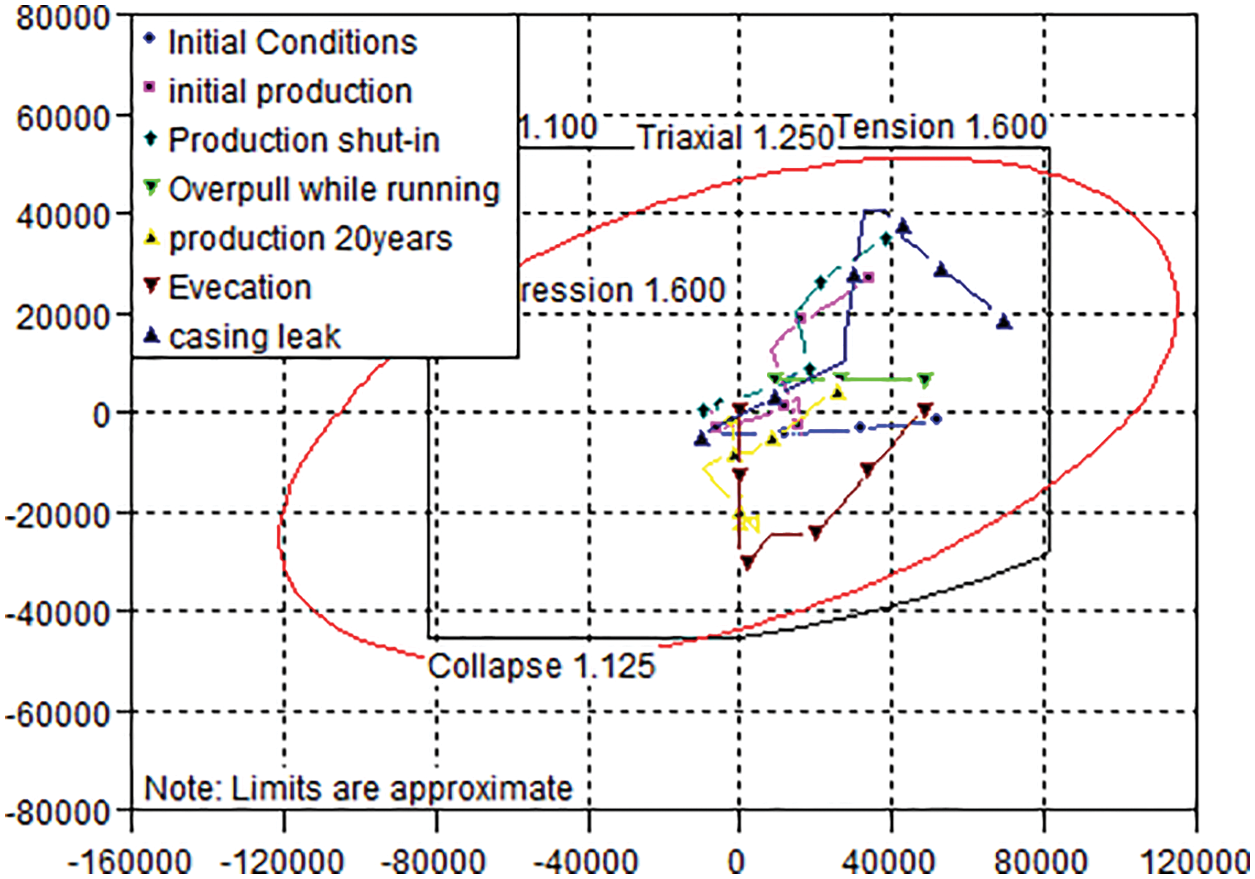
Figure 8: Strength calculation results of 4-1/2″ 12.75 lb/ft N80 tubing of A1
4.3.3 Gas Wells by Using 5-1/2″ Tubing
A2 with a true vertical depth of 3488 m is selected as the typical well, with the subsea wellhead and water depth of 1447 m, The tubing is run down to the top of the reservoir. By using WellCat software, 5-1/2″ 17 lb/ft J55 and N80 tubings are calibrated for strength, and the calibration results are shown in Figs. 9 and 10.
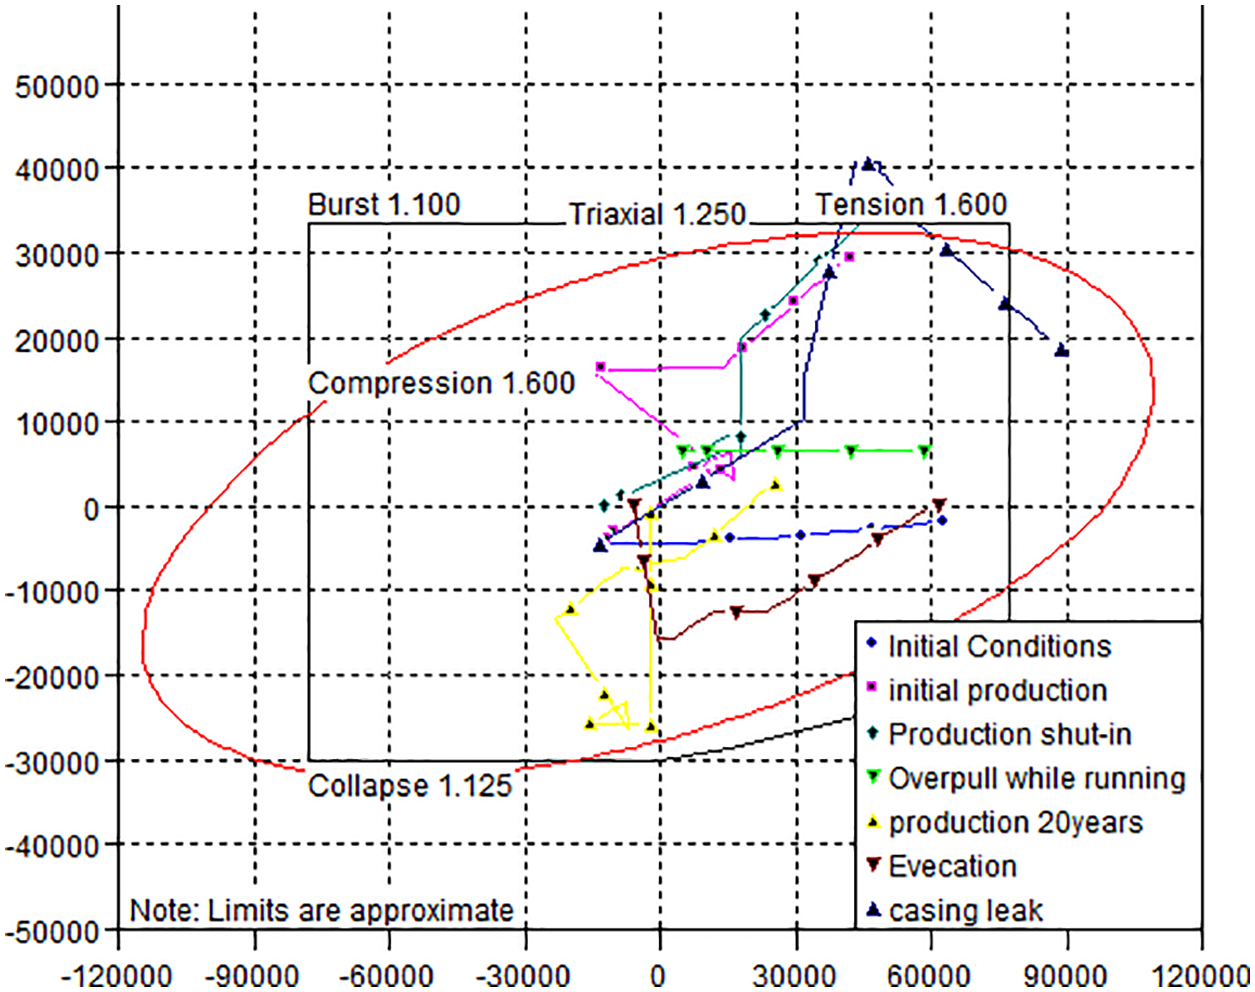
Figure 9: Strength calculation results of 5-1/2″ 17 lb/ft J55 tubing of A2
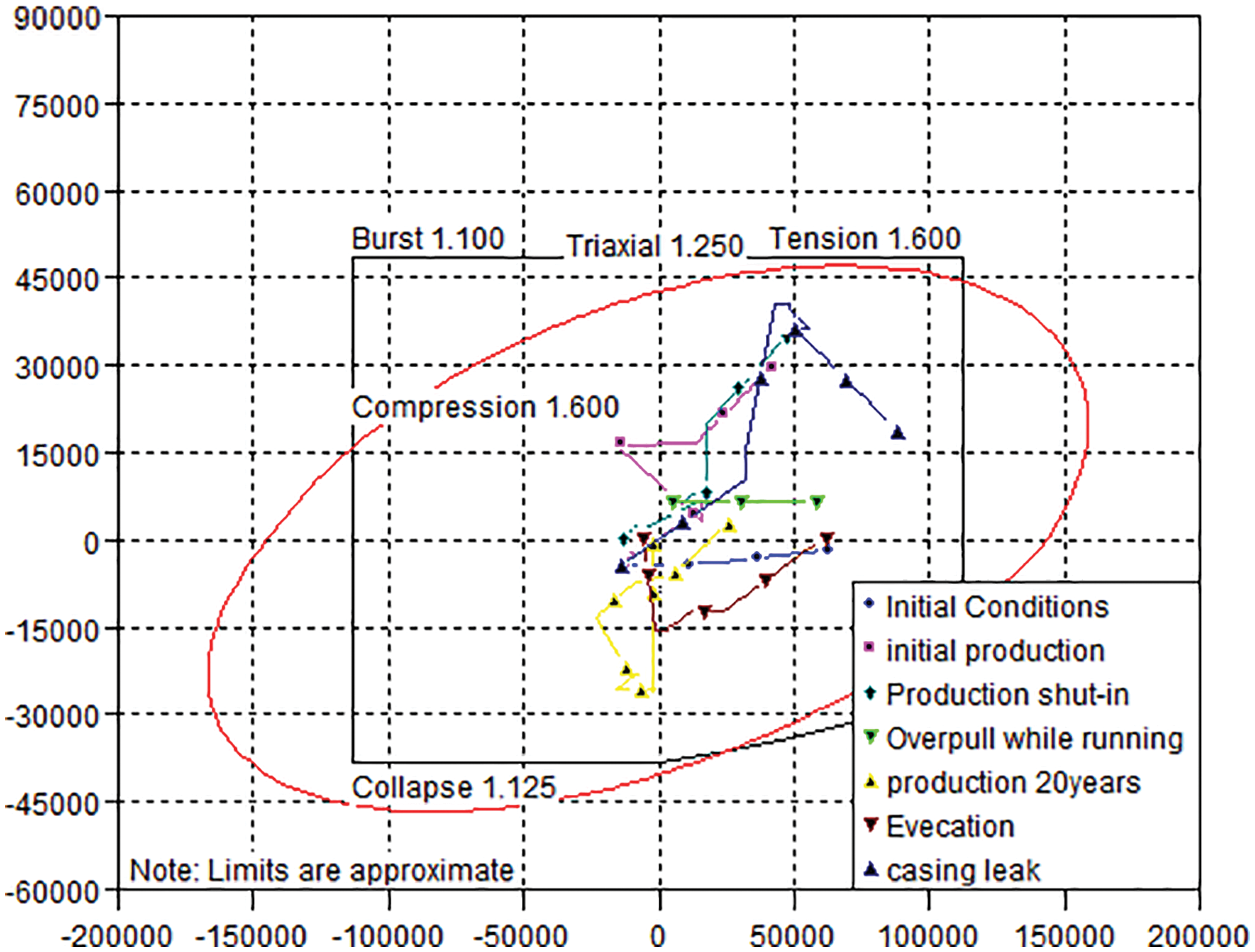
Figure 10: Strength calculation results of 5-1/2″ 17 lb/ft N80 tubing of A2
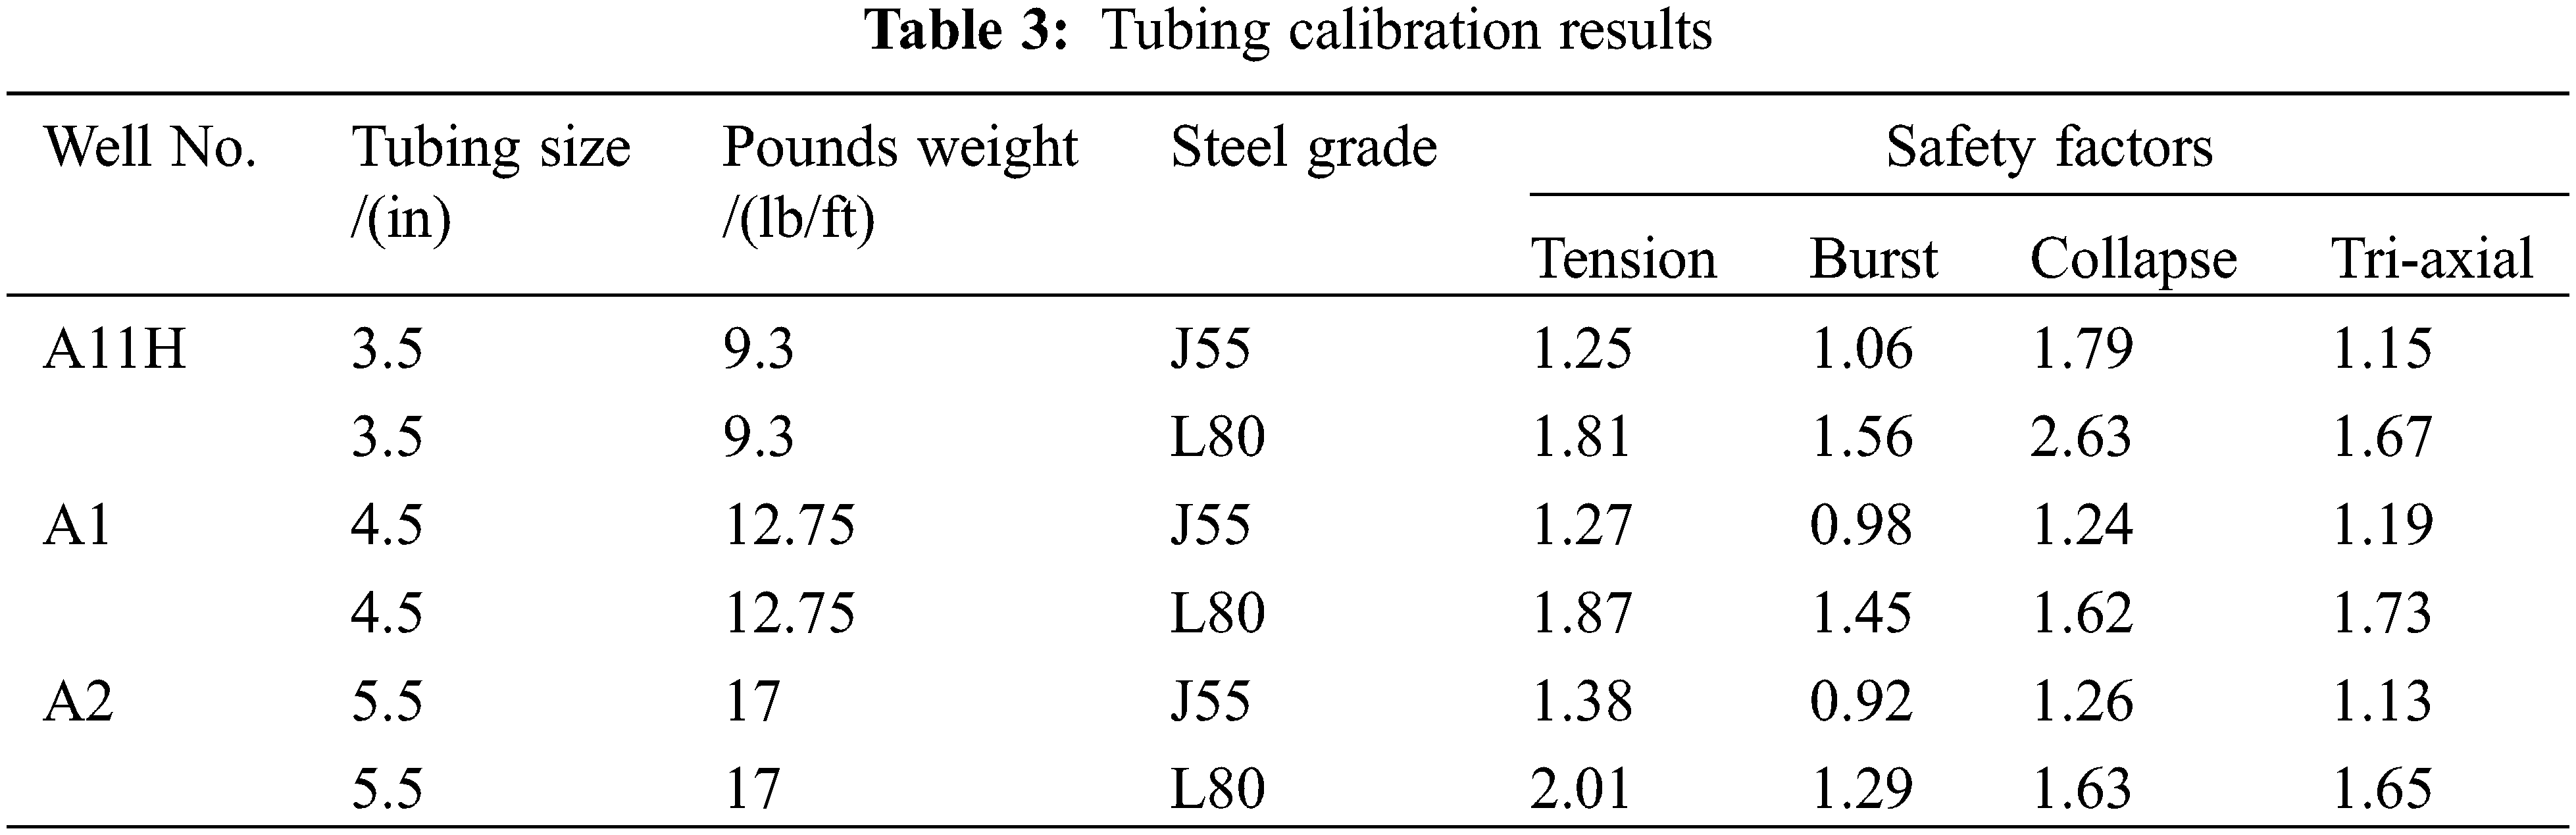
4.4 Tubing Calibration Results
Based on the above analysis, According to the principle of the safety factor of tubing strength design, WellCat software was used to carry out strength checks for A1, A2, and A11H wells. The calibration results of three typical wells with different tubing sizes are shown in Table 3. The result shows that the safety factor of J55 tubing is lower than the set value and cannot meet the strength requirements. J55 tubing cannot meet the strength requirements, while N80 tubing may satisfy the strength requirements. Thus, 13Cr-N80 tubing is recommended for 11 wells in the L1 gas field.
Nodal analysis including productivity analysis, tubing size sensitivity, erosion analysis, liquid carrying performance, and tubing string analysis is applied to the tubing selection in L1 gasfield. Conclusions can be drawn from the study:
(1) 13Cr material is chosen as the appropriate tubing material.
(2) When the gas production rate is under 80 × 104 m3/d, 3-1/2 inches 9.3 lb/ft N80 tubing will be the optimum one.
(3) When the gas production rate is between 80 × 104 m3/d and 120 × 104 m3/d, 4-1/2 inches 12.75 lb/ft N80 tubing will be the optimum one.
(4) When the gas production rate is above 120 × 104 m3/d, 5-1/2 inches 17 lb/ft N80 tubing will be the optimum one.
Acknowledgement: Over the course of researching and writing this paper, the authors would like to acknowledge the financial support from the National Natural Science Foundation of China and The CNOOC (China) Co., Ltd. The authors also wish to thank the School of Petroleum Engineering of China University of Petroleum (East China) for providing the technical support.
Funding Statement: The work is financially supported by the National Natural Science Foundation of China (Grant No. 52174015) and the Scientific Research Project of CNOOC (China) Co., Ltd. “Research on key technologies for drilling and completion of 20 million cubic meters in Western Nanhai Oilfield” (No. CNOOC-KJ135ZDXM38ZJ05ZJ ).
Conflicts of Interest: The authors declare that they have no conflicts of interest to report regarding the present study.
References
1. Jonathan, B. (2009). Well completion design. In: Development in petroleum science, vol. 56. Oxford, UK: Elsevier. [Google Scholar]
2. Hagedorn, A. R., Brown, K. E. (1965). Experimental study of pressure gradients occurring during continuous two-phase flow in small-diameter vertical conduits. Journal of Petroleum Technology, 17(4), 475–484. DOI 10.2118/940-PA. [Google Scholar] [CrossRef]
3. Orkiszewski, J. (1967). Predicting two-phase pressure drops in vertical pipe. Journal of Petroleum Technology, 19(6), 829–838. DOI 10.2118/1546-PA. [Google Scholar] [CrossRef]
4. Aziz, K., Govier, G. W. (1972). Pressure drop in wells producing oil and gas. Journal of Canadian Petroleum Technology, 11(3). DOI 10.2118/72-03-04. [Google Scholar] [CrossRef]
5. Li, Y. C., Zhu, J. F., Qin, Y. (1999). An optimal model for two phase flow in tubing and annulus of gas wells. Acta Petrolei Sinica, 20(2), 87–92. [Google Scholar]
6. Turner, R. G., Hubbard, M. G., Dukler, A. E. (1969). Analysis and prediction of minimum flow rate for the continuous removal of liquid from gas wells. Journal of Petroleum Technology, 21(11), 1475–1482. DOI 10.2118/2198-PA. [Google Scholar] [CrossRef]
7. Beggs, D. H., Brill, J. P. (1973). A study of two-phase flow in inclined pipes. Journal of Petroleum Technology, 25(5), 607–617. DOI 10.2118/4007-PA. [Google Scholar] [CrossRef]
8. Cox, S. (1996). Gas well optimization: Using velocity as the key component in choosing tubing size. SPE Gas Technology Symposium, Calgary, Alberta, Canada. DOI 10.2118/35579-MS. [Google Scholar] [CrossRef]
9. Wen, M., He, B. S., Wang, P. S., Sun, T. F., Cao, Y. F. et al. (2014). Optimization design of production string for offshore high temperature and high pressure gas wells. Journal of Oil and Gas Technology, 36(11), 234–238. [Google Scholar]
10. Li, S. (2016). Evaluation method of tubing integrity of offshore gas well (Master Thesis). China University of Petroleum (BeijingBeijing, China. [Google Scholar]
11. Gong, N., Yang, X., Li, J., Wang, G. P., Lin, H. (2016). Tubing comprehensive optimization method for offshore oil and gas well. China Petroleum Machinery, 44(12), 54–58. [Google Scholar]
12. Hammerlindl, D. J. (1977). Movement, forces, and stresses associated with combination tubing strings sealed in packers. Journal of Petroleum Technology, 29(2), 195–208. DOI 10.2118/5143-PA. [Google Scholar] [CrossRef]
13. Song, L. Z., Wan, X. J., Wu, S. W., Yu, Z. G., Zhou, H. Y. (2017). Application of sensitivity analysis method in tubing selection at weizhou oilfield. Drilling and Production Technology, 40(4), 47–49. [Google Scholar]
14. Zhang, G. C., Lin, G. F., Zhang, J. T. (2013). Study on the pitting corrosion behavior of super 13Cr casing and tubing steel. Welded Pipe and Tube, 36(7), 20–24. [Google Scholar]
15. Zhang, F. X., Ba, D., Liu, H. T., Li, Z., Dou, Y. H. (2014). Study on the erosion and corrosion of super 13Cr tubing in fracturing. China Petroleum Machinery, 42(8), 89–93. [Google Scholar]
16. Shirazi, S. A., Mclaury, B. S., Arabnejad, H. (2016). A semi-mechanistic model for predicting sand erosion threshold velocities in gas and multiphase flow. SPE Annual Technical Conference and Exhibition, Dubai, UAE. DOI 10.2118/181487-MS. [Google Scholar] [CrossRef]
17. Andrews, P., Illson, T. F., Matthews, S. J. (1999). Erosion–corrosion studies on 13Cr steel in gas well environments by liquid jet impingement. Wear, 233–235+568–574. DOI 10.1016/S0043-1648(99)00228-8. [Google Scholar] [CrossRef]
18. Salama, M. M. (2000). An alternative to API 14E erosional velocity limits for sand-laden fluids. Journal of Energy Resources Technology, 122(2), 71–77. DOI 10.1115/1.483167. [Google Scholar] [CrossRef]
19. Tan, Y. F., Lin, T. (2008). Analysis of injection production capacity of single well in underground gas storage of condensate gas reservoir. Oil & Gas Storage and Transportation, 27(3), 27–29. [Google Scholar]
20. Wang, J. H., Luo, T. Y., Li, Y. G., Xue, C. W., Zhao, L. P. (2012). Research and application of the model of gas well erosion output of the hutubi underground gas storage. Natural Gas Industry, 32(2), 57–59. [Google Scholar]
21. Li, L. F., Liu, X. M., Huang, Z. Q. (2012). Study and application for corrosion-resistant material selection of tubing and casing in sour gas reservoirs under coexistence of H2S and CO2. Advanced Materials Research, 485, 429–432. DOI 10.4028/www.scientific.net/AMR.485.429. [Google Scholar] [CrossRef]
22. Barton, N., Lewis, M., Emmerson, P. (2016). CFD erosion prediction in gas-liquid-sand flow. SPE International Oilfield Corrosion Conference and Exhibition, Aberdeen, Scotland, UK. DOI 10.2118/179926-MS. [Google Scholar] [CrossRef]
23. Liu, Z. S. (2012). Application of optimization design method in calculation of gas well erosion. Petrochemical Industry Application, 31(2), 51–52. [Google Scholar]
24. Barton, N., Lewis, M., Emmerson, P. (2015). Improving erosion assessment through high-fidelity CFD simulation methods. SPE Offshore Europe Conference and Exhibition, Aberdeen, Scotland, UK. DOI 10.2118/175514-MS. [Google Scholar] [CrossRef]
25. Liu, S. Q., Dong, W. X., Sheng, W. G., Wang, X. M., Wang, X. R. (2007). A study on dynamic distribution of the liquid-carrying critical velocities and flow rates along the wellbore of gas wells. Natural Gas Industry, 27(2), 104–105. [Google Scholar]
Cite This Article
 Copyright © 2023 The Author(s). Published by Tech Science Press.
This work is licensed under a Creative Commons Attribution 4.0 International License , which permits unrestricted use, distribution, and reproduction in any medium, provided the original work is properly cited.
 Downloads
 Citation Tools