| Fluid Dynamics & Materials Processing |
DOI: 10.32604/fdmp.2022.020730
ARTICLE
Research on the Dynamic Response of Submerged Floating Tunnels to Wave Currents and Traffic Load
1Chongqing Vocational Institute of Engineering, Chongqing, 402260, China
2Chongqing Vocational College of Public Transportation, Chongqing, 402247, China
3Chongqing Jiaotong University, Chongqing, 400074, China
*Corresponding Author: Bolin Jiang. Email: bolinjiang@cqvie.edu.cn
Received: 08 December 2021; Accepted: 25 March 2022
Abstract: Submerged floating tunnel (SFTs) are typically subjected to complex external environmental and internal loads such as wave currents and traffic load. In this study, this problem is investigated through a finite element method able to account for fluid-structure interaction. The obtained results show that increasing the number of vehicles per unit length enhances the transverse vibrational displacements of the SFT cross sections. Under ultimate traffic load condition, one-way and two-way syntropic distributions can promote the dynamic responses of SFTs whereas two-way reverse distributions have the opposite effect.
Keywords: Submerged floating tunnel; vehicle load; dynamic response; wave and current loads; fluid-structure interaction
Compared with other underwater traffic structures, submerged floating tunnels (SFTs) enjoy from some advantages such as shorter length and higher cost-effectiveness as well as less sensitivity to climate, surrounding environment and navigation conditions [1,2]. Therefore, it has attracted the attention of experts and researchers from around the world.
At present, no SFT structure exists in the world. The SFT design scheme proposed in this work was mostly a large cross-sea traffic structure for internal passage of cars and/or trains with external support system to maintain the balance of the overall structure. Due to the complex external environmental conditions of SFTs, there are several dynamic load types during operation period which wave and current around SFT, water flow excitation loads of anchor cables and vehicle loads inside the structure are the most common dynamic loads. In existing research data, the dynamic responses of SFTs under wave and current load [3–5], earthquake excitation [6–8] and anchor cable flow excitation [9,10] have been investigated through mathematical and physical models [11,12], while the dynamic responses of SFT under vehicle load has rarely been studied.
Tariverdilo et al. [13] performed simulation analyses on vehicle loads in SFTs considering them as concentrated forces moving longitudinally along pipe body. They also derived movement control equations for pipe body under moving loads and investigated the dynamic response laws of SFTs under moving load excitation. Liang et al. [14] explored the influences of moving vibration loads on the dynamic responses of SFT structures by taking into account the fluctuations and periodicity of vehicle load in SFTs. Research has shown that moving vibration loads could reflect the dynamic load characteristics of vehicle loads and therefore, it was more reasonable to simulate vehicle loads in SFTs.
Mulas et al. [15] applied ANSYS and INTER finite element software to develop a two-dimensional rigid body model (4 degrees of freedom) for the simulation of vehicles in SFT structures to investigate the coupling effects of contact forces among vehicles and tunnels. Xiang et al. [16] simplified SFTs as elastic support beams with equal spacing and vehicle loads as moving vertical loads to develop a vehicle-tunnel coupling vibration model.
Lin et al. [17] investigated the effects of water flow speed, vehicle speed, buoyance-weight ratio and anchor cable tilt angle on the vertical displacements and bending moments of SFT structures, considering the fluid-vehicle-tunnel coupling vibration characteristics of suspension tunnels in marine environments. Jin et al. [3] studied the coupling vibrations of tunnel-anchor cable-trains under the action of waves where tunnel and anchor cable were coupled based on finite element rod theory and solved by Galerkin equation. The dynamic loads caused by waves were calculated using Morison equation and multi-rigid body dynamic model with 7 degrees of freedom. Coupling between tunnel and train occurred based on simplified Kalker linear creep theory.
During the operation period of SFT structures, heavy vehicles, fast moving vehicles, vehicle shock effects and other conditions had significant impacts on SFT vibrations decreasing the driving comfort and stability of structures. In addition, the combined action of wave-current and vehicle loads was also a major factor in the generation of vibration, damage and fatigue failure of long distance SFT structures, thus affecting their operation and service quality.
In this paper, vehicle loads inside SFT were adopted as research objects and finite element numerical simulation analysis method was applied to evaluate the influences of the distribution mode, shock effect and limit condition of vehicle load on the dynamics of SFT structures, so as to provide a reference for the subsequent design and related research of SFT structures. Fig. 1 shows the processing diagram applied in this paper.
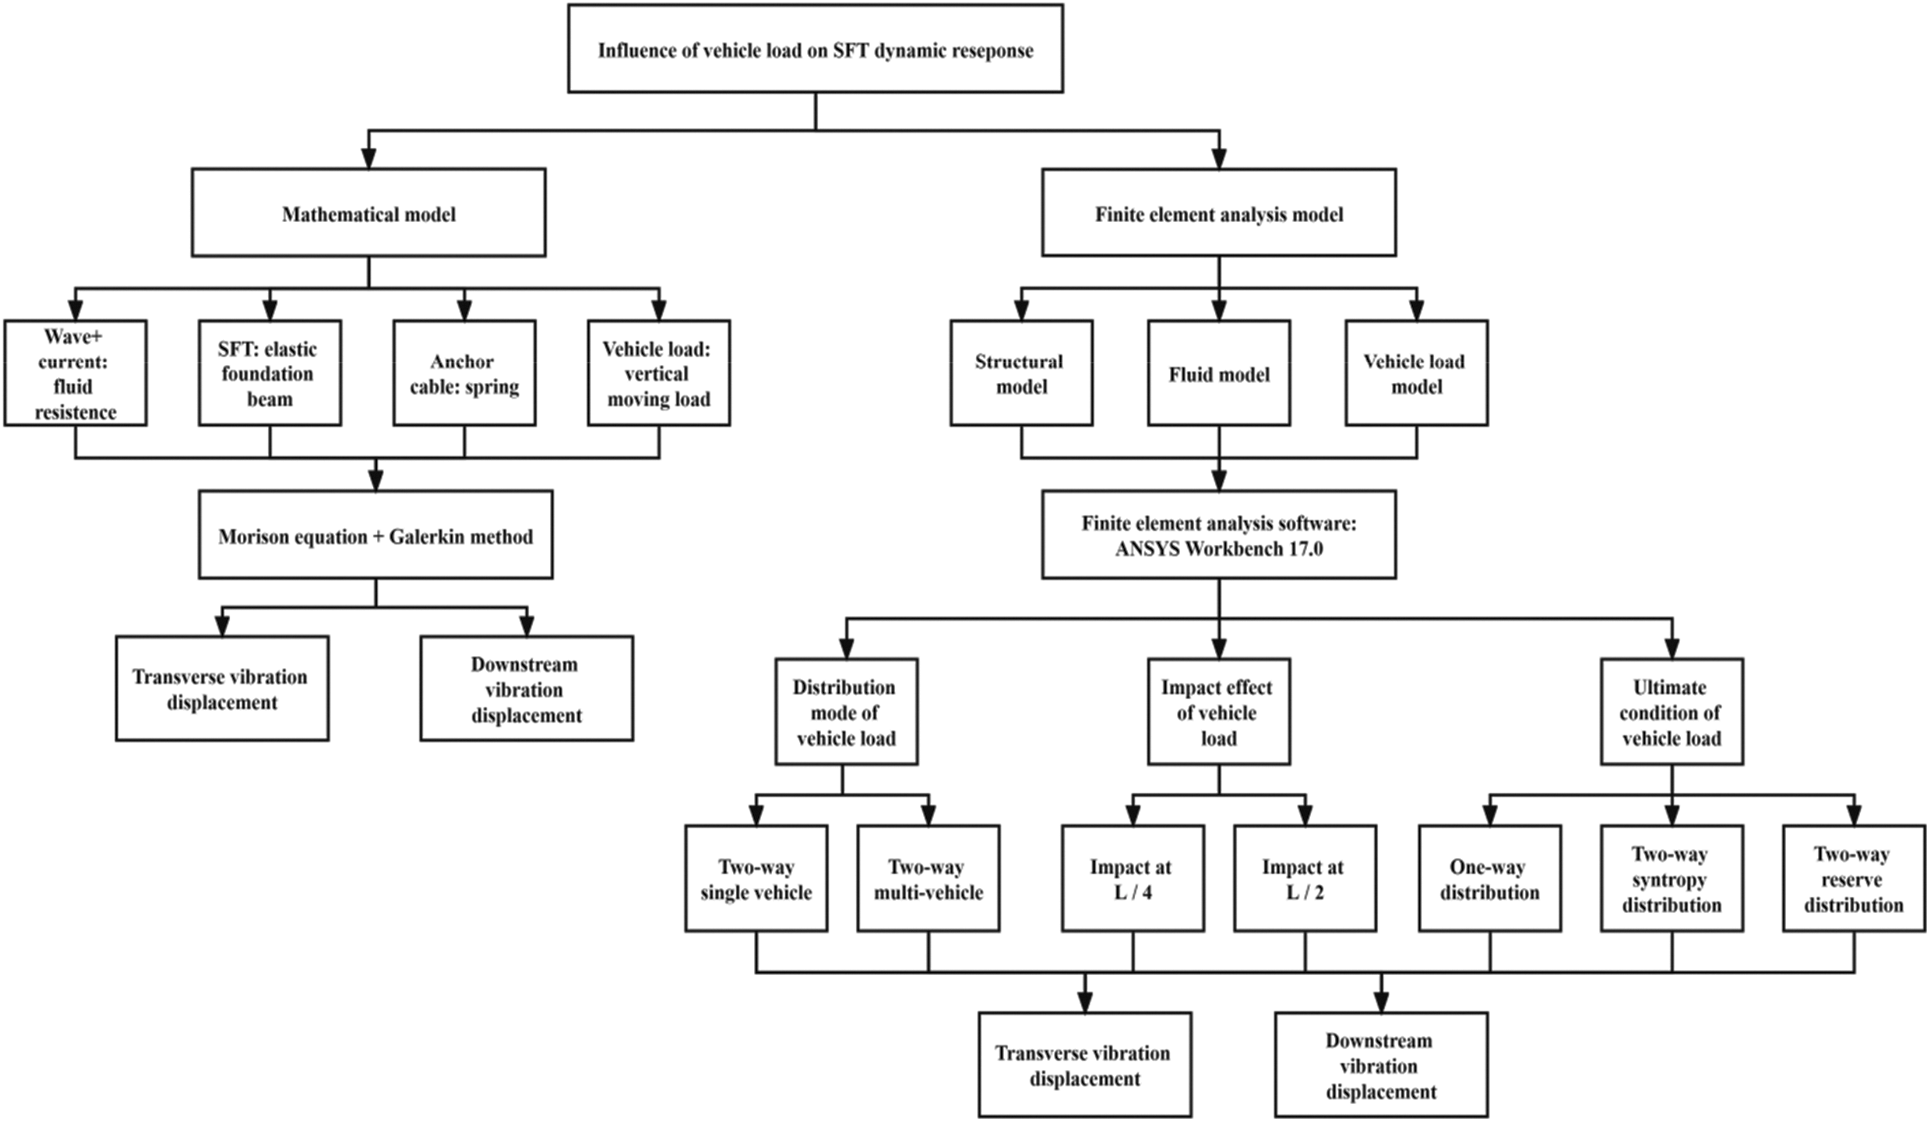
Figure 1: The processing diagram applied in this paper
Due to the lack of a real SFT structure in the world at present and their high complexity, it was necessary to simplify SFT structures into numerical simulation analysis and carry out relevant calculations under assumed conditions. Based on the existing design data and research results around the world [18,19], the SFT model was formed as presented in Fig. 2.
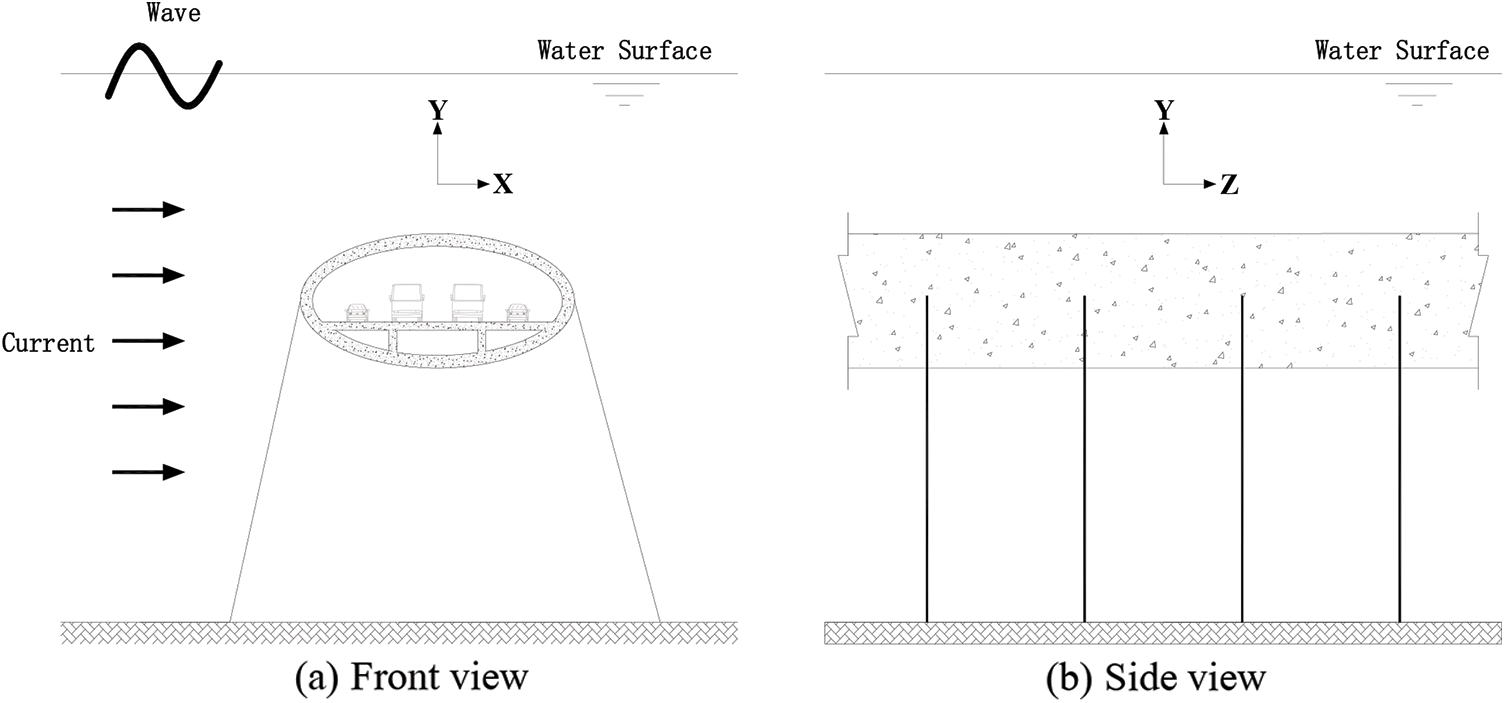
Figure 2: Structural diagram of SFT structures
In order to facilitate the research, an SFT structure with length L with elastic supports at equal spacing was assumed as an elastic foundation beam structure. Anchor cables were simplified to springs with stiffness K and damping, connections among anchor cables and SFT were assumed as hinge joints. Traffic load in SFT was simplified to vertical moving load F(t). The simplified SFT model is presented in Fig. 3.
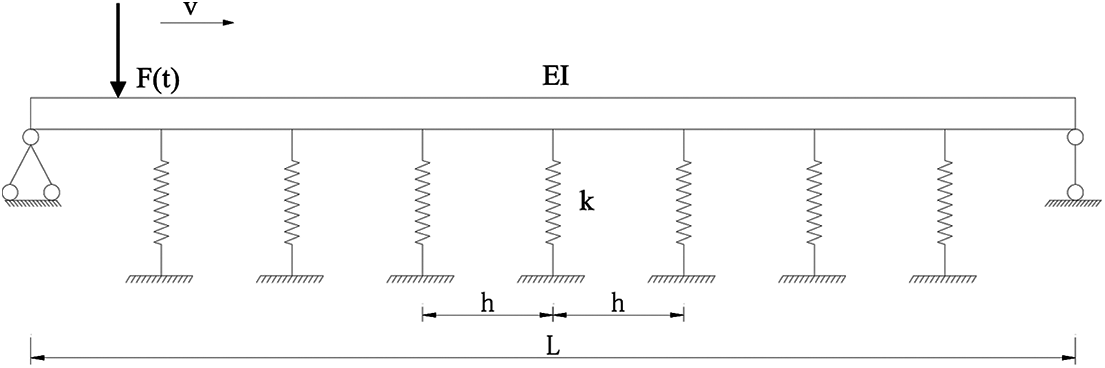
Figure 3: Simplified SFT model
In this paper, the downstream (X direction) and cross-flow (Y direction) vibrations of SFT structures under traffic load were studied and corresponding vibration differential equations were obtained as [20]:
where E is the elastic modulus of SFT structural material, I is cross-section inertia moment, v is SFT downstream displacement, w is SFT transverse displacement, ms is the mass of SFT per unit length, cs is viscous damping coefficient, and Fx(z, t) and Fy(z, t) are the resultant forces of SFT per unit length along downstream and transverse directions, respectively. Hydraulic resistance in the resultant force was calculated by Morison equation [21].
According to the assumed conditions, SFT was considered as an equidistant elastic support beam. Galerkin method was applied to derive the vertical displacement equation of SFT under traffic load as:
where φn(z) and qn(t) are the mode function and generalized coordinates of the order n of SFT, respectively. In this paper, only first-order modal form of SFT was considered.
where κ is the ratio of SFT elastic stiffness to spring vertical stiffness and K is spring vertical stiffness.
Flexible connections were assumed among SFT pipe bodies. Based on simplified SFT model, the boundary and initial conditions of SFT could be determined as:
According to Eqs. (6) and (7), generalized coordinate q(t) and in turn, vertical displacement w(z, t) could be obtained.
The lateral displacement of SFT was calculated by a similar method.
3 Finite Element Analysis Model
In this research, the finite element analysis software ANSYS Workbench 17.0 was applied for numerical simulation calculations, mainly due to its high capacity of structural, fluid and coupling analyses. Based on the analysis characteristics of ANSYS Workbench 17.0, analysis modules such as Static Structural (static analysis), Modal (modal analysis), Transient Structural (transient dynamics analysis) and Fluent (fluid dynamics analysis) commands were applied [22]. Considering fluid-structure interactions, structure, fluid and vehicle load models were developed to jointly analyze the dynamic responses of SFT structures under various working conditions.
SFTs are generally long, up to thousands of meters or even tens of kilometers. SFT structures are connected by several pipe segments and the length of a single pipe segment is mostly designed to be 100–200 m. In this research, one pipe segment with 100 m length was selected for numerical analysis. The cross-section of SFT was considered to be oval and road surface plate was set inside. The space below road surface plate was designed for filling ballast and placing other ancillary facilities. The specific size of the cross-section was adopted based on the existing design scheme and model test [23–25], as shown in Fig. 4.
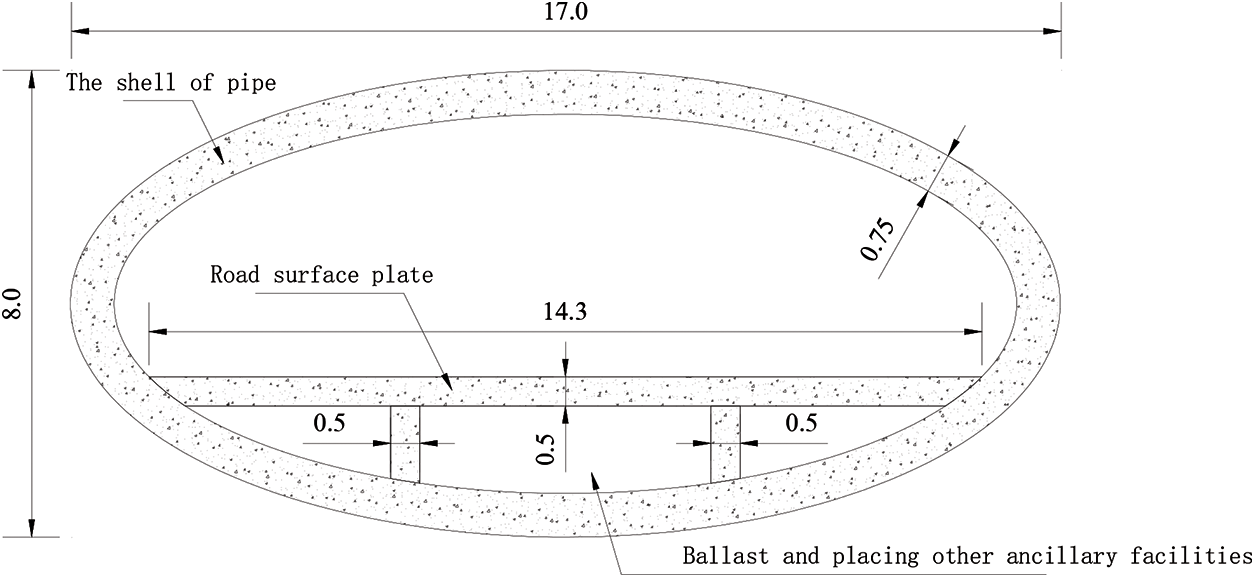
Figure 4: Model dimensions of SFT pipe section (Unit: m)
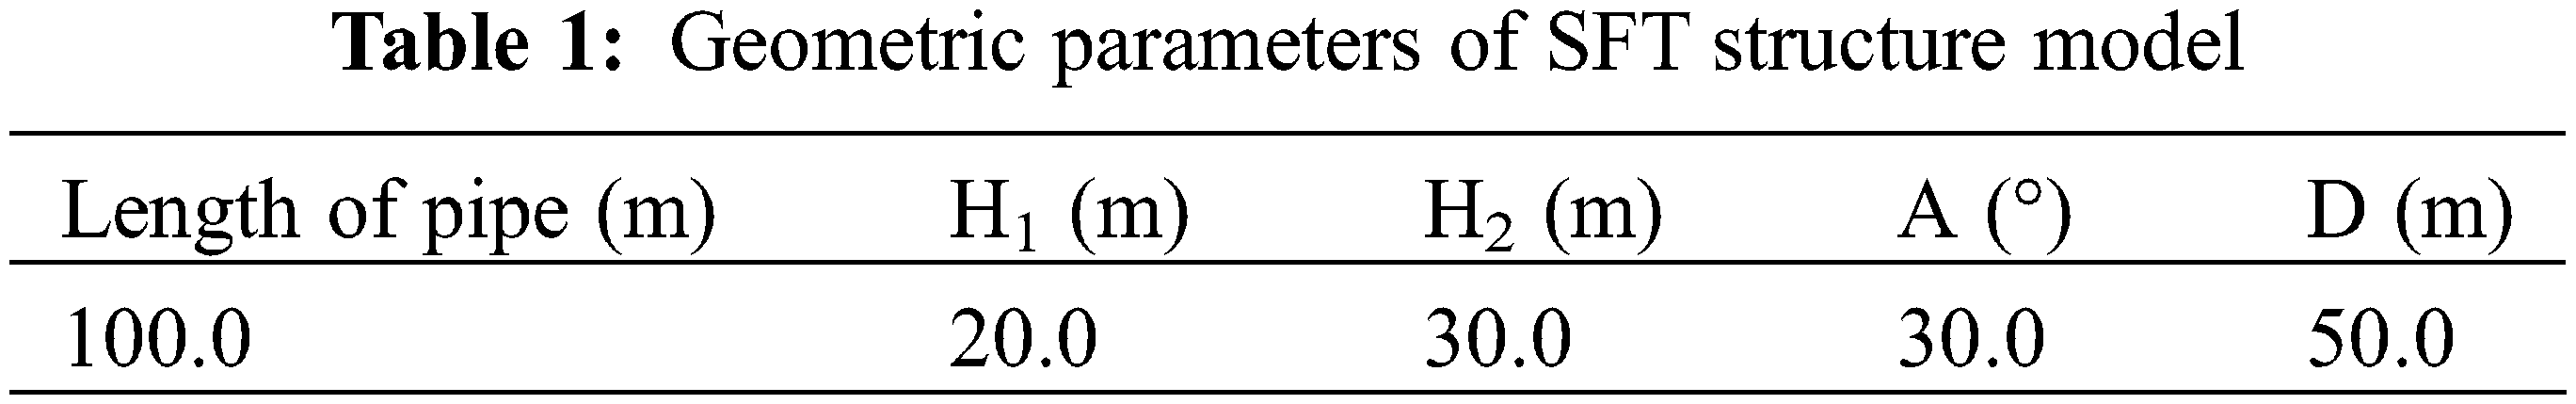
SFT structures are consisted of a tunnel pipe body, tension leg anchor cables, pipe segment connecting devices and anchoring devices, as shown in Fig. 1. When establishing SFT, some geometric parameters needed to be determined in advance. These parameters included suspended depth of tunnel structure H1 (the height from the surface to the top of tunnel structure), the height from water bed to the bottom of tunnel structure H2, the vertical angle of anchor cable A and axial spacing of anchor cable group along tube body D. The geometric parameters of SFT structure model are summarized in Table 1.
After SFT segment model was established, it was also necessary to divide grids before numerical calculation, as shown in Figs. 5 and 6.
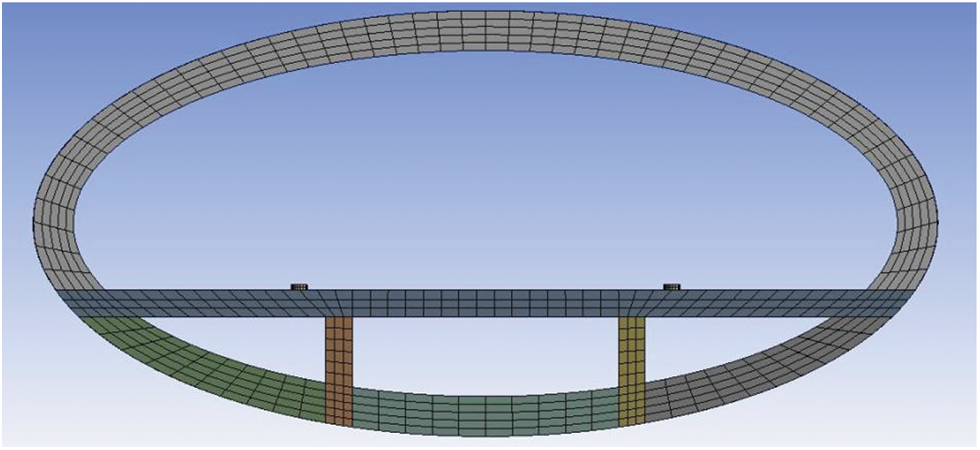
Figure 5: Grid generation of SFT section
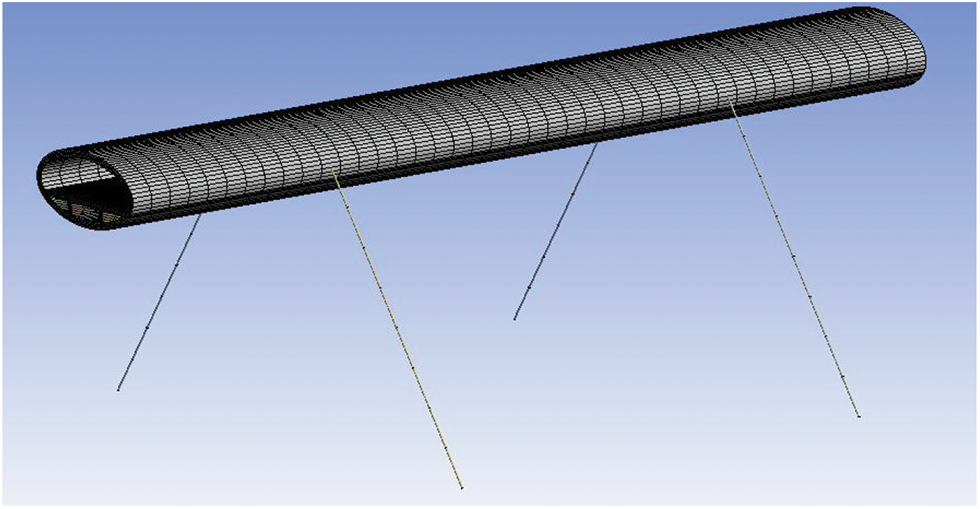
Figure 6: Global mesh generation of SFT structure
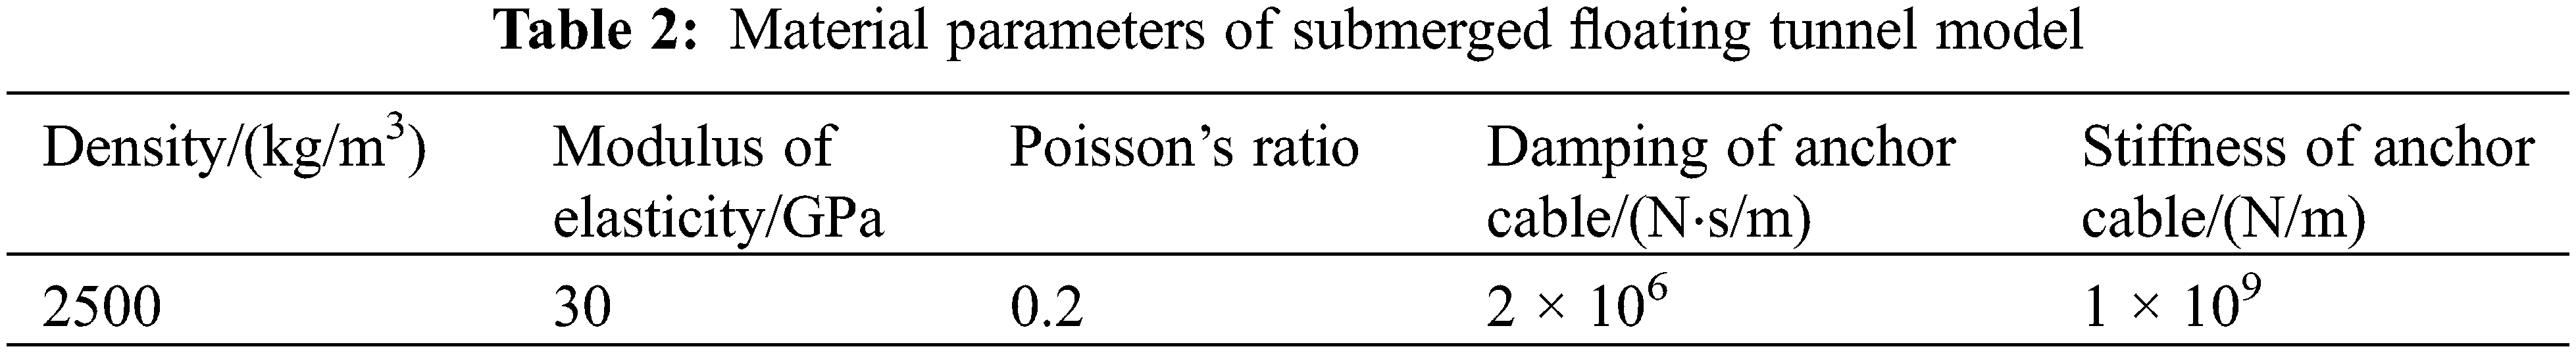
The material parameters of SFT model are given in Table 2.
In fluid model, wave and current effects were taken into account at the same time. Wave was assumed to be airy linear wave and current followed RNG k-ε turbulence model [26]. In order to simplify calculations, the current in fluid model was assumed as a steady flow; that is, the flow parameters (velocity, pressure, density, etc.) at each spatial point were not changed with time. Along the X direction in the turbulence model, the distance between the entrance end and the tube body is 3 times the cross-section width, and the distance between the exit end and the tube body is 10 times the cross-section width. D in the Fig. 7 represents the cross-section width of the tube body. To simulate waves on water surface, fluid model was divided into two layers along cross-flow direction (Y direction) with air above the water surface and fluid below it. The thickness of fluid model along the axial direction (Z direction) of pipe body was equal to the length of pipe section. The schematic diagram of the plane in fluid model as well as the overall meshing diagram are presented in Fig. 7.
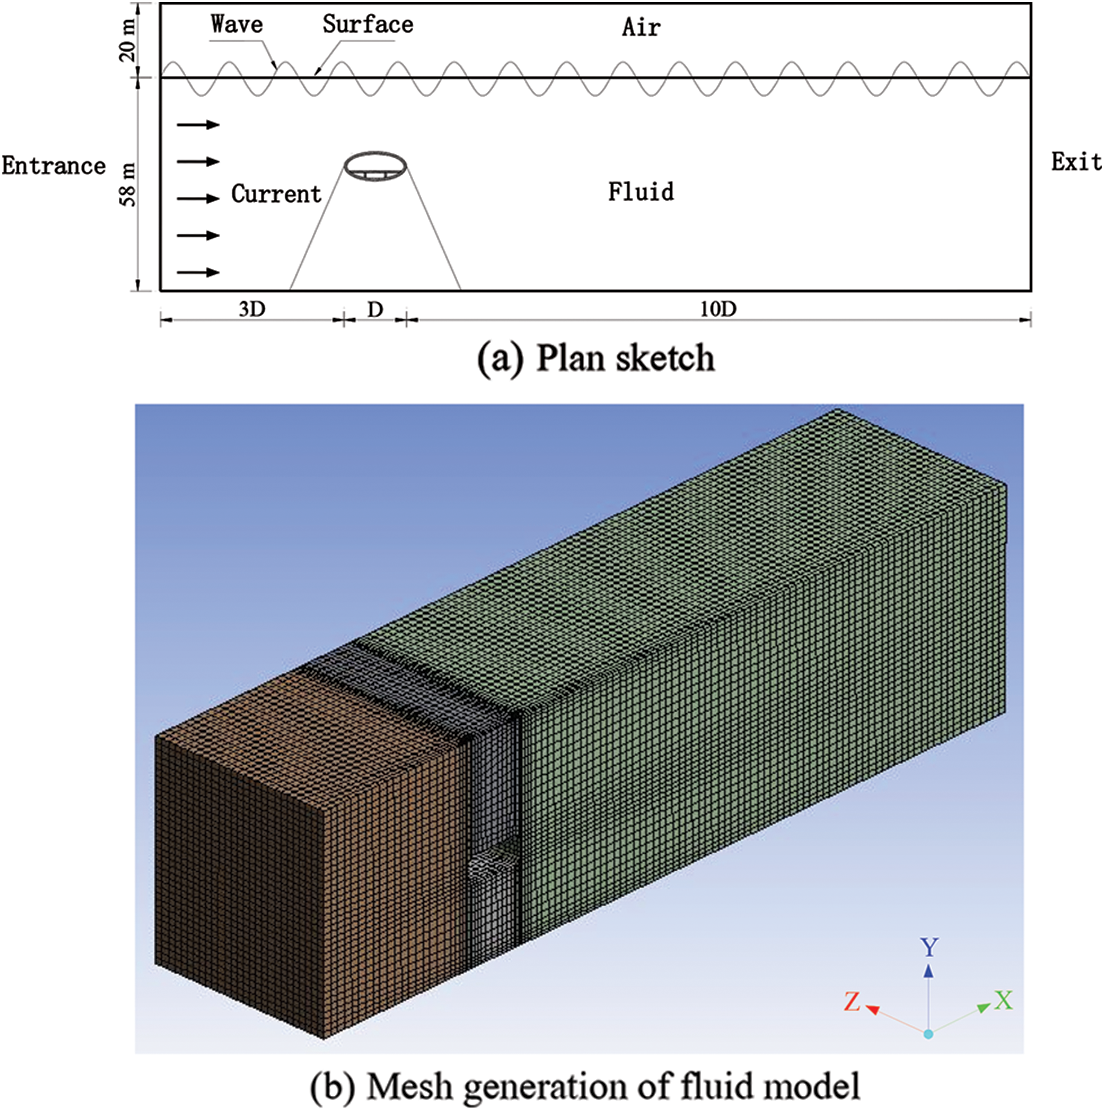
Figure 7: Schematic diagram of SFT fluid model
Current in fluid model was assumed as a steady flow; i.e., physical quantities such as velocity, pressure, temperature, density, etc., at any point in flow field were not changed with time. Related parameters of fluid model are summarized in Table 3.

During the operation period of SFT, vehicle load is the most common functional load and the selection of vehicle load model is critical in studying structural dynamic responses [27]. In the analysis and design of road surface dynamics, axle load is generally assumed to be evenly distributed in contact area and the size of contact area depends on contact pressure. In simulations, tire pressure is generally considered as contact pressure which is a relatively accurate assumption. In this paper also the above assumption was adopted to determine the static loads of vehicles; that is, wheel loads were simplified to equivalent circular uniform loads.
In this paper, a single circle was adopted for the simulation of contact surface between wheels and road surface and the diameter of a single circle under different wheel loads was calculated using Eq. (8):
where P is the load applied to tire (kN), p is tire contact pressure (kPa) and D is the equivalent circular diameter of contact surface (m).
In the numerical analysis model of SFT, traffic loads were uniformly distributed within a single circle and arranged along the one-way center line of road surface plate, as shown in Fig. 8.
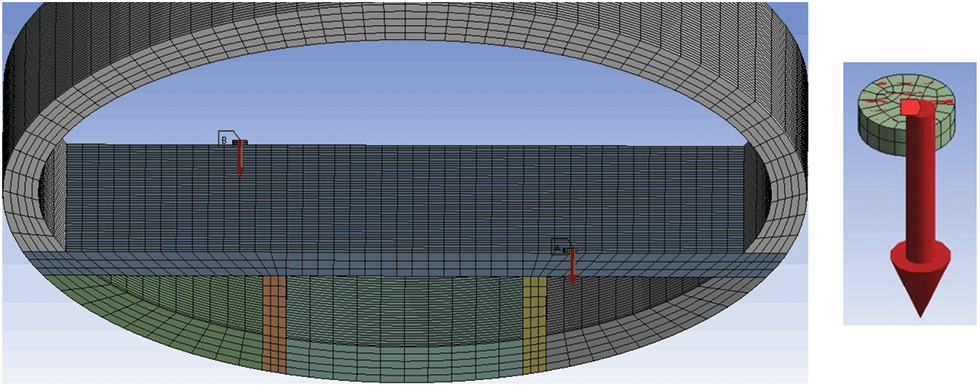
Figure 8: Traffic load loading diagram
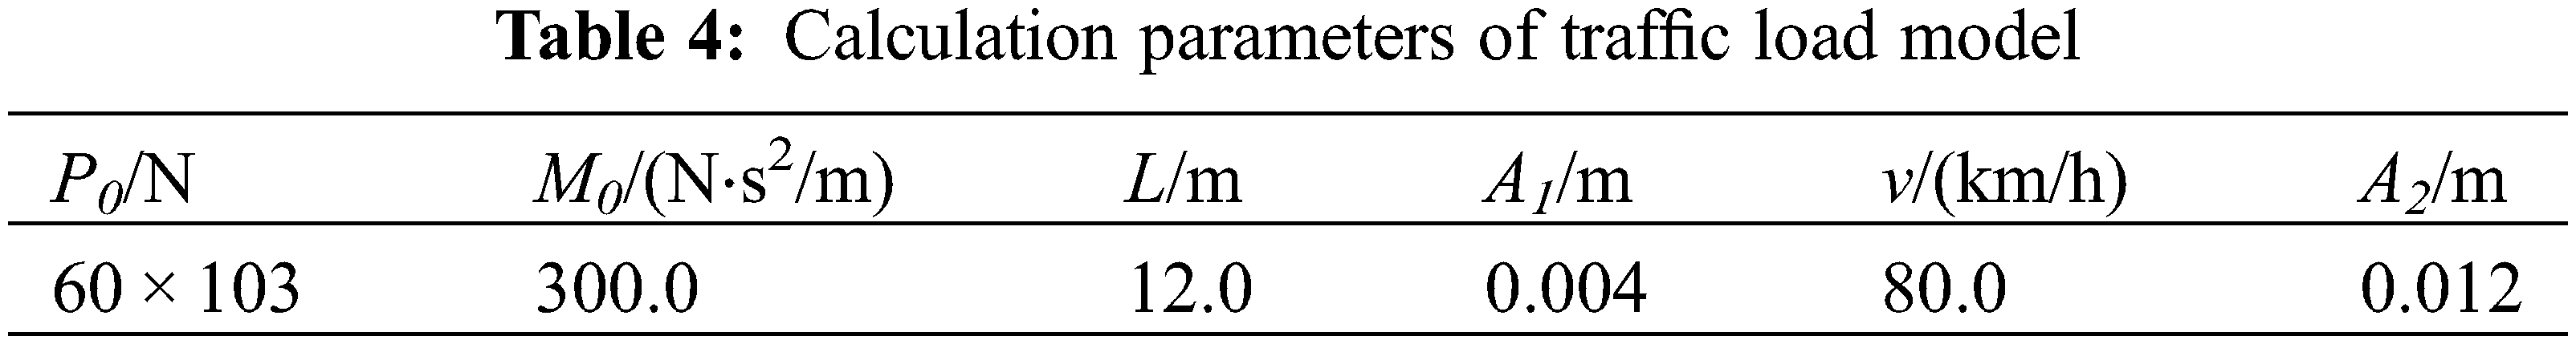
Vehicle loads on pavement board inside SFT were considered as moving vibration loads, which was determined by Eq. (9):
where P0 is the static load of wheel (N), M0 is the unsprung mass of vehicle (N⋅s2/m), A1 is road roughness (m), A2 is the vertical vibration displacement of tunnel structure due to wave and current loads (m), and ω is the circle frequency of vehicle vibration (s−1) and was calculated by Eq. (10) [28]:
where vc is vehicle speed (m/s) and L is vehicle length (m).
The calculated parameters of traffic load model are summarized in Table 4.
4 Simulation Calculation of Vehicle Load
4.1 Distribution Mode of Vehicle Load
Traffic volume has to be considered when studying traffic load in SFTs. Traffic volume was defined as the number of vehicles passing through a road section in a unit time. In the SFT numerical model developed in this research, traffic volume was assumed as the number of vehicles passing through an SFT section at a constant speed within a specified time.
In order to simulate different traffic volumes, differrent numbers of vehicles were assumed to pass through SFT section at the constant speed of 80 km/h in both directions. The number of vehicles was adjusted by changing the distance between adjacent vehicles and two traffic loading modes of two-way single-vehicle and two-way multi-vehicle were adopted, as shown in Figs. 9 and 10, respectively; the two-way multi-vehicle type included vehicle intervals of 60, 40 and 20 m. As this spacing was decreased, vehicle density and traffic volume were increased.
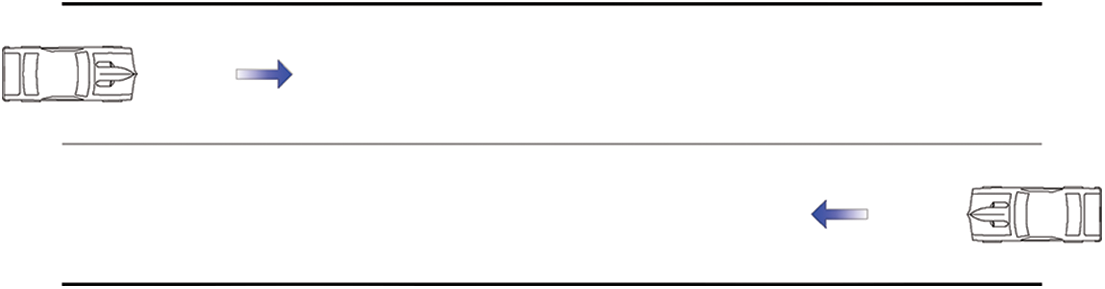
Figure 9: Schematic diagram of two-way single vehicle model
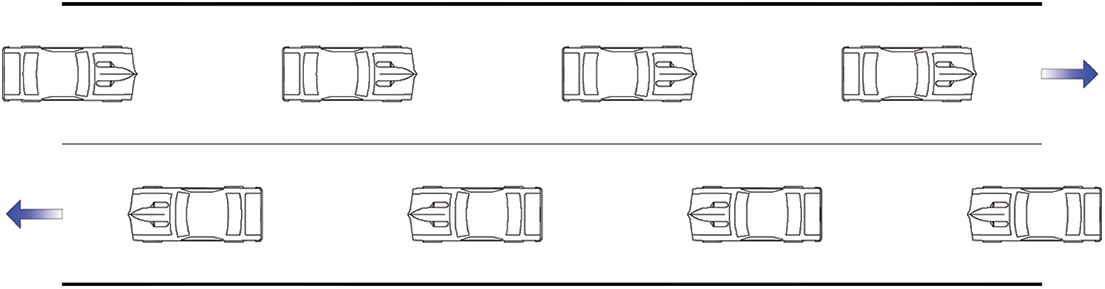
Figure 10: Schematic diagram of two-way multi-vehicle model
In this research, vibration displacements at mid-span of SFT structures under different traffic volumes were analyzed. When there was no traffic load, the dynamic response increments of SFT under the actions of different traffic volumes were calculated and the influences of different traffic load modes on dynamic responses were studied. Dynamic response increments are shown in Figs. 11 and 12.
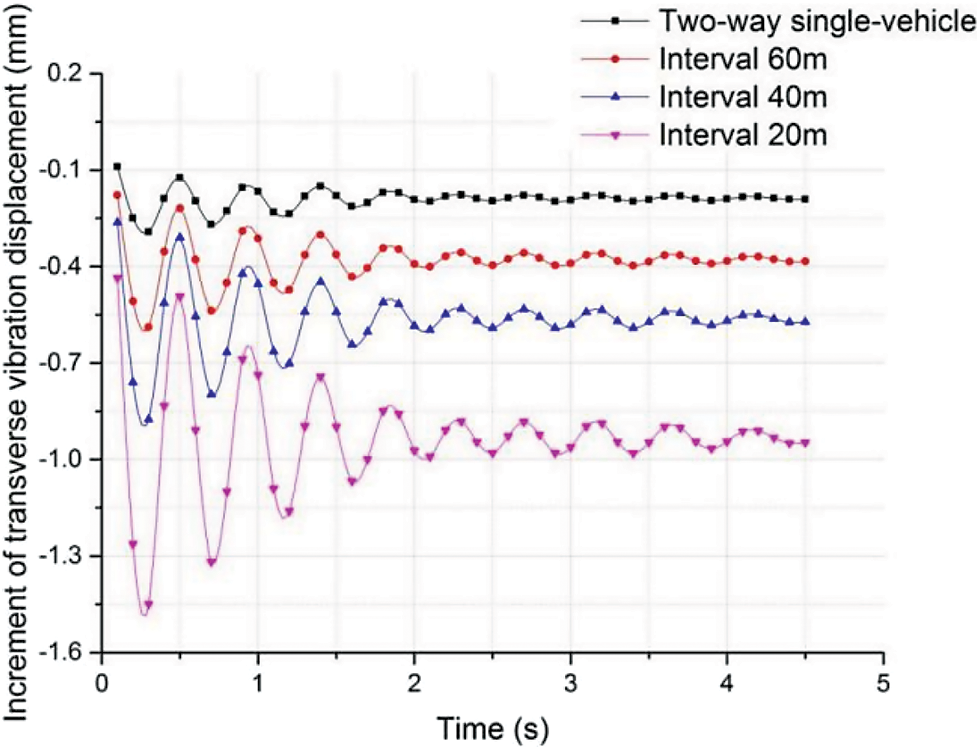
Figure 11: Influences of different traffic loading models on transverse vibration displacements
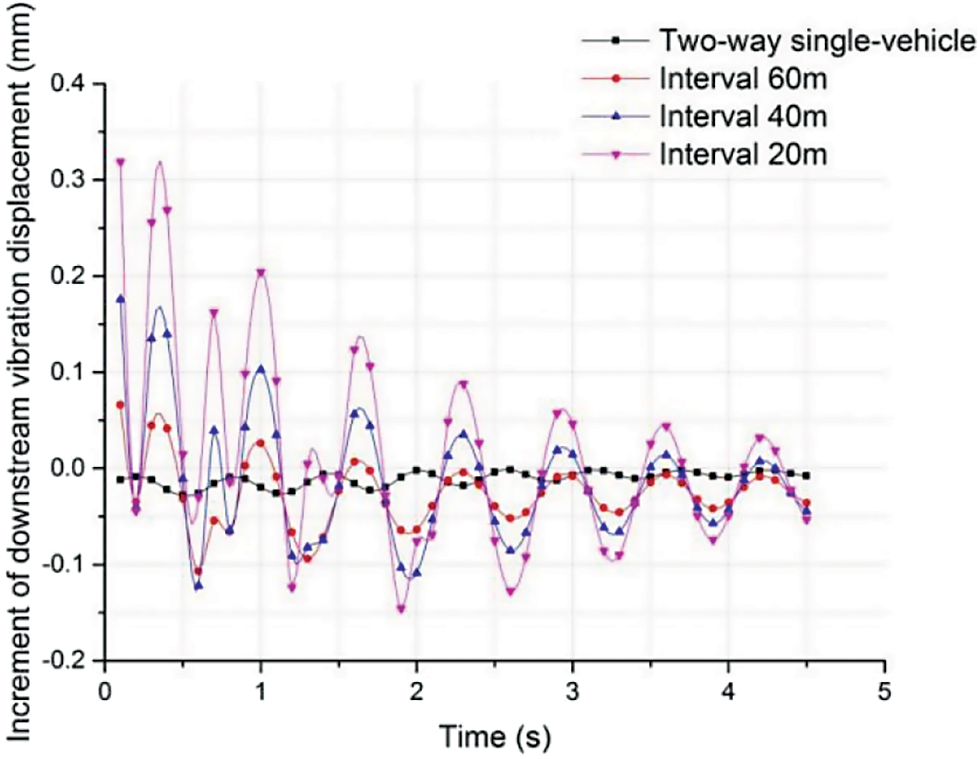
Figure 12: Influence of traffic loading model on downstream vibration displacement
It was seen from Fig. 11 that higher traffic volumes enhanced the increment of transverse vibration displacement at the mid-span of pipe and increment curve amplitude was also proportional to the number of vehicles. Shortly after the vehicle entered the pipe, the increment of transverse vibration displacement at mid-span reached its peak value. Then, incremental amplitude was gradually decreased. When all vehicles were driving inside the pipe, the incremental amplitude of transverse vibration displacement remained stable. This indicated that the increment of transverse vibration displacement was related to the number of vehicles in the pipe; that is, if the number of vehicles in pipe was constant, the increment of transverse vibration displacement remained stable and was proportional to the number of vehicles.
It was seen from Fig. 12 that the amplitude of vibration displacement increment curve along the longitudinal direction of mid-span was smaller than that of transverse vibration displacement increment curve in Fig. 10. The influence of traffic volume on longitudinal vibration displacement was lower than that on transverse vibration displacement. By shortening traffic interval, i.e., the increase of traffic volume, the increment of the transverse vibration displacement of the pipe was also increased. However, the influence of traffic volume on downstream vibration displacement was not stable, as shown in Fig. 12, and the increment of downstream vibration displacement was alternately changed between positive and negative values, which could be due to horizontal force.
4.2 Impact Effect of Vehicle Load
In the process of driving, even when the vehicle is in starting, stopping and other braking states, vehicle tires have impacts on road surface due to uneven road surface. In this section, the influence of the impact caused by vehicle in SFT on the dynamic responses of the structure is studied.
According to simplified SFT model, a middle pipe segment was regarded as a continuous beam structure and the connection between anchor cable and pipe segment was assumed as the fulcrum of continuous beam. Considering the mechanical characteristics of continuous beam and the vibration mode of pipe segment in modal analysis, it was proposed to add impact load at the L/4 and mid-span of pipe segment to simulate the braking behavior of vehicles. It was assumed that two vehicles were driving towards each other at the constant speed of 80 km/h from the two ends of the pipe, then braked at the L/4 and mid-span of the pipe. Impact load was added into a short period of time (0.1 s) which was obtained by dynamic increment multiplying the moving vibration load when driving at constant speed. The schematic diagram of impact action of traffic load is presented in Fig. 13.
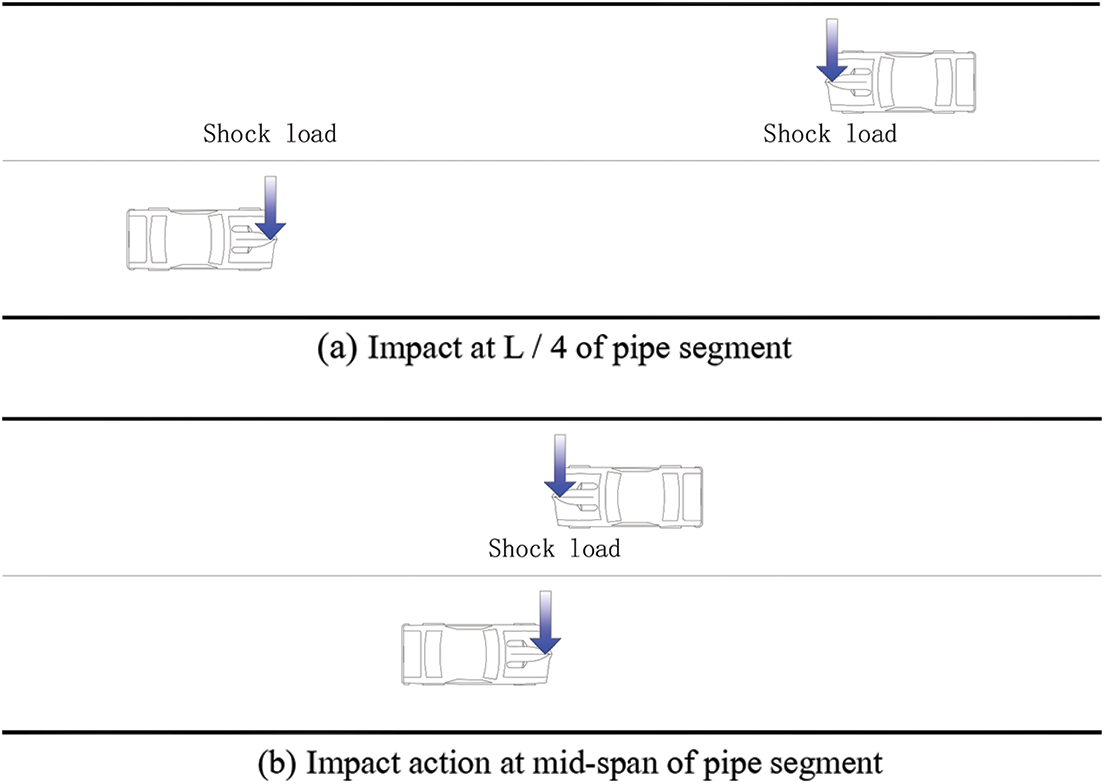
Figure 13: Traffic load impact diagram
Dynamic response increments of SFT under two different impact loading conditions were calculated, as shown in Figs. 14 and 15.
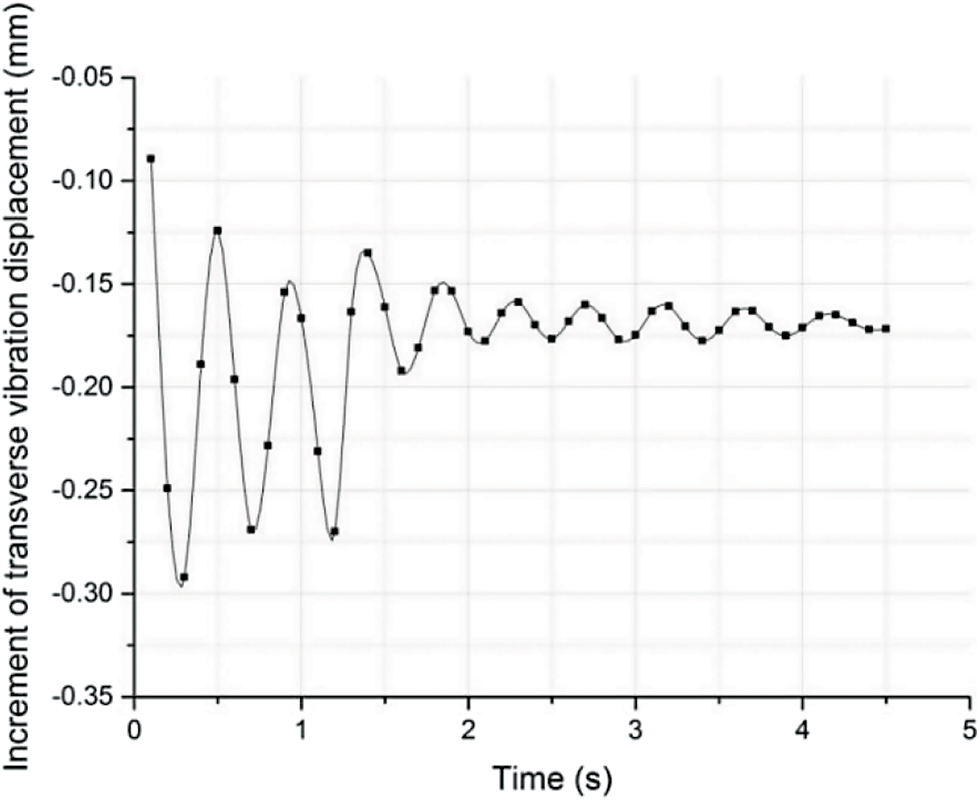
Figure 14: Effect of impact at L/4 of pipe segment on transverse vibration displacement
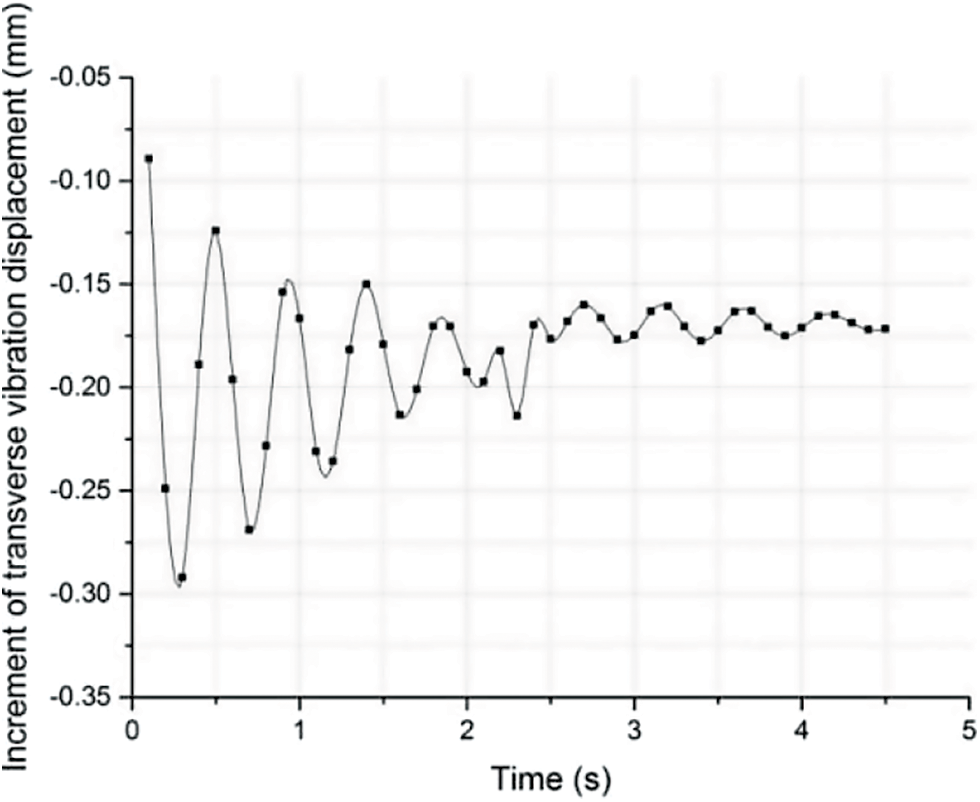
Figure 15: Effect of impact at mid-span of pipe segment on transverse vibration displacement
It was seen from Figs. 14 and 15 that after traffic load impact was applied at L/4 and mid-span of the pipe segment, the increment of the transverse vibration displacement of the section was significantly enhanced. Static and instantaneous dynamic displacement increments of this section were 1.145 and 1.212, respectively, which showed that the effect of static displacement was greater than that of dynamic increment of traffic impact load.
4.3 Influence of Traffic Load in Ultimate Condition
In order to study the dynamic responses of SFTs under ultimate traffic load condition, three different traffic load conditions were designed according to China’s Highway Bridge Load Test Regulations (JTG/T J21-01-2015) [29]. The traffic load parameters simulated in this paper included one-way, two-way syntropy and two-way reserve distributions, as shown in Fig. 16.
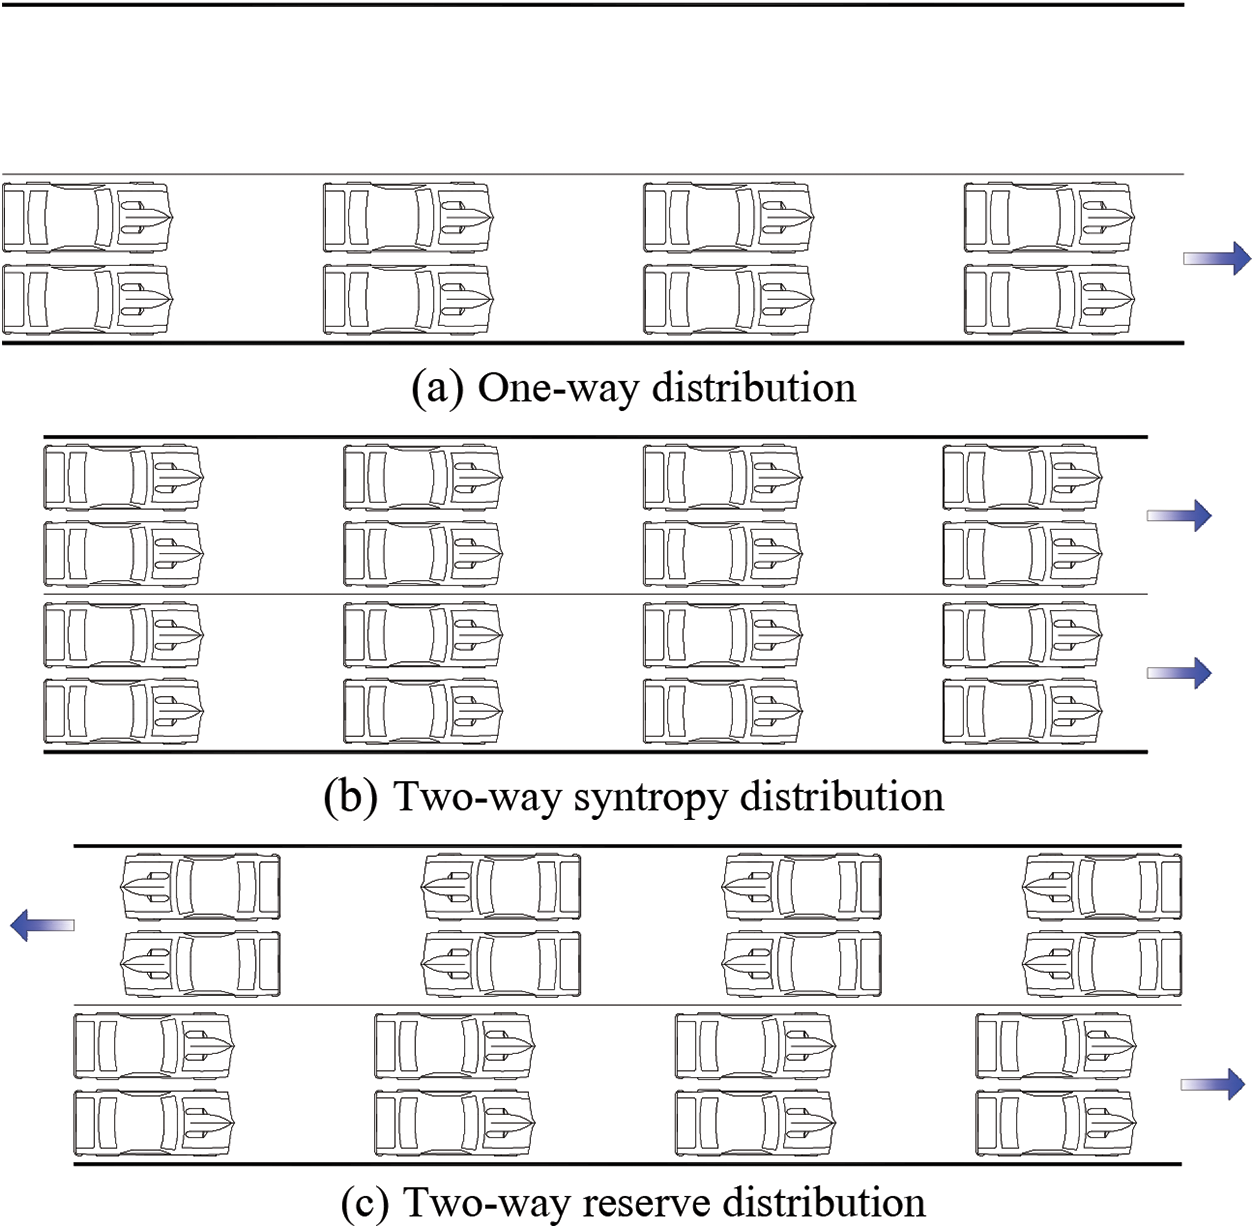
Figure 16: Ultimate traffic load conditions
Under the action of three different traffic load ultimate conditions, the dynamic response increments of vibration displacements along mid-span transverse and downstream directions were calculated; the obtained results are shown in Figs. 17 and 18.
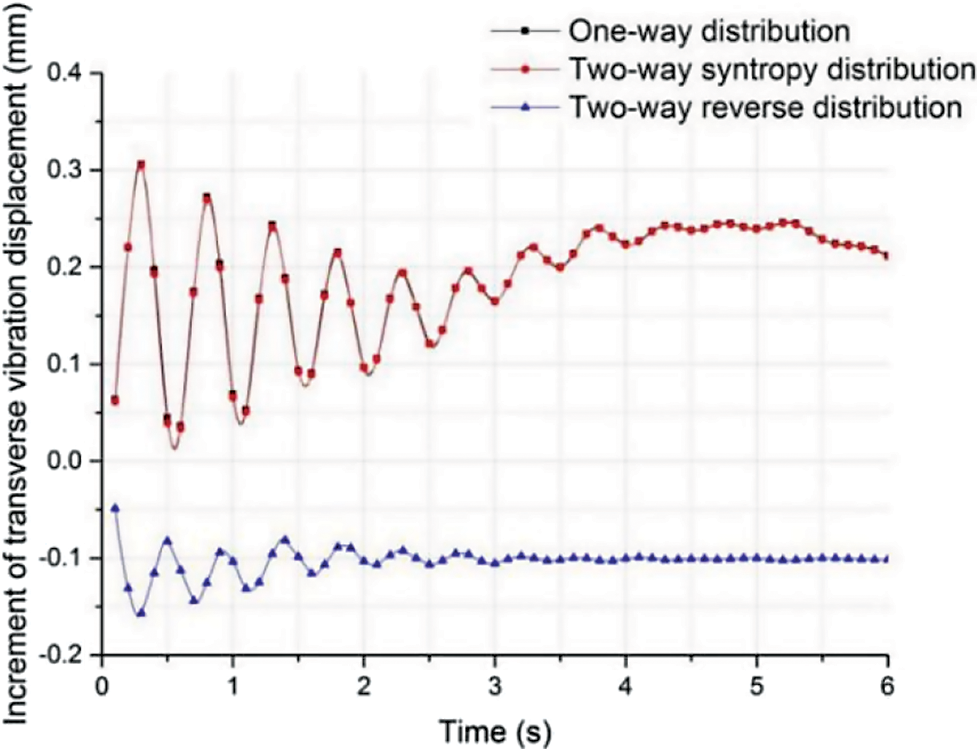
Figure 17: Influence of traffic ultimate condition on transverse vibration displacement at mid-span
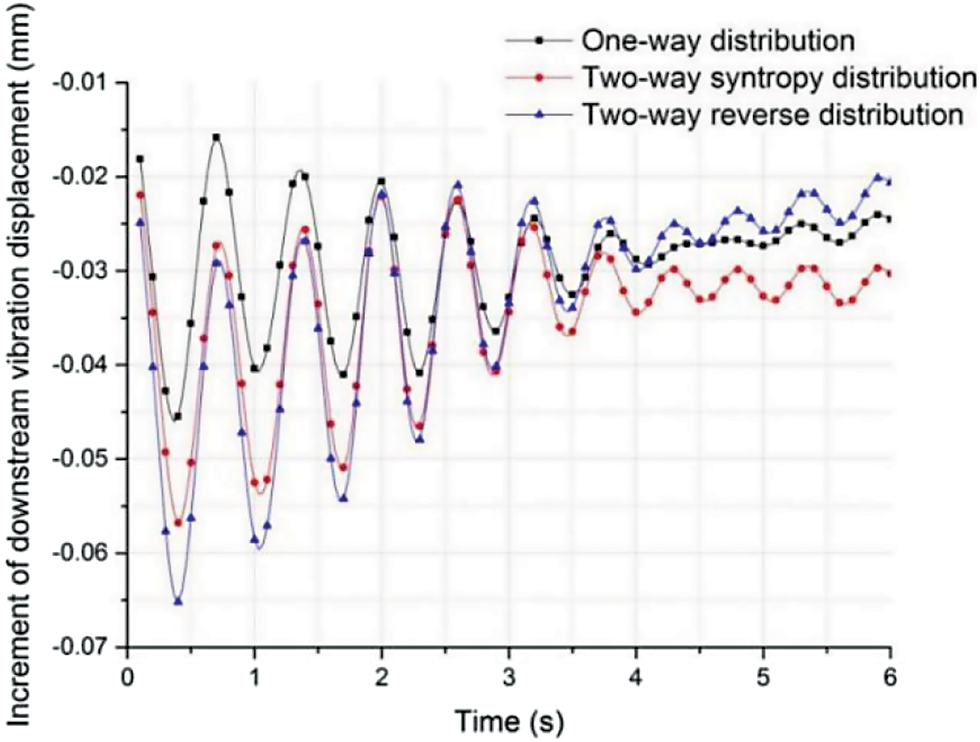
Figure 18: Influence of traffic ultimate condition on downstream vibration displacement at mid-span
It was seen from Fig. 17 that under the ultimate traffic load conditions of one-way and two-way syntropy distributions, vibration displacement increments at transverse direction mid-span was positive with the maximum amplitude of 0.31 mm. This indicated that one-way and two-way syntropy distributions could enhance the transverse vibrations of the middle span of the pipe.
Under the ultimate traffic load condition of two-way reverse distribution, the incremental value of transverse vibration displacement in the mid-span was negative with the maximum amplitude of −0.16 mm, indicating that two-way reverse distribution suppressed transverse vibrations in mid-span. According to existing research results, two-way reverse distribution was closest to real traffic flow and transverse vibration displacement of pipe section in mid-span was mainly influenced by anchor cable material. Therefore, in SFT design, as long as the anchor cable parameters were properly selected, internal traffic load was in the form of normal traffic flow, which could restrain the transverse vibration of SFT to a certain extent.
It was seen from Fig. 18 that the amplitudes of downstream vibration displacement increment curves were all less than 0.1 mm, which could be ignored. Among the mentioned three traffic load conditions, the incremental amplitude caused by two-way reverse distribution was high and its stability was lower than those of the other two ultimate traffic load conditions.
In this research, finite element analysis method was applied to investigate the influences of traffic load distribution mode, impact action and limit condition on the dynamic responses of SFT structures and the following conclusions were drawn:
1. In traffic load distribution mode, the number of vehicles per unit distance was proportional to the amplitude of the dynamic response increment of SFT. Vehicle spacing encryption had a certain suppression effect on transverse vibration displacement in the mid-span of pipe, while it had unstable effect on downstream vibration displacement. The amplitudes of downstream vibration displacement increment curves varied greatly, which might be caused by the horizontal force of traffic load.
2. The impact of traffic load had an obvious enhancement effect on the transverse vibration displacement increment of the cross section. When a vehicle braked at L/4 and L/2 sections, the dynamic increments of transverse vibration displacements of the sections were 1.145 and 1.212, respectively. This indicated that traffic load had a certain influence on the dynamic response of SFT.
3. Under ultimate traffic load condition, one-way and two-way syntrop distributions promoted the dynamic responses of SFT, while two-way reverse distribution inhibited the increase of dynamic response.
Funding Statement: This research was supported by Chongqing Natural Science Foundation (Grant No. cstc2020jcyj-msxmX0923).
Conflicts of Interest: The authors declare that they have no conflicts of interest to report regarding the present study.
References
1. Håvard, Ø. (2010). When is SFT competitive? Procedia Engineering, 4, 3–11. DOI 10.1016/j.proeng.2010.08.003. [Google Scholar] [CrossRef]
2. Xiang, Y., Yang, Y. (2016). Challenge in design and construction of submerged floating tunnel and state-of-art. Procedia Engineering, 166, 53–60. DOI 10.1016/j.proeng.2016.11.562. [Google Scholar] [CrossRef]
3. Jin, C., Kim, M. H. (2020). Tunnel-mooring-train coupled dynamic analysis for submerged floating tunnel under wave excitations. Applied Ocean Research, 94, 102008. DOI 10.1016/j.apor.2019.102008. [Google Scholar] [CrossRef]
4. Won, D., Seo, J., Kim, S., Park, W. S. (2019). Hydrodynamic behavior of submerged floating tunnels with suspension cables and towers under irregular waves. Applied Sciences, 9, 5494. DOI 10.3390/app9245494. [Google Scholar] [CrossRef]
5. Chen, Z., Xiang, Y., Lin, H., Yang, Y. (2018). Coupled vibration analysis of submerged floating tunnel system in wave and current. Applied Sciences, 8, 1311. DOI 10.3390/app8081311. [Google Scholar] [CrossRef]
6. Muhammad, N., Ullah, Z., Choi, D. H. (2017). Performance evaluation of submerged floating tunnel subjected to hydrodynamic and seismic excitations. Applied Sciences, 7, 1122. DOI 10.3390/app7111122. [Google Scholar] [CrossRef]
7. Jin, C., Bakti, F. P., Kim, M. (2021). Time-domain coupled dynamic simulation for SFT-mooring-train interaction in waves and earthquakes. Marine Structures, 75, 102883. DOI 10.1016/j.marstruc.2020.102883. [Google Scholar] [CrossRef]
8. Jin, C., Kim, M. (2021). The effect of key design parameters on the global performance of submerged floating tunnel under target wave and earthquake excitations. Computer Modeling in Engineering & Sciences, 128(1), 315–337. DOI 10.32604/cmes.2021.016494. [Google Scholar] [CrossRef]
9. Yarramsetty, P. C. R., Domala, V., Poluraju, P., Sharma, R. (2019). A study on response analysis of submerged floating tunnel with linear and nonlinear cables. Ocean Systems Engineering, 9, 219–240. DOI 10.12989/ose.2019.9.3.219. [Google Scholar] [CrossRef]
10. Cifuentes, C., Kim, S., Kim, M., Park, W. (2015). Numerical simulation of the coupled dynamic response of a submerged floating tunnel with mooring lines in regular waves. Ocean Systems Engineering, 5, 109–123. DOI 10.12989/ose.2015.5.2.109. [Google Scholar] [CrossRef]
11. Chen, X., Chen, Q., Chen, Z., Cai, S., Zhuo, X. et al. (2021). Numerical modeling of the interaction between submerged floating tunnel and surface waves. Ocean Engineering, 220, 108494. DOI 10.1016/j.oceaneng.2020.108494. [Google Scholar] [CrossRef]
12. Zhang, H., Yang, Z., Li, J., Yuan, C., Xie, M. et al. (2021). A global review for the hydrodynamic response investigation method of submerged floating tunnels. Ocean Engineering, 225, 108825. DOI 10.1016/j.oceaneng.2021.108825. [Google Scholar] [CrossRef]
13. Tariverdilo, S., Mirzapour, J., Shahmardani, M., Shabani, R., Gheyretmand, C. (2011). Vibration of submerged floating tunnels due to moving loads. Applied Mathematical Modeling, 35(11), 5143–5425. DOI 10.1016/j.apm.2011.04.038. [Google Scholar] [CrossRef]
14. Liang, B., Jiang, B. (2017). Study on traffic load simulation method of submerged floating tunnel. Tunnel Construction, 37(10), 1232–1238. DOI 10.3973/j.issn.1672-741X.2017.10.005. [Google Scholar] [CrossRef]
15. Mulas, M., Martinelli, L., Palama, G. (2018). Dynamic interaction with travelling vehicles in a submerged floating tunnel. In: Maintenance, safety, risk, management and life-cycle performance of bridges, pp. 838–844. CRC Press, Taylor & Francis Group. [Google Scholar]
16. Xiang, Y., Lin, H., Bai, B., Chen, Z., Yang, Y. (2021). Numerical simulation and experimental study of submerged floating tunnel subjected to moving vehicle load. Ocean Engineering, 235, 109431. DOI 10.1016/j.oceaneng.2021.109431. [Google Scholar] [CrossRef]
17. Lin, H., Xiang, Y., Yang, Y. (2019). Vehicle-tunnel coupled vibration analysis of submerged floating tunnel due to tether parametric excitation. Marine Structures, 67, 646–659. DOI 10.1016/j.marstruc.2019.102646. [Google Scholar] [CrossRef]
18. Mohammad, R. S., Seyed, M., Mohammad, R. Z. (2022). A numerical approach for coupled analysis of the seismic response of a cable-moored submerged floating tunnel. Marine Structures, 83, 103156. DOI 10.1016/j.marstruc.2021.103156. [Google Scholar] [CrossRef]
19. Zou, P., Jeremy, D., Chen, L., Wim, S., Carlos, S. (2022). Response of a submerged floating tunnel subject to flow-induced vibration. Engineering Structures, 253, 113809. DOI 10.1016/j.engstruct.2021.113809. [Google Scholar] [CrossRef]
20. Luo, G., Pan, S. K., Zhang, Y. L., Ren, Y., Xiong, K. (2021). Displacement response of submerged floating tunnel with flexible boundary under explosion load. Advances in Structural Engineering, 24(2), 346–358. DOI 10.1177/1369433220950612. [Google Scholar] [CrossRef]
21. Suri, Y., Islam, S. Z., Hossain, M. (2020). Numerical modelling of proppant transport in hydraulic fractures. Fluid Dynamics & Materials Processing, 16(2), 297–337. DOI 10.32604/fdmp.2020.08421. [Google Scholar] [CrossRef]
22. Lopez, N. S., Galeos, S. K., Calderon, B. R., Dominguez, D. R., Uy, B. J. et al. (2021). Computational fluid dynamics simulation of indoor air quality and thermal stratification of an underfloor air distribution system (UFAD) with various vent layouts. Fluid Dynamics & Materials Processing, 17(2), 333–347. DOI 10.32604/fdmp.2021.011213. [Google Scholar] [CrossRef]
23. Jin, R., Gou, Y., Geng, B., Liu, Y. (2020). Coupled dynamic analysis for wave action on a tension leg-type submerged floating tunnel in time domain. Ocean Engineering, 212, 107600. DOI 10.1016/j.oceaneng.2020.107600. [Google Scholar] [CrossRef]
24. Xiang, Y., Chen, Z., Bai, B., Lin, H., Yang, Y. (2020). Mechanical behaviors and experimental study of submerged floating tunnel subjected to local anchor-cable failure. Engineering Structures, 212, 110521. DOI 10.1016/j.engstruct.2020.110521. [Google Scholar] [CrossRef]
25. Kim, G., Kwak, H., Jin, C., Kang, H., Chung, W. (2021). Three-dimensional equivalent static analysis for design of submerged floating tunnel. Marine Structures, 80, 103080. DOI 10.1016/j.marstruc.2021.103080. [Google Scholar] [CrossRef]
26. Won, D., Seo, J., Kim, S. (2021). Dynamic response of submerged floating tunnels with dual sections under irregular waves. Ocean Engineering, 241, 110025. DOI 10.1016/j.oceaneng.2021.110025. [Google Scholar] [CrossRef]
27. Luo, G., Zhang, Y., Ren, Y., Guo, Z., Pan, S. (2021). Dynamic response analysis of submerged floating tunnel under impact-vehicle load action. Applied Mathematical Modelling, 99, 346–358. DOI 10.1016/j.apm.2021.06.024. [Google Scholar] [CrossRef]
28. Liang, B., Luo, H., Sun, C. (2006). Simulated study on vibration load of high speed railway. Journal of the China Railway Society, 28(4), 89–94. [Google Scholar]
29. Code for load test of highway bridges. JTG/T J21-01-2015. Beijing: Renming Jiaotong Press. [Google Scholar]
 | This work is licensed under a Creative Commons Attribution 4.0 International License, which permits unrestricted use, distribution, and reproduction in any medium, provided the original work is properly cited. |