| Fluid Dynamics & Materials Processing |
DOI: 10.32604/fdmp.2023.020953
ARTICLE
Effect of Refrigerant on the Performance of a C3/MRC Liquefaction Process
Shandong Institute of Petroleum and Chemical Technology, Dongying, 257061, China
*Corresponding Author: Xiao Wu. Email: slxywuxiao@163.com
Received: 11 December 2021; Accepted: 24 January 2022
Abstract: The Mixed Refrigerant (MR) component is an important factor influencing the performances of natural gas liquefaction processes. However, there is a lack of systematic research about the utilization of propane pre-cooled (C3/MRC). In this paper, this mixed refrigerant cycle liquefaction process is simulated using the HYSYS software and the main influential parameters involved in the process are varied to analyze their influence on the liquefaction rate and power consumption. The results show that an effective way for lowering the power consumption of the compressor consists of reducing the flow through the compressor through optimization of the percentage of mixed refrigerant. The power consumption of the compressor in the hybrid refrigeration process is affected by both flow and pressure ratios. Its specific power consumption can be reduced by increasing the flow and decreasing the pressure ratio at the same time. The increase in refrigerant pressure at the high-pressure end can significantly mitigate the energy loss of the heat exchanger and compressor.
Keywords: Refrigerant; C3/MRC process; liquefaction performance; power consumption; pressure ratio; hybrid refrigeration process
Natural gas is an important and clean fossil energy source that accounts for a considerable proportion of the world energy structure [1,2]. In recent years, LNG (Liquefied Natural Gas) technology has become an emerging industry with rapid development prospects due to its small volume, high calorific value and ease of storage. LNG technology cannot only solve the problems of natural gas storage and transportation, but can also be widely used in natural gas peak shaving, cold energy utilization and other fields. Natural gas liquefaction technology is an important link in LNG production. However, the liquefaction cost is high and requires a significant amount of energy. According to statistics, the cost of refrigeration and LNG accounts for approximately 42% of the total cost of the LNG supply chain [3]. The high cost related to refrigeration and liquefaction is mainly due to the high energy consumption of the compressor [4]. Reduction in the compression energy consumption of the natural gas liquefaction process will reduce the overall cost of producing unit LNG products, which will enhance the competitiveness of the LNG industry and promote natural gas trade.
The liquefaction of natural gas is the core of the LNG production industry. Currently, mature natural gas liquefaction processes include the cascade liquefaction process [5], Mixed Refrigerant Cycle (MRC) liquefaction process [6], and liquefaction process with an expander [7]. In recent years, several studies have proposed applying supersonic cyclone technology to the natural gas liquefaction process to significantly reduce the floor area [8–11]. The most widely used liquefaction cycle in the natural gas liquefaction process is the mixed refrigerant cycle liquefaction process [12,13].
Considerable research work has been conducted to introduce optimization in the mixed refrigerant cycle liquefaction process, such as genetic algorithms [14] and mixed-integer nonlinear programming [15]. Shirazi et al. [16] compared the optimal parameters (compressor outlet pressure and mixed refrigerant composition) based on different objective functions for the single mixed refrigerant (SMR) liquefaction process. Hatcher et al. [17] optimized the composition of mixed refrigerants in a propane precooled process and compared it with the results in the literature. Xu et al. [18] studied the effects of nitrogen, methane, ethylene, propane and isopentane concentrations on the PRICO natural gas liquefaction process. However, there is a lack of systematic research to evaluate the effects of refrigerants on the liquefaction performance of the mixed refrigerant liquefaction process with precooled propane (C3/MRC). In this paper, the mixed refrigerant cycle liquefaction process is simulated using the HYSYS process simulation software, and the main logistics parameters involved in the process, such as the natural gas feed pressure, high-pressure refrigerant pressure and low-pressure refrigerant pressure, are varied to analyse their influences on the liquefaction rate and power consumption of the process.
2 Process Model Establishment of the C3/MRC Liquefaction Process
2.1 Analysis of Process Characteristics
In recent decades, several liquefaction processes (cascade, SMR, C3/MRC, DMR (double mixed refrigerant), and expander) have been developed and applied to natural gas liquefaction. Each liquefaction process has different advantages, disadvantages and application scopes. Assuming that the energy consumption of the cascade refrigeration cycle liquefaction process is 1, Table 1 compares the relative energy consumption and characteristics of various liquefaction processes.
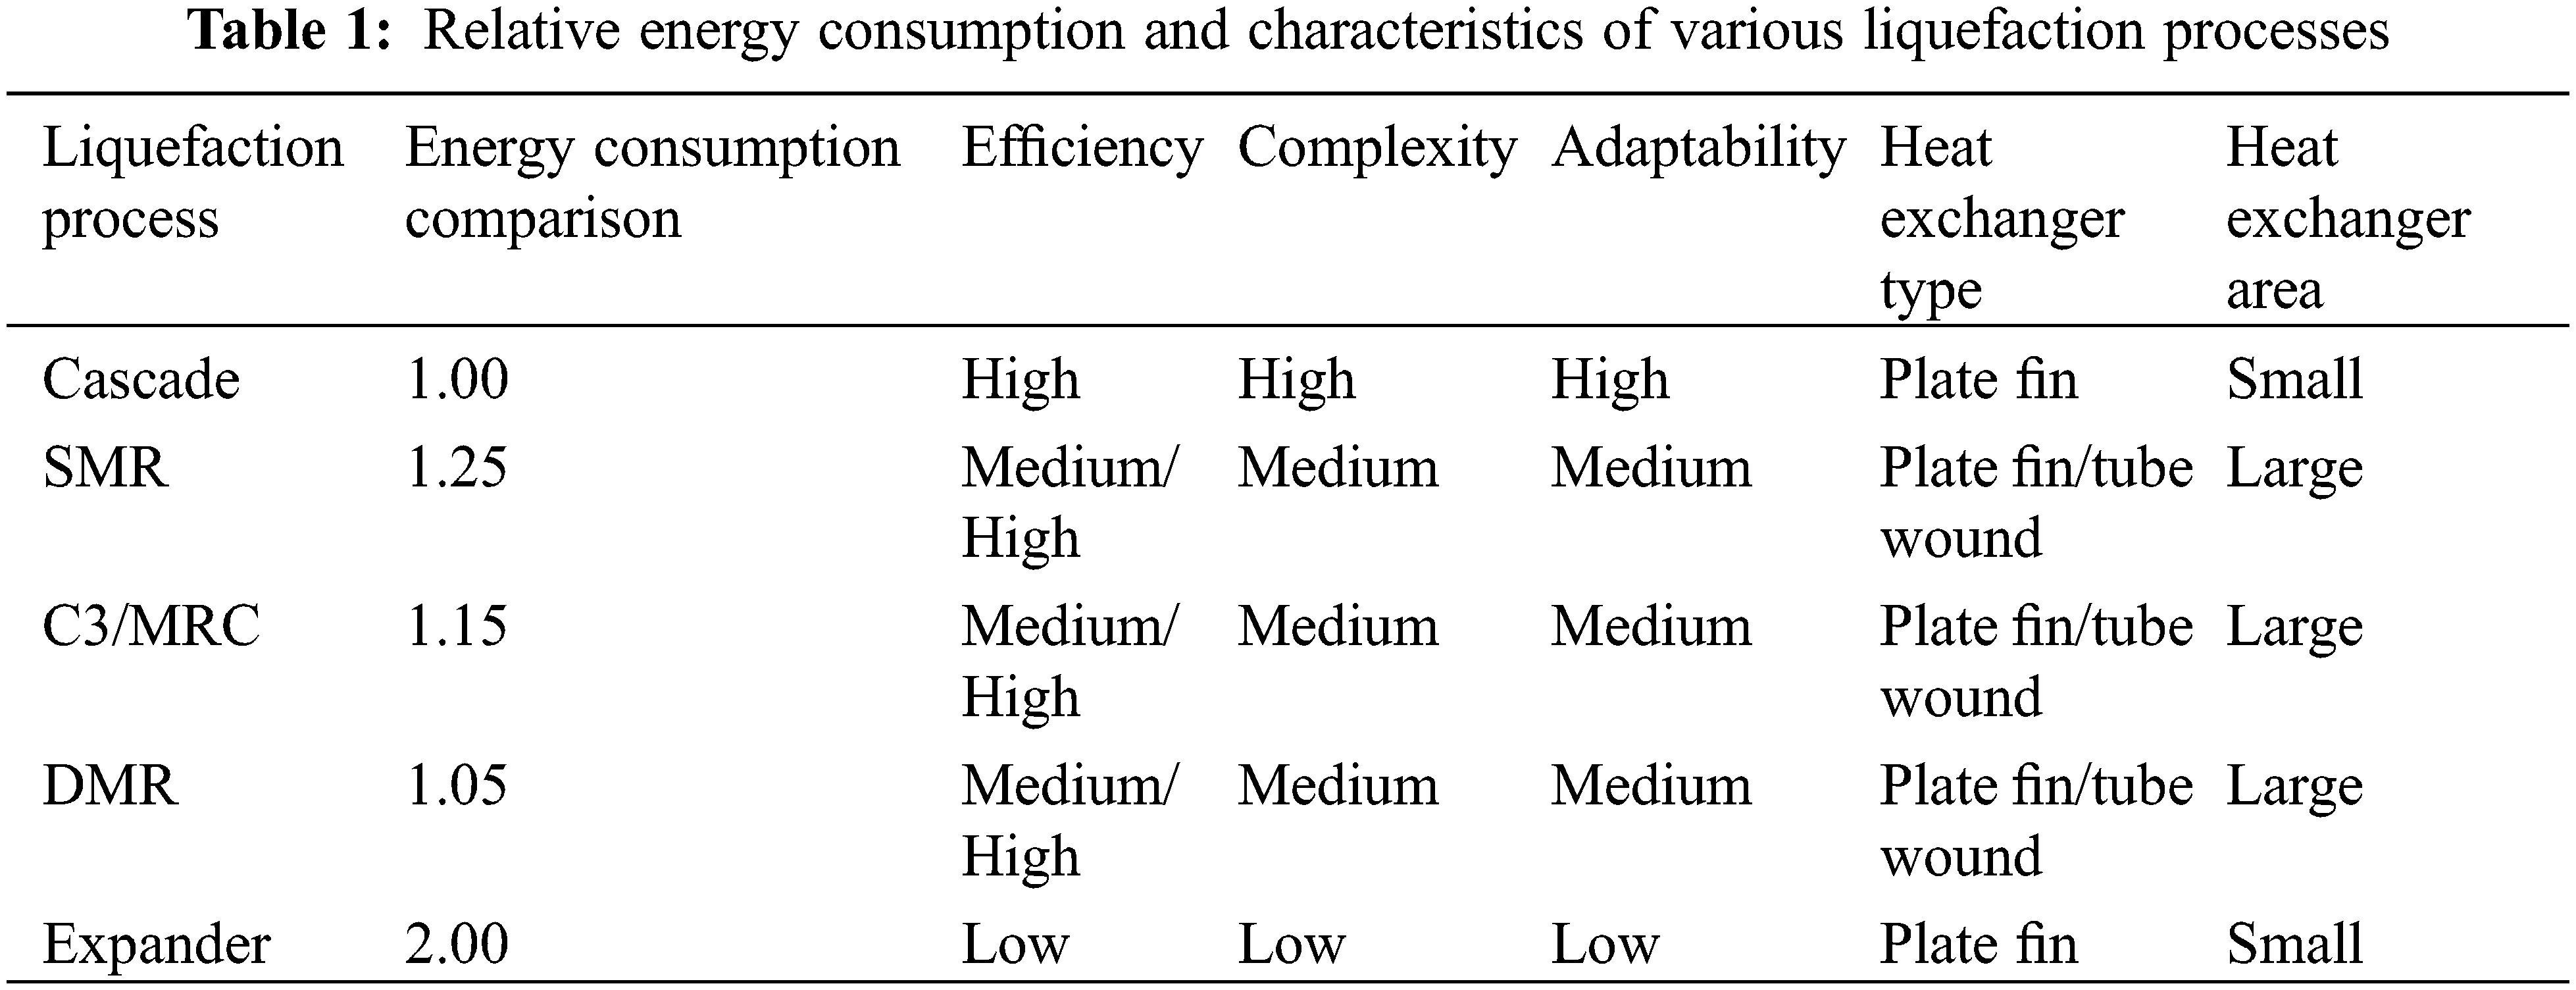
The comprehensive comparative analysis shows that the MRC process offers unique advantages in terms of energy consumption, liquefaction efficiency and process complexity. In particular, the C3/MRC process combines the advantages of the cascade liquefaction process and mixed refrigerant liquefaction process, and the process is simple and efficient [19]. Presently, more than 80% of basic load natural gas liquefaction units in the world adopt the C3/MRC liquefaction process. Therefore, the parameters of the C3/MRC liquefaction process are investigated in this paper to promote energy savings and consumption reduction [20].
2.2 Analysis of Refrigerants Used in the C3/MRC Process
As shown in Fig. 1, the C3/MRC process is mainly divided into three parts: (1) propane precooling cycle: precooling the feed gas and mixed refrigerants; (2) mixed refrigerant circulation: providing cooling capacity for liquefied and cryogenic natural gas; and (3) the main cycle of natural gas liquefaction. In this process, the mixed refrigerant is pressurized by a two-stage compressor and cooled by water to provide cooling capacity for natural gas, and the natural gas precooled by propane is cooled and liquefied. In the C3/MRC process, the energy consumption of the compressor is large, and the main factors affecting its energy consumption are the pressure and the composition of mixed refrigerants. Different influencing factors have different effects on energy consumption, and the interaction between various influencing factors is complex. Therefore, it is necessary to determine the optimal operation parameters of the process and to obtain the optimal refrigerant composition to reduce the energy consumption and operation costs in the process of natural gas liquefaction.
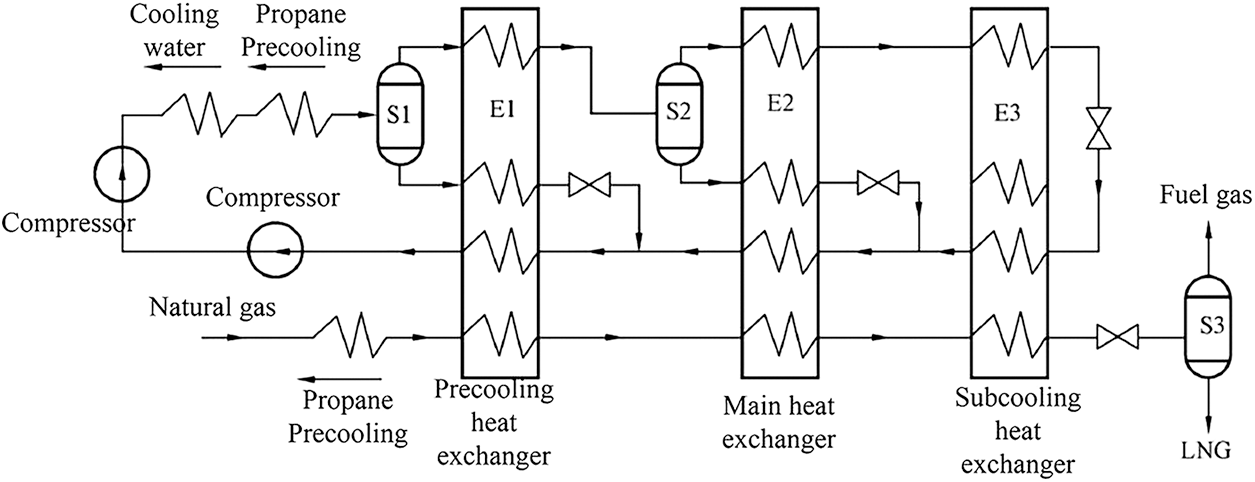
Figure 1: Flow diagram of the C3/MRC process
Generally, the more refrigerant components there are, the more uniform the heat exchange temperature difference in the heat exchanger and the lower the energy consumption. However, the refrigerant ratio has a significant impact on the system energy consumption. An unreasonable ratio of mixed refrigerant will increase the heat exchange temperature difference in the plate-fin heat exchanger, the mixed refrigerant flow required for LNG and the process energy consumption. Therefore, it is important to select an appropriate refrigerant and ratio to reduce system energy consumption [21].
The refrigerant should be selected according to the following principles: (1) The melting point of the refrigerant should be low to ensure that it does not condense in the refrigeration temperature zone. (2) The selected refrigerant requires a large gasification latent heat, high boiling point and large boiling point difference between adjacent components. (3) Selecting refrigerants with overlapping temperature zones should be avoided [22].
2.3 Process Flow Establishment
In this paper, the C3/MRC process of the APCI Company in the United States is simulated, as shown in Fig. 2.
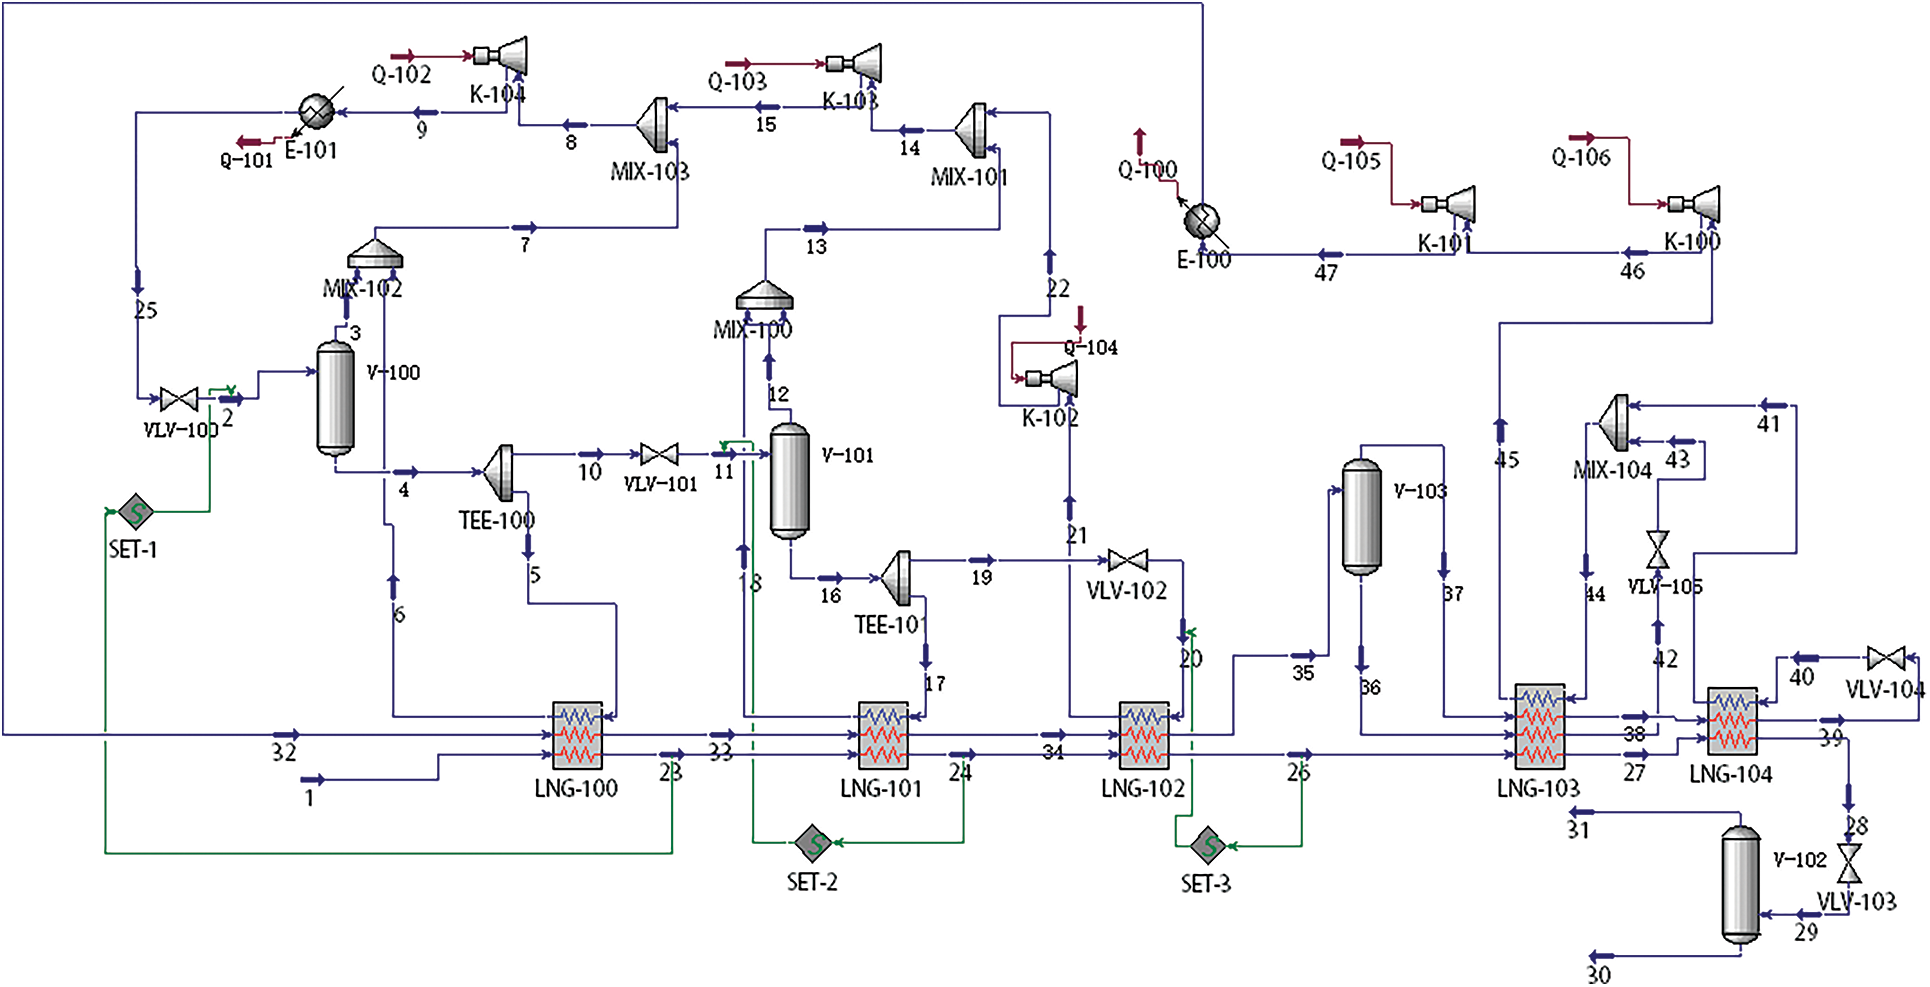
Figure 2: Simulation flow chart of the C3/MRC process established by HYSYS software
In the propane precooling cycle, the feed gas and the mixed refrigerant are gradually cooled to –35°C to reduce the working heat load of the mixed refrigeration cycle. In the first stage, the high-pressure gaseous propane from compressor K-104 is cooled by cooler E101, which becomes high-pressure liquid propane at room temperature. The liquid propane becomes two-phase gas–liquid after initial temperature and pressure reduction through the throttle valve VLV-100 and then flows into the gas–liquid separator V-100 for separation. The liquid phase separated from V-100 is divided into two parts. One part is used to provide cooling capacity for the primary propane evaporator, i.e., LNG-100, and the other part enters the second stage. After throttling, the second part of the liquid phase provides cooling capacity with lower temperature for the secondary propane evaporator, i.e., LNG-101. Once the gas phase separated from V-100 is mixed with the gaseous propane from LNG-100, it is mixed with the reflux gas and fed into the compressor for pressurization. The propane processes in the second and third stages are the same as that in the first stage. However, with the increase in the number of stages, both the pressure and the temperature providing cooling capacity decrease.
In mixed refrigerant circulation, the low-pressure refrigerant is compressed by two-stage compressors K-100 and K-101 and cooled to approximately room temperature by the cooler. Due to the low molecular weight, the mixed refrigerant can become two-phase gas–liquid only after the propane precooling cycle. Thus, it is further cooled to approximately –30°C and then circulated to gas–liquid separation unit V-103 to separate the two-phase gas–liquid. The liquid phase generated after treatment by two-phase gas–liquid separation device V-103 is subcooled by LNG-103 and further reduced by a throttle valve. Next, after being fused with the subsequent reverse flow refrigerant, the feed gas, high-pressure gas-phase mixed refrigerant and high-pressure liquid mixed refrigerant are cooled. After the high-pressure gaseous mixed refrigerant at the outlet of heat exchanger LNG-103 is further cooled by LNG-104 and depressurized and cooled by the throttle valve VLV-105, the logistics to be cooled in the heat exchanger will be reduced to a lower temperature level.
In the natural gas liquefaction circuit, after the feed gas passes through three propane evaporators and two LNG heat exchangers circulating mixed refrigerant, most of the natural gas is liquefied. After reducing the storage pressure through the throttle valve, the liquefied gas is connected to the LNG storage tank for storage.
The specific exergy can be obtained by the following formula:
where, ex is the unit mass exergy; h is the unit mass enthalpy; T is the temperature; s is the entropy.
The boosters, expanders, water coolers, LNG heat exchanger and valves in the liquefaction process will generate exergy losses. The specific exergy losses can be written by:
The exergy utilization rate is adopted to measure the exergy utilizing in the open system. It is defined as the rate of the amount of utilizing exergy and the total amount of exergy. The amount of utilizing exergy is given by:
The total amount of exergy is:
where, ṁ is the mass flow rate.
The outlet exergy of the liquefaction process is:
The exergy losses in the liquefaction process is:
As a consequence, the exergy utilization rate can be given by:
where, ηe is the exergy utilization rate.
2.5 Setting of the Initial Parameters
There are three types of parameters to be set in the simulation process: feed gas parameters, process parameters and equipment parameters.
(1) Feed gas parameters
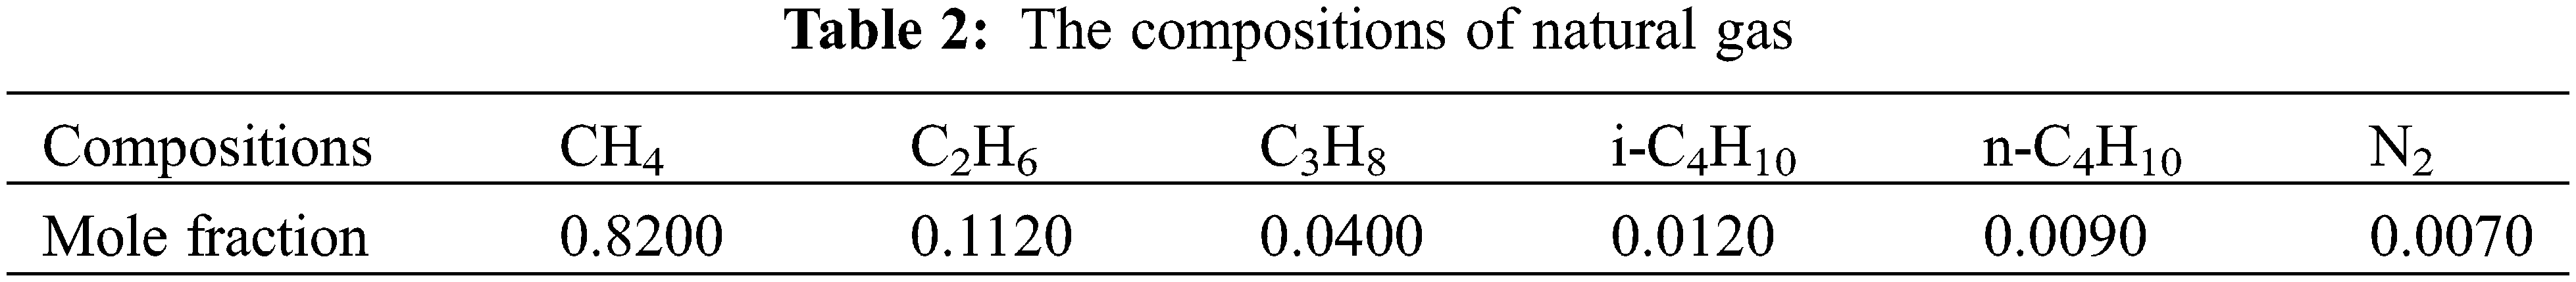
The temperature of natural gas is 35°C, the pressure is 4 MPa, the storage pressure of liquefied natural gas is 0.15 MPa, and the molar flow is 1,860 kmoles/h. Table 2 lists the natural gas parameters.
(2) Initial conditions of mixed refrigerant
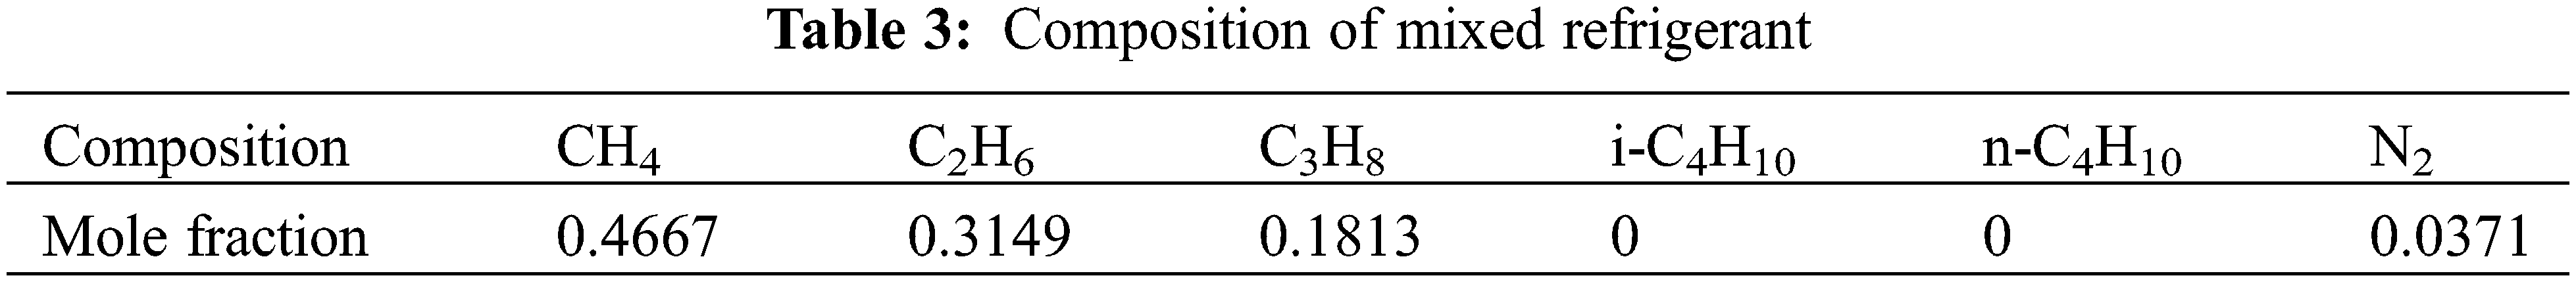
The flow of mixed refrigerant is 3,526 kmoles/h, and the composition is shown in Table 3.
(3) Process initial parameters and equipment process parameters
In the simulation process, the propane precooling cycle is established, and then the mixed refrigerant cycle is established. Once both processes are completed, the natural gas liquefaction circuit is completed. The equipment process parameters are input first, and then the process parameters are input.
First, the equipment parameters to set are the pressure drops of the heat exchange device and cooling device. Considering the actual pressure drop, the pressure drop of both the cooler and the LNG heat exchanger is set to 20 kPa to simplify the model. The variable efficiency of the compressor is taken as 75%. Finally, the parameters of the mixer are set, and its automatic pressure distributions are set to be equal.
All processes of the system are in a steady state, and the kinetic and potential energy effects are ignored. Except for compressors, pumps and expanders, the pressure losses in other components are neglected [23]. The conversion between electrical energy and mechanical energy is 100% [24].
To evaluate the efficiency of the process and device in terms of energy utilization, the specific power consumption and energy loss are considered as the process performance evaluation indices in this paper. The specific power consumption refers to the power consumed to produce 1 kmole LNG. Therefore, this paper mainly calculates the power consumption and loss of each piece of equipment in the process and analyses the influences of parameters in the cycle process, such as the pressures of the high-pressure and low-pressure mixed refrigerants, the natural gas temperature after propane precooling and the methane content in the mixed refrigerant, on the power consumption and loss. Finally, the minimum specific power is considered as the objective function when using the optimizer in the software for process optimization.
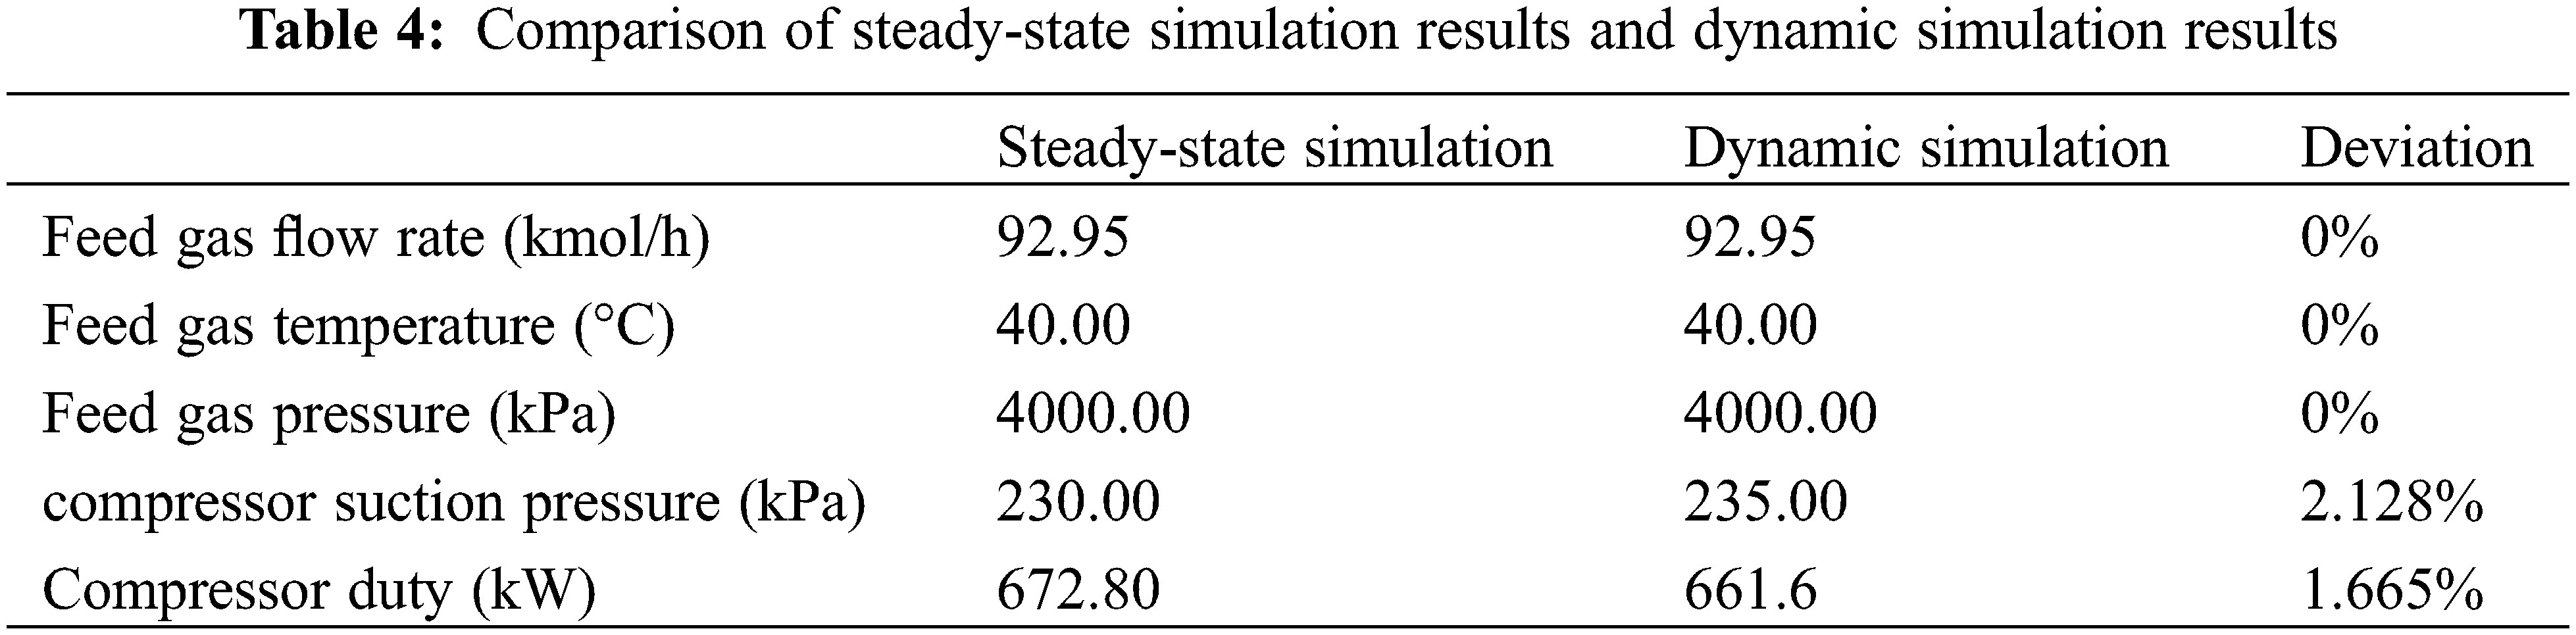
3.1 Validation of the Simulation Results
In this section, dynamic simulation results [25] are applied to verify the steady-state simulation results. Table 4 presents the obtained results. It is observed that the deviation between the results obtained from the steady-state and dynamic simulations is less than 2.5%. Hence, the steady-state simulation results are consistent with the dynamic simulation results.
3.2 Thermodynamic Analysis of the Process
The LNG flow rate in this process was 1,788 kmol/h. The liquefaction rate was 96.12%. The calculation results are shown in Table 5.
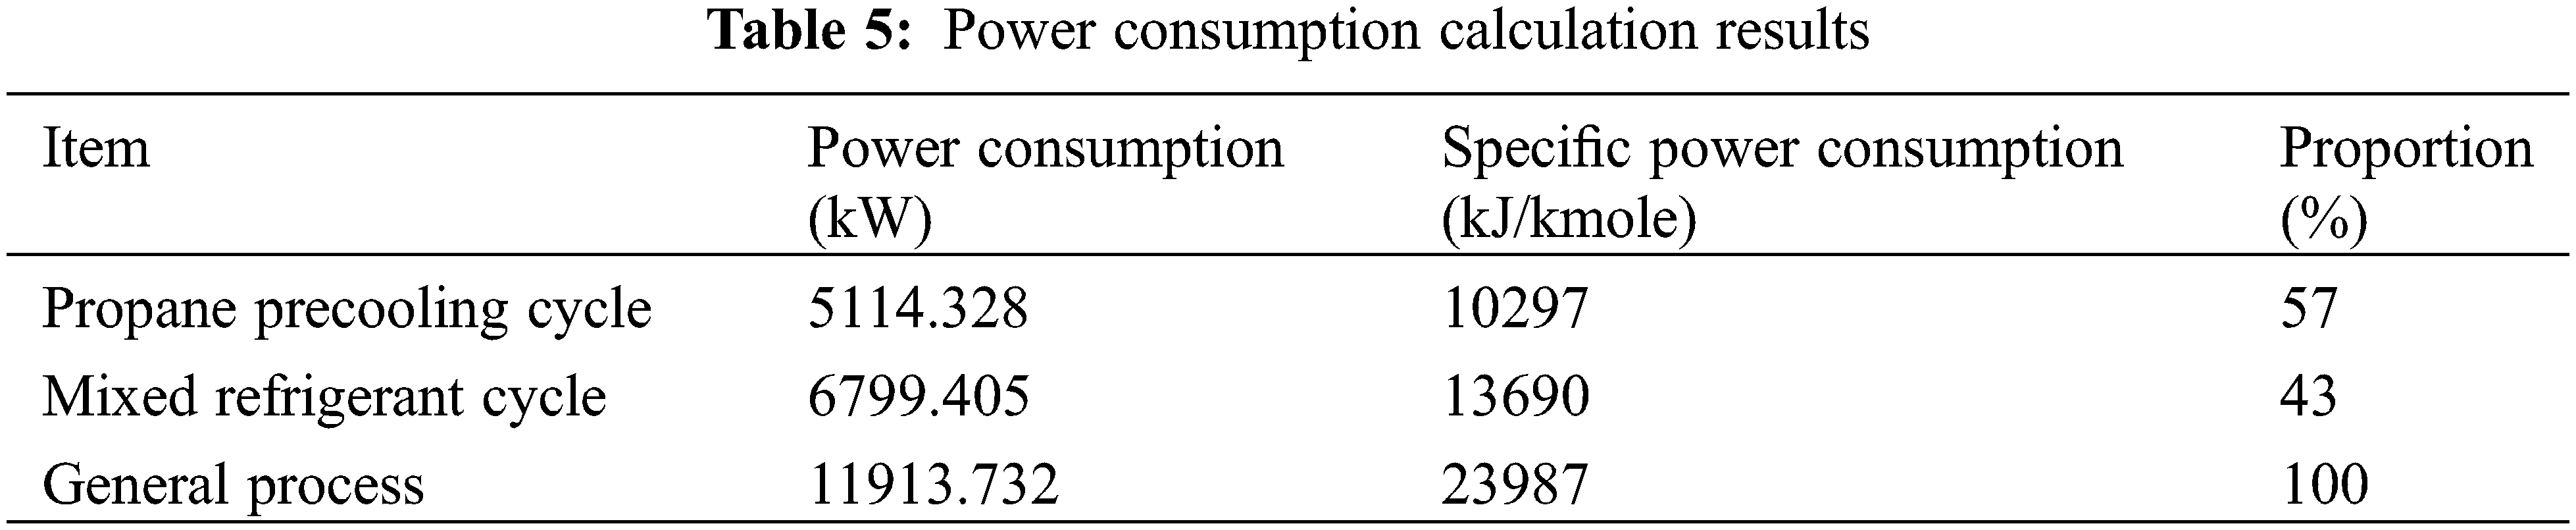
Table 5 shows that the power consumption of the propane precooling cycle and the mixed refrigerant cycle is roughly the same, although the power consumption of propane during circulation is large. To reduce the power consumption, compressors with variable efficiency can be considered. In this paper, the efficiency of the compressor is 75%. Currently, the efficiency of the three-dimensional impeller vertical split compressor with a high flow rate can reach more than 84%. When the selected compressor is determined, an effective way to reduce the power consumption of the compressor is to reduce the logistics flow and the ratio of the mixed refrigerant through process optimization.
3.3 Influence of High-Pressure Mixed Refrigerant Pressure on Process Performance
Here, the high-pressure mixed refrigerant pressure refers to the pressure before the refrigerant in the mixed refrigerant process enters the propane precooling cycle after passing through the two-stage compressor. Figs. 3–5 show the effects of high-pressure refrigerant pressure on the process.
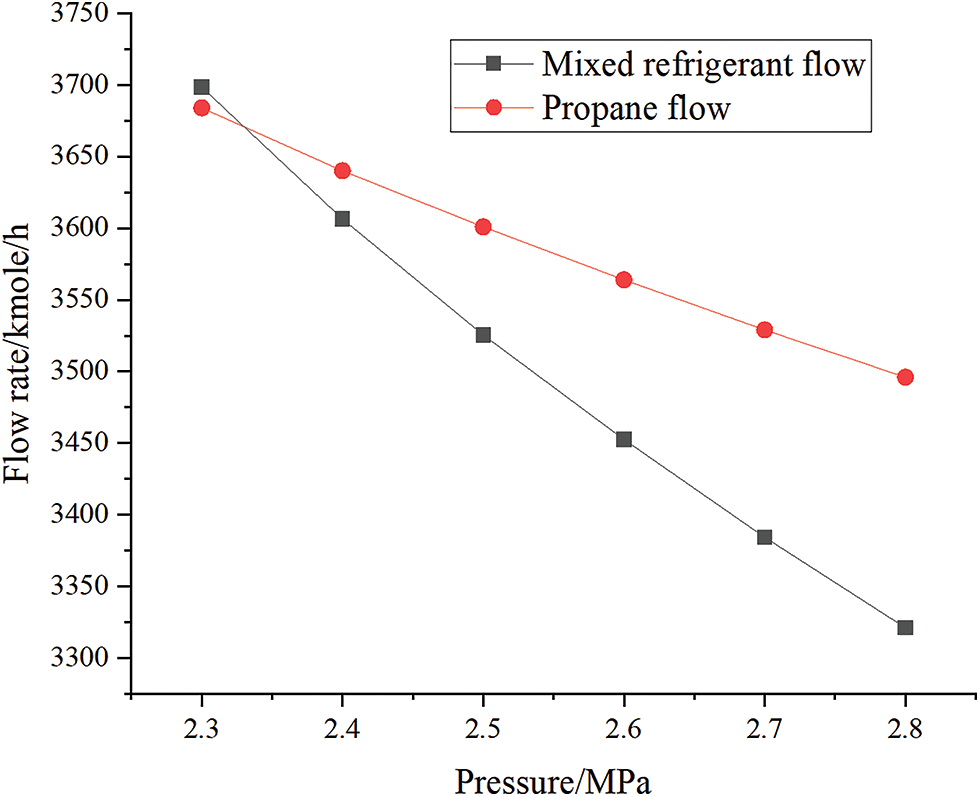
Figure 3: Effect of high-pressure mixed refrigerant pressure on refrigerant flow rate
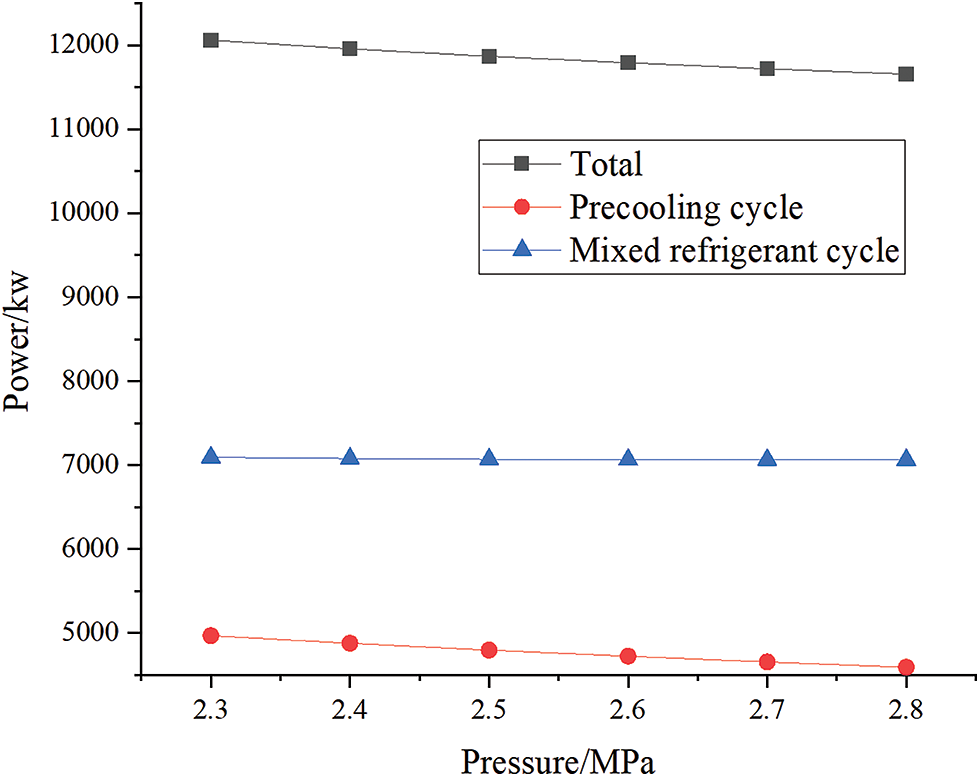
Figure 4: Effect of high-pressure mixed refrigerant pressure on power consumption
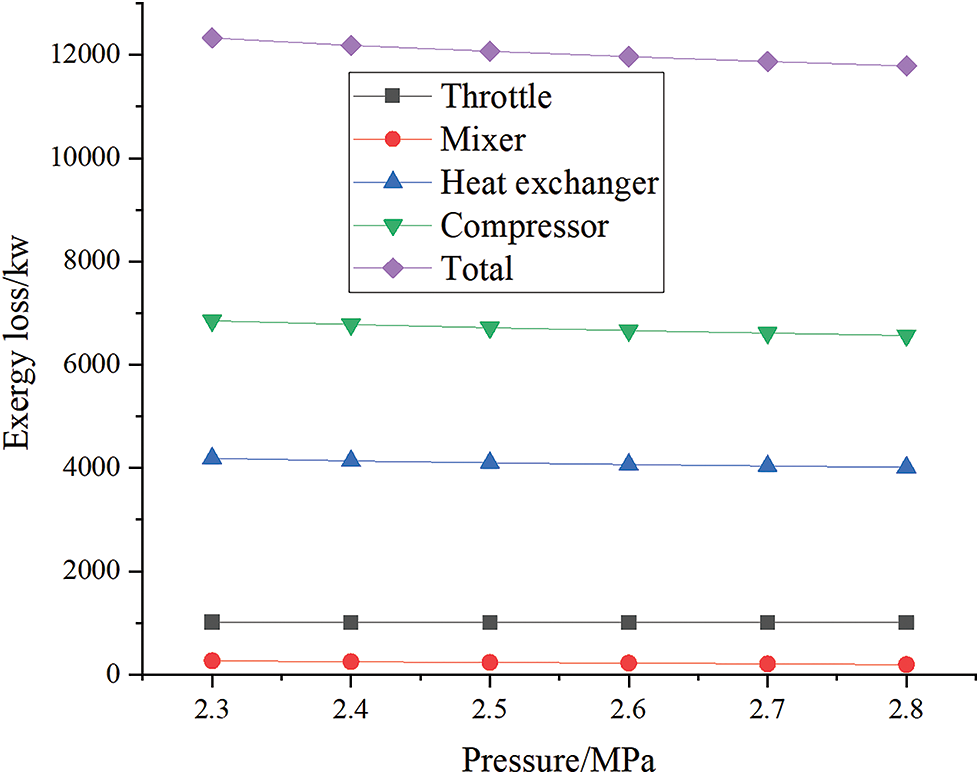
Figure 5: Effect of high-pressure mixed refrigerant pressure on flow loss
As shown in Fig. 3, the flow rates of mixed refrigerant and propane are negatively correlated with the high-pressure mixed refrigerant pressure. This is because the pressure of the refrigerant at the high-pressure end increases, reducing the enthalpy of the refrigerant at the high-pressure end. At the same time, the enthalpy of the low-pressure mixed refrigerant remains unchanged, and the cooling capacity released per mole of mixed refrigerant increases. Thus, the required mixed refrigerant flow is reduced. The propane flow decreases during precooling.
Fig. 4 shows that the mixed refrigerant flow and the propane flow are negatively correlated with the high-pressure mixed refrigerant pressure. The reason for this is the same as above: the increase in the pressure of the refrigerant at the high-pressure end reduces the enthalpy of the refrigerant. At the same time, the enthalpy of the low-pressure mixed refrigerant remains unchanged, and the cooling capacity released per mole of mixed refrigerant increases. Thus, the required mixed refrigerant flow rate is reduced. In precooling, the propane flow rate decreases.
Fig. 5 shows that with the increase in refrigerant pressure at the high-pressure end, the exergy losses of the heat exchanger and compressor decrease significantly, mainly because the total flow through the equipment decreases, thus reducing the total exergy loss. The damage of the throttle valve and mixer first decreases slowly and then fluctuates at a fixed value.
3.4 Effect of Low-Pressure Mixed Refrigerant Pressure on Process Performance
The low-pressure mixed refrigerant pressure refers to the pressure at which the refrigerant enters the first stage compressor in the mixed refrigerant process. When the pressure of the low-pressure mixed refrigerant is changed, its temperature is kept constant by adjusting the flow of the mixed refrigerant.
Fig. 6 shows that the flow rates of mixed refrigerant and propane increase with increasing low-pressure mixed refrigerant pressure. Due to the decrease in enthalpy at the low-pressure end, the cooling capacity provided by the unit per mole of mixed refrigerant decreases, which increases the required mixed refrigerant flow. However, the range of increase is very small. In the propane precooling process, the propane content also increases slightly.
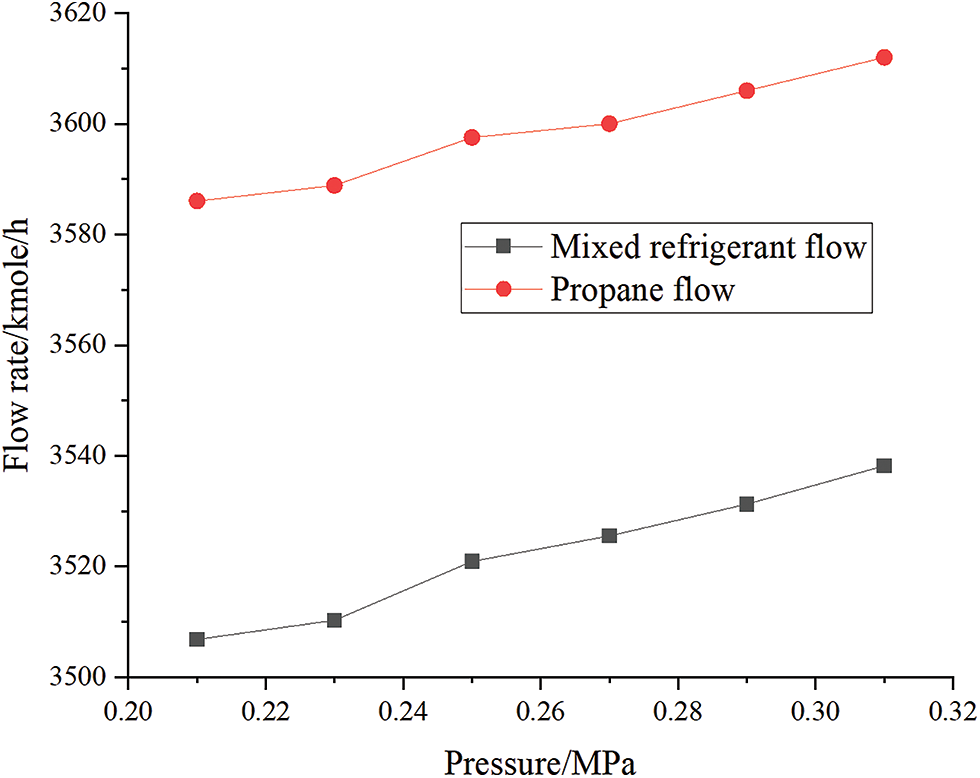
Figure 6: Effect of low-pressure mixed refrigerant pressure on refrigerant flow
In the hybrid refrigeration process, the power consumption of the compressor is affected by both the flow and pressure ratio, as shown in Fig. 7. The specific power consumption of the compressor is reduced under the joint action of an increase in flow and a decrease in pressure ratio. In this process, the impact of the reduction in compressor pressure ratio is greater than that of the increase in power consumption. The overall result is the reduction in the power consumption of the hybrid refrigeration cycle. The significant increase in the power consumption of the compressor in the propane precooling process is the result of the increase in propane flow and the near-constant pressure ratio of each compressor. Since the mixed refrigerant consumes more power during circulation, the power consumption of the entire process is reduced.
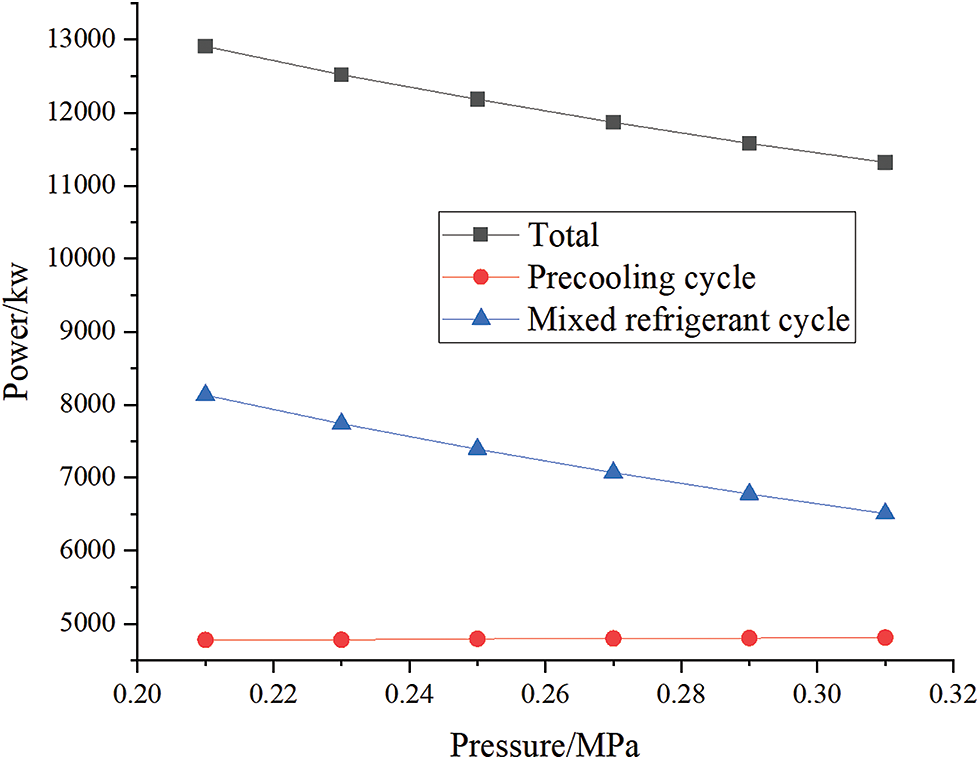
Figure 7: Effect of low-pressure mixed refrigerant pressure on power consumption
Fig. 8 shows that with the increase in low-pressure mixed refrigerant pressure, the exergy loss of the heat exchanger and compressor significantly decreases, mainly due to the decrease in flow through the equipment. The damage to the throttle valve and mixer also reduces, but the reduction range is small.
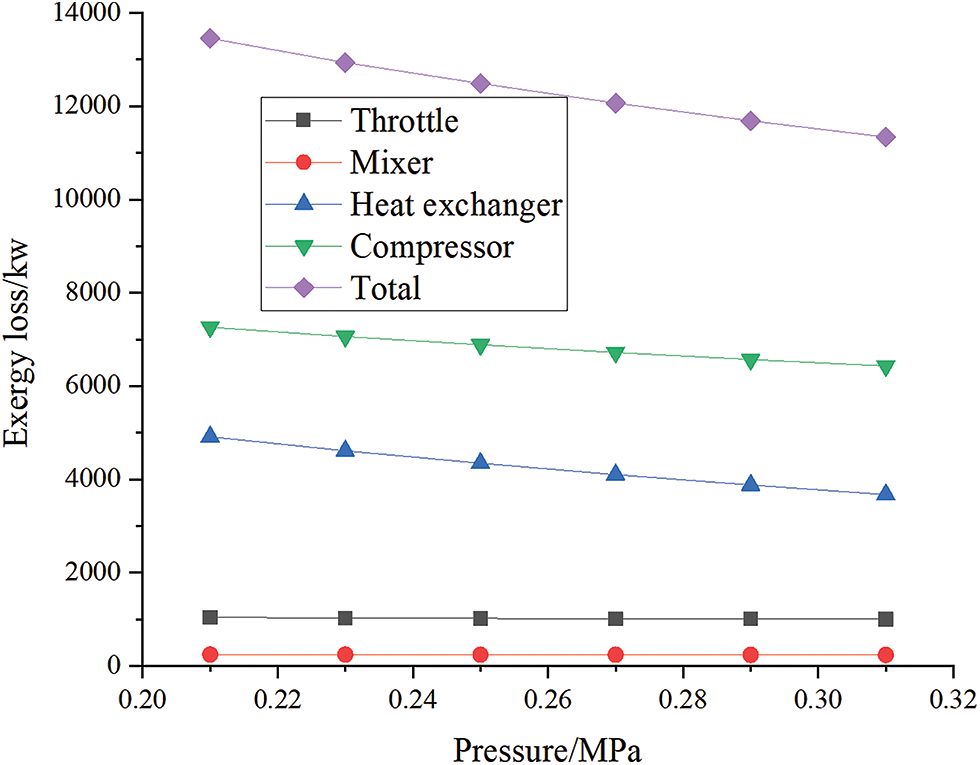
Figure 8: Effect of low-pressure mixed refrigerant pressure on loss
In this paper, the mixed refrigerant cycle liquefaction process is simulated using the HYSYS process simulation software. The main logistics parameters involved in the process, such as natural gas feed pressure, high-pressure refrigerant pressure and low-pressure refrigerant pressure, are varied to analyse their influences on the liquefaction rate and power consumption of the process.
The flow rates of the mixed refrigerant and propane are negatively correlated with the high-pressure mixed refrigerant pressure. At the same time, the enthalpy of the low-pressure mixed refrigerant remains unchanged, and the cooling capacity released per mole of mixed refrigerant increases. The mixed refrigerant flow and the propane flow are negatively correlated with the high-pressure mixed refrigerant pressure.
The flow rates of the mixed refrigerant and propane increase with increasing low-pressure mixed refrigerant pressure. The power consumption of the compressor in the hybrid refrigeration process is affected by both the flow and pressure ratio. The specific power consumption of the compressor is reduced under the joint action of an increase in flow increase and a decrease in pressure ratio. With the increase in low-pressure mixed refrigerant pressure, the exergy loss of the heat exchanger and compressor decreases significantly. The damage to the throttle valve and mixer is also reduced, but the reduction range is small.
In future research, the parameters of the C3/MRC liquefaction process should be optimized based on clarifying the impacts of refrigerants on the liquefaction process.
Funding Statement: This work was supported by the Science Development Funding Program of Dongying of China (Grant No. DJ2021006) and Science Development Funding Program of Dongying of China (Grant No. DJ2021008).
Conflicts of Interest: The authors declare that they have no conflicts of interest to report regarding the present study.
References
1. Lin, W., Na, Z., Gu, A. (2010). LNG (liquefied natural gasA necessary part in China’s future energy infrastructure. Energy, 35(11), 4383–4391. DOI 10.1016/j.energy.2009.04.036. [Google Scholar] [CrossRef]
2. Dudley, B. (2016). BP energy outlook 2035. London: British Petroleum. [Google Scholar]
3. Qyyum, M. A., Qadeer, K., Lee, M. (2017). Comprehensive review of the design optimization of natural gas liquefaction processes: Current status and perspectives. Industrial & Engineering Chemistry Research, 57(17), 5819–5844. DOI 10.1021/acs.iecr.7b03630. [Google Scholar] [CrossRef]
4. Al-Ajmi, R., Mosaad, M. (2011). Heat exchange between film condensation and porous: Natural convection across a verticalwall. Fluid Dynamics & Materials Processing, 8(1), 51–68. DOI 10.3970/fdmp.2011.008.051. [Google Scholar] [CrossRef]
5. Pozo, C., Lvaro, N. J., Martín, J. R., Paniagua, I. L. (2021). Efficiency evaluation of closed and open cycle pure refrigerant cascade natural gas liquefaction process through exergy analysis. Journal of Natural Gas Science and Engineering, 89(1), 103868. DOI 10.1016/j.jngse.2021.103868. [Google Scholar] [CrossRef]
6. Park, K., Won, W., Shin, D. (2016). Effects of varying the ambient temperature on the performance of a single mixed refrigerant liquefaction process. Journal of Natural Gas Science and Engineering, 34, 958–968. DOI 10.1016/j.jngse.2016.07.069. [Google Scholar] [CrossRef]
7. Qyyum, M. A., Qadeer, K., Zahoor, M., Ahmad, A., Lee, M. (2019). Gas-liquid dual-expander natural gas liquefaction process with confirmation of biogeography-based energy and cost savings. Applied Thermal Engineering, 166, 114643. DOI 10.1016/j.applthermaleng.2019.114643. [Google Scholar] [CrossRef]
8. Bian, J., Cao, X. W., Yang, W., Edem, M. A., Yin, P. B. et al. (2018). Supersonic liquefaction properties of natural gas in the Laval nozle. Energy, 159, 706–715. DOI 10.1016/j.energy.2018.06.196. [Google Scholar] [CrossRef]
9. Bian, J., Cao, X. W., Yang, W., Guo, D., Xiang, C. C. (2020). Prediction of supersonic condensation process of methane gas considering real gas effects. Applied Thermal Engineering, 164, 114508. DOI 10.1016/j.applthermaleng.2019.114508. [Google Scholar] [CrossRef]
10. Bian, J., Cao, X. W., Yang, W., Song, X. D., Xiang, C. C. et al. (2019). Condensation characteristics of natural gas in the supersonic liquefaction process. Energy, 168, 99–110. DOI 10.1016/j.energy.2018.11.102. [Google Scholar] [CrossRef]
11. Cao, X., Bian, J. (2019). Supersonic separation technology for natural gas processing: A review. Chemical Engineering and Processing-Process Intensification, 136, 138–151. DOI 10.1016/j.cep.2019.01.007. [Google Scholar] [CrossRef]
12. Wu, X., Wang, Z., Dong, M., Dong, L., Ge, Q. (2023). A critical analysis of natural gas liquefaction technology. Fluid Dynamics & Materials Processing, 18(1), 145–158. DOI 10.32604/fdmp.2022.018227. [Google Scholar] [CrossRef]
13. Gao, T., Lin, W., Gu, A., Min, G. (2009). Optimization of coalbed methane liquefaction process adopting mixed refrigerant cycle with propane pre-cooling. Journal of Chemical Engineering of Japan, 42(12), 893–901. DOI 10.1252/jcej.09we161. [Google Scholar] [CrossRef]
14. Mortazavi, A., Mortazavi, A., Hwang, Y., Radermacher, R., Rogers, P. (2011). Optimization of propane pre-cooled mixed refrigerant LNG plant. Applied Thermal Engineering, 31(6-7), 1091–1098. DOI 10.1016/j.applthermaleng.2010.12.003. [Google Scholar] [CrossRef]
15. Hwang, J. H., Roh, M. I., Lee, K. Y. (2013). Determination of the optimal operating conditions of the dual mixed refrigerant cycle for the LNG FPSO topside liquefaction process. Computers & Chemical Engineering, 49(5), 25–36. DOI 10.1016/j.compchemeng.2012.09.008. [Google Scholar] [CrossRef]
16. Shirazi, M., Mowla, D. (2010). Energy optimization for liquefaction process of natural gas in peak shaving plant. Energy, 35(7), 2878–2885. DOI 10.1016/j.energy.2010.03.018. [Google Scholar] [CrossRef]
17. Hatcher, P., Khalilpour, R., Abbas, A. (2012). Optimisation of LNG mixed-refrigerant processes considering operation and design objectives. Computers & Chemical Engineering, 41, 123–133. DOI 10.1016/j.compchemeng.2012.03.005. [Google Scholar] [CrossRef]
18. Xu, X., Liu, J., Cao, L. (2014). Optimization and analysis of mixed refrigerant composition for the PRICO natural gas liquefaction process. Cryogenics, 59(1), 60–69. DOI 10.1016/j.cryogenics.2013.11.001. [Google Scholar] [CrossRef]
19. Sun, H., Shu, D., Zhu, H. M. (2012). Process optimization of one-stage propane pre-cooled MRC cycle for small-scale LNG plant. Advanced Materials Research, 516, 1184–1187. DOI 10.4028/www.scientific.net/AMR.516-517.1184. [Google Scholar] [CrossRef]
20. Li, Q. Y., Ju, Y. L. (2010). Design and analysis of liquefaction process for offshore associated gas resources. Applied Thermal Engineering, 30(16), 2518–2525. DOI 10.1016/j.applthermaleng.2010.07.001. [Google Scholar] [CrossRef]
21. Chang, H. M., Lim, H. S., Choe, K. H. (2012). Effect of multi-stream heat exchanger on performance of natural gas liquefaction with mixed refrigerant. Cryogenics, 52(12), 642–647. DOI 10.1016/j.cryogenics.2012.05.014. [Google Scholar] [CrossRef]
22. Zhang, L., Che, L. X., Bi, S. S., Wang, H. S., Wu, J. T. et al. (2013). Simulation and optimization of NGE-MR natural gas liquefaction process. Applied Mechanics & Materials, 391, 352–357. DOI 10.4028/www.scientific.net/AMM.391.352. [Google Scholar] [CrossRef]
23. Qyyum, M. A., Qadeer, K., Lee, M. (2018). Closed-loop self-cooling recuperative N2 expander cycle for the energy efficient and ecological natural gas liquefaction process. ACS Sustainable Chemistry and Engineering, 6(4), 5021–5033. DOI 10.1021/acssuschemeng.7b04679. [Google Scholar] [CrossRef]
24. Ferreira, P. A., Catarino, I., Vaz, D. (2017). Thermodynamic analysis for working fluids comparison in Rankine-type cycles exploiting the cryogenic exergy in Liquefied Natural Gas (LNG) regasification. Applied Thermal Engineering, 121, 887–896. DOI 10.1016/j.applthermaleng.2017.04.082. [Google Scholar] [CrossRef]
25. He, T., Ju, Y. (2016). Dynamic simulation of mixed refrigerant process for small-scale LNG plant in skid mount packages. Energy, 97(2), 350–358. DOI 10.1016/j.energy.2016.01.001. [Google Scholar] [CrossRef]
 | This work is licensed under a Creative Commons Attribution 4.0 International License, which permits unrestricted use, distribution, and reproduction in any medium, provided the original work is properly cited. |