

 | Fluid Dynamics & Materials Processing |  |
DOI: 10.32604/fdmp.2022.019768
ARTICLE
An Analysis of the Factors Influencing Cavitation in the Cylinder Liner of a Diesel Engine
1State Key Laboratory of Engine Reliability, Weifang, 261061, China
2Weichai Power Co., Ltd., Weifang, 261061, China
3State Key Laboratory of Engines, Tianjin University, Tianjin, 300350, China
*Corresponding Author: Shunshun Qin. Email: qinss@weichai.com
Received: 13 October 2021; Accepted: 22 February 2022
Abstract: Avoiding cavitation inside the water jacket is one of the most important issues regarding the proper design of a diesel engine’s cylinder liner. Using CFD simulations conducted in the frame of a mixture multiphase approach, a moving grid technology and near-wall cavitation model, in the present study the factors and fluid-dynamic patterns that influence cavitation are investigated from both macroscopic and mesoscopic perspectives. Several factors are examined, namely: wall vibration, water jacket width, initial cavitation bubble radius, coolant temperature, and number of bubbles. The results show that reducing the cylinder liner vibration intensity can significantly weaken the cavitation. Similarly, increasing the water jacket width is instrumental in avoiding cavitation. Increasing the coolant temperature reduces the microjet velocity related to bubble collapse, while increasing the number of bubbles produces a much larger water hammer pressure that can cause more damage to the cylinder liner.
Keywords: Cavitation; cavitation dynamics; diesel engine; two-phase flow; water hammer
Nomenclature
| Term | Interpretation |
| | Time |
| | Mixture density |
| | Mass-averaged velocity |
| | Pressure gradient acting on a unit volume of fluid |
| | Mixture viscosity |
| | Acceleration due to gravity |
| | Body force |
| | Volume fraction of phase h |
| | Density of phase h |
| | Drift velocity of phase h |
| | Velocity of phase h |
| | Density of liquid phase |
| | Turbulent kinetic energy |
| ε | Turbulent dissipation rate |
| xi | Cartesian coordinate system component in the i direction |
| xj | Cartesian coordinate system component in the j direction |
| ui | Velocity in the i direction |
| µeff | Effective dynamic viscosity |
| G | Turbulent kinetic energy generation due to the mean velocity gradient |
| YM | Contribution of the compressible turbulence fluctuating dilatation to the overall dissipation rate |
| Rε | Term to fix the penultimate term |
| C1ε | Constant |
| C2ε | Constant |
| C???? | Constant |
| PWH : | Water hammer pressure |
| c | Sound velocity in liquid |
| vw: | Velocity of the jet impacting the wall |
Cavitation of the cylinder liner is a common diesel engine failure [1–3]. Vibration of the liner due to the second-order piston movement is generally considered the primary cause of this cavitation [4,5]. The bubbles generated in the near-wall region collapse rapidly under the environmental pressure. Then microjets, which develop along with the bubble collapses, shoot toward the liner wall. This is the common cylinder liner cavitation mechanism [6–9]. However, knowing only how the cavitation is caused is not sufficient for understanding the types of factors that affect the cavitation and what patterns are essential for avoiding cavitation.
Zhou [10] conducted an experimental study on the mechanism of cylinder liner cavitation. They increased the width of the water cavity in a diesel engine from the previous 3–5 mm range to 16 mm, which greatly reduced the cylinder liner cavitation. Xu et al. [11] and Zhang et al. [12] modified the bubble diameter model by considering the changes in bubble size caused by heat transfer, collision, and liquid shock. They also developed a model to couple one-dimensional combustion and three-dimensional flow, studied the transient thermal characteristics of diesel engines, and explored ways to improve the efficiency of the cooling system. Scholars have also investigated other means of avoiding cylinder liner cavitation. Steck [13] controlled the engine design parameters (the piston installation clearance, the coolant type, the piston type, the piston design, and the piston pin offset). Additionally, cylinder liner cavitation was effectively avoided by adding a preservative liquid to the coolant [14].
Cylinder liner cavitation is damage to the wall caused by microjets that are generated by cavitation bubble collapses. Focusing on the micrometer scale has academic value for studying the characteristics of these bubble collapses [15]. Xia et al. [16] validated their calculation model with experimental data from Ohl et al. [17], demonstrating the reliability of the numerical simulations; they then studied the collapse characteristics of the cavitation bubbles for different distances from the wall. Jin et al. [18] studied the influence of the wall shape on the cavitation bubble collapses and found that a concave–convex wall significantly impacted the bubble collapses.
During the actual operation of a diesel engine, because the cavitation generated by the coolant does not exist in a single form, it is necessary to analyze the influence of the interactions of multiple cavitation bubbles on the collapse of a single cavitation bubble. Zhang et al. [19,20] studied the pressure-driven collapse process for multiple bubbles. They analyzed multiple bubbles and the influence of different bubble spacings on the cavitation bubble collapses. They also studied the pressure wave energy during the collapse of a cavitation bubble.
There are still some limitations in the existing research. First, the water jacket model and calculation boundary used are relatively simple and different from the actual working conditions. Second, few studies have been performed concerning the characteristics of cavitation bubble collapse and the factors that influence this process in the cooling channel [21,22]. This is the focus of this article.
In this study, the influencing factors and laws of diesel engine cylinder liner cavitation were investigated on the macroscopic and mesoscopic scales. First, based on a simulation of the water jacket flow field in a six-cylinder diesel engine, the boundary conditions for a single cylinder were determined. A numerical simulation of the cavitation in the single-cylinder cooling water jacket was then conducted to study the cavitation characteristics of the coolant. Subsequently, a model for cavitation bubble collapse near the cylinder liner wall was developed to study the effects of the initial cavitation bubble radius, the initial temperature inside the bubble, and the number of cavitation bubbles on the cavitation bubble collapse process and wall impact.
The mixture multiphase flow model was used to simulate the coolant cavitation. The phases in the flow field moved at different speeds and were assumed to be locally balanced on a short spatial scale. The phases were calculated and coupled through the continuity equation (Eq. (1)) and the momentum equations (Eqs. (2) and (3)).
In Eqs. (1)–(3), t represents time,
The RNG k–ε model was employed [23], and it is given in Eqs. (4)–(6).
In Eqs. (4)–(6), k is the turbulent kinetic energy, ε is the turbulent dissipation rate, ρ is the density of the liquid phase, xi and xj are the components of the Cartesian coordinate system in the i and j directions, respectively, ui is the velocity in the i direction, µeff is the effective dynamic viscosity, G is the turbulent kinetic energy generation due to the mean velocity gradient, YM is the contribution of the compressible turbulence fluctuating dilatation to the to the overall dissipation rate, and Rε is a term to fix the penultimate term. The three constants had fixed values: C1ε = 1.42, C2ε = 1.68, and Cμ = 0.0845.
Based on the Rayleigh–Plesset equation, the expression of the phase transition rate is given in Eq. (7).
In Eq. (7), Re represents the evaporation rate, Rc is the condensation rate, ???? is the liquid surface tension, ρl is the liquid density, ρv is the saturation pressure, p is the local pressure, fv denotes the vapor mass fraction, fg is the incondensable gas mass fraction, and Ce and Cc are experience coefficients, equal to 0.02 and 0.01, respectively.
A two-phase flow cavitation simulation was conducted for a single-cylinder water jacket. The minimum width of the cylinder water jacket was 2.5 mm, so 830,000 tetrahedral grids of 1 mm were used for the cooling water jacket, as shown in Fig. 1.

Figure 1: CFD model of the cooling flow for a single cylinder
The physical problem was that, in the cooling jacket, ideal spherical cavitation bubbles located near the cylinder liner wall developed under the environmental pressure until they collapsed and produced water jets that moved toward the liner wall. The cavitation was axisymmetric when the bubbles collapsed near the wall, so the numerical simulation adopted a two-dimensional axisymmetric model. The calculation domain and boundary conditions are shown in Fig. 2. The width of the water channel was 2.5 mm, R represents the initial bubble radius, and the vertical distance from the bubble center to the wall is denoted by h.
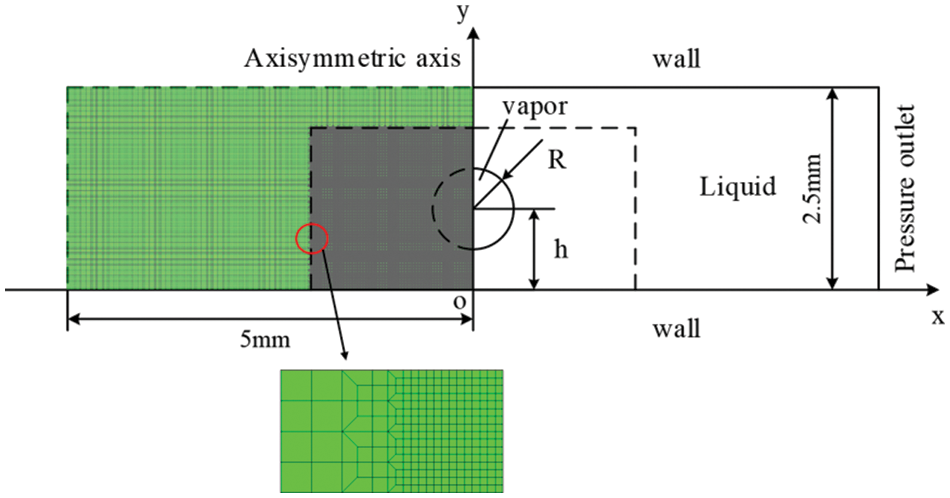
Figure 2: Cavitation dynamics model for a single bubble
The left side of the calculation domain is the axisymmetric boundary, which satisfied u = 0 and ∂v/∂x = 0 (where u is the velocity in the x direction and v is the velocity in the y direction). The top and bottom were rigid wall boundaries with no slippage, and the pressure outlet is on the right. To reduce the influence of the pressure boundary on the calculations, the wall length was set to 5 mm, which was 50 times the initial bubble radius. The numerical simulation used quadrilateral structured grids. The grids in the dotted area were refined to capture the morphological changes during the cavitation development. In total, 184,000 grids with a minimum size of 5 μm × 5 μm were employed.
2.6 Grid Independence Verification
The two groups of models with different grid numbers were separated based on the grid numbers into two schemes: scheme 1 had 1.1 million grids and scheme 2 had 3.86 million grids. The grid model of diesel engine cooling water jacket is shown in Fig. 3. The inlet and outlet water jacket parameters are shown in Table 1. The two groups were simulated for coolant flow, and the average flow velocity was calculated for each inlet and outlet. For scheme 1, the average flow velocities for outlets 1–4 were 3.8 m/s, 2.2 m/s, 1.2 m/s, and 1.0 m/s. The average flow velocities for all outlets in scheme 2 were the same as those for scheme 1, so the grid model for scheme 2 was selected for the subsequent investigation. One cylinder was selected for analysis to facilitate the study.
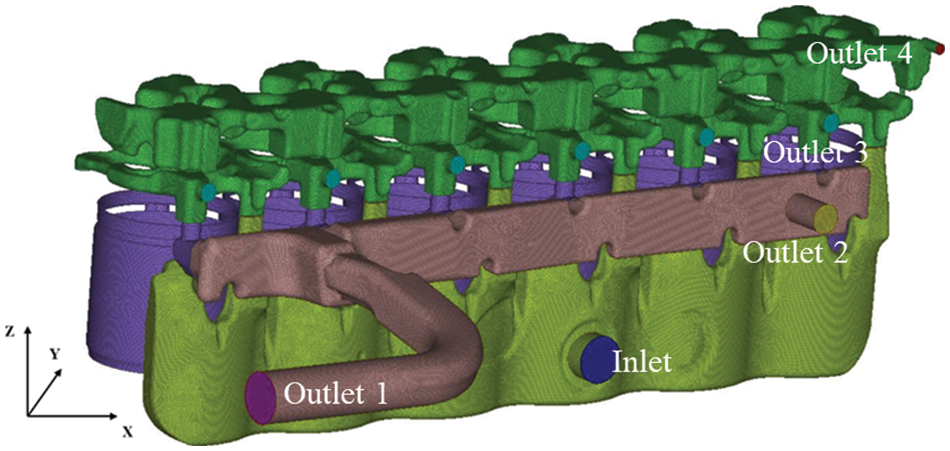
Figure 3: The grid model for the diesel engine cooling water jacket

3.1 Single-Cylinder CFD Simulation
3.1.1 Cylinder Liner Vibration
During operation, the piston, due to its second-order movement, knocks on the cylinder liner and causes it to vibrate. In the simulation, the DEFINE_GRID_MOTION macro and a UDF compiled in the C language were used to simulate the liner vibration. The spring smoothing method was used to update the moving grid. The cylinder liner was equally divided into 12 walls along the direction of piston motion: the top region included walls 1–4, the middle region contained walls 5–8, and the bottom region included walls 9–12, as shown in Fig. 4a. The vibration displacement of the cylinder liner was obtained from the piston dynamics calculations. The time series for a 720° crank angle at the wall center on the rod’s moving plane were extracted and are shown in Fig. 4b. The strokes corresponding to crank angles of 0–720° are the working, exhaust, intake, and compression strokes.

Figure 4: Schematics of (a) The cylinder regions and (b) The corresponding vibration histories
The coolant was a 50% ethylene glycol aqueous solution in the two-phase flow cavitation simulation. The working temperature was 363 K and the pressure was 300 kPa. The pressures and the coolant flow rates for the inlet and outlets were extracted from the engine-level CFD simulation of an in-line six-cylinder diesel engine. The parameters used in the simulation are listed in Table 2.

3.2 Cavitation Dynamics Simulation
(1) During the simulation, the bubbles consisted of 50% ethylene glycol vapor with a volume fraction of 1.
(2) The coolant was an incompressible Newtonian fluid, and the viscosity and the surface tension of the coolant and the steam were considered.
(3) The flow was laminar and the influence of gravity was ignored.
The finite volume method was used to discretize the governing equations. Since the cavitation bubble collapse process was unstable, the pressure–velocity coupling solution used the PISO algorithm. In the discrete format, the gradient term used the least squares method based on grid cells. The fluid volume fraction discrete format used Geo-Reconstruct, and the density, momentum, and energy terms used the second-order upwind scheme. Considering the surface tension effects, the volumetric-force-weighted method was used for the pressure term. A first-order implicit approach was used for the time term, and the time step was 5 × 10⁻⁹ s.
The dimensionless wall distance, γ, is defined as the distance from the bubble center to the wall divided by the maximum bubble radius, γ = h/Rmax. This ratio was one of the important parameters in the bubble collapse dynamics.
The liner vibration, the water jacket width, the initial cavitation radius, the coolant temperature, and the number of cavitation bubbles are variables that may affect the cavitation collapse characteristics. For the subsequent parametric analysis, only one of these variables was changed at a time while the other variables remained constant at baseline values.
(1) The root-mean-squared displacement of the linear vibration was increased and decreased by 20% from the baseline value, as shown in Fig. 5.
(2) The baseline width of the water jacket was 2.5 mm, and it was increased to 4 and 5 mm.
(3) Owing to the random vibration of the cylinder liner, the initial cavitation radius varied as well. At γ = 1, four initial bubble radius values were studied: 0.075, 0.1 0.125, and 0.15 mm.
(4) For diesel engine cooling systems, the coolant may work at different temperatures. Four coolant temperatures, 80°C, 85°C, 90°C, and 95°C, were investigated, and the corresponding saturation pressures are given in Table 2.
(5) Multiple cavitation bubbles may interact during the bubble collapse process, so sets of three, four, and ten cavitation bubbles inside the calculation domain with radii of 0.1 mm and distances of 0.25 mm were studied.
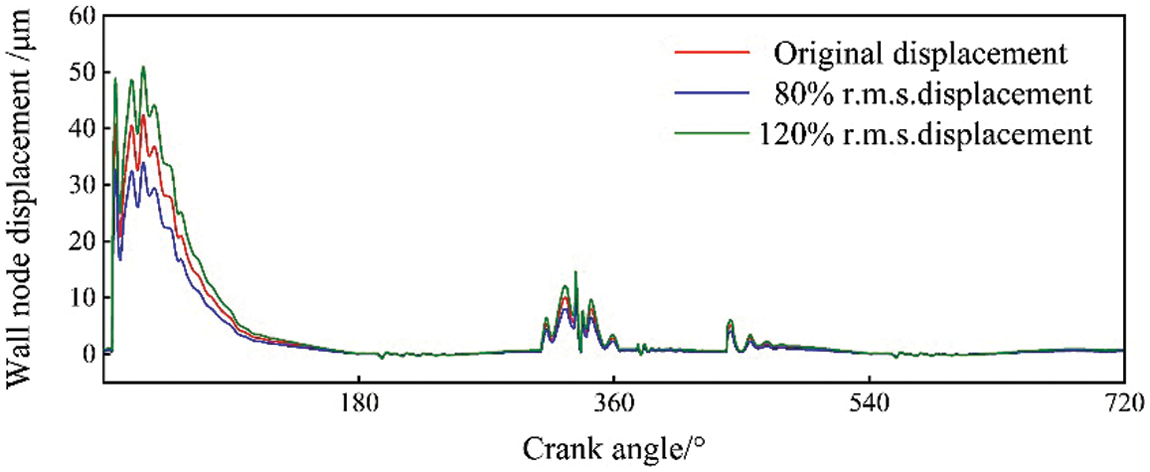
Figure 5: Vibration displacement of the fifth cylinder liner wall
Comparisons of the liner wall pressures and the gas volume fractions for three vibration intensities are shown in Figs. 6 and 7. When the vibration intensity varied, the coolant pressures on the liner wall had similar patterns but obvious differences in magnitude. During the power stroke, when the vibration increased, the peak coolant pressure on the top wall rose from 1.15 MPa to 1.47 MPa, an increase of 27.8%. The decrease in the vibration intensity resulted in a 22.6% decrease in the peak pressure, from 1.15 MPa to 0.89 MPa. The vibration magnitudes at the middle and bottom were smaller than that at the top, so the pressure variation for those two regions did not exceed 20%. The liner vibration was not as intense for other strokes as for the power stroke, so the coolant pressures on the liner wall for these strokes followed the same pattern but had much smaller magnitudes. The effect of the liner vibration on the gas volume fraction was significant. The largest gas volume fraction appeared immediately after the vibration reached its peak. On the thrust surface, at a crank angle of 6°, the gas volume fraction increased from 1.28% to 1.55%, an increase of 17.4%, as the vibration increased. The volume fraction decreased by 16.4% to 1.07% as the vibration decreased. During other strokes, the influence of the vibration magnitude on the gas volume fraction gradually decreased. It was determined that the vibration intensity of the cylinder liner directly and significantly impacted the coolant flow field near the liner wall.
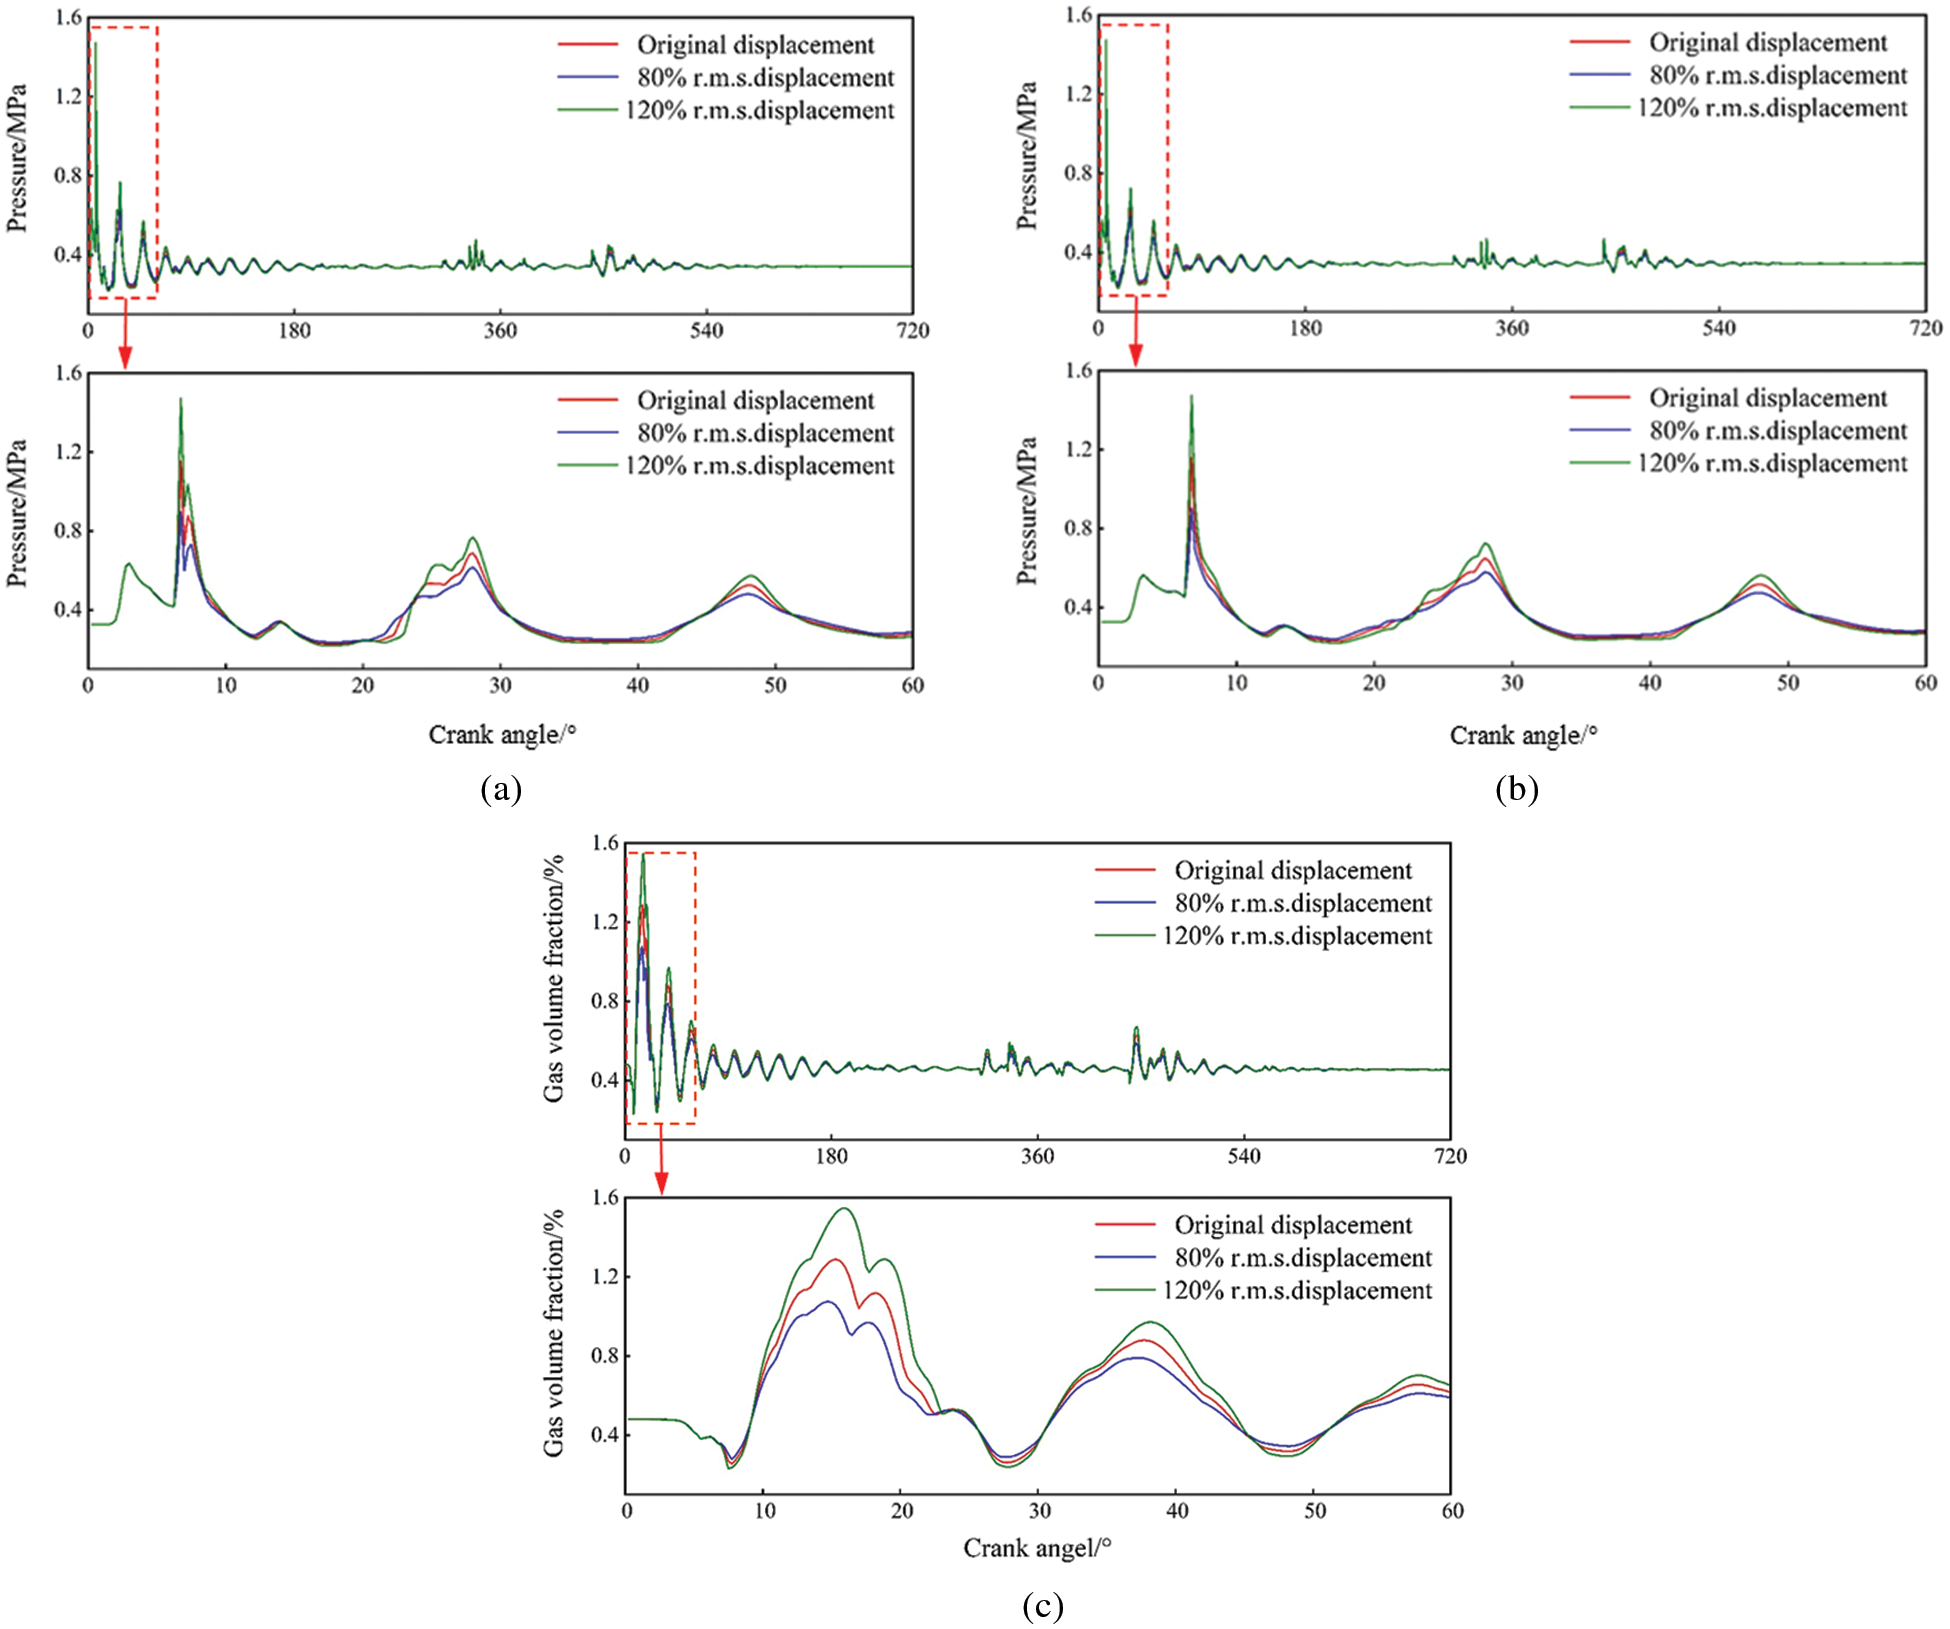
Figure 6: Pressure on the liner wall at (a) The top, (b) The middle, and (c) The bottom regions for different vibration intensities

Figure 7: Gas volume fraction for (a) The top, (b) The middle, and (c) The bottom regions for different vibration intensities
4.2 Effects of Water Jacket Width
Fig. 8 shows the coolant pressure on the liner wall for different water jacket widths. During the power stroke, as the width of the water jacket increased, the pulse pressure in the top liner region at a crank angle of 6.75° decreased from 1.15 MPa (at a 2.5 mm width) to 1.10 MPa (at a 4.0 mm width) and 0.94 MPa (at a 5.0 mm width). The decrease in the pulse pressure was very slight (4.3%) when the water jacket width first increased from 2.5 to 4.0 mm, but a further increase of 1.0 mm in the water jacket width produced a considerable reduction (18.3%). The same pattern was observed for the middle and bottom regions, indicating that the weakening effect of the water jacket width on the coolant pressure was nonlinear and that a relatively small expansion in the channel width would not significantly decrease the pressure.
Like the coolant pressure on the liner wall, the gas volume fraction was affected by the water jacket width in a similar way, as shown in Fig. 9. When the water jacket width increased from 2.5 mm to 4 mm, the decrease in the gas volume fraction was not obvious. When the water jacket width increased to 5 mm, the maximum gas volume fraction on the wall for a 16° crank angle experienced a 15.6% drop. It was concluded that, based on ensuring body rigidity, widening the water jacket as much as possible would help to prevent cavitation erosion.
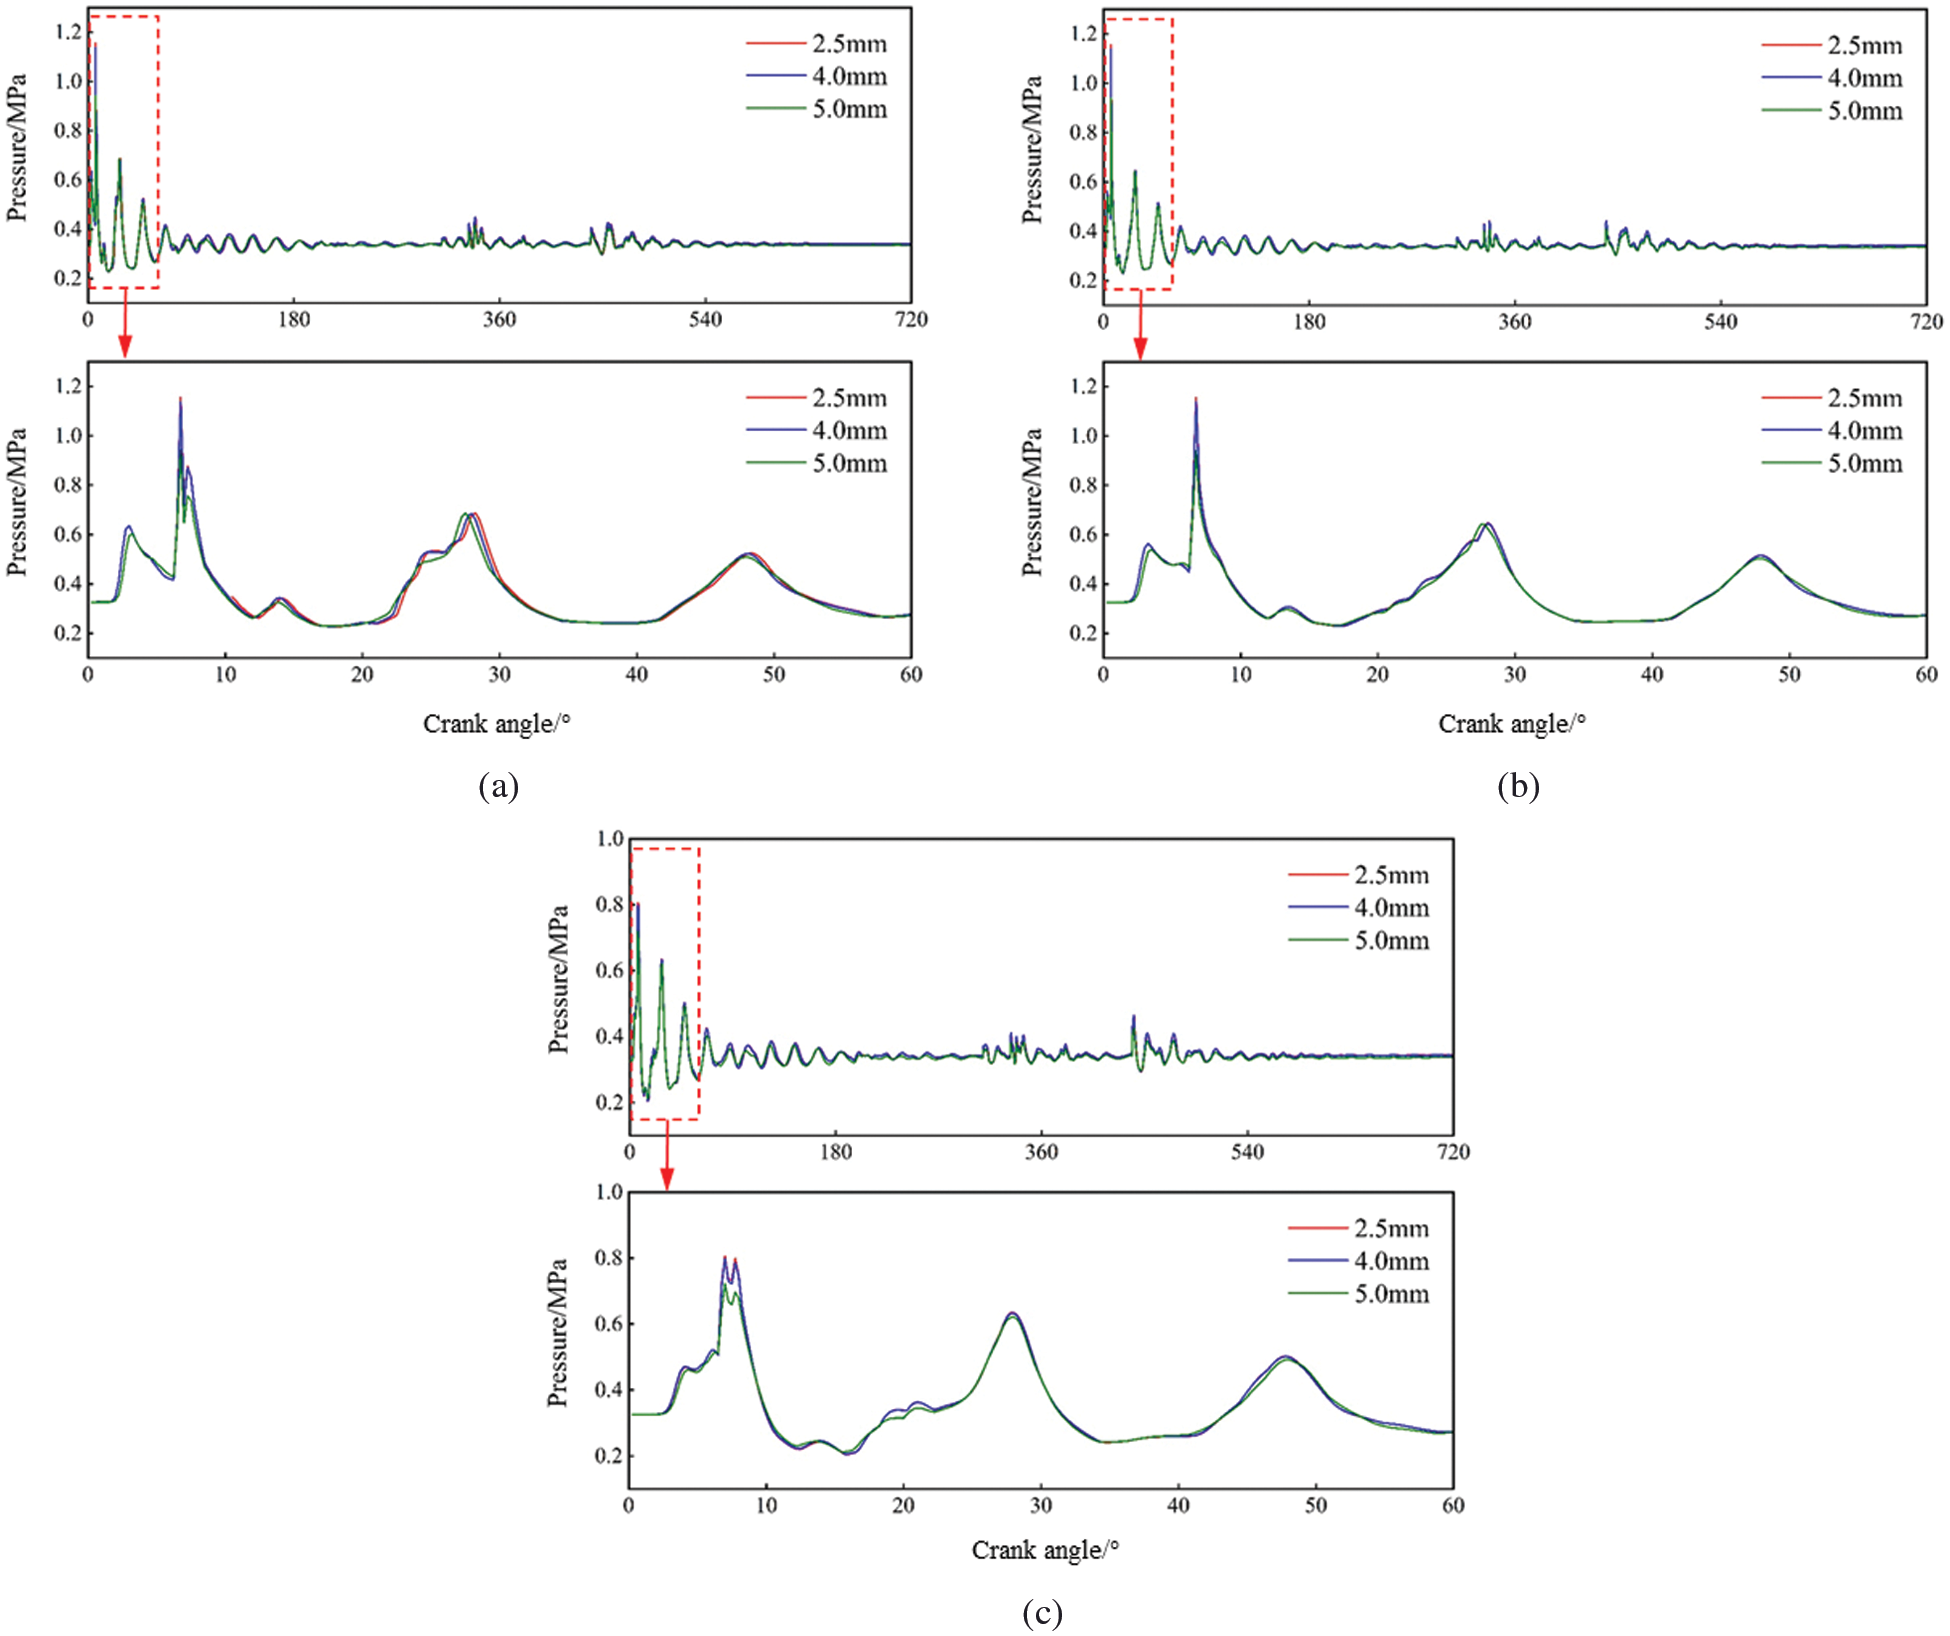
Figure 8: Pressure on the liner wall at (a) The top, (b) The middle, and (c) The bottom regions for different water jacket widths
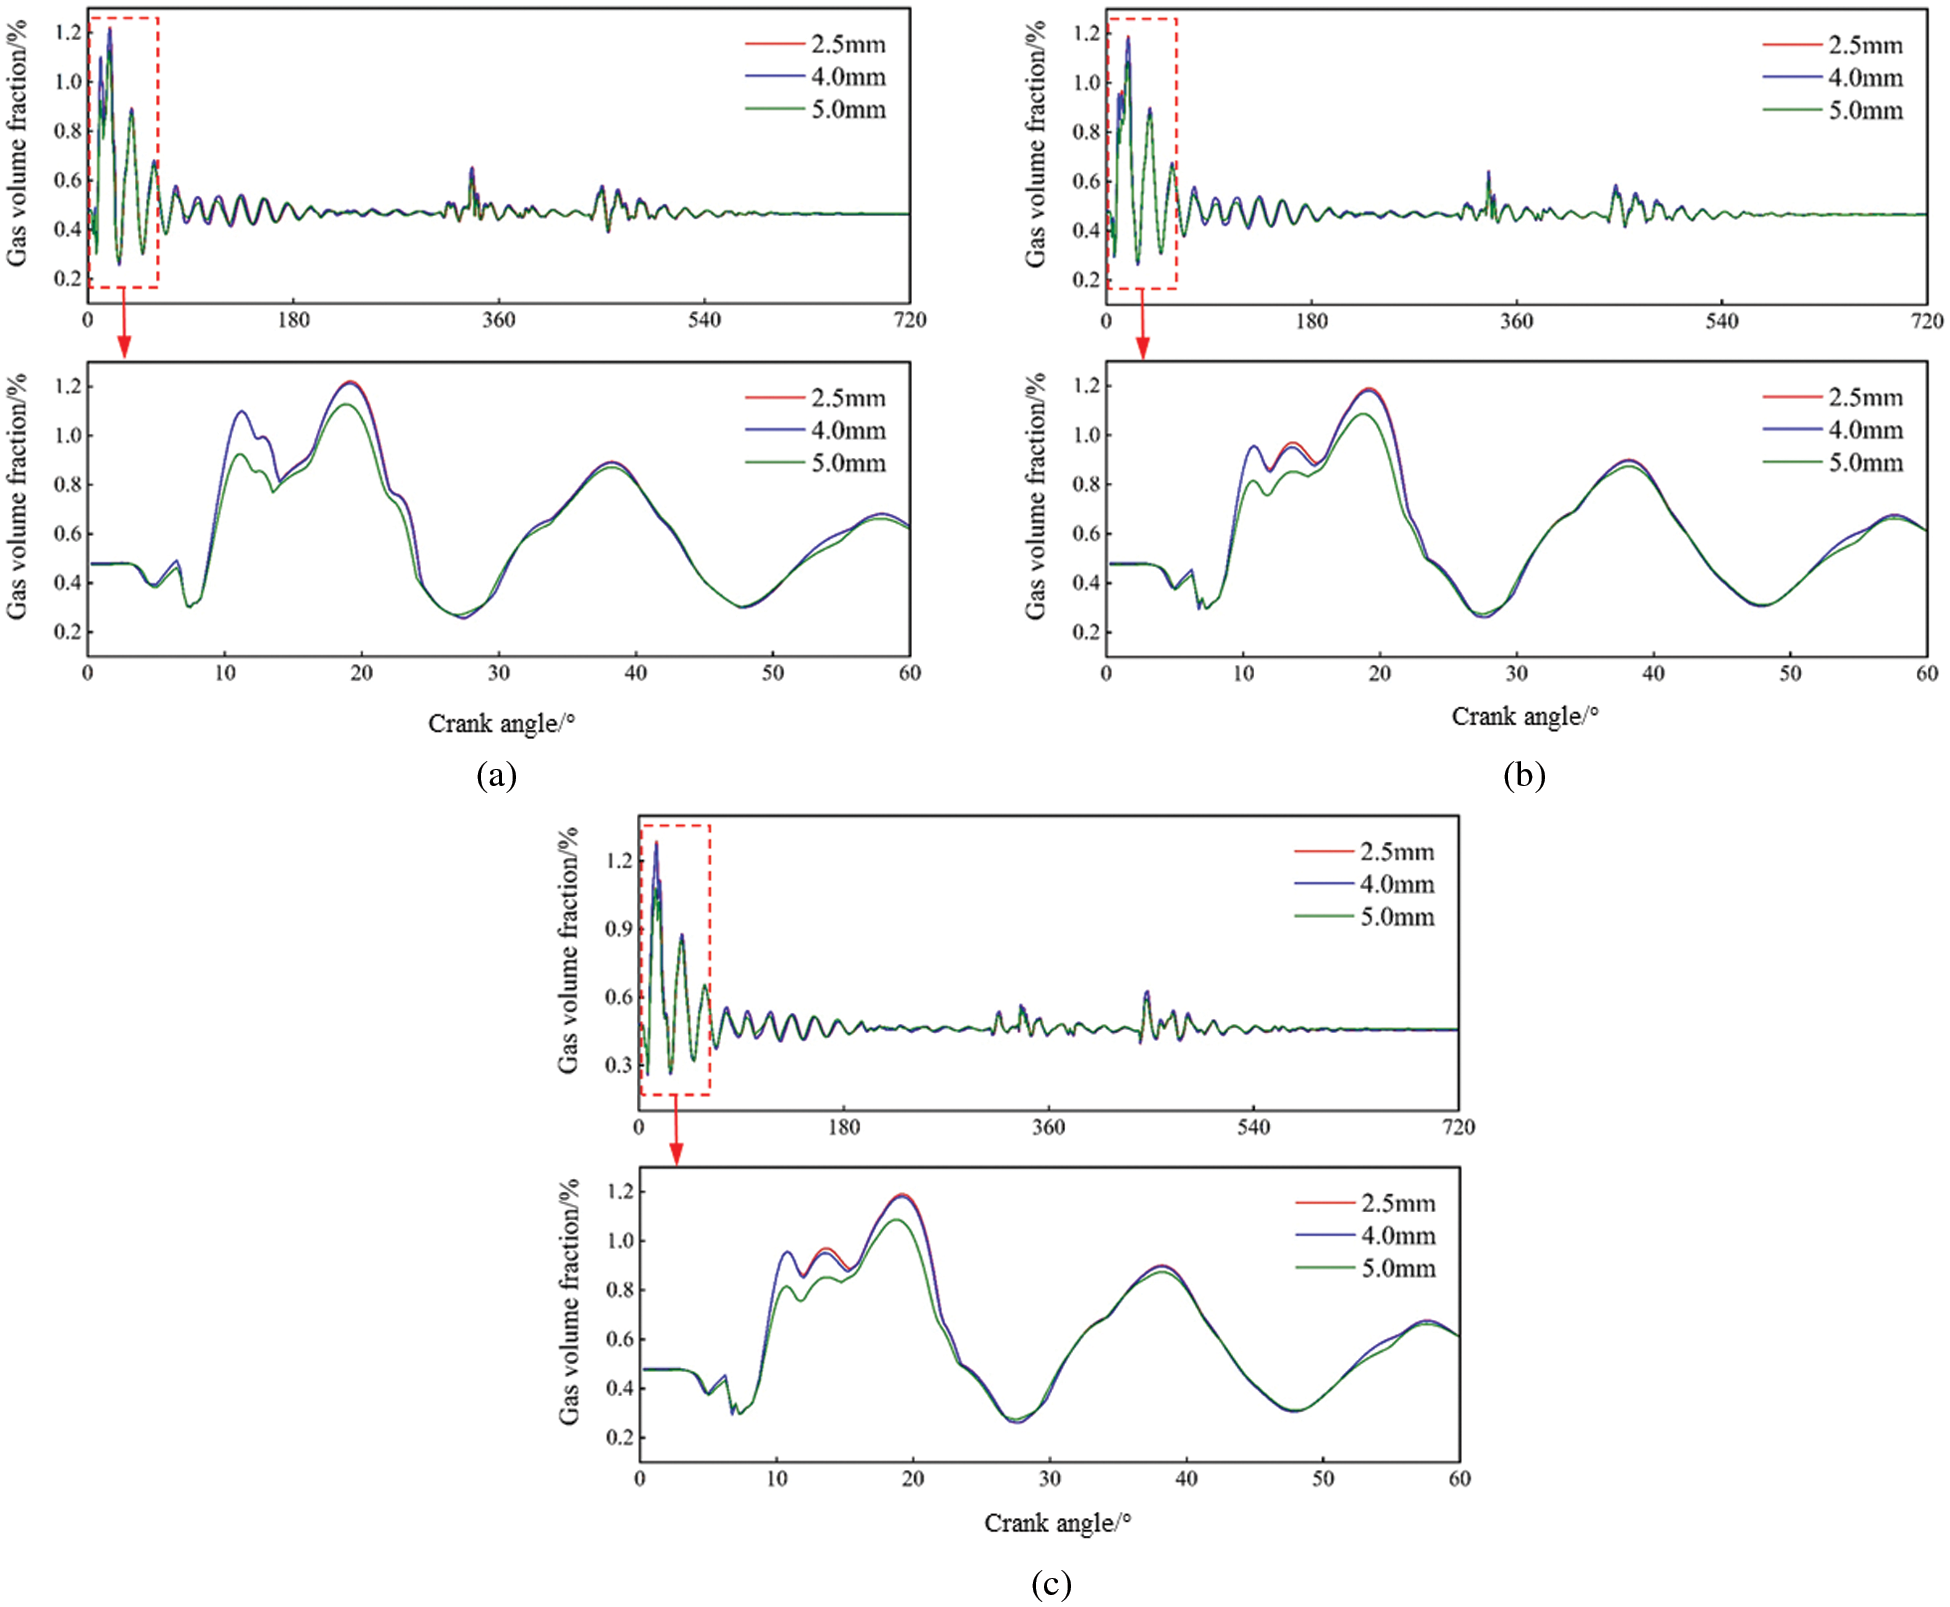
Figure 9: Gas volume fraction for (a) The top, (b) The middle, and (c) The bottom regions for different water jacket widths
4.3 Effects of the Cavitation Bubble Radius
In the near-wall region, a microjet would be generated as a cavitation bubble collapsed towards the liner wall due to the higher pressure away from the wall. The microjet would accelerate along with the cavitation bubble collapse and would reach its peak velocity at the moment of total bubble collapse. The microjet would then continue to move toward the wall and would finally impact the wall. During this process, the initial cavitation bubble radius would determine the departure speed of the microjet, which would then affect the impact pressure on the liner wall. Fig. 10 shows the coolant velocity at the cylinder liner wall during the collapse process for four initial cavitation bubble radii. The peak velocities of the microjets arriving at the wall were all quite similar, approximately 120 m/s. However, the impact pressures caused by the microjets were significantly affected by the initial cavitation bubble radius. As the initial radius increased, the occurrence of the peak pressure on the wall was delayed but the magnitude of the pressure increased from 8.78 MPa (at a 0.075 mm radius) to 13.8 MPa (at a 0.15 mm radius). An increase in the bubble radius caused the microjet to impact the liner wall at a higher speed and a greater pressure, which increased the risk of cavitation erosion of the cylinder liner.

Figure 10: Flow (a) Velocities and (b) Pressures at the liner wall for different cavitation bubble radii
4.4 Effects of the Coolant Temperature
Fig. 11 shows the microjet velocities and pressures for different coolant temperatures. Lower temperatures led to greater microjet impact velocities. At 80°C, the maximum jet velocity produced by the cavitation bubble collapse was 147.7 m/s. When the temperature rose to 95°C, the maximum jet velocity decreased to 106 m/s. The time until the microjet reached the wall also increased as the temperature increased. An increase in the coolant temperature reduced the impact pressure on the liner wall from 18.8 MPa at 80°C to 8.0 MPa at 95°C. Unlike the initial bubble radius, the coolant temperature influenced both the microjet velocity and the impact pressure. The coolant temperature’s influence was also greater than that of the water jacket width and the initial bubble radius. This indicates that increasing the coolant working temperature could effectively reduce the cavitation risk in the cylinder liner of a diesel engine.

Figure 11: Flow (a) Velocities and (b) Pressures at the liner wall for different coolant temperatures
4.5 Effects of Cavitation Bubble Density
Fig. 12 shows the microjet velocities and pressures on the liner wall when there were from one to ten cavitation bubbles. When the number of bubbles increased, the maximum pressure at the center of the wall and the maximum jet velocity both increased by 300%–400% from the values for a single cavitation bubble. From 2 to 10 bubbles, the microjet velocity on the wall continued to increase from 273.3 m/s to 396.1 m/s, but the rate of increase decreased with increasing numbers of bubbles. Unlike the jet velocity, the pressure on the liner wall increased sharply initially but then decreased gradually as more than three bubbles were present. Specifically, the maximum pressure on the wall increased from 11.16 MPa (1 bubble) to 36.55 MPa (three bubbles). When there were four cavitation bubbles, the maximum pressure on the wall decreased to 31.93 MPa. This occurred because the uppermost bubble gradually approached the center of the flow field area, weakening the asymmetry of the region. This decreased the strengthening effect on the lowermost bubble, which resulted in a decrease in the pressure at the center of the liner wall. The maximum pressure at the wall continued to decrease until it was 19.78 MPa for ten bubbles.

Figure 12: Flow (a) Velocities and (b) Pressures at the liner wall for different bubble densities
4.6 Effects of the Water Hammer
Apart from the pulse pressure, a water hammer effect that acted on the liner wall was also generated by the microjets. The water hammer pressure could be calculated using Eq. (8):
where pWH represents the water hammer pressure, c is the sound velocity in the liquid, and vw is the velocity of the microjet impacting the wall.
The water hammer pressures on the wall were calculated using Eq. (8) and are presented in Table 3. Though the pulse pressure on the liner wall dropped as the number of bubbles increased, the water hammer pressure caused by the microjets continued to increase from 186.5 MPa to 603.5 MPa. The water hammer pressures were 1000%–1500% greater than the pulse pressures. This indicates that the damage caused by the water hammer effect could be far more severe than it appeared in the macroscale flow field simulation. The water hammer effect occurred over an extremely short interval in the microsecond scale. This led to a reciprocating impact and damage to the liner wall during operation, and erosion pits could be formed in local regions with poor toughness in the grain boundaries [24]. This indicates that an increase in the bubble density at some local region near the liner wall would significantly increase the possibility of cavitation caused by the microjets generated from the bubble collapses, as well as the likelihood of a subsequent water hammer effect.

(1) The vibration intensity of the cylinder liner had significant effects on the cavitation of the coolant. Increasing the vibration amplitude directly enhanced the pulse pressure and the coolant gas volume fraction. Suppressing the cylinder liner vibration was the most effective way to reduce the risk of cavitation erosion.
(2) Increasing the water jacket width weakened the cavitation; however, a small increase in the width produced little effect. Within the design boundary, a water jacket as wide as possible helped in avoiding cavitation of the cylinder liner.
(3) The cavitation erosion was not sensitive to the initial cavitation bubble radius but was affected by the initial temperature inside the bubble. The latter was determined using the coolant temperature. Increasing the working temperature of the diesel engine’s cooling system could reduce the microjet velocity and the pressure on the wall, which would then reduce the risk of cavitation in the cylinder liner.
(4) The number of bubbles near the wall had obvious effects on the cavitation erosion of the cylinder liner. The velocity of the microjets caused by the bubble collapses increased with increasing numbers of bubbles. Increasing the bubble density not only produced higher pulse pressures near the wall but also led to large water hammer pressures acting on the wall, which directly enhanced the liner damage.
Acknowledgement: We thank LetPub (https://www.letpub.com) for its linguistic assistance during the preparation of this manuscript.
Funding Statement: This work was supported by the Science Fund of the State Key Laboratory of Engine Reliability (No. SKLER-201902).
Conflicts of Interest: The authors declare that they have no conflicts of interest to report regarding the present study.
1. Jamshid, M. N., Ioannis, V., Yan, Y. Y. (2021). Cavitation between cylinder-liner and piston-ring in a new designed optical IC engine. International Journal of Engine Research, 4, 1–15. DOI 10.1177/1460874211008007.
2. Bako, S., Nasir, A., Ige, B. (2020). Cavitational deterioration of diesel power plant cylinder liner. Journal of Mechanical and Energy Engineering, 4(44), 239–246. DOI 10.30464/jmee.2020.4.3.239.
3. Chomik, Z., Łagowski, P. (2019). Cavitation defects in farm vehicle engines. Journal of Research and Applications in Agricultural Engineering, 64(1), 21–24.
4. Khmelev, V. N., Barsukov, R. V., Golykh, R. N. (2020). Method and means of cavitation erosion tests under abnormal conditions. Journal of Physics: Conference Series, 1679(4), 21–24. DOI 10.1088/1742-6596/1679/4/042041.
5. Delprete, C., Zavykia, A., Ldissera, P. (2020). Detailed analysis of piston secondary motion and tribological performance. International Journal of Engine Research, 21(9), 1647–1661. DOI 10.1177/1468087419833883.
6. Adp, A., Ssb, B. (2021). Process intensification of thumba methyl ester (Biodiesel) production using hydrodynamic cavitation. Chemical Engineering Research and Design, 171, 277–292. DOI 10.1016/j.cherd.2021.05.007.
7. Patil, A., Baral, S., Dhanke, P. (2021). Hydrodynamic cavitation for process intensification of biodiesel synthesis-A review. Current Research in Green and Sustainable Chemistry, 4, 100144. DOI 10.1016/j.crgsc.2021.100144.
8. Naraigh, L. O., van Vuuren, D. R. J. (2020). Linear and nonlinear stability analysis in microfluidic systems. Fluid Dynamics & Materials Processing, 16(2), 383–410. DOI 10.32604/fdmp.2020.09265.
9. Ancellin, M., Brosset, L., Ghidaglia, J. M. (2020). On the liquid-vapor phase-change interface conditions for numerical simulation of violent separated flows. Fluid Dynamics & Materials Processing, 16(2), 359–381. DOI 10.32604/fdmp.2020.08642.
10. Zhou, Y. K. (1982). Cavitation erosion of cast iron diesel engine liners. Wear, 76(3), 329–335. DOI 10.1016/0043-1648(82)90071-0.
11. Xu, Z. X., Zhang, J. H., Lin, J. W., Xu, T., Wang, S. et al. (2018). An overall bubble diameter model for the flow boiling and numerical analysis through global information searching. Energies, 11(5), 1297. DOI 10.3390/en11051297.
12. Zhang, J. H., Xu, Z. X., Lin, J. W., Lin, Z. F., Wang, J. C. et al. (2018). Thermal characteristics investigation of the internal combustion engine cooling-combustion system using thermal boundary dynamic coupling method and experimental verification. Energies, 11(8), 2127. DOI 10.3390/en11082127.
13. Steck, B. (2008). Avoiding cavitation on wet cylinder liners of heavy duty diesel engines by parameter changes. SAE Paper, 1, 360073. DOI 10.4271/2008-36-0073.
14. Zade, G. A., Gadekar, D. D. (2007). Accelerated simulation of engine wet cylinder liner cavitation test procedure. SAE Paper, 313–319. DOI 10.4271/2007-26-023.
15. Dhanke, P. B., Wagh, S. M. (2020). Intensification of the degradation of Acid RED-18 using hydrodynamic cavitation. Emerging Contaminants, 6, 20–32. DOI 10.1016/j.emcon.2019.12.001.
16. Xia, D. S., Sun, C. G., Liu, Y. Z., Zhang, H. C. (2018). Numerical simulation of micrometer-sized bubble collapse near a rigid boundary. Tribology, 38(6), 711–720. DOI 10.16078/j.tribology.2018082.
17. Ohl, C., Arora, M., Dijkink, R., Janve, V., Lohse, D. (2006). Surface cleaning from laser-induced cavitation bubbles. Applied Physics Letters, 89(7), 74102. DOI 10.1063/1.2337506.
18. Jin, K., Sun, C., Yu, Y., Liu, Y. Z., Xia, D. S. (2018). Numerical investigation of collapse of a bubble near the rigid boundary with specific microstructure. Journal of Physics: Conference Series, 1064, 12048. DOI 10.1088/1742-6596/1064/1/012048.
19. Zhang, L. X., Wen, Z. Q., Shao, X. M. (2013). Investigation of bubble-bubble interaction effect during the collapse of multi-bubble system. Chinese Journal of Theoretical and Applied Mechanics, 45(6), 861–867. DOI 10.6052/0459-1879-13-067.
20. Zhang, L. X., Zhang, J., Shao, X. M. (2020). The analysis of pressure wave energy during the collapse of the cavitation bubble. Acta Aerodynamica Sinica, 38(4), 807–813. DOI 10.7638/kqdlxxb-2020.0039.
21. Dhanke, P., Wagh, S., Patil, A. (2020). Treatment of fish processing industry wastewater using hydrodynamic cavitational reactor with biodegradability improvement. Water Science & Technology, 80(1), 2310–2319. DOI 10.2166/wst.2020.049.
22. Dhanke, P., Wagh, S. (2020). Treatment of vegetable oil refinery wastewater with biodegradability index improvement. Materials Today: Proceedings, 27, 181–187. DOI 10.1016/j.matpr.2019.10.004.
23. Li, G. L. (2020). Simulation of the thermal environment and velocity distribution in a lecture hall. Fluid Dynamics & Materials Processing, 16(3), 549–559. DOI 10.32604/fdmp.2020.09219.
24. Wang, Y. M., Xu, H. X., Qu, J. X. (2004). Cavitations erosion and corrosion in engine cylinder failures. Heat Treatment of Metals, 2, 61–64. DOI 10.1109/JLT.2003.821766.
 | This work is licensed under a Creative Commons Attribution 4.0 International License, which permits unrestricted use, distribution, and reproduction in any medium, provided the original work is properly cited. |