| Fluid Dynamics & Materials Processing |
DOI: 10.32604/fdmp.2022.018561
ARTICLE
Analysis of the Thermal Performance of External Insulation in Prefabricated Buildings Using Computational Fluid Dynamics
1Huanghe Science and Technology College, Zhengzhou, 450000, China
2Group LLC of Henan Province, The First Construction Work, Zhengzhou, 450000, China
*Corresponding Author: Ang Wang. Email: apqdeo@163.com
Received: 02 August 2021; Accepted: 14 December 2021
Abstract: This paper investigates the thermal performance of prefabricated exterior walls using the Computational Fluid Dynamics method to reduce energy consumption. The thermal performance of the prefabricated exterior wall was numerically simulated using the software ANSYS Fluent. The composite wall containing the cavity is taken as the research object in this paper after analysis. The simulation suggests that when the cavity thickness is 20 mm and 30 mm, the heat transfer coefficient of the air-sandwich wall is 1.3 and 1.29, respectively. Therefore, the optimal width of the cavity is 20 mm, and the most suitable material is the aerated concrete block. In addition, a comparative analysis is conducted on the cavity temperature in the wall under different conditions. It is proven that an intelligent environment control system can significantly improve thermal efficiency and provide a solid theoretical basis for further research in the external insulation of prefabricated buildings.
Keywords: Fluid mechanics; prefabricated building; FLUENT software; architectural cavity; thermal performance
The rapid development of modern society is inseparable from the reserve energy, a critical material basis for the continuation of human culture [1]. Therefore, countries worldwide attach particular importance to strategic energy planning. Global energy resources are finite. However, industrialization constantly increases the demand for traditional energy sources [2].
Building energy efficiency has become a rigid index for the modern construction industry [3]. Energy loss of the whole building mainly refers to the loss of heat energy diffusing to the external space through the outer protective structure of facilities, such as walls and windows. Walls occupy the largest area of the defensive design, and heat loss through walls accounts for 25% of a building’s total energy loss. Thus, walls play a critical role in buildings’ energy conservation. Because of its low thermal conductivity, air has a better thermal insulation effect than general thermal insulation materials. Air interlayers are commonly used in the peripheral protective structures of prefabricated buildings for thermal insulation, such as multi-layer glass windows, exterior walls, and exterior solar chimneys [4]. The thermal insulation board in the building can keep the indoor environment at a reasonable temperature by controlling the distribution of the airflow field. Traditional thermal insulation boards are usually designed based on experience and simple theoretical analysis. Applying fluid mechanics can optimize the conventional thermal insulation boards. It can accurately calculate the distribution of gas flow and flow field in the interlayer in the thermal baffle, which is convenient for studying the board’s thermal performance. Scholars have conducted various studies and attempts on the thermal properties of different materials. For example, Fathabadi [5] evaluated the effect of graphite composite on the performance of lithium-ion batteries; Lamrani et al. [6] studied the thermal performance of the solar wood dryer. However, these studies mainly adopted traditional architectural research methods and rarely used related software for simulation analysis. Besides, there are few studies on the fluid properties of thermal insulation boards.
This paper uses the average heat flux as the thermal performance evaluation index. The FLUENT software is used for experimental simulation to analyze the thermal performance of the exterior insulation board. Several significant factors affecting the heat transfer of the wall are discussed to determine the most crucial factors affecting the thermal performance of the insulation board [7]. The innovation of this research lies in using the related software for simulation analysis combined with the relevant fluid mechanics principles, which were seldom used by predecessors. This research aims to use the air interlayer to improve the thermal performance of the composite wall, reduce the heat loss of the surrounding wall panels, improve the utilization rate of building thermal energy, and enhance the thermal insulation effect. Therefore, this exploration has promising application prospects and crucial practical significance.
2 Simulation Analysis of Thermal Performance of Air-Sandwich Insulation Boards
2.1 Basic Structure of Building Walls
There are diverse ways to classify walls in the building. According to their position in the building, they are divided into internal and external walls; according to the layout direction, they are divided into horizontal and longitudinal walls; according to whether they are stressed or not, they are divided into load-bearing and non-load-bearing walls; according to building materials and pouring methods, they are divided into solid, hollow, and composite walls. The research object reported here is the building’s exterior non-bearing thermal insulation wall.
The thermal performance of the air interlayer in the wall is closely related to the airflow in the wall. Computational Fluid Dynamics (CFD) is a branch of fluid dynamics. Its development primarily depends on the progress of the aerospace industry and is influenced by methods or theories, such as grid generation, numerical calculation, and differential equations [8]. CFD uses numerical solutions of the governing equations of fluid dynamics to quantitatively describe discrete flow fields to accurately predict fluid motion [9].
The basic conservation laws of mass, momentum, and energy are derived based on the assumption of the energy continuum [10–12]. These laws’ general integral form can be written as Eq. (1).
In Eq. (1), V represents the control volume; S denotes the boundary of the control volume; Q refers to the conserved quantity; Fi (Q) indicates the convective flux; Fv (Q) indicates the diffusive flux; J stands for the production term (a volume force of momentum equation modeled by the Boussinesq Approximation). The total energy of unit mass
where Cv represents the specific heat at constant volume, and T refers to the temperature.
The diffusive flux in the energy equation can be expressed as:
where
The calculation domain is re-divided to solve the governing equation. The governing equation is discretized in time and space and separated into finite non-overlapping control bodies. The governing equation is discretized in integral form. The governing equation can be written as Eq. (8).
In Eq. (8),
In addition, Eq. (9) describes the turbulent viscosity model.
In Eq. (9),
A high-quality computational grid needs to be characterized by reasonably sized cells. The automatic construction algorithm for adaptive-sized cells dramatically reduces the frequency and intensity of user interaction. The core data architecture of the grid generation module is extended. The liquid solution uses the standard CFD General Notation System format, and the solid solution adopts the Bitmap Distribution Format. The algorithm model is designed through the top-up process, and the boundary recovery algorithm is used to insert a specific number of Steiner points. The P-multi grid is different from the original grid and iterates with different precisions to speed up convergence. Its error frequency is high in high-order accuracy, and result correction can accelerate the convergence. The turbulence model used here is the Spalart-Allmaras model, which has low computational complexity and can achieve an excellent measurement effect on relatively complex boundary layer problems.
2.3 Prefabricated Buildings and Existing Assembly Systems
A prefabricated building is a new type of building. Its standard components or accessories (such as floors, wallboards, and stairs) are processed and produced in batches in the factory and then transferred to the construction site for direct assembly through specific connection methods [13]. Unlike the traditional construction method, many components of prefabricated buildings are directly processed by the production workshop, improving work efficiency and meeting green buildings’ requirements [14].
At present, there are multiple mainstream assembly systems in the construction industry, including fully prefabricated shear wall systems, double-sided composite shear wall systems, and PCF + PC shear wall systems. The main difference among them lies in the design of exterior wall panels [15]. The PCF + PC shear wall system integrates precast concrete facade (PCF) panels and precast concrete (PC) panels. PC panels are divided into external and internal wall panels. Generally, the exterior wall panel has high requirements for thermal insulation, fire prevention, noise reduction, and impermeability performance. At present, the PCF + PC shear wall system is mature and extensively used in the market. Still, its production efficiency needs to be improved because its non-planar parts are manufactured by machine. Prefabricated buildings are easy to build and disassemble, so this paper selects the wallboard of prefabricated buildings as the research object, which is convenient for software simulation and analysis.
2.4 Building Cavity and Indoor Thermal Environment
The indoor thermal environment of a building is a crucial index to measure the heat of the building cavity. There is an inevitable interplay between the indoor thermal environment and residents’ activities [16]. The building is the carrier of the indoor thermal environment that is directly affected by airflow velocity, temperature, and humidity. It is thus clear that the indoor thermal environment of the building is the result of the joint action of humans, buildings, and the local climate. Among the three factors, the external protective structure of the building can isolate people from the external environment. The indoor space is the premise of forming the indoor thermal environment. Thereby, the exploration of the indoor thermal energy loss in the building should focus on the thermal insulation and heat dissipation performance of the envelop enclosure of buildings. Fig. 1 displays the source and loss of heat in the indoor thermal environment.
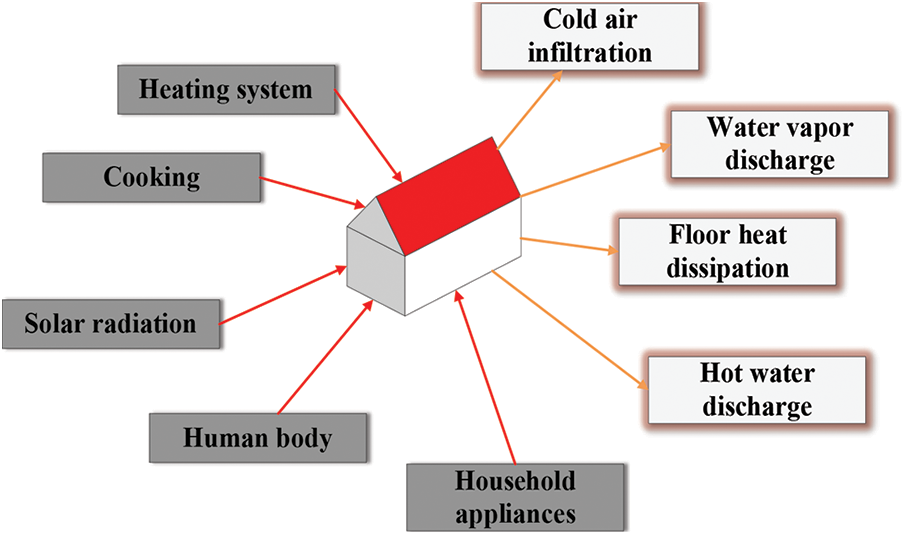
Figure 1: Heat exchange in the indoor environment
The heat of the indoor environment mainly comes from the following aspects:
(1) the heat emission of the human body in a building;
(2) sunlight transmitted to the room through walls and windows;
(3) the heat provided by the heating equipment inside the building;
(4) the heat emitted by household appliances in use.
The heat loss of the indoor thermal environment is manifested in the following aspects:
(1) heat loss through the floor;
(2) heat absorbed by indoor water evaporation;
(3) the heat transferred from the room with a higher temperature due to the temperature difference on both sides of the envelope structure, such as walls and windows.
2.5 Air Interlayer and Building Envelop
2.5.1 Composition and Classification of Multi-Cavity Air-Sandwich Insulation Wall
The air interlayer placed in the multi-cavity composite wall has an excellent insulation effect due to the poor thermal conductivity of air. The built-in air interlayer is also called a cavity, which can balance the pressure inside and outside the wall and remove the moisture inside the wall [17]. The multi-cavity composite wall comprises the outer panel, air interlayer, and inner panel. The air interlayer forms a cavity between the inner and outer panels. New materials such as activated carbon and lightweight cement can be used in outer and inner panels.
The air interlayer in the multi-cavity composite wall can be divided into closed interlayers and circulating interlayers. The difference lies in whether the interlayer is sealed or not. Circulating interlayers involve mechanical circulation and natural circulation. In addition, the height and width of the air interlayer are relatively large, but the gap is very narrow. In addition, most of the air interlayers are tall and wide, but the gap is very narrow. Functionally, the air interlayer can improve indoor thermal comfort by reducing the cooling and heating load of the building by supplying cooling and heating. Fig. 2 presents the characteristics and performance of the air interlayer. A closed sandwich allows thermal insulation and passive cooling. The natural circulating interlayer can realize passive cooling, natural ventilation, and hot air heating. The mechanical circulating interlayer can complete the air circulation of hot air heating, fresh air feeding, and heat dissipation photovoltaic panels.
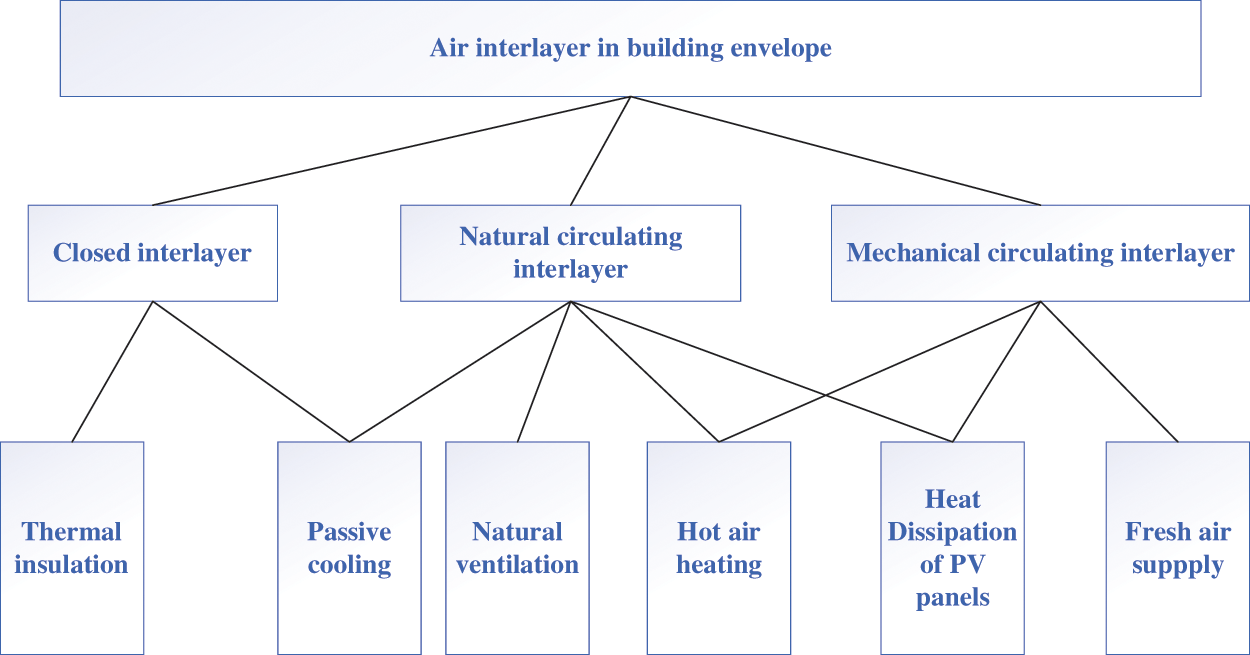
Figure 2: Characteristics and performance of the building envelop with air interlayers
2.5.2 Application of Air Interlayers in the Building Envelop
It has been common to use the internal air interlayer in the building envelope for insulation in recent years. For example, the air interlayer is applied to the external windows and exterior walls. Exterior windows include multi-layer windows and multi-glazed windows [18]. Practice has proved that increasing the number of glass layers of external windows can effectively enhance the sealing performance of the enclosure structure and reduce the heat loss in the building. At present, single-layer, double-layer, and multi-layer glass windows are widely used, which constitute one or more closed air interlayers inside the window to enhance the overall heat transfer performance. Fig. 3 displays the effects of the double-glazed window, triple-glazed window, and four-glazed window. There is an optimum range of widths for the air interlayer between the two glazings in double-glazed windows. Within this range, the larger the width, the smaller the heat transfer coefficient; outside this range, increasing the width of the gap will only increase the cost and cannot continue to optimize the heat-retaining property. The experimental results demonstrate that the triple-glazed window can reduce the window heat transfer loss by half compared with the double-glazed window [19].
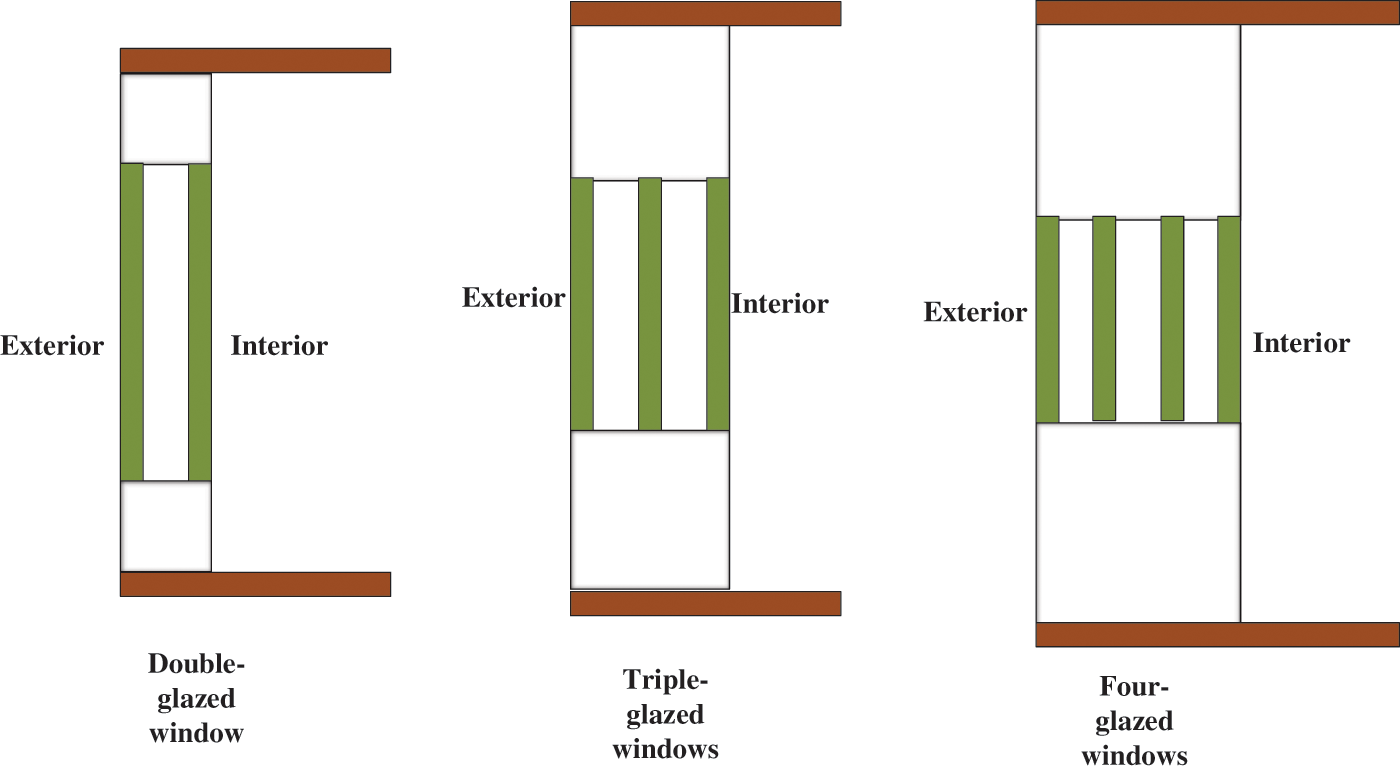
Figure 3: Physical models of double-glazed, triple-glazed, and four-glazed windows
2.6 Thermal Performance Parameters of Wallboards
2.6.1 Heat Transfer Coefficient and Thermal Resistance of Walls
Under the condition of stable heat transfer, when the air temperature difference between the two sides of the enclosure structure reaches 1°C, the heat transferred per unit area in unit time is the K value of the heat transfer coefficient (unit: watt). Eq. (10) describes the heat transfer coefficient K of the wall, and Eq. (11) indicates the thermal resistance of the wall.
In Eq. (10), R0 represents the heat transfer resistance of the wall.
In Eq. (11), Ri denotes the heat exchange resistance of the internal surface of the wall; Re signifies the heat transfer resistance of the external surface of the wall; R refers to the overall thermal resistance of the envelop enclosure.
2.6.2 Thermal Effusivity and Thermal Inertia Index of Wall Materials
In areas with indoor heating, heat loss from buildings is roughly a unidirectional but dynamic process in summer or winter. In this case, it is not enough to evaluate the heat transfer only by using the value of heat transfer coefficient K. The thermal inertia index D must be used to evaluate the thermal properties of the wall.
The thermal storage coefficient refers to a material’s ability to exchange heat with the surrounding environment. When the ambient heat on both sides of the wall changes and the wall surface temperature fluctuates to 1°C, the maximum heat flux introduced into the object only depends on the thermophysical properties of the material itself. The thermal storage coefficient is solved by Eq. (12).
In Eq. (12), S refers to the thermal storage coefficient of wall material; ρ stands for the density of wall material; C represents the specific heat capacity of wall material; λ denotes the thermal conductivity of wall material; T signifies the fluctuation period of temperature.
Eq. (13) shows that the density, specific heat capacity, and thermal conductivity of materials are positively correlated to the thermal effusivity of wall materials. The higher the value of these physical quantities, the stronger the wall’s heat storage capacity and the stronger the resistance to temperature fluctuations.
The thermal inertia index D measures the periodic fluctuation and attenuation degree of the internal temperature of the wall, as presented in Eq. (13).
In Eq. (13), D, R, and S are the thermal inertia index, thermal resistance, and thermal storage coefficients of the wall material.
Heat flux is a vector to measure the amount of heat transferred per unit interface area per unit time. Heat can be transferred via different mechanisms, like conduction and convection. The magnitude and direction of the heat flux reflect the extent and route of heat transfer. Heat flux is calculated according to Eq. (14).
In Eq. (14), q denotes the heat flux, Q represents the total heat transferred, S indicates the cross-sectional area during heat transfer, and t refers to the time spent in heat transfer.
The τ is calculated according to Eq. (15).
In Eq. (15),
2.6.4 Thermal Principle and Structural Design of Multi-Cavity Composite Walls
The composite air-sandwich wall has two different thermal principles: heat preservation and insulation. Heat preservation means that the wall prevents the transfer of indoor heat to the outside, reducing the heat loss in the building in cold winter; heat insulation means that the wall prevents the outdoor heat from entering the building to maintain the low-temperature state of the wall in summer [20]. The heat transfer and internal resistance coefficients are adopted to evaluate the thermal insulation performance of wall materials under a given highest temperature of the internal components of the wall in summer. Fig. 4 presents the design of the thermal insulation cavity structure. There is a hollow air interlayer between the two panels of the building’s outer wall for the circulation of air and fluids, heat preservation, and thermal insulation.
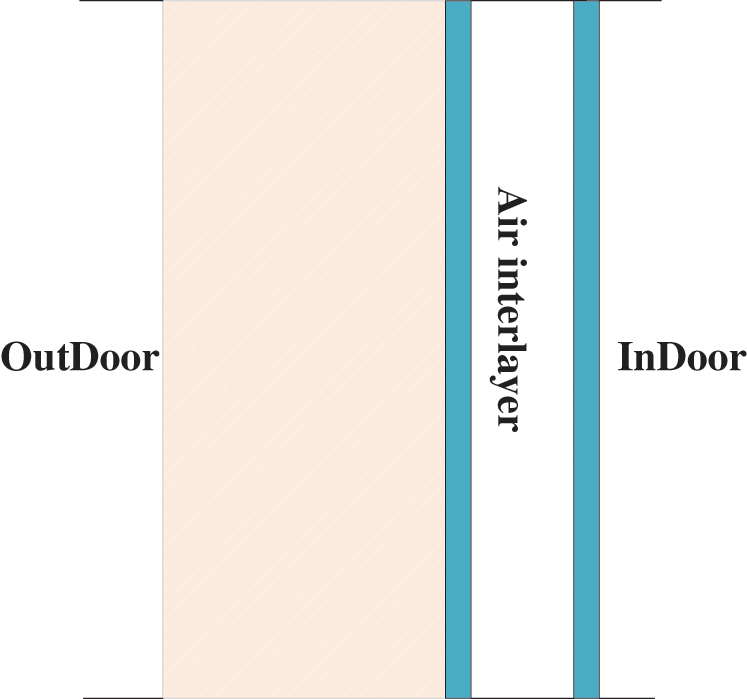
Figure 4: Design of the thermal insulation cavity structure
2.7 Simulation Analysis on Thermal Performance of the Prefabricated Air Sandwich for Exterior Insulation Walls
2.7.1 Principal Influencing Factors of Thermal Performance of Multi-Cavity Composite Walls
The analysis of the heat transfer coefficient K and thermal resistance R of the wall suggests that the thickness of the air interlayer is directly related to them. Under various cavity thicknesses, the air velocity inside the air interlayer will have different effects on convection [21]. The natural convection in the air interlayer is mainly concentrated on the inner and outer interfaces, and heat transfers from the high-temperature side to the low-temperature side. Increasing the thickness of the cavity can enhance the thermal resistance, the most common example being double-glazed windows. In addition, the temperature difference between the wall panels on both sides of the air sandwich also affects the thermal performance of the cavity. For instance, the temperature difference between the inside and outside of the building is large in winter, which will lead to poor insulation effect of the wall. Moreover, the thickness and permeability of the wall material will also affect the thermal properties of the wall, such as the heat transfer coefficient.
2.7.2 Establishment of the Calculation Model
The heat transfer process of wallboard is quite a complex problem in real life. The wall panel structure, the material of the insulation layer, and the temperature difference between the indoor and outdoor all significantly impact the heat transfer of the wall panel. To simplify the problem and facilitate the simulation experiment, it is assumed that the convection of the air interlayer inside the wall is natural convection in the heat transfer process of the wall panel; the air density inside the interlayer is only affected by the ambient temperature; the influence of indoor and outdoor temperature difference on the physical properties of wall materials is not considered. Fig. 5 reveals a simplified model of the multi-cavity composite wall. The air and fluid in the cavity form an insulating layer. The circulation of air and fluid will store heat in the wall and reduce the heat transfer energy consumption.
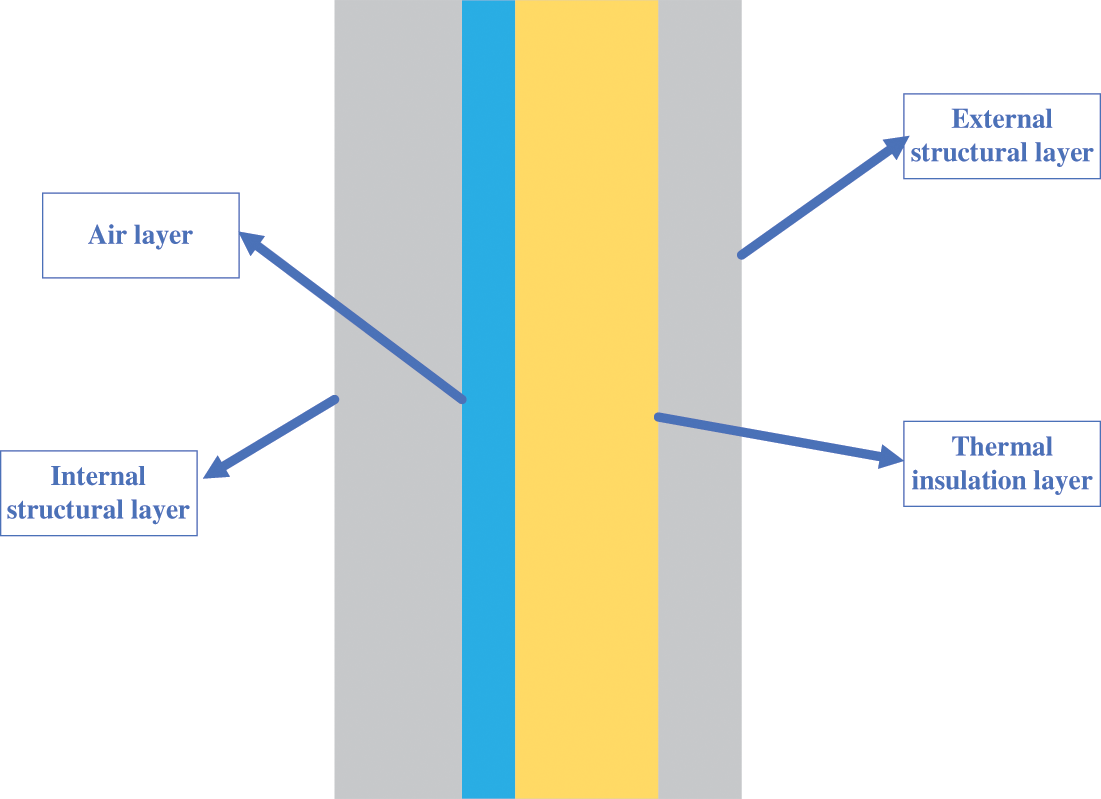
Figure 5: Structure of the multi-cavity composite wall
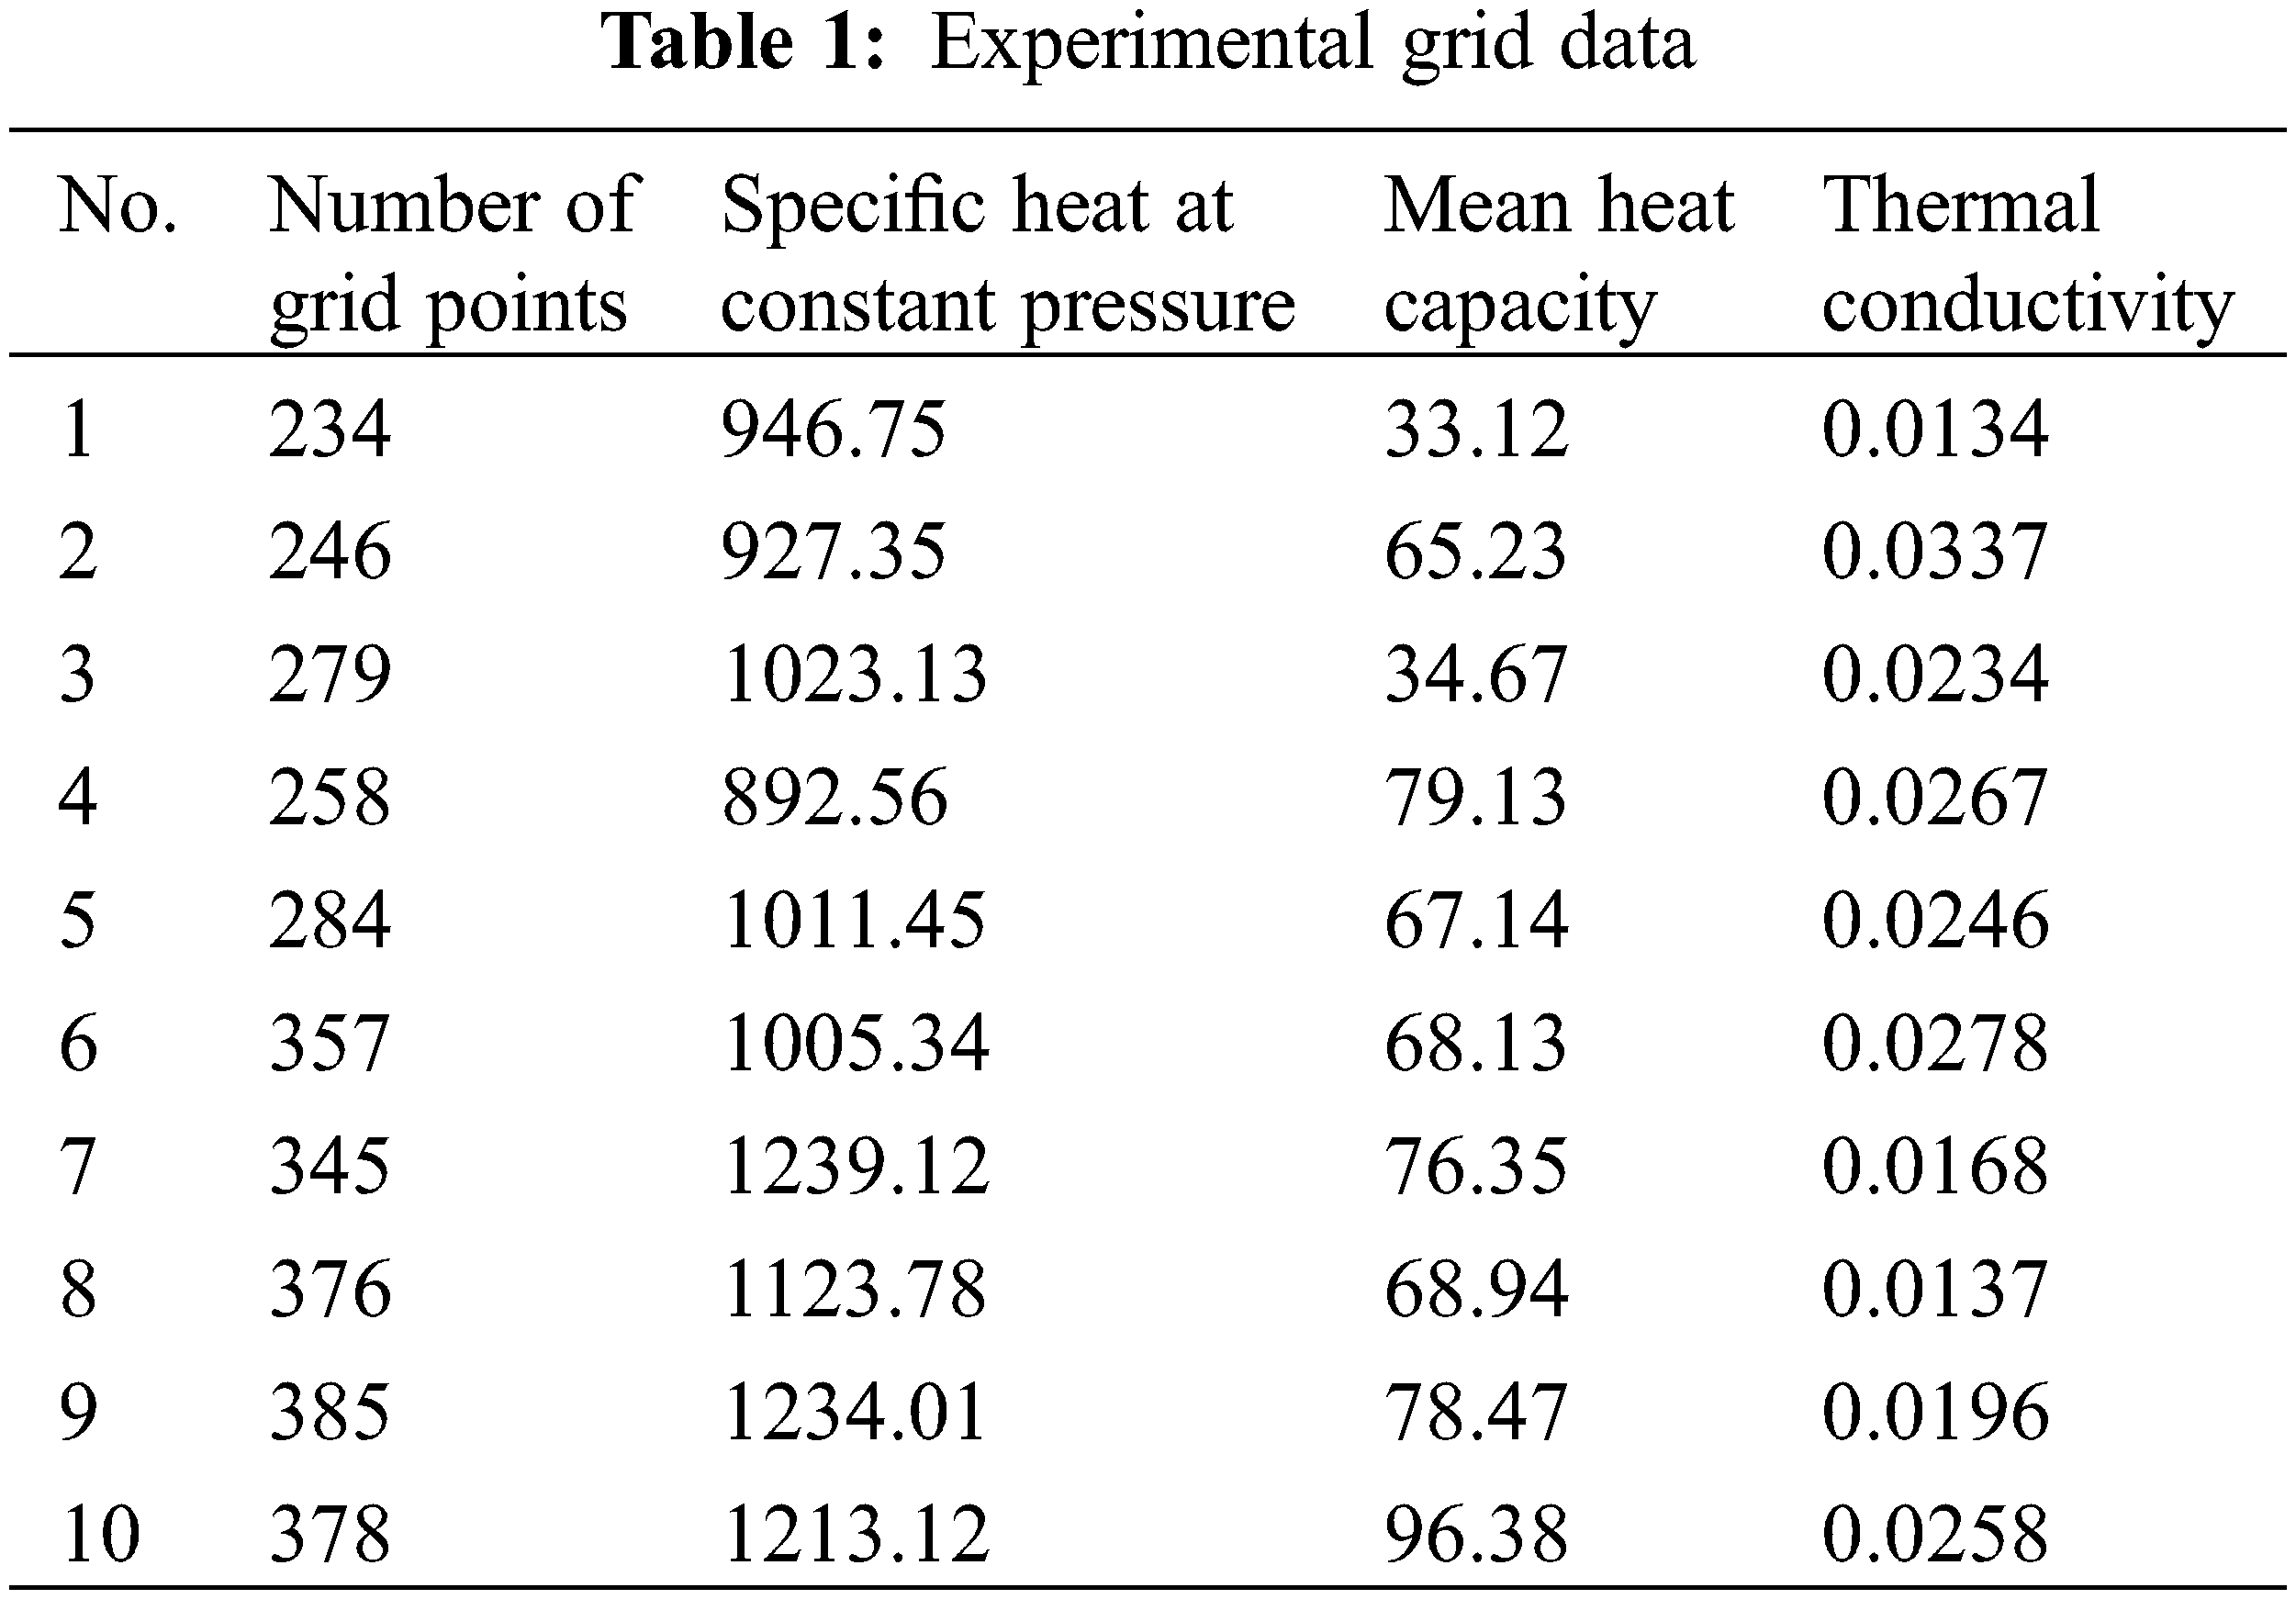
The Time in the FLUENT Solver is set to steady state, and the Space is set to a three-dimensional structure. The governing equations contain the flow, energy, and turbulence equations. The air density parameter is 1.225, the constant pressure specific heat is 1006.43, and the thermal conductivity is 0.0242. There are 2,716,985 meshes to enhance the simulation effect. The air inlet is set as the speed inlet, and the air outlet is set as the pressure outlet. The fluid type of other indoor objects is set as the wall, the air value on the wall is set as 0, and the power value of lamps in the building is 40 W. The uncoupled implicit algorithm in FLUENT is adopted to solve the fluid equation. This fairly mature algorithm has been extensively validated in applications to simulate CFD problems of low-velocity flows. The finite element method is used as the spatial numerical scheme of this paper to divide the solution region into connected and non-overlapping finite sub-regions. The approximate solution is the product of the node function value and the basis function. The numerical solution can reach second-order or even higher accuracy [22,23]. At different grid nodes, the specific heat and thermal conductivity of the object will change due to different temperatures and materials. Some experimental data after meshing are summarized in Table 1.
3.1 Analysis of Simulation Results under Different Cavity Thickness
The influencing factors of the average heat flux of wallboards are analyzed by software to study the thermal properties of insulation boards. In this experiment, FLUENT software is used to compare the temperature differences between the inside and outside of the multi-cavity wall under different cavity thicknesses, materials, and wall thicknesses. Fig. 6 illustrates the changing trend of average heat flux corresponding to different cavity thicknesses through the experimental simulation. It reveals that the heat transfer coefficient of glass decreases with the increase of the air interlayer thickness at the beginning. When the air interlayer thickness is 14 mm, the heat transfer coefficient of the outer window is the lowest, about 2.722. Subsequently, the heat transfer coefficient does not change significantly with the thickness of the air interlayer. Therefore, the optimal inner cavity thickness of double-glazed windows is 14 mm. In Fig. 6, the upper abscissa represents the wall thickness, and the right ordinate denotes the average heat flux. Fig. 6 suggests that the heat flux is dramatically reduced when the wall thickness increases from 10 mm to 20 mm, and the heat flux of the 20 mm-wall is 29.61% lower than that of the 10 mm-wall. Moreover, the heat flux change tends to be stable when the wall thickness exceeds 20 mm, indicating that the optimal thickness should be 20 mm.
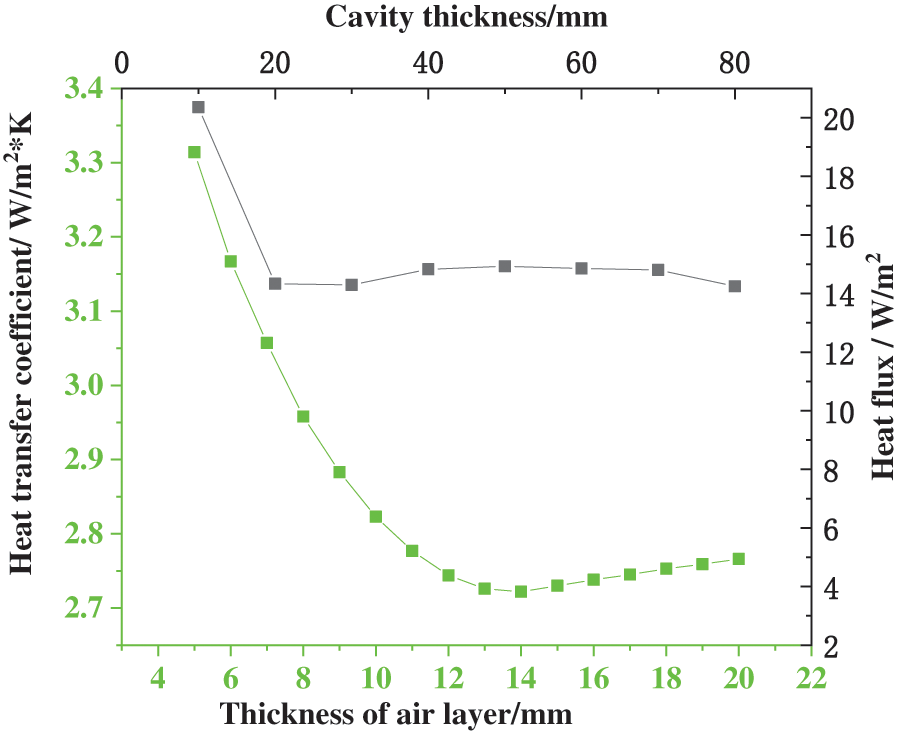
Figure 6: Relationship between air interlayer thickness and heat transfer coefficient
3.2 Analysis of Simulation Results under Different Cavity Heights
Furthermore, this experiment simulates the effect of wall height on the temperature change and average heat flux at the current measurement location of the multi-cavity composite wall. The FLUENT software sets the wall heights to 600 mm, 900 mm, 1200 mm, and 1500 mm in sequence. Fig. 7 provides the statistical simulation results, demonstrating that the growth of cavity height causes a minor decrease in the average heat flux of the wall. Meanwhile, increasing the cavity size can significantly reduce the average heat flux. Hence, cavity height within a specific range slightly influences the thermal performance of walls.
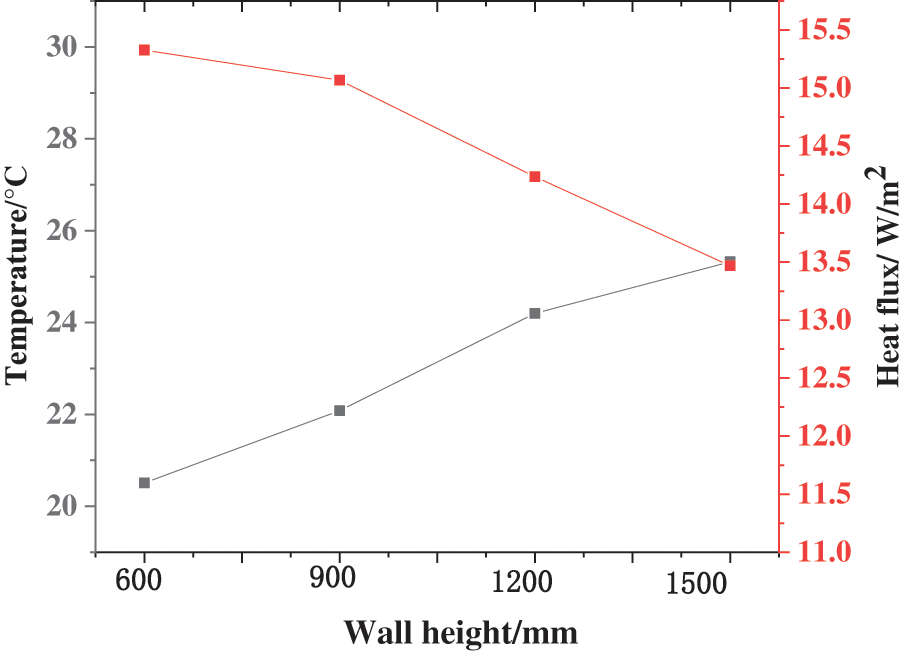
Figure 7: Variation of average heat flux under different cavity heights
3.3 Analysis of Simulation Results under Different Wall Materials
Fig. 8 shows that different materials’ average heat flux also has some differences under the same cavity thickness. The heat flux of the concrete slab is the largest among the three materials, and that of the aerated concrete block is the smallest. The heat flux of the wall is linearly proportional to the thermal conductivity of the wall material. In conclusion, the insulation effect of aerated concrete blocks is the best. Compared with an aerated concrete block of 40 mm, the heat flux of the 60 mm-block is not apparent. The results suggest that the change of wall material has a more significant effect on heat flux than the thickness of the cavity.
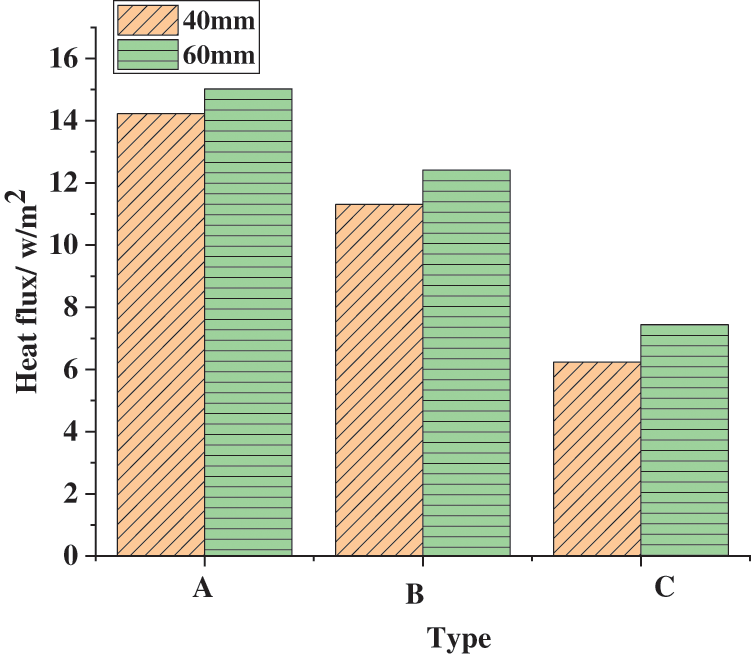
Figure 8: Effect of different materials on average heat flux of walls (the abscissa signifies the three types of materials for comparison; A is concrete slabs, B is hollow concrete bricks, and C is aerated concrete blocks)
3.4 Analysis of Simulation Results under Different Temperature Differences
FLUENT sets two experimental groups with a temperature difference of 16°C and 8°C to compare and analyze the temperature changes in the cavity. The experimental results in Fig. 9 demonstrate that the more significant the temperature difference, the faster the gas velocity in the cavity. In other words, changes in the external ambient temperature accelerate the airflow in the cavity.
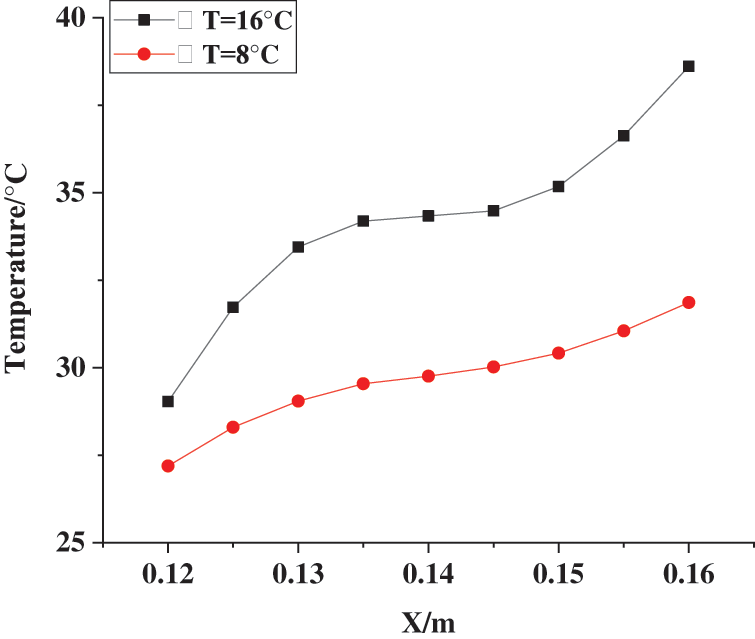
Figure 9: Temperature change inside the cavity under two kinds of temperature differences (the abscissa is the distance between the current measuring point and the lower edge of the wall, and the ordinate is the temperature of the current measuring point)
The above results prove that the cavity thickness, the material and thickness of the wall panels on both sides of the cavity, and the temperature difference between the inner and outer walls all change the thermal insulation performance of the wall. The temperature difference inside and outside the cavity and the wall material significantly affects the heat flux. Nonetheless, wall height has no significant effect on heat flux. In short, the 20 mm thick thermal insulation wallboard with aerated concrete blocks can maintain the best thermal insulation effect when the temperature difference between the inner and outer walls is 8°C.
Manoram et al. [24] found that the temperature difference and heat transfer rate between the two walls changed significantly with every 2 mm increase in furnace wall thickness. This conclusion is consistent with this paper. Tang et al. [25] numerically simulated the fluid and heat transfer of biological tissues. They also considered the stable and periodic blood pressure at the entrance of the capillary network based on the immersion boundary method strategy, which had reference value for fluid dynamics and material processing. Aissa et al. [26] conducted a numerical study of pressure-driven gas flow in microchannels with sliding boundaries, and they accurately predicted the pressure-driven flow in microchannels. Basri et al. [27] studied the fluid-structure interaction in the complications of patients’ specific aortic valve implantation based on fluid dynamics, which was of great significance for recirculation flow and thrombosis. Il’inykh et al. [28] investigated the fine structure of freely falling droplet diffusion mode in the still fluid. They found that the conversion of available potential energy was conducive to fluid acceleration when the free surface of coalescence fluid disappeared. In conclusion, fluid mechanics is extensively used in materials and buildings and has vital reference and application value in medical arterial diseases.
The total energy resources in the world are limited. With the increasing demand for traditional energy in modern society, energy conservation and emission reduction has become an inevitable social development trend. Based on the relevant fluid mechanics principles, the thermal performance of prefabricated buildings’ enclosure structures is studied through software simulation analysis. The experimental results show that the average heat flux, the cavity thickness, the wall materials’ thickness, and the temperature difference between the two sides of the cavity all affect the thermal insulation performance of the composite wall. The clear inference is that using 20 mm air interlayers can significantly improve the thermal insulation performance of prefabricated buildings. Due to the air interlayer in the multi-cavity composite wall, particular components need to be added between the inner and outer panels to increase stability. Still, these components may form a building thermal bridge. Although this paper has achieved the expected outcomes, there are still some deficiencies. On the one hand, the model is simplified for convenience. On the other hand, the influence of the thermal bridge effect formed by stability maintaining components on building energy consumption is not considered, which may lead to some errors in the experimental results, which may cause some errors in the experimental results. Therefore, future research will establish a more comprehensive model and comprehensively analyze building energy consumption factors. Besides, the multi-cavity composite wall of prefabricated buildings will be further optimized to reduce the building energy consumption and promote energy conservation and emission reduction in the construction industry.
Funding Statement: This study was sponsored by the “Civil Engineering, Brand Major Construction Site of Private Universities of Education Department of Henan Province 2017” (Henan Finance and Education: [2016]119).
Conflicts of Interest: The authors declare that they have no conflicts of interest to report regarding the present study.
1. Chi, S., Luan, T., Liang, Y., Hu, X., Gao, Y. (2021). Exergy analysis and thermal optimization of a double-turbine regeneration system in an ultra-supercritical double-reheat unit. Fluid Dynamics & Materials Processing, 17(1), 71–80. DOI 10.32604/fdmp.2021.013178. [Google Scholar] [CrossRef]
2. Liu, Q., Zhang, R. (2021). Green energy development system under the background of environmental sustainability. Energy Engineering, 118(1), 173–187. DOI 10.32604/EE.2020.012788. [Google Scholar] [CrossRef]
3. Li, G. (2020). Simulation of the thermal environment and velocity distribution in a lecture hall. Fluid Dynamics & Materials Processing, 16(3), 549–559. DOI 10.32604/fdmp.2020.09219. [Google Scholar] [CrossRef]
4. Zhang, L., Fan, L., Xu, X., Cao, B., Zhang, H. et al. (2021). Experimental research of the radiator thermal performance test equipment and its application in heating system. Energy Engineering, 118(2), 399–410. DOI 10.32604/EE.2021.012647. [Google Scholar] [CrossRef]
5. Fathabadi, H. (2021). Numerical investigation of the effect of prepared phase change material-expanded graphite composite and vertical air ducts on the thermal performance of a Li-ion battery. Numerical Heat Transfer, Part B: Fundamentals, 80(1–2), 29–37. DOI 10.1080/10407790.2021.1941649. [Google Scholar] [CrossRef]
6. Lamrani, B., Draoui, A. (2021). Thermal performance and economic analysis of an indirect solar dryer of wood integrated with packed-bed thermal energy storage system: A case study of solar thermal applications. Drying Technology, 39(10), 1371–1388. DOI 10.1080/07373937.2020.1750025. [Google Scholar] [CrossRef]
7. Krambeck, L., Bartmeyer, G. A., Souza, D. O., Fusão, D., Santos, P. et al. (2021). Experimental thermal performance of different capillary structures for heat pipes. Energy Engineering, 118(1), 1–14. DOI 10.32604/EE.2020.013572. [Google Scholar] [CrossRef]
8. Khalid, S. U., Babar, H., Ali, H. M., Janjua, M. M., Ali, M. A. (2021). Heat pipes: Progress in thermal performance enhancement for microelectronics. Journal of Thermal Analysis and Calorimetry, 143(3), 2227–2243. DOI 10.1007/s10973-020-09820-7. [Google Scholar] [CrossRef]
9. Arunkumar, H. S., Karanth, K. V., Kumar, S. (2020). Review on the design modifications of a solar air heater for improvement in the thermal performance. Sustainable Energy Technologies and Assessments, 39(4), 100685. DOI 10.1016/j.seta.2020.100685. [Google Scholar] [CrossRef]
10. Li, D., Wu, Y., Wang, B., Liu, C., Arıcı, M. (2020). Optical and thermal performance of glazing units containing PCM in buildings: A review. Construction and Building Materials, 233(9), 117327. DOI 10.1016/j.conbuildmat.2019.117327. [Google Scholar] [CrossRef]
11. Zaydan, M., Riahi, M., Mebarek-Oudina, F., Sehaqui, R. (2021). Mixed convection in a two-sided lid-driven square cavity filled with different types of nanoparticles: A comparative study assuming nanoparticles with different shapes. Fluid Dynamics & Materials Processing, 17(4), 789–819. DOI 10.32604/fdmp.2021.015422. [Google Scholar] [CrossRef]
12. Alrashidi, H., Ghosh, A., Issa, W., Sellami, N., Mallick, T. K. et al. (2020). Thermal performance of semitransparent CdTe BIPV window at temperate climate. Solar Energy, 195, 536–543. DOI 10.1016/j.solener.2019.11.084. [Google Scholar] [CrossRef]
13. Hussein, O. A., Habib, K., Muhsan, A. S., Saidur, R., Alawi, O. A. et al. (2020). Thermal performance enhancement of a flat plate solar collector using hybrid nanofluid. Solar Energy, 204(17), 208–222. DOI 10.1016/j.solener.2020.04.034. [Google Scholar] [CrossRef]
14. Luo, Z., Xu, H., Lou, Q., Feng, L., Ni, J. (2020). GPU-accelerated lattice Boltzmann simulation of heat transfer characteristics of porous brick roof filled with phase change materials. International Communications in Heat and Mass Transfer, 119(9), 104911. DOI 10.1016/j.icheatmasstransfer.2020.104911. [Google Scholar] [CrossRef]
15. Zhang, M., Cheng, H., Wang, C., Zhou, Y. (2021). Kaolinite nanotube-stearic acid composite as a form-stable phase change material for thermal energy storage. Applied Clay Science, 201, 105930. DOI 10.1016/j.clay.2020.105930. [Google Scholar] [CrossRef]
16. Shmorgun, V. G., Slautin, O. V., Arisоva, V. N., Pronichev, D. V., Kulevich, V. P. (2020). Structure and phase composition of diffusion zone in copper M1 + alloy MA2-1 composite. Metallurgist, 63(9–10), 1124–1131. DOI 10.1007/s11015-020-00930-z. [Google Scholar] [CrossRef]
17. Hou, M., Kong, X., Li, H., Yang, H., Chen, W. (2021). Experimental study on the thermal performance of composite phase change ventilated roof. Journal of Energy Storage, 33(9), 102060. DOI 10.1016/j.est.2020.102060. [Google Scholar] [CrossRef]
18. Yang, J., Guo, Z., Chen, J., He, C. (2021). Analysis of the convective heat transfer and equivalent thermal conductivity of functional paper honeycomb wall plates. Experimental Heat Transfer, 3, 1–14. DOI 10.1080/08916152.2021.1919246. [Google Scholar] [CrossRef]
19. Ohayon-Lavi, A., Lavi, A., Alatawna, A., Ruse, E., Ziskind, G. et al. (2021). Graphite-based shape-stabilized composites for phase change material applications. Renewable Energy, 167, 580–590. DOI 10.1016/j.renene.2020.11.117. [Google Scholar] [CrossRef]
20. Li, X., Wang, C., Alashwal, A., Bora, S. (2020). Game analysis on prefabricated building evolution based on dynamic revenue risks in China. Journal of Cleaner Production, 267(2), 121730. DOI 10.1016/j.jclepro.2020.121730. [Google Scholar] [CrossRef]
21. Wang, Y., Xue, X., Yu, T., Wang, Y. (2021). Mapping the dynamics of China’s prefabricated building policies from 1956 to 2019: A bibliometric analysis. Building Research & Information, 49(2), 216–233. DOI 10.1080/09613218.2020.1789444. [Google Scholar] [CrossRef]
22. Sebaibi, N., Boutouil, M. (2020). Reducing energy consumption of prefabricated building elements and lowering the environmental impact of concrete. Engineering Structures, 213, 110594. DOI 10.1016/j.engstruct.2020.110594. [Google Scholar] [CrossRef]
23. Ma, M., Zhang, K., Chen, L., Tang, S. (2021). Analysis of the impact of a novel cool roof on cooling performance for a low-rise prefabricated building in China. Building Services Engineering Research and Technology, 42(1), 26–44. DOI 10.1177/0143624420960276. [Google Scholar] [CrossRef]
24. Manoram, R. B., Krishnaa, S. D., Baranitharan, M., Gokulakrishnan, K., Dinesh Krishna, M. et al. (2021). An experimental study about the heat transfer rate and intermediate surface temperature analysis through traditional method of composite wall heat transfer. Materials Today: Proceedings, 37, 98–101. DOI 10.1016/j.matpr.2020.04.165. [Google Scholar] [CrossRef]
25. Tang, Y., Mu, L., He, Y. (2020). Numerical simulation of fluid and heat transfer in a biological tissue using an immersed boundary method mimicking the exact structure of the microvascular network. Fluid Dynamics & Materials Processing, 16(2), 281–296. DOI 10.32604/fdmp.2020.06760. [Google Scholar] [CrossRef]
26. Aissa, A., Slimani, M. E. A., Mebarek-Oudina, F., Fares, R., Zaim, A. et al. (2020). Pressure-driven gas flows in micro channels with a slip boundary: A numerical investigation. Fluid Dynamics & Materials Processing, 16(2), 147–159. DOI 10.32604/fdmp.2020.04073. [Google Scholar] [CrossRef]
27. Basri, A. A., Zuber, M., Basri, E. I., Zakaria, M. S., Fazli, A. et al. (2021). Fluid-structure interaction in problems of patient specific transcatheter aortic valve implantation with and without paravalvular leakage complication. Fluid Dynamics & Materials Processing, 17(3), 531–553. DOI 10.32604/fdmp.2021.010925. [Google Scholar] [CrossRef]
28. Il’inykh, A. Y., Chashechkin, Y. D. (2021). Fine structure of the spreading pattern of a freely falling droplet in a fluid at rest. Fluid Dynamics, 56(4), 445–450. DOI 10.1134/S001546282104008X. [Google Scholar] [CrossRef]
 | This work is licensed under a Creative Commons Attribution 4.0 International License, which permits unrestricted use, distribution, and reproduction in any medium, provided the original work is properly cited. |