| Fluid Dynamics & Materials Processing |
DOI: 10.32604/fdmp.2022.019036
ARTICLE
Study on the Thermal Performances of a New Type of Fabricated Thermally Insulating Decorative Wall Material
1School of Civil Engineering, Tianjin University, Tianjin, 300072, China
2The First Construction Co., Ltd. of China Construction Eighth Engineering Bureau, Jinan, 250100, China
3Shandong Urban Construction Vocational College, Jinan, 250103, China
*Corresponding Author: Changlin Wang. Email: chilamwang@126.com
Received: 30 August 2021; Accepted: 13 January 2022
Abstract: This study proposes three possible keel-surface layer combinations to implement a new type of thermally insulating decorative wall system. A set of 8 samples has been studied. In particular, through theoretical calculations, simulations, and experimental verification, the influence of different types of connecting structures on the overall thermal performance of the wall system has been determined. It has been found that a proper combination of these elements can meet existing energy-saving standards and effectively reduce the energy loss caused by thermal bridges due to the installation of steel keels at the edges of integrated wall panels.
Keywords: Fabrication; wall material; thermal performance; research
Among modern prefabricated buildings, there is a lack of supporting and mature building peripheral protection systems. Existing building envelopes are generally traditional blocks or fabricated precast concrete (PC) walls. Since traditional block walls are secondary structures, they still need a complex processing during the masonry. This extends the construction period to large extent and does not guarantee the quality of the masonry. Besides, due to self-weight of the popular prefabricated PC component walls, their transportation efficiency remains low and overpriced. Furthermore, in the later stage of construction, cast-in-place joints are required [1]. However, they affect the construction speed and structural safety of the connection parts of the wall components. In addition, there is always the risk of hidden safety hazards in the fully assembled building. According to various researches, the existing building wall systems greatly increase the weight of the building, and impose high requirements on the foundation, thereby making the total construction more expensive. At the same time, a widespread problem of secondary decoration in the later period of construction fails to meet the concept of “integration of decoration and fitment industry of new prefabricated constructions, Future Space Technology Housing”. Another issue associated with currently used building wall systems is thermal bridges generated by metal connectors in the wallboards, which cause energy loss. Therefore, the research and development of a new type of integrated wall systems with thermal insulation and decoration structure have become an urgent task [2].
In order to study the thermal performance of the peripheral protection systems and to avoid the above-mentioned shortcomings of traditional prefabs, various connection types of frame and panel are designed in this work. In the first type, there is no frame, and the insulation material and the panel are directly bonded by glue. In the second, the frame and the panel pass through a screw connection. The third is the plug-in connection of the frame and the panel through aluminum alloy and PA66 heat insulation. Based on these three forms, eight different test pieces are fabricated to elucidate the influence of different types of connection structures on the overall thermal performance of the wall system, and to determine the most optimal thermal insulation connection between the frame and the surface layer.
The product series are divided into five major forms: hidden frame, exposed frame, point window, vertical window, and horizontal window (Fig. 1). The smallest wall thickness in the series is 168 mm. From the perspective of energy saving and the development of assembled peripheral protection systems [2], the in-depth research on the thermal performance of exposed frame products are within the scope of the present work.
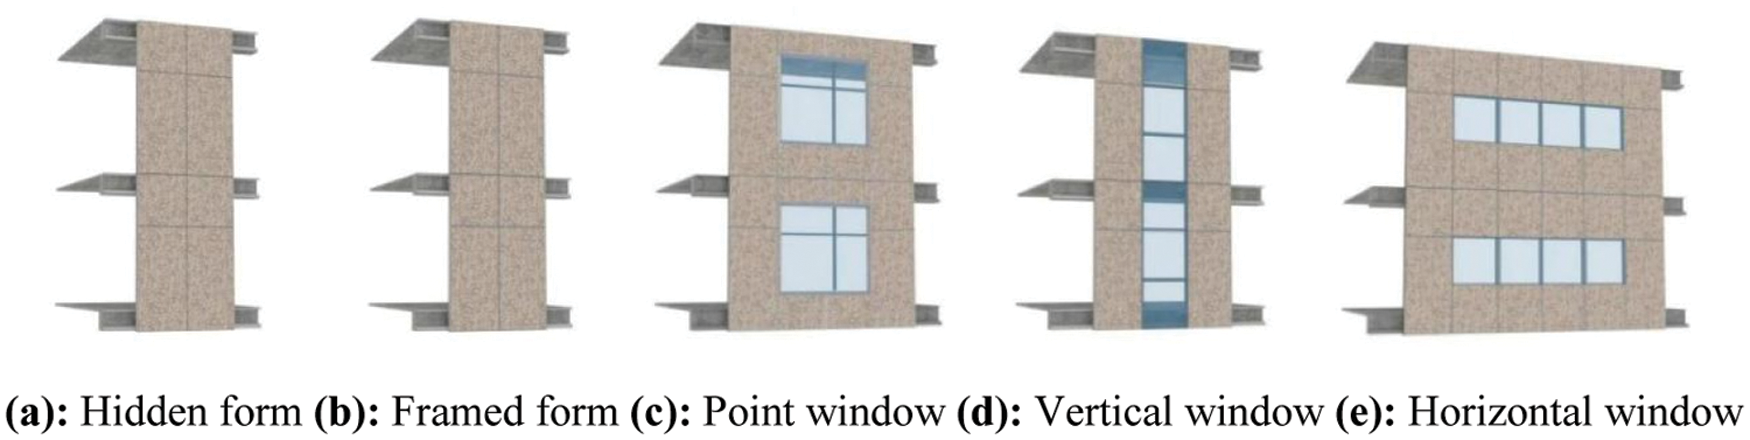
Figure 1: Wall system form
A prefabricated thermal insulation decorative wall system consists of two parts: a panel system and a connection system [2]. The structure of an exposed frame wall is shown below in Figs. 2 and 3.
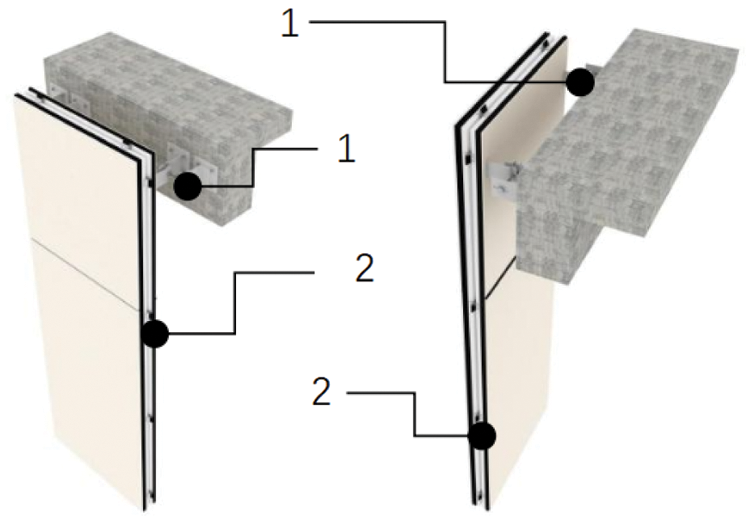
Figure 2: The composition of the wall system. Here, 1 is the connecting device and 2 is the panel
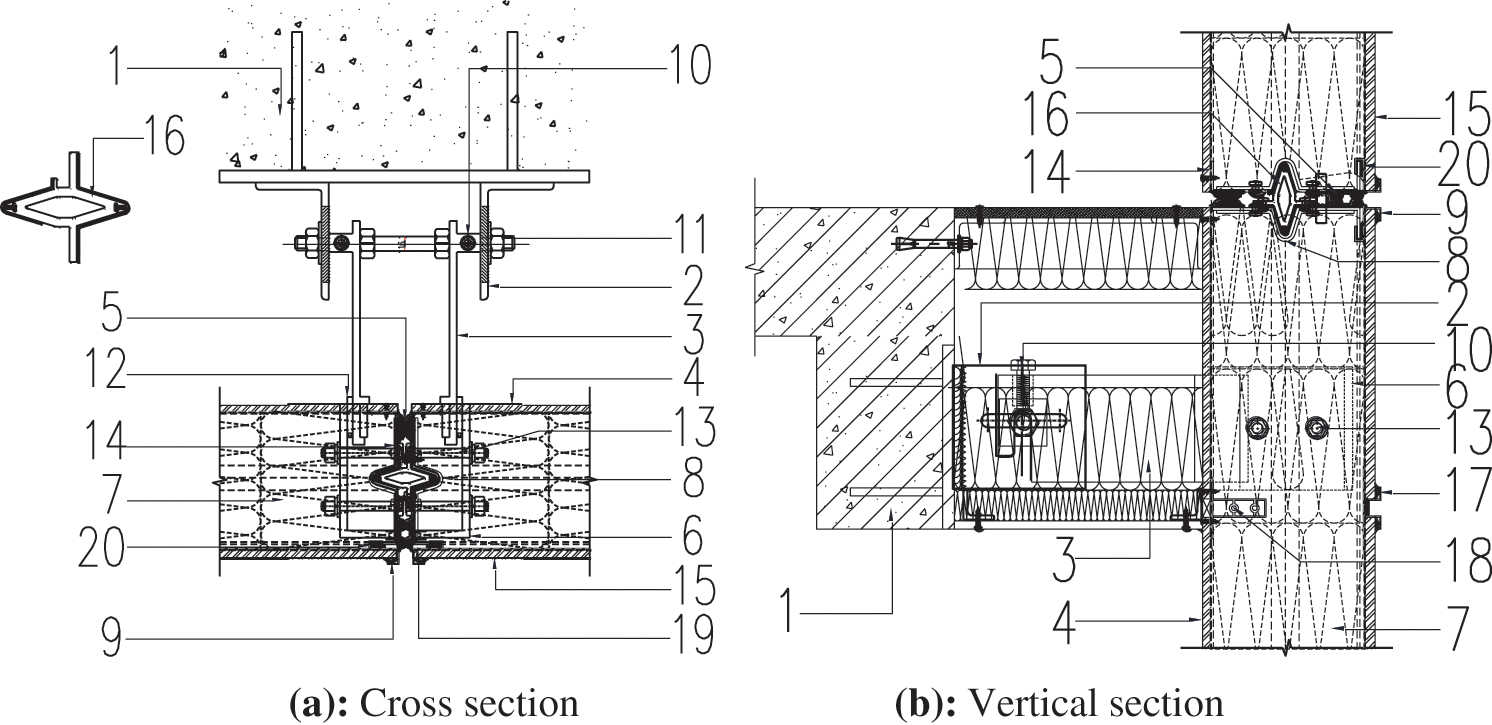
Figure 3: Wall system nodes Description: 1–Civil engineering structure; 2–Civil engineering hooking system; 3–External connection system; 4–8 mm thick internal wall fiber cement board; 5–Sealing system; 6–Internal connection system; 7–150 mm thick vertical wire arrangement rock Cotton belt; 8–2.5 mm U-shaped butt steel angle code; 9–1.5 mm aluminum alloy decorative external buckle; 10–M12 vertical adjusting bolt; 11–M16 horizontal adjusting bolt; 12–6 mm steel wedge nail; 13–M12 board bolts; 14–2.5 mm thick U-shaped frame steel keel; 15–20 mm thick external wall fiber cement board; 16–Limit aluminum alloy insert core; 17–Aluminum alloy middle frame decorative buckle; 18–Aluminum alloy middle frame keel; 19–Caulking aluminum row; 20–PA66 thermal insulation rubber pad
In order to improve the indoor environment of public buildings, to increase energy efficiency, to promote the application of renewable energy buildings, and to reduce energy consumption, the GB50189-2005 standard (Design Standards for Energy Efficiency of Public Buildings) has been launched in 2012. Its latest version (GB50189-2015) is currently a basis for evaluating the compliance of buildings with the requirements for energy conservation and environmental protection. To assess the thermal limits of the building envelope, theoretical calculations and experimental analysis are not enough. In particular, the accuracy of the data obtained from on-site testing is affected by the environmental factors, and the error can reach up to 30%. Even if a more reliable laboratory measurement method is selected, the experimental results alone do not allow one to adequately measure the thermal performance of the whole envelope structure system.
The products involved in this research are mainly used in public buildings. Therefore, the conformity of the wall components to GB50189-2015 standard (hereinafter referred to as “Energy Efficiency Standards”) will be evaluated via theoretical calculations and simulation analysis. The heat transfer mode and the energy-saving effect of the product are investigated via protective hot box method, and the scientific foundation and data support are provided for the research and design of assembled peripheral protection systems.
4.1 Test Method and Specimen Model
At present, the common calorimetry test methods consist in using the heat flow meter, the protective hot plate, the calibrated hot box, and the protective hot box. Nevertheless, the calorimetry data are greatly affected by the measurement conditions, resulting in a large margin of error. Even if the site to be scanned is fully in compliance with the test standard, the maximum deviation is still close to 30%. In turn, the protective hot plate provides high measurement accuracy and good repeatability, but it is mostly employed to determine the thermal conductivity of the test piece. Meanwhile, among the above tools, calibrated hot box and protective hot box remain the most suitable devices for the thermal performance assessment of thermal insulation wall systems. Besides the thermal resistance, both units allow one to effectively determine the thermal bridge positions in a building envelope by measuring the level of condensation based on the surface temperature distribution [3].
Heat transfer is a complex combination of conduction, convection, and radiation. In case of a prefab, the heat transfer properties are related to the specimen size and boundary conditions such as heat transfer direction, temperature, temperature difference, air velocity, and relative humidity. Therefore, the properly defined test parameters are aimed at reproducing the expected environment, which would allow one to conclude whether the results obtained under the imposed conditions are meaningful.
In this study, the protective hot box method is selected as both scientifically reliable and economically viable. It enables one to gain information about the structure of the wall system, as well as to overcome unnecessary waste caused by blind design to reach the limit of thermal performance and at the same time to preserve energy in buildings. The experiments have been carried out in the Thermal Performance Laboratory of Shandong Construction Engineering Quality Supervision, Inspection and Testing Center in obedience to GB/T13475-2008 standard (Adiabatic Steady-state Heat Transfer Properties Determination, Calibration, and Protective Hot Box Method).
However, it is noteworthy that experimental assessment of the steady-state heat transfer properties of the test piece, combined with theoretical calculations, may furnish important information about the actual performance of the product or a system.
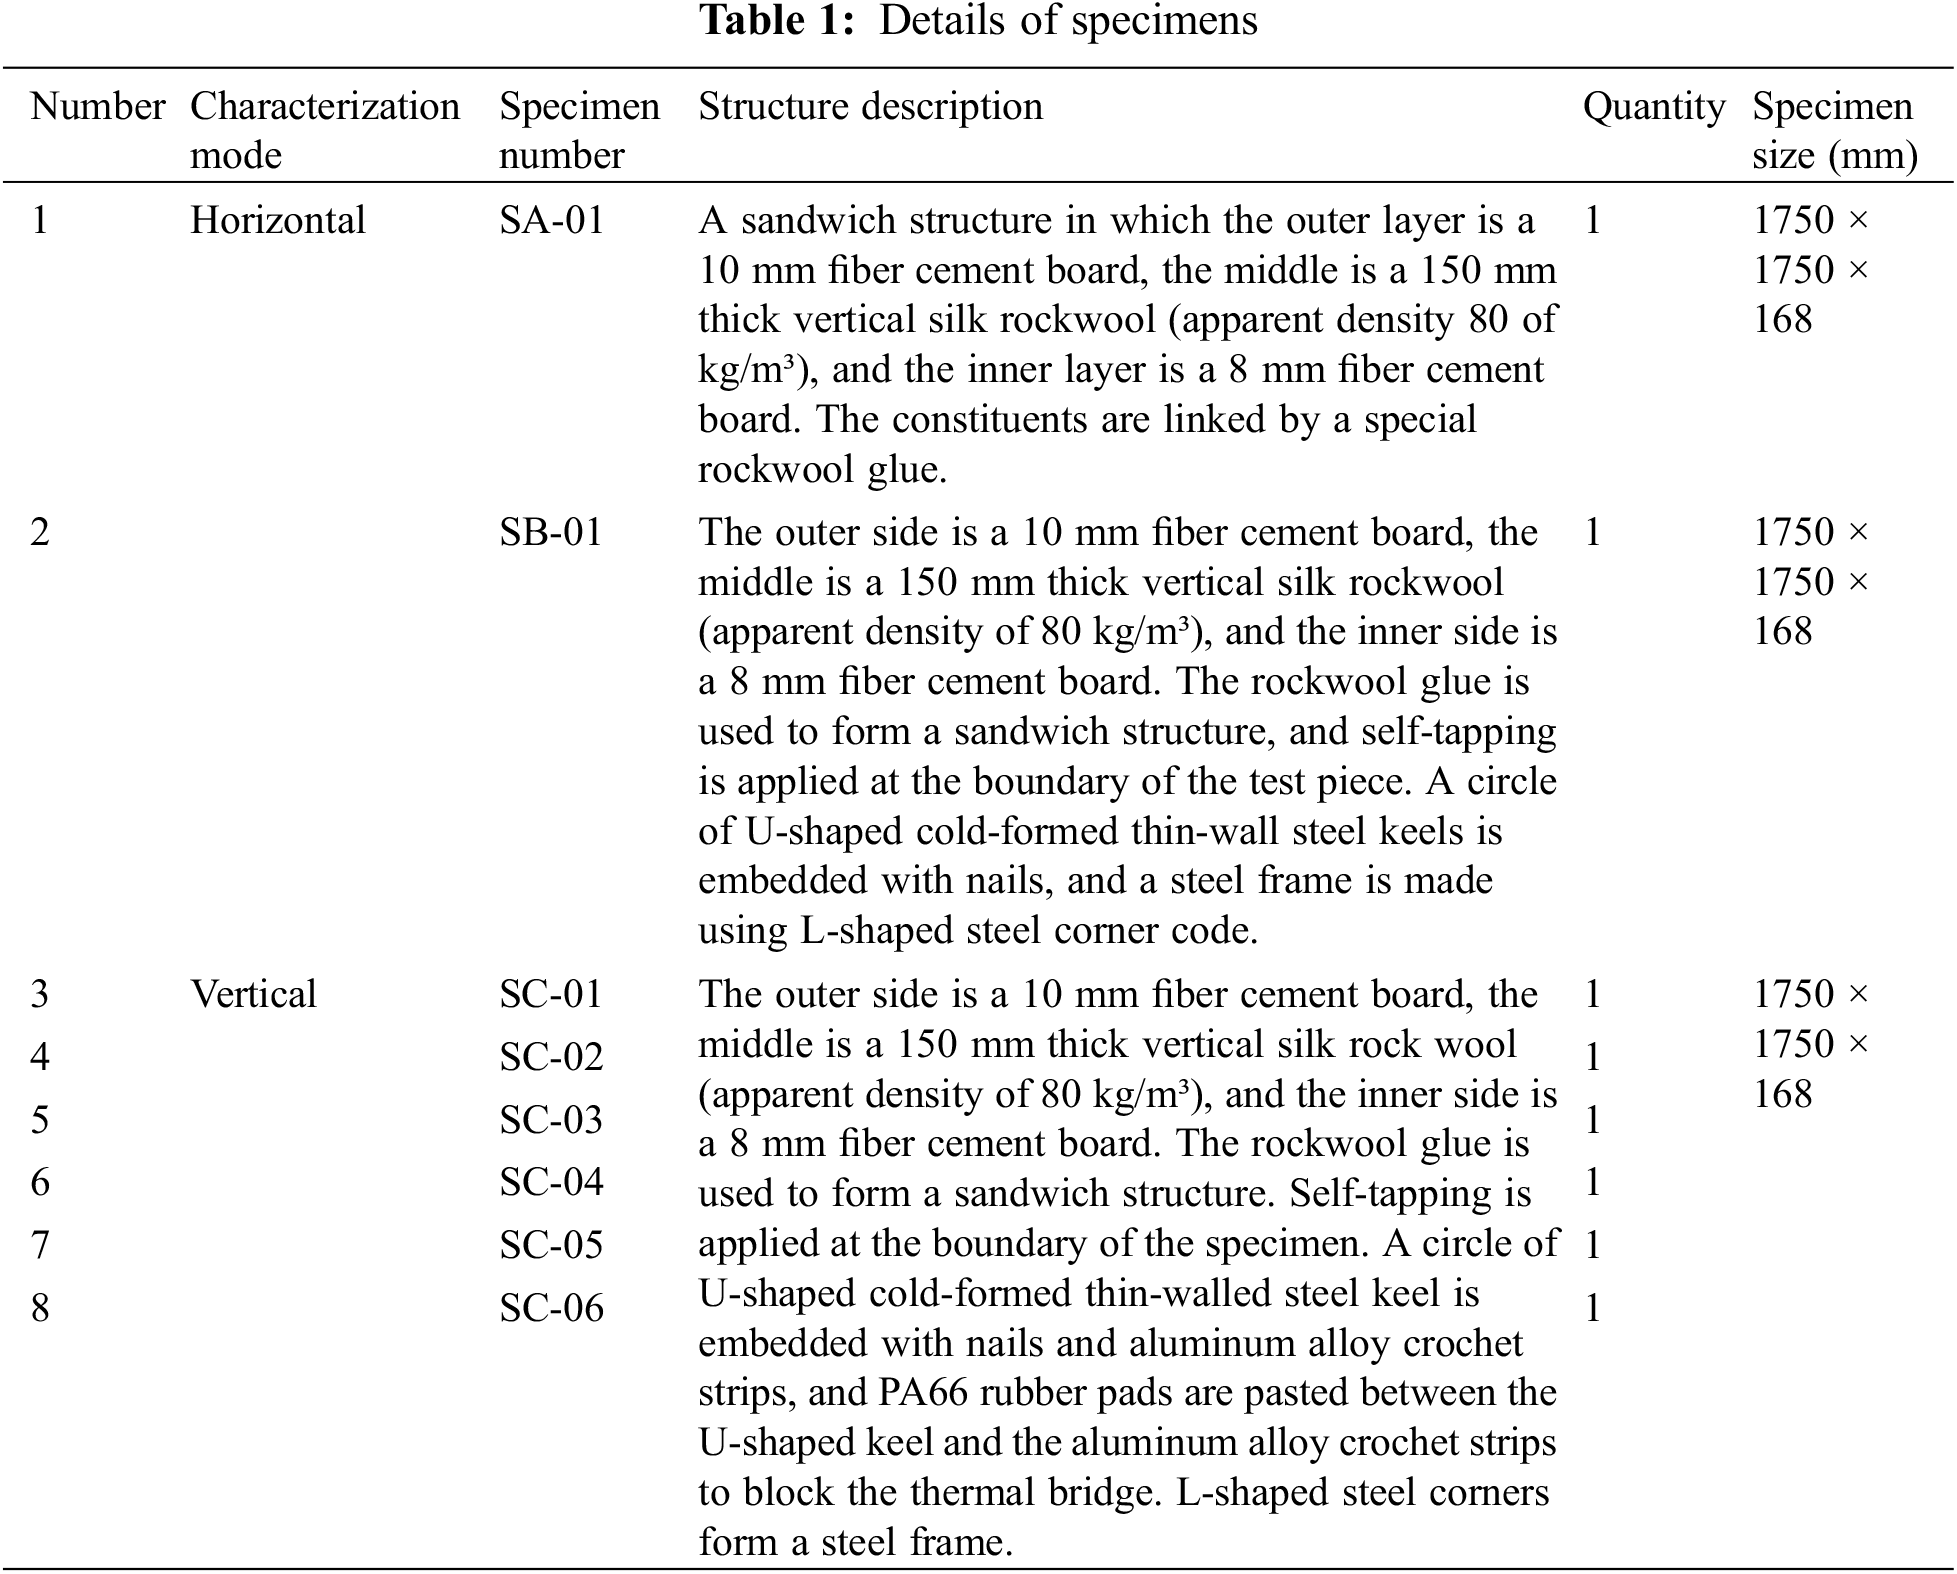
This research adopts three routes that include classical calculation, simulation analysis, and laboratory test. At the same time, two techniques are applied to establish specimens as follows. The first is a horizontal mode that consists in determining the structural composition of a total of 3 sets of test pieces (labeled Sample A (SA), Sample B (SB), and Sample C (SC)) with different wall composite types (see Table 1). The second is the vertical mode that aims at assessing the average thermal resistance over 6 sets of SC test pieces. The dimensions of the above groups of test pieces (Fig. 4) are all 1750 mm × 1750 mm × 168 mm; the type and structure of the pieces are shown in Fig. 5.
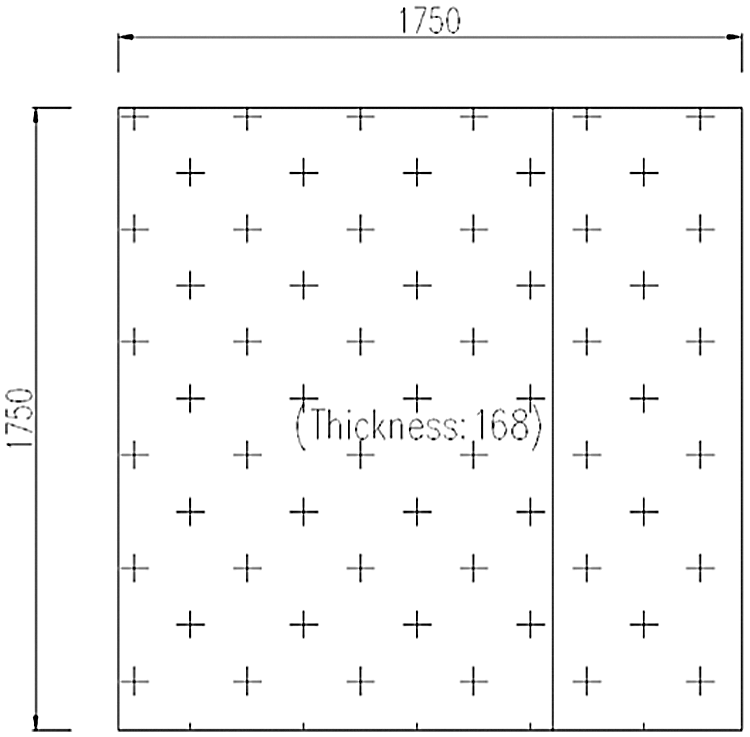
Figure 4: Dimensions of wall specimens (unit: mm)
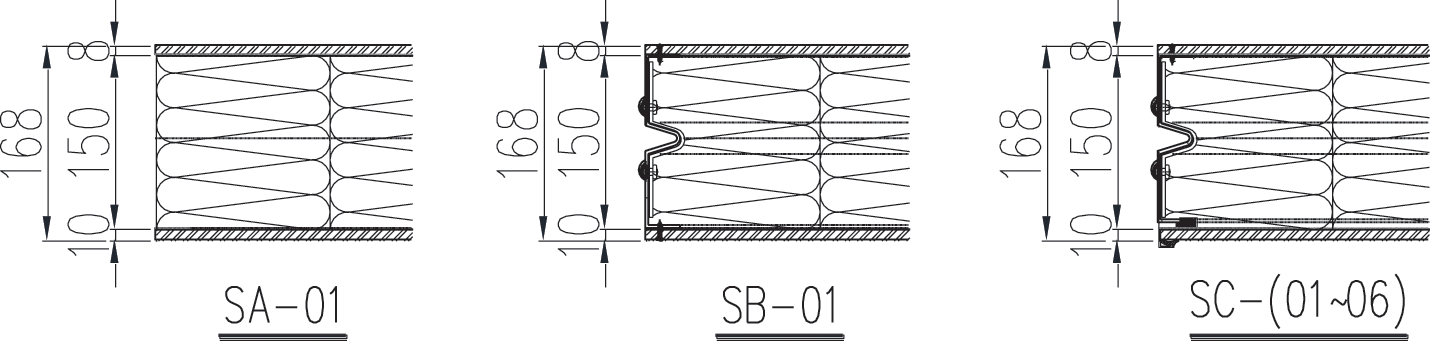
Figure 5: Wall specimen types (unit: mm)
4.2 Theoretical Calculation and Simulation Analysis
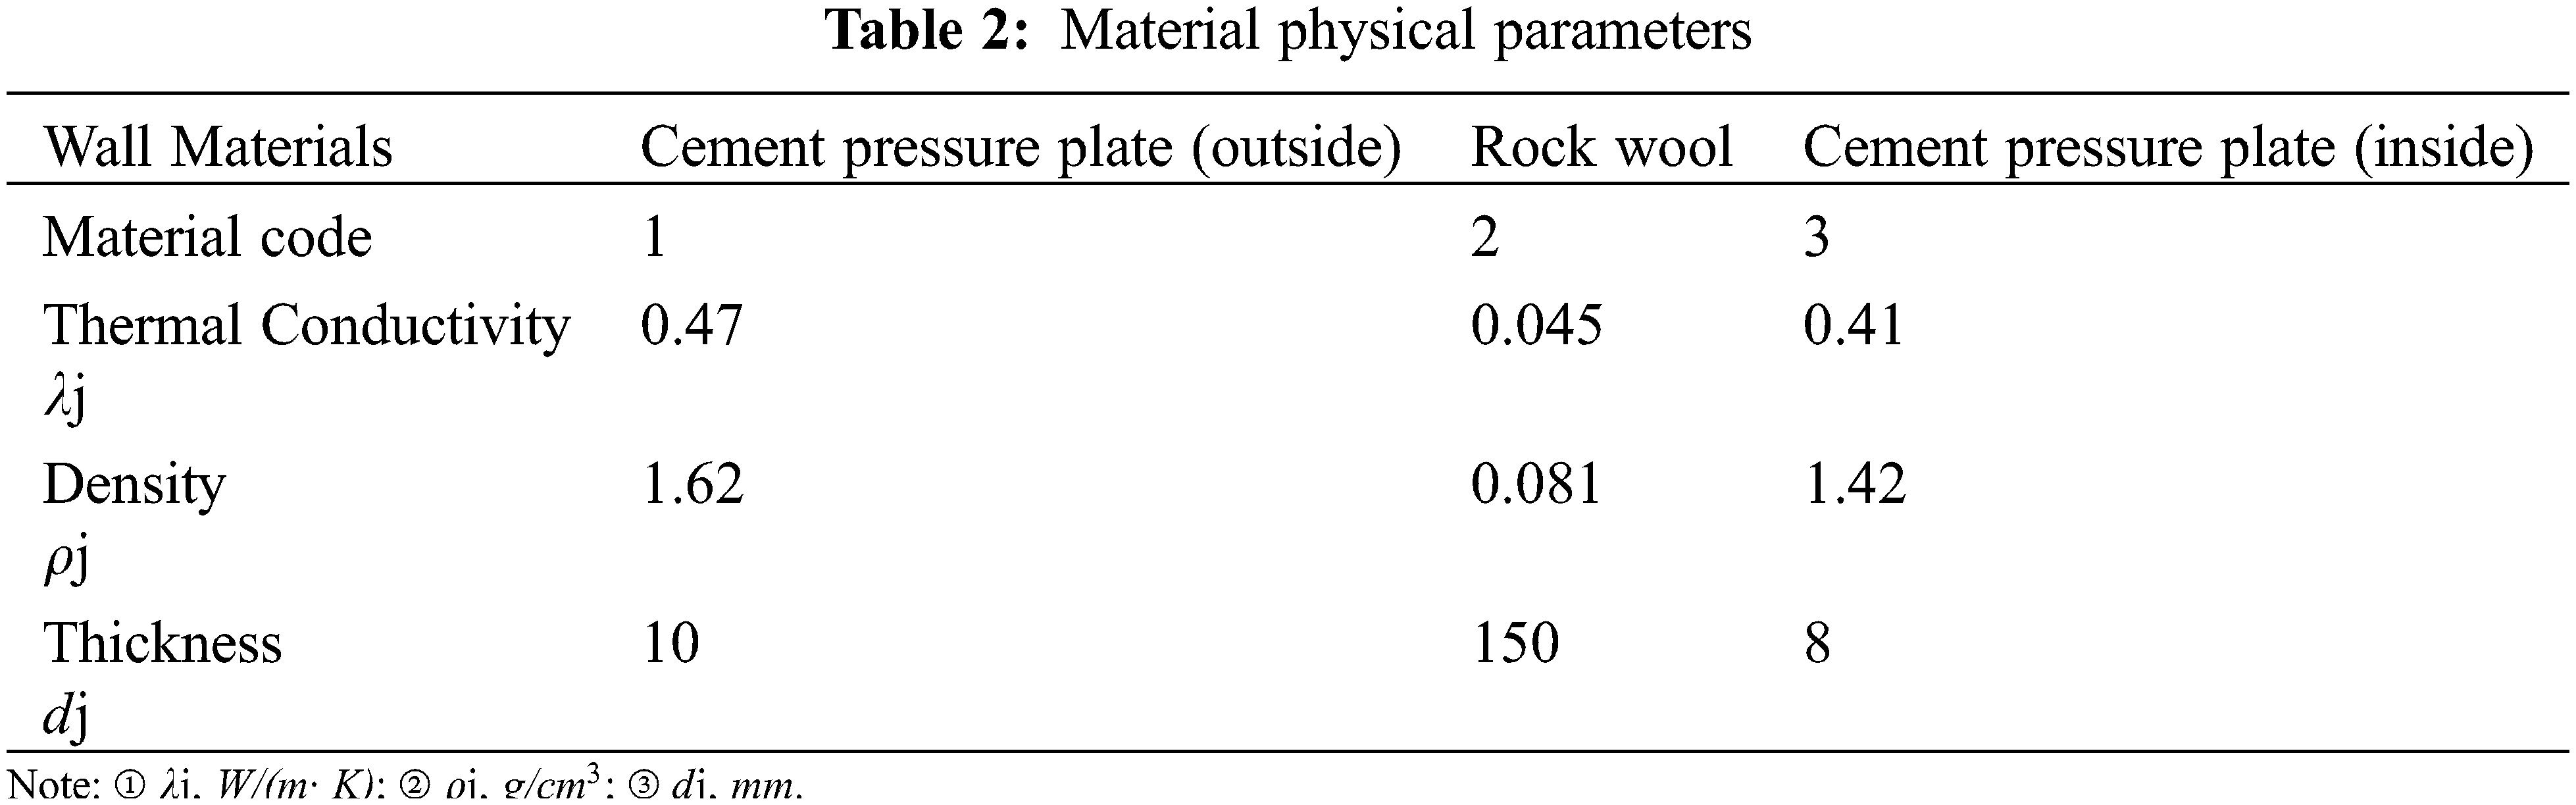
4.2.1 Physical Parameters of Wall System Materials
The thermal resistance
or
Based on formulas (1) and (2), the theoretical values of thermal resistances of SA, SB, and SC specimens are all found to be 3.37
In order to evaluate structural performance of a product system, a U-shaped frame steel keel with dimensions of 150 mm × 30 mm × 2.5 mm, installed on the periphery of the outer side of the insulation layer in the SB and SC specimens, is selected for further analysis. Since steel is a good medium for heat transfer, the presence of the frame steel keel actually affects the heat exchange in the wall, thereby greatly impacting its performance. Hence the heat loss effect cannot be considered through the theoretical formula only. Therefore, an appropriate numerical analysis model needs to be established for simulation analysis based on the following assumptions:
1) The wall system is composed of a fiber cement board on the outside, a rockwool in the middle, and a fiber cement board on the inside, which are closely attached to each other.
2) The constituents have the homogenous structure.
3) The heat transfer coefficient of the wall surface is neglected, and the ambient temperature is the same as the temperatures on both sides of the wall panel.
4) The ambient temperature on both sides of the wall (–10°C on the cold side and +35°C on the hot side) is selected to be the same as that of the laboratory for comparison.
5) The wall temperature field does not affect the internal humidity field change.
In this project, steady-state thermal analysis is performed using Solidworks Flow Simulation and Ansys Fluent tools. The results for SA, SB, and SC specimens are shown in Fig. 6 and Table 3.
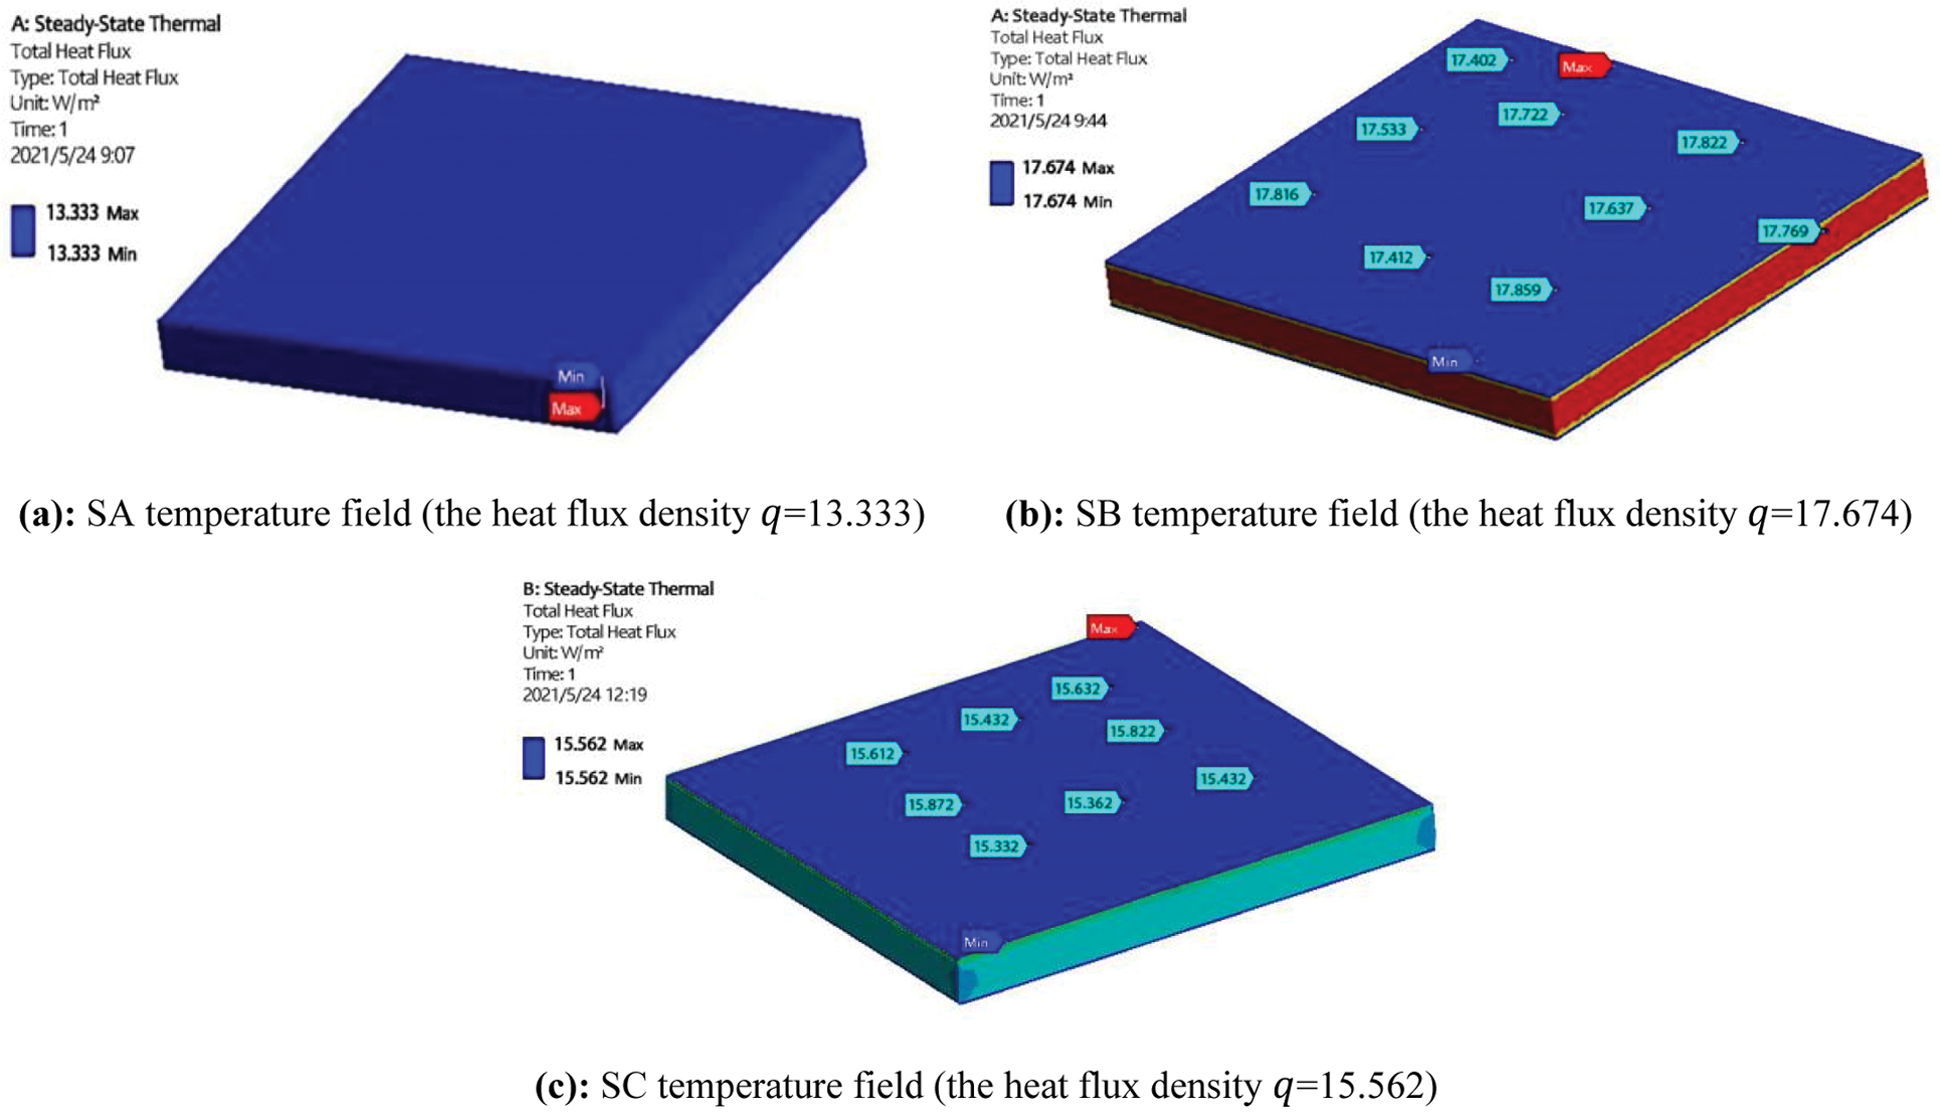
Figure 6: Ansys heat flow analysis results on test pieces
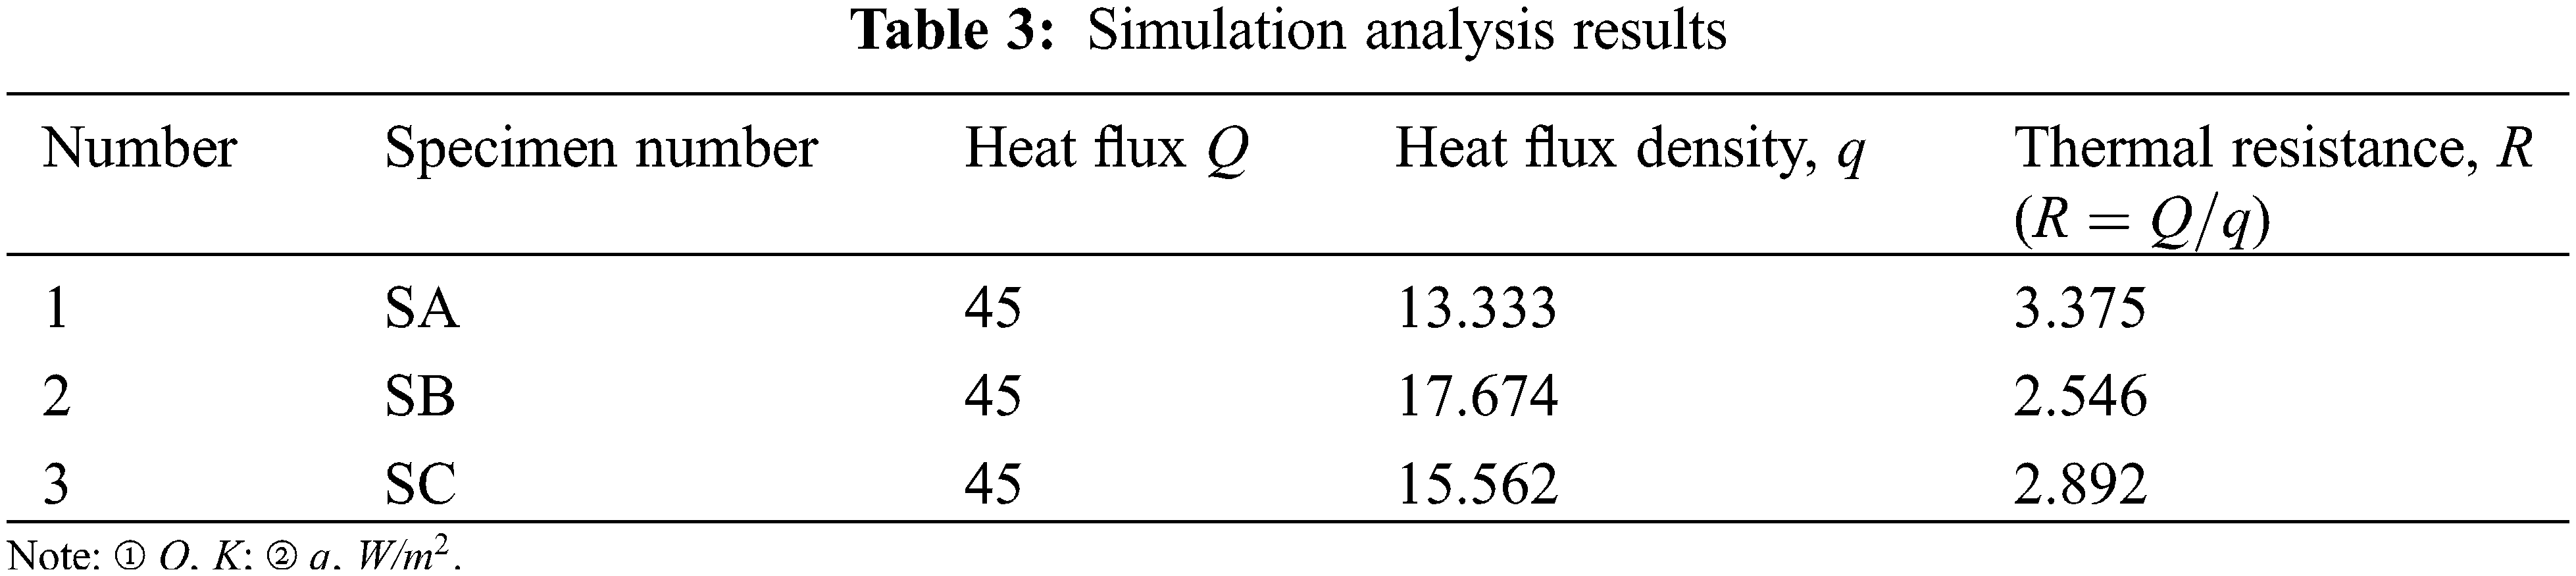
For SA, SB, and SC specimens, the thermal parameters such as heat flux density of the specimens are obtained by simulation analysis, and the heat flux density is weighted and averaged to obtain the average heat flux value. In turn, the thermal resistance of the specimen is defined as the ratio of the heat flux to the heat flux density:
4.3 Test Equipment and Experimental Conditions
The main components of a test device used in the protective hot box method are a measuring box, a cold box, a protective box, and a test piece frame (Thermal insulation Determination of steady-state heat transfer properties Calibration and protection hot box method) (Fig. 7). The principle of the method is to create a one-dimensional heat transfer environment manually and to place the test piece in a space between the hot room and the cold room (in the sample frame) where the ambient temperature is known. The metering box (hot box) is used to simulate the indoor or summer outdoor air temperature, wind speed, and radiation conditions, whereas the cold box simulates the outdoor or summer indoor air-conditioning room temperature. The wind speed and the protective box ensure that the five walls of the metering box are not affected by the laboratory environment and minimize the heat loss through the box. The parameters of each component are shown in Table 4 below.
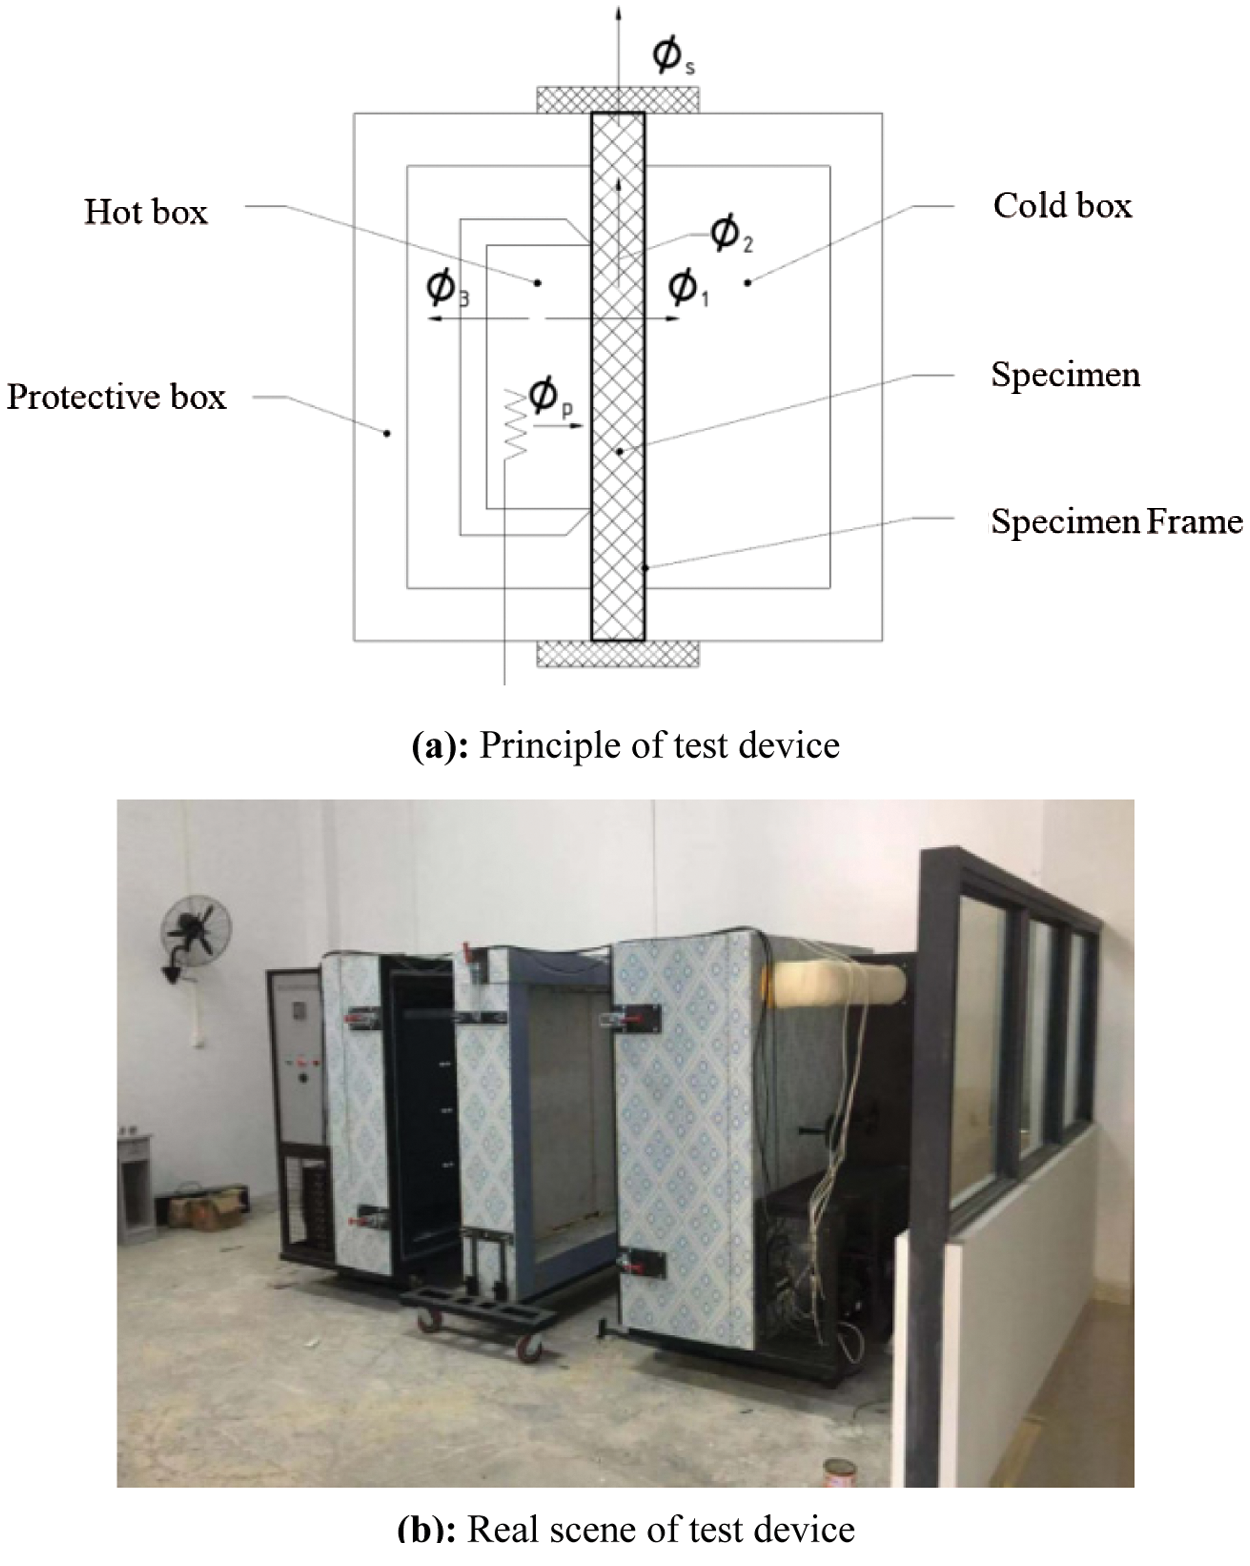
Figure 7: Schematic diagram of the test device

The test parameters must account for the final use conditions and the impact on data accuracy. Both the average test temperature and the temperature difference affect the experimental results. According to the actual conditions of use, the temperatures of the cold box and hot box in this test are set to –10°C and +35°C, allowing one to take into consideration the climate peculiarities in northern regions in winter. At the beginning of the test, after several hours of operation, the entire device reaches a steady state, forming stable temperature and velocity fields. Then, the surface temperature of the specimen, the air temperature, and the surface temperatures of the baffle are recorded on the hot and cold sides of the test piece. After measuring the temperature difference between the inside and outside of the box and the electric heater power input to the hot box (the power input of the fan of the hot box), the thermal resistance of the test piece can be calculated. It is noteworthy that the test accuracy is verified under normal operating conditions, which best reflects the real situation. When the average temperature and temperature difference change and exceed the working conditions, the test accuracy will alter according to the test principle of the protective hot box method [4].
Public buildings can be divided into Categories A and B in terms of energy efficiency. Category A public building is:
- a single building with a building area of more than 300 square meters;
- any single building in the building group with a building area of less than or equal to 300 square meters, but the total building area of the building group is greater than 1000 square meters.
Note that it is sufficient to satisfy one of the above two conditions for Category A buildings.
In turn, a single building with a building area less than or equal to 300 square meters shall be a Class B public building [5]. Thermal design zones can be divided into severely cold, cold, hot summer and cold winter, hot summer and warm winter, and mild areas according to climate peculiarities. The “Energy Conservation Standard” stipulates that the heat transfer coefficient K or the thermal resistance R is used to measure the thermal performance of the building envelope. Both K and R values are important thermal performance indicators for evaluating the wall under stable heat transfer conditions. Moreover, these two parameters are in a reciprocal relationship: the smaller the K value or the larger the R value of the envelope structure, the better is the thermal insulation performance of the latter [6]. Based on the statistical analysis of the thermal performance limits for the above types of buildings in different thermal design zones, the K value of the envelope structure is equal or below 0.35. This meets the requirements imposed on all the building types and zone limits (K ≤ 0.35) (Table 5).

Fig. 8 shows the internal structure of the surface layer of the specimen after the testing via protective hot box method.
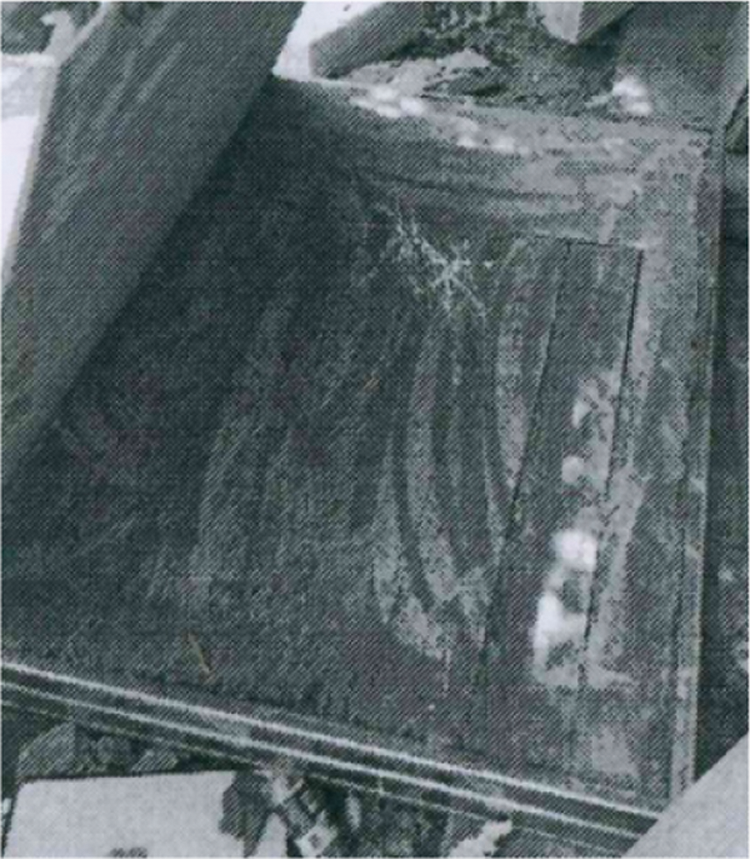
Figure 8: The internal structure of the specimen after the testing via protective hot box method
The thermal resistance R of the wall can be calculated as follows:
where
The symbols in formulae (3) and (4) are:
The test results are summarized in Table 6.

The results obtained by the theoretical calculation, simulation analysis, and laboratory tests are given in Table 7.

The parameters are calculated as follows:
The symbols in formulas (5) to (10) are:
In this work, a decorative structural integrated wall system with thermal insulation characteristics was proposed. The influence of different types of connection structures on the overall thermal performance of the wall system was investigated via theoretical calculations, simulation analysis, and laboratory tests. Based on the findings of the study, the conclusions can be drawn as follows:
(1) The wall was composed of three single materials, closely adhered to each other. Three types of specimens referred to as SA, SB, and SC were obtained, whose actual boundary conditions were different. The impact of the frame steel keel and other undesirable conditions was ignored in the theoretical calculations aimed at determining the adverse effect of various factors on the heat transfer performance of the wall. The thermal resistance of the three types of specimens was the same, whereas the thermal loss and other parameters were not considered.
(2) During the simulation analysis, the thermal resistance value of the SA specimen was almost the same as that found through the theoretical calculation. This proved that the classical heat transfer calculation formula could be applied in case of the close-fitting composite wall. The thermal resistance value of the SB specimen was significantly reduced, indicating that there was a large heat loss through the steel keel of the frame, which greatly decreased the thermal insulation performance of the test piece. At this time, the SB test piece was reduced by 24.5% compared with the SA piece. The average thermal resistance of the SC piece was 13.6% higher than that of the SB one. It could be seen that using PA66 for the thermal insulation of the section steel frame keel enabled one to effectively block the heat loss.
(3) Applying the protective hot box method allowed one to achieve the reduction in the thermal resistance values of the SA, SB, and SC specimens by 8.71%, 5.54%, and 2.94% compared with the simulation analysis data. This indicated that the device, specimen, or any other factors might have caused measurement errors.
(4) Under the premise of ensuring structural performance of the wall, adopting the SC test piece resulted in the average thermal resistance of 2.807
Acknowledgement: Grateful acknowledgement is made to my supervisor Mrs. Ding Yang who gave me considerable help by means of suggestion, comments and criticism. Her encouragement and unwavering support has sustained me through frustration and depression. Without her pushing me ahead, the completion of this thesis would be impossible. In addition, I deeply appreciate the contribution to this thesis made in various ways by my colleagues and friends.The research content of this paper comes from the Urban and Rural Construction Science and Technology Project of Shandong Province, China, Subject No. 2018-K9-07.
Funding Statement: The authors received no specific funding for this study.
Conflicts of Interest: The authors declare that they have no conflicts of interest to report regarding the present study.
1. Wan, C. Y. (2021). A numerical investigation of the thermal performances of an array of heat pipes for battery thermal management. Fluid Dynamics & Materials Processing, 15(4), 343–356. DOI 10.32604/fdmp.2019.07812. [Google Scholar] [CrossRef]
2. Wang, C. L., Cao, L., Zhang, H. F., Wang, P. D. (2019). Study on the mechanical properties of a new type of fabricated thermal insulation decorative wall system. Wall Material Innovation and Building Energy Saving, 2019(2), 58–64. DOI 10.3969/j.issn.1006-9135.2019.02.012. [Google Scholar] [CrossRef]
3. Geng, X., Lin, Z. D., Gong, W. (2010). Research on thermal performance measurement method of new energy-saving wall. Energy Research and Utilization, 2010(3), 14–16. DOI 10.3969/j.issn.1001-5523.2010.03.004. [Google Scholar] [CrossRef]
4. Li, J. H., Cao, W. L., Dong, H. Y. (2014). Experimental study on thermal performance of recycled concrete shear wall with non-demolition EPS formwork. World Earthquake Engineering, 30(3), 111–118. DOI 10.3969/j.issn.1007-6069.2014.03.017. [Google Scholar] [CrossRef]
5. Zohi, Y., Hassane, N. (2020). Numerical simulation and thermal performance of hybrid brick walls embedding a phase change material for passive building applications. Journal of Thermal Analysis and Calorimetry, 140(3), 965–978. DOI 10.1007/s10973-019-08950-x. [Google Scholar] [CrossRef]
6. Chi, S. D., Luan, T., Liang, Y., Gao, Y. (2021). Exergy analysis and thermal optimization of a double-turbine regeneration system in a ultra-supercritical double-reheat unit. Fluid Dynamics & Materials Processing, 17(1), 71–80. DOI 10.32604/fdmp.2021.013178. [Google Scholar] [CrossRef]
7. Wonorahardjo, S., Sutjahja, I. M., Mardiyati, Y., Andoni, H., Thomas, D. et al. (2020). Characterising thermal behaviour of buildings and its effect on urban heat island in tropical areas. International Journal of Energy and Environmental Engineering, 11(1), 129–142. DOI 10.1007/s40095-019-00317-0. [Google Scholar] [CrossRef]
 | This work is licensed under a Creative Commons Attribution 4.0 International License, which permits unrestricted use, distribution, and reproduction in any medium, provided the original work is properly cited. |