| Fluid Dynamics & Materials Processing |
DOI: 10.32604/fdmp.2022.019626
ARTICLE
Prediction of the Behavior of a Power System Using Root Cause Failure Analysis
Iran University of Science and Technology, Tehran, 1684613114, Iran
*Corresponding Author: Seyed Mohammad Seyed Hosseini. Email: seyedhosseini@iust.ac.ir
Received: 03 October 2021; Accepted: 23 November 2021
Abstract: The thermo-economic performance of a gas turbine is simulated using a fish bone technique to characterize the major equipment failure causes. Moreover a fault tree analysis and a Pareto technique are implemented to identify the related failure modes, and the percentage and frequency of failures, respectively. A pump 101 and drier 301 belonging to the Tabriz Petrochemical Company are considered for such analysis, which is complemented with a regression method to determine a behavioral model of this equipment over a twenty-year period. Research findings indicate that 81% of major failure factors in production equipment are related to the executive procedures (24%), human error (22%), poor quality of materials and parts (20%), and lack of personnel training (15%).
Keywords: Combined heat and power; root analysis; thermoeconomic performance; fault tree; Pareto; behavioral model
Renewable energy power plants such as parabolic trough solar collectors can play a vital role in supplying the current and future energy demands of industrial and residential sectors due to their lack of fossil fuel consumption, efficient power production and performance flexibility as well as lack of greenhouse gas emission [1–5]. In [6] conducted thermodynamic and economic investigation of a parabolic trough solar collector integrated with a Kalina cycle. Their analysis showed that the most exergy destruction occurs inside solar collectors and steam generator. In [7] investigated a parabolic trough power plant using thermic oil (therminol-VP1) and molten salt as heat transfer fluid from thermodynamic aspect. Their results showed that the higher overall exergy efficiency (21.77%) and capacity factor (38.20%) and annual energy generation (114 GWH) are found for thermic oil for a case with energy storage and fossil fuel backup system. Root cause failure analysis (RCFA) [6] is one of the major and basic methods for improvement of reliability in every industrial unit, leading to quick and considerable effectiveness. On the other hand, using root cause failure analysis methods has been originally used in the issues related to safety management, so that the accident or event is explored systematically when using RCA or RCFA methods. With focus on different parts of the accident, its all aspects are analyzed and influence of personal tastes and emotions of the individuals in root finding of the accident causes is prevented. When no specific method is used for analysis of root causes of the accident, the most apparent and external factors are recognized as the major factors of the accident. The users and personnel involved in the accident are mainly questioned, and they are often identified as the guilty, and the hidden layers, which are mostly the root causes, are not ever entered. Undoubtedly, the organizations always face barriers, problems, defects, failures, and unwanted situations that jeopardize their interests and position in the business market. Many of these companies always attempt to quickly resolve these problems and unfavorable conditions and seek to resolve them regardless of the root cause of the problem. While using the root analysis approach, it is possible to avoid occurrence of the same problems in order to avoid. In fact, the ultimate goal of using failure analysis techniques is to solve the root causes of problems, not just identifying them. Considering multiple effective factors, complicated and delicate nature of working processes in industries, problem solving for preventing from repetition of many unpleasant accidents requires accurate, technical, and expert investigation using standard, efficient, and specialized methods in this regard. Root cause analysis is one of the standard and reliable methods in this regards. Studies indicate that most failures occurring in the company are those that occur more than once for similar causes. This class of failures is known as chronic failures. Although they account for 20 percent of total failures, they cause 80 percent of the damages [7], and it means that eliminating of these failures cause great benefit in short-term and it manifests significance of RCFA.
In [8], it concluded that the installation process, the skill of operators, trained personnel of maintenance, environment variables, and gas quality can create the difference on expected availability of the design and operation. The reliability of the gas turbine in influenced by the skill of gathering, the training of maintenance forces, environmental changes (temperature, humidity, particulate matter) and the quality of gas consumption [9]. They [10] conducted and compared below studies on the reactor inlet pipeline: (1) The classic analysis of reduced thickness (Degradation Analysis) (2) Analysis FORM (First-Order Reliability Method). Reliability is the probability that the machine or equipment can work continuously without failure at the time specified in the expected operating conditions [11]. The effectiveness of these approaches is assessed by the reliability indicators (MTBF) [12], availability (MTTR) [13], the percentage of implementation of PM (Preventive maintenance) programs and the rate of emergency maintenance [14], defined in the strategic management process [15] as well as the quality of the maintenance activities. In the vibration measurement and analysis of the vibrations, with the goal of reducing emergency stops and increasing the reliability of very sensitive equipment, rotary machines, the CM (Condition Monitoring) approach is used [16]. Conditioning monitoring includes: Vibrations analysis ([6], ISO–17359, ISO–13373-1, ISO–13373-2, ISO–13373-3), Oil Analysis (ISO–4406), Sound, RCFA/FEMA [17], Condition Based Maintenance. Event Tree Analysis shows that what happens if a given initiating event occurs? Planning, realizing, checking, and monitoring barriers that avoid or at least mitigate risk. Causes of effects/Consequences, during the life cycle of a system is the most effective way to improve protection against harm. Pareto analysis indicates that by allowing a small increase in economic costs by adapting the preventive maintenance interval, a significant reduction in ecological impact can be gained [18]. Pareto analysis showed that planned maintenance and machine failure caused about 80% of total downtime [19]. In improving the productivity of the machine, the management of decision or maintenance policy must be appropriate [20]. By reviewing of 251 academic and professional papers regarding maintenance performance measurement, they mentioned that today the role of maintenance has shifted to the strategic business support from the production support in the organization. Concerning repair utility policies, they pointed out that due to variety and changes in industries; it is not possible to define a single optimal maintenance repair [21]. With developed mathematical model based on temperature, pressure, and vibration parameters, it can be predicted the time of failure occurrence in Nigeria’s petrochemical industry [22]. Human and organization performance variability could lead to production losses, ineffective maintenance, major disasters and latent and active failure [23]. Predictive maintenance helps us prevent unexpected shutdown and allows us to repair or replace poorly performing assets during the next scheduled maintenance period [24]. Graphical analysis for maintenance management is the combination of reliability assessment with the current asset performance analysis. The basic concept leading maintenance engineering is the maintenance management process continuous improvement by incorporating knowledge; intelligence and analysis [25]. They have developed Phoenix-Pro application based on crew response tree and fault tree for human reliability analysis [26]. They [27] integrate principles and methods of TPM and RCM and uses different tools to support decision maters and operators. RCM and TPM require the maintenance and production departments to operate synergistically in order to discern and avoid potential problems. One of the goals of TPM is to create a safe work place and an area around it that will not be exposed to damages as a result of process or procedures [28].
RAM programs are an integral part of any risk management system.
The benefits of an effective RAM program:
- Increased production, profitability, productivity and Customer satisfaction;
- Reduced maintenance costs, inventories, and capital costs;
- Staff safety is of the highest importance.
2.1 Thermodynamic Analysis of Hybrid Solar-Geothermal Power Plant
In this section, thermodynamic modelling of the hybrid power plant is carried out. The general equations for the mass and energy balances for a control volume at steady state with negligible kinetic and potential energy changes can be expressed, respectively, by following equations:
The exergy balance for each component of any control volume can be expressed as the following equation:
The total exergy of a system at a specified state is given by the following expression [29]:
The exergetic efficiency for each component of the system can be calculated as the percentage of the exergy supplied to the system that is recovered as the product of the system as follows:
The energy utilization factor and exergy efficiencies of the whole trigeneration system are generally defined as [7]:
where
In the above equations,
where
Solar system modelling is carried out in this section in order to evaluate system performance during the year 2019. The solar collector model in this study consists of parabolic trough collectors using Therminol oil VP-1 as heat transfer fluid. The SEGS LS-2 parabolic trough solar collector was examined to determine the collector efficiency. In order to extract mathematical modeling of the parabolic trough solar collectors in this study, equations developed by [16] are used and energy analysis is validated by reference [7] as well. For area with latitude angle (φ = 38.39°), longitude angle (L = 47.66°), declination angle (δ = 21.52°), the solar beam irradiance (Ib = 950 w/m2) on 15 July 2019 at 13.00 pm is taken from IRIMO [30] to evaluate the system performance.
The total solar energy received on the collector surface can be calculated as [31]:
The aperture area is defined as follows:
where Wa, D0, L are referred to collector tube outlet diameter aperture width and length of the collector, respectively.
The heat energy absorbed by the receiver tube can be calculated by following equation:
where the first part of this equation is the amount of the reflected irradiance by the tube and the second part accounts for the absorbed solar irradiation.
in which
The incidence angle is given by [19]:
where δ is the declination angle given by [7]:
in which n is the day number of the year from 1 (corresponding to January 01) to 365 (corresponding to December 31). In the Eq. (15), ω is the hour angle in degree and comes as a result of the rotation of the earth, which spins on its axis at a rate of 15° per hour:
where t is solar time.
The zenith angle is defined as the angle of incidence of direct solar irradiance on a horizontal surface:
in which
Useful gain is the positive difference between absorbed solar energy and thermal losses. Useful heat gain can be expressed with respect to the absorber thermal loss [7]:
The heat removal factor is defined as:
where
where
The exit temperature of the HTF for interior segments along the receiver can be calculated using the following equation:
where
For calculation of exergy input by solar collectors, following equation is used [6]:
where
The exergy destruction in solar collectors can be calculated as following equation [9]:
2.2 Root Cause Failure Analysis in Equipment
2.2.1 Using Fish Bone [29] Technique
Causal relationship is such that the cause of an effect can be affected by other causes. Therefore, in this research, it is attempted to select the most effective and most important “cause” or “causes” among the other existing factors, and put it in a shape to determine their importance toward other causes. Following specifying the effect or unexpected failures in the complex, cause and effect diagram is drawn, and relationship between relevant factors is specified so that the fault or defect, which is against the company’s strategic approach to achieve zero error, is minimized aiming at optimization (Fig. 1).
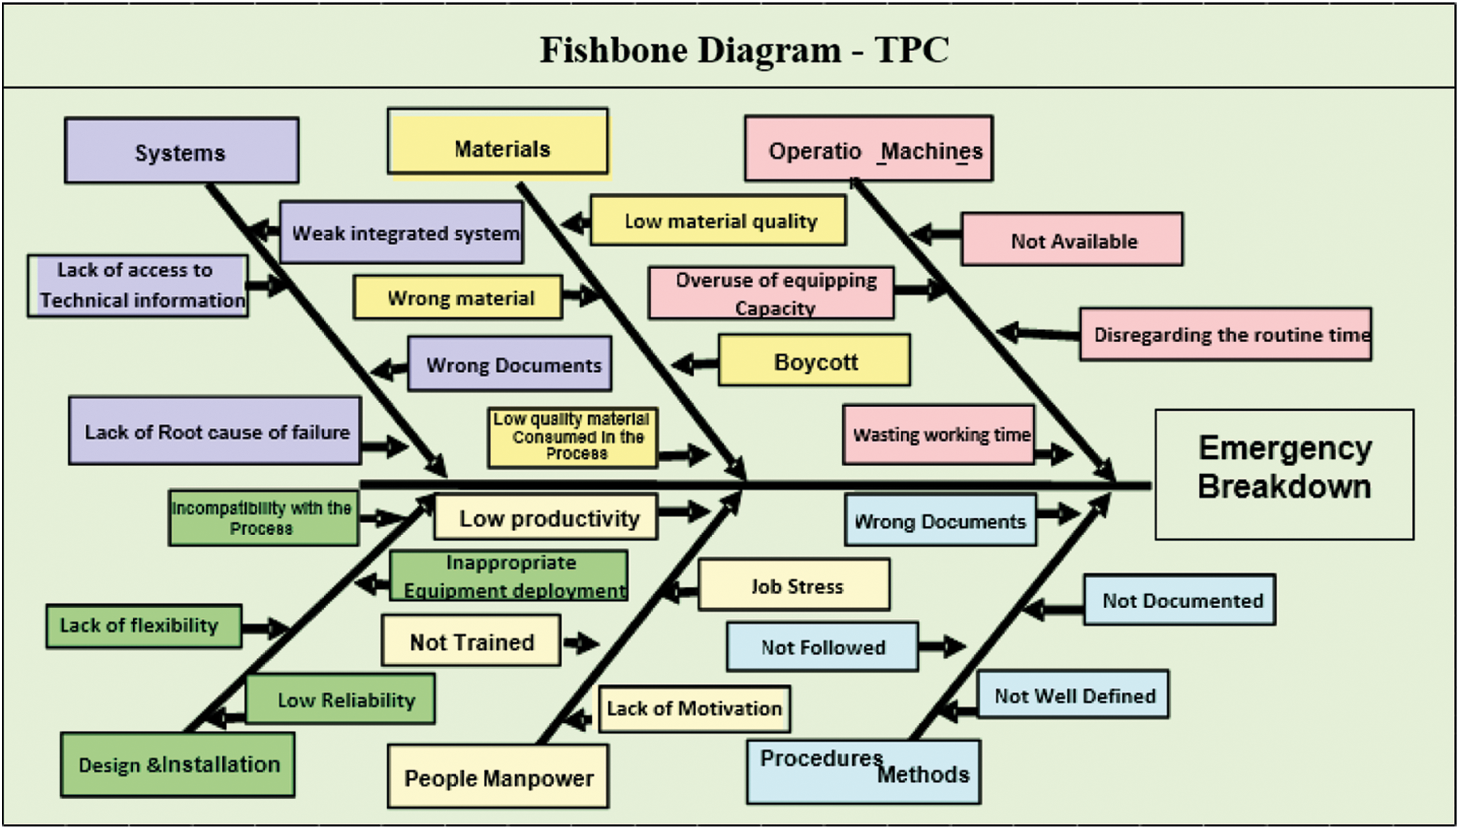
Figure 1: Fish bone diagram for Tabriz Petrochemical equipment
2.2.2 Classification and Prioritization of Equipment
According to the determined criteria and scoring by the experts [30], all process equipment of the company is prioritized at sensitive, semi-sensitive, and non-sensitive levels. In this paper, drier 301 and pump 101 were selected as the study sample because of their high sensitivity and critical role in the production process, so that sensitivity degree is 97/100 in drier 301 and it is 84/100 in the pump.
2.2.3 Failure History in Pump 101 and Drier 301
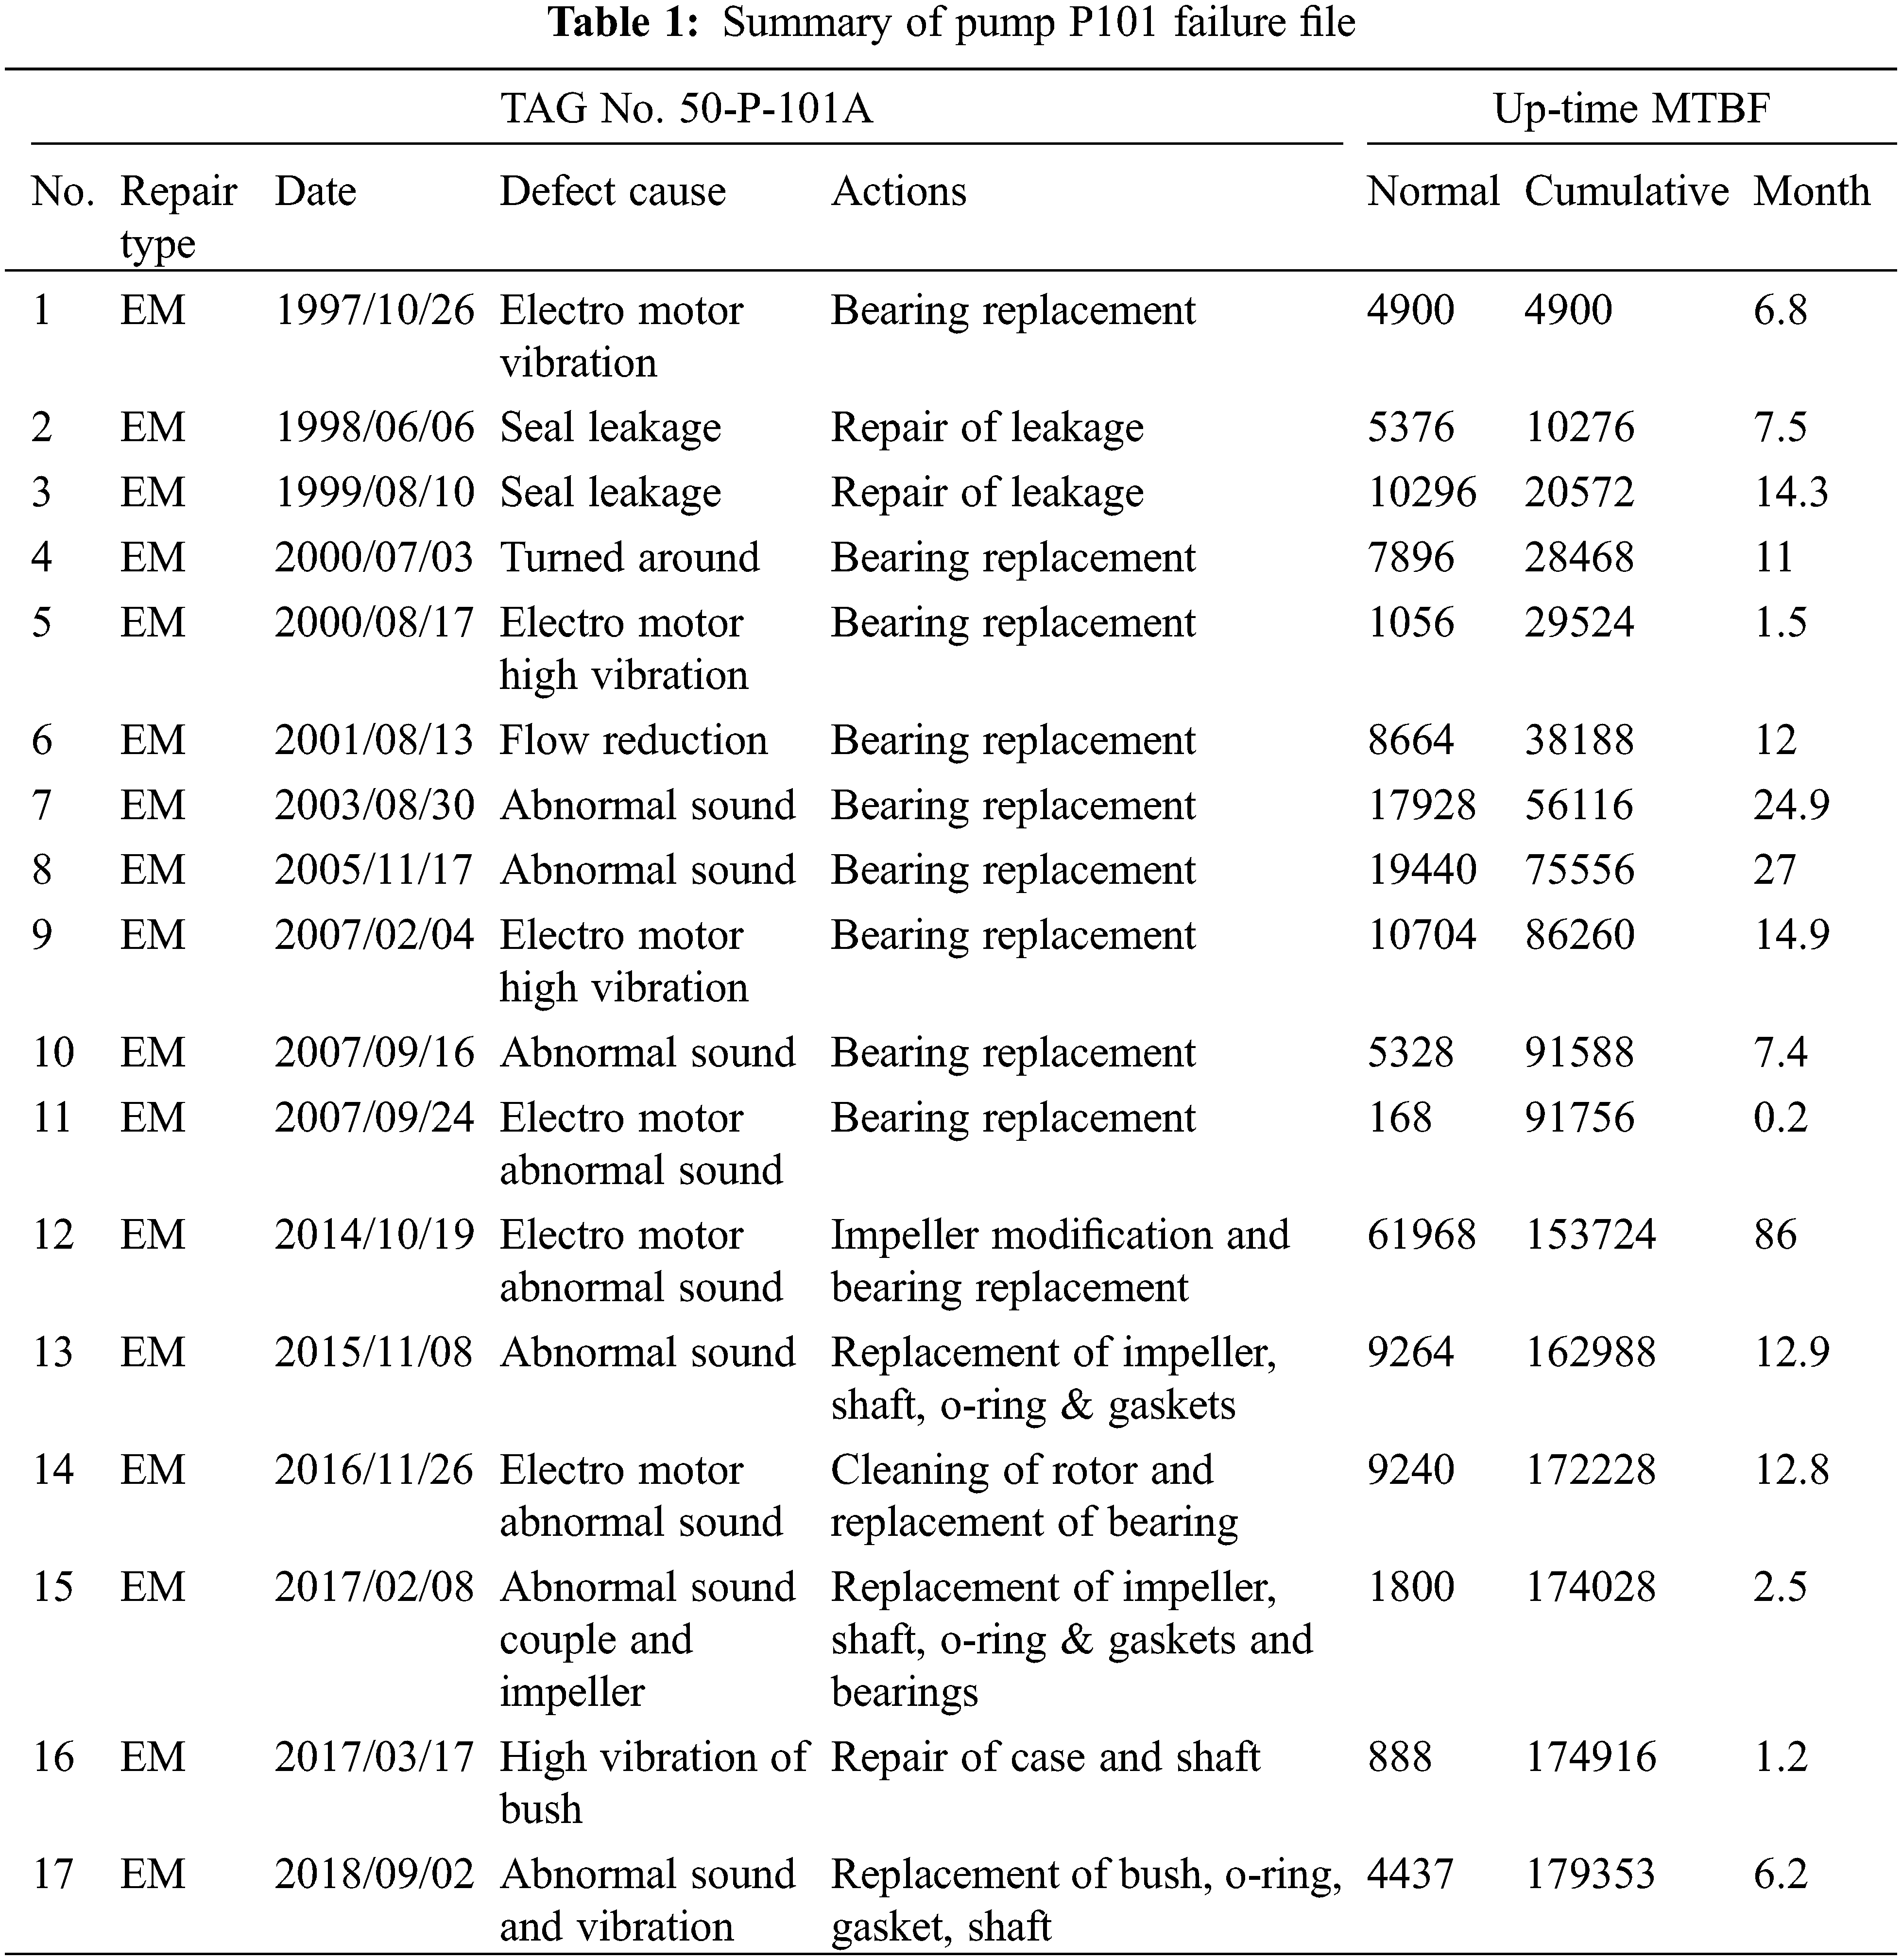
In order to specify feasibility of preventive scheduling program, PM reach rate index and emergency maintenance rate index were calculated so that deviation and distance to the standard program is determined. In fact, the purpose is to specify percentage of realization of preventive routines issued as regulatory preventive program. PM reach rate index for centrifugal pump (50 P 101 A) is about 82 percent, while emergency maintenance rate is about 37 percent for the same equipment (Table 1).
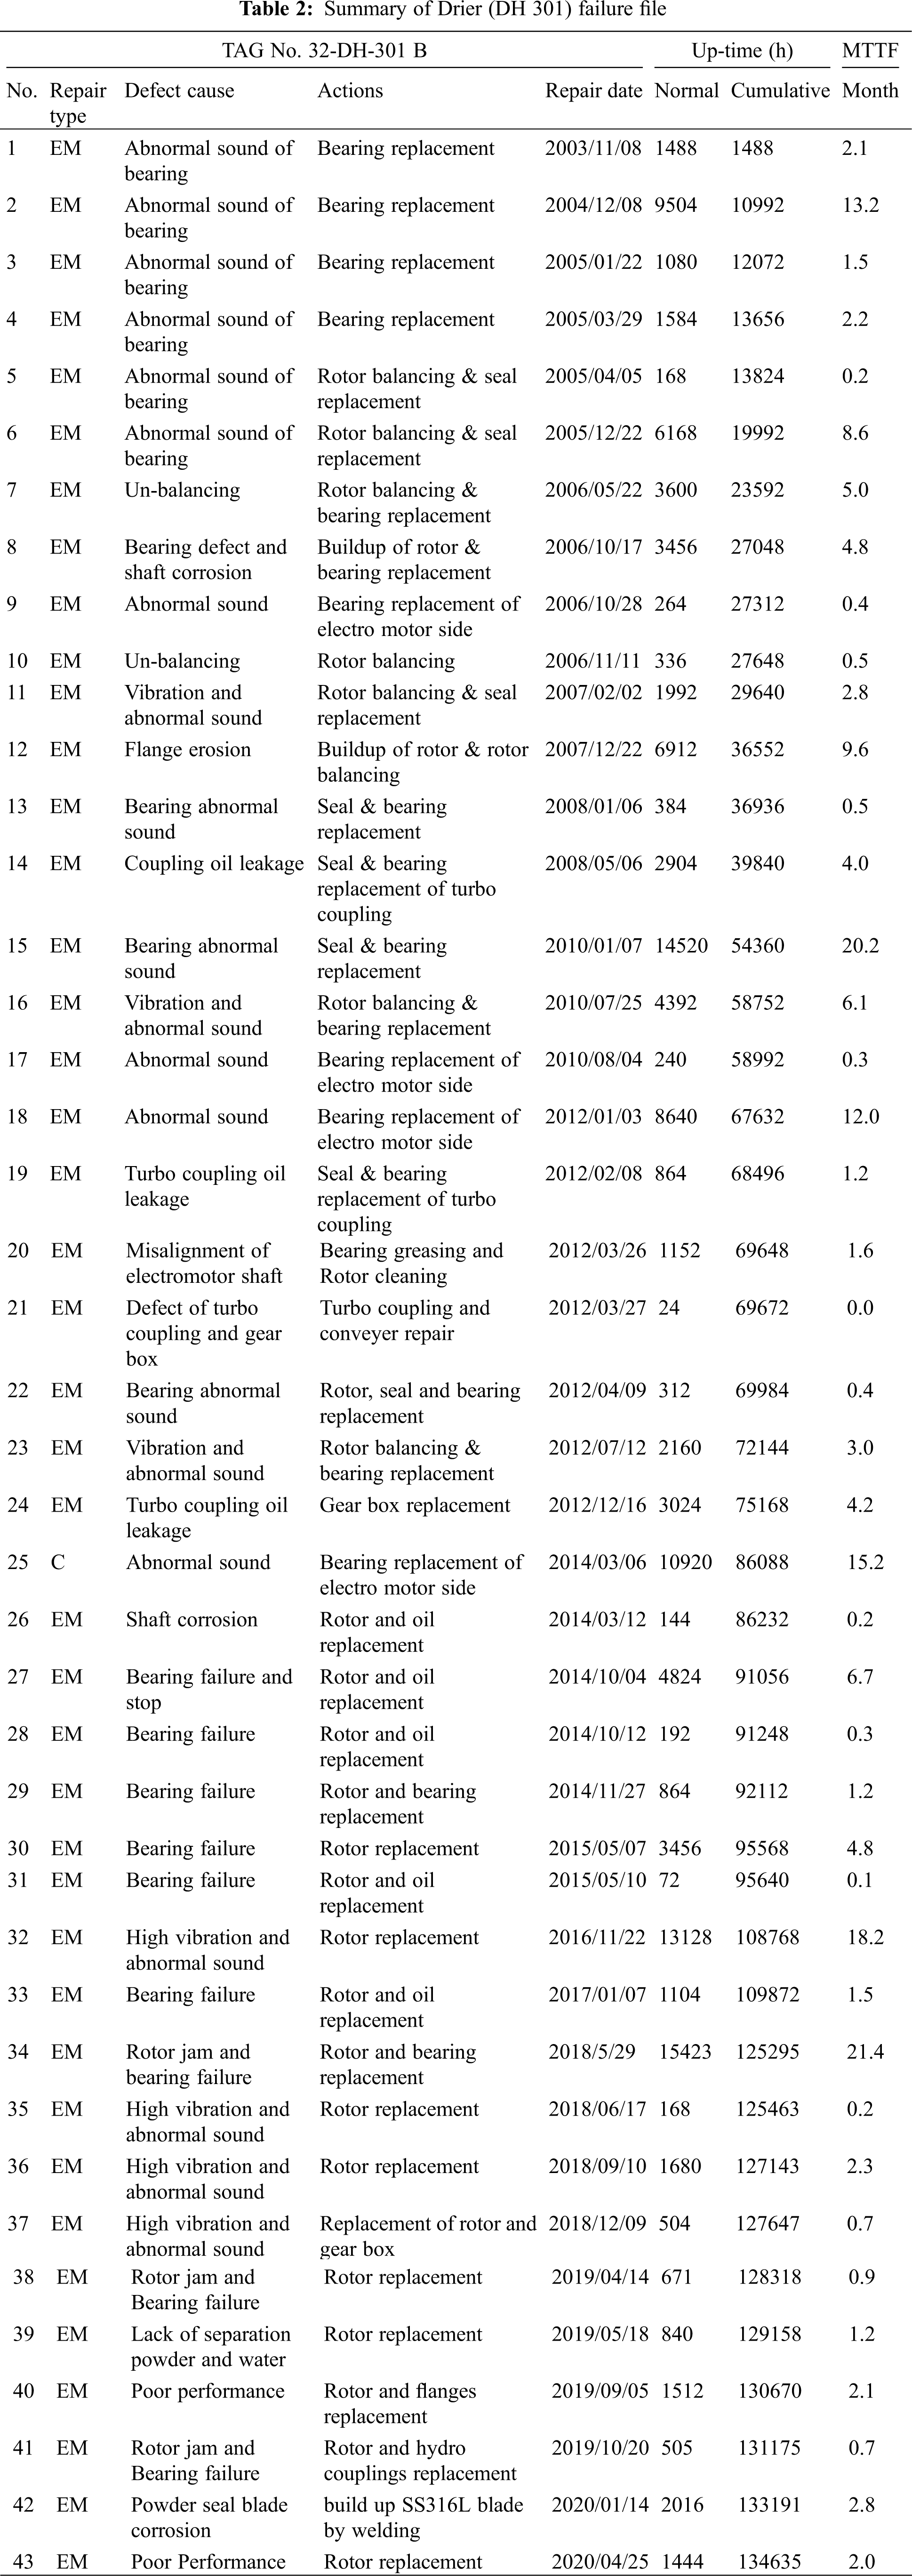
PM reach rate index for drier 32-DH-301B is about 85 percent, while emergency maintenance rate is about 58 percent for the same equipment. The standard defined in this regard for PM reach rate index is about 90 percent or more, and the standard defined for emergency maintenance rate index for rotating equipment under preventive maintenance program is about 0.5 percent or lower. Lack of proper implementation of preventive maintenance and repair program is one of the causes for emergency failures in equipment that make them to be out of control. It may occur due to various causes such as failure to timely delivery of equipment from operation unit to perform preventive routine, increasing number of preventive routine conversions and reducing quality of repairs (Table 2).
2.2.4 Using Fault Tree Technique
The other technique used in this research is fault error technique, which is used for identifying and determining possible causes for fault analysis. Fig. 2 indicates all fault mechanisms in pump and non-pumping and fluid discharge. These mechanisms were drawn using previous experiences and holding various meetings with experts in this regards knowing occurrence of faults for determining their root causes. The figures draw them in the form of fault tree.
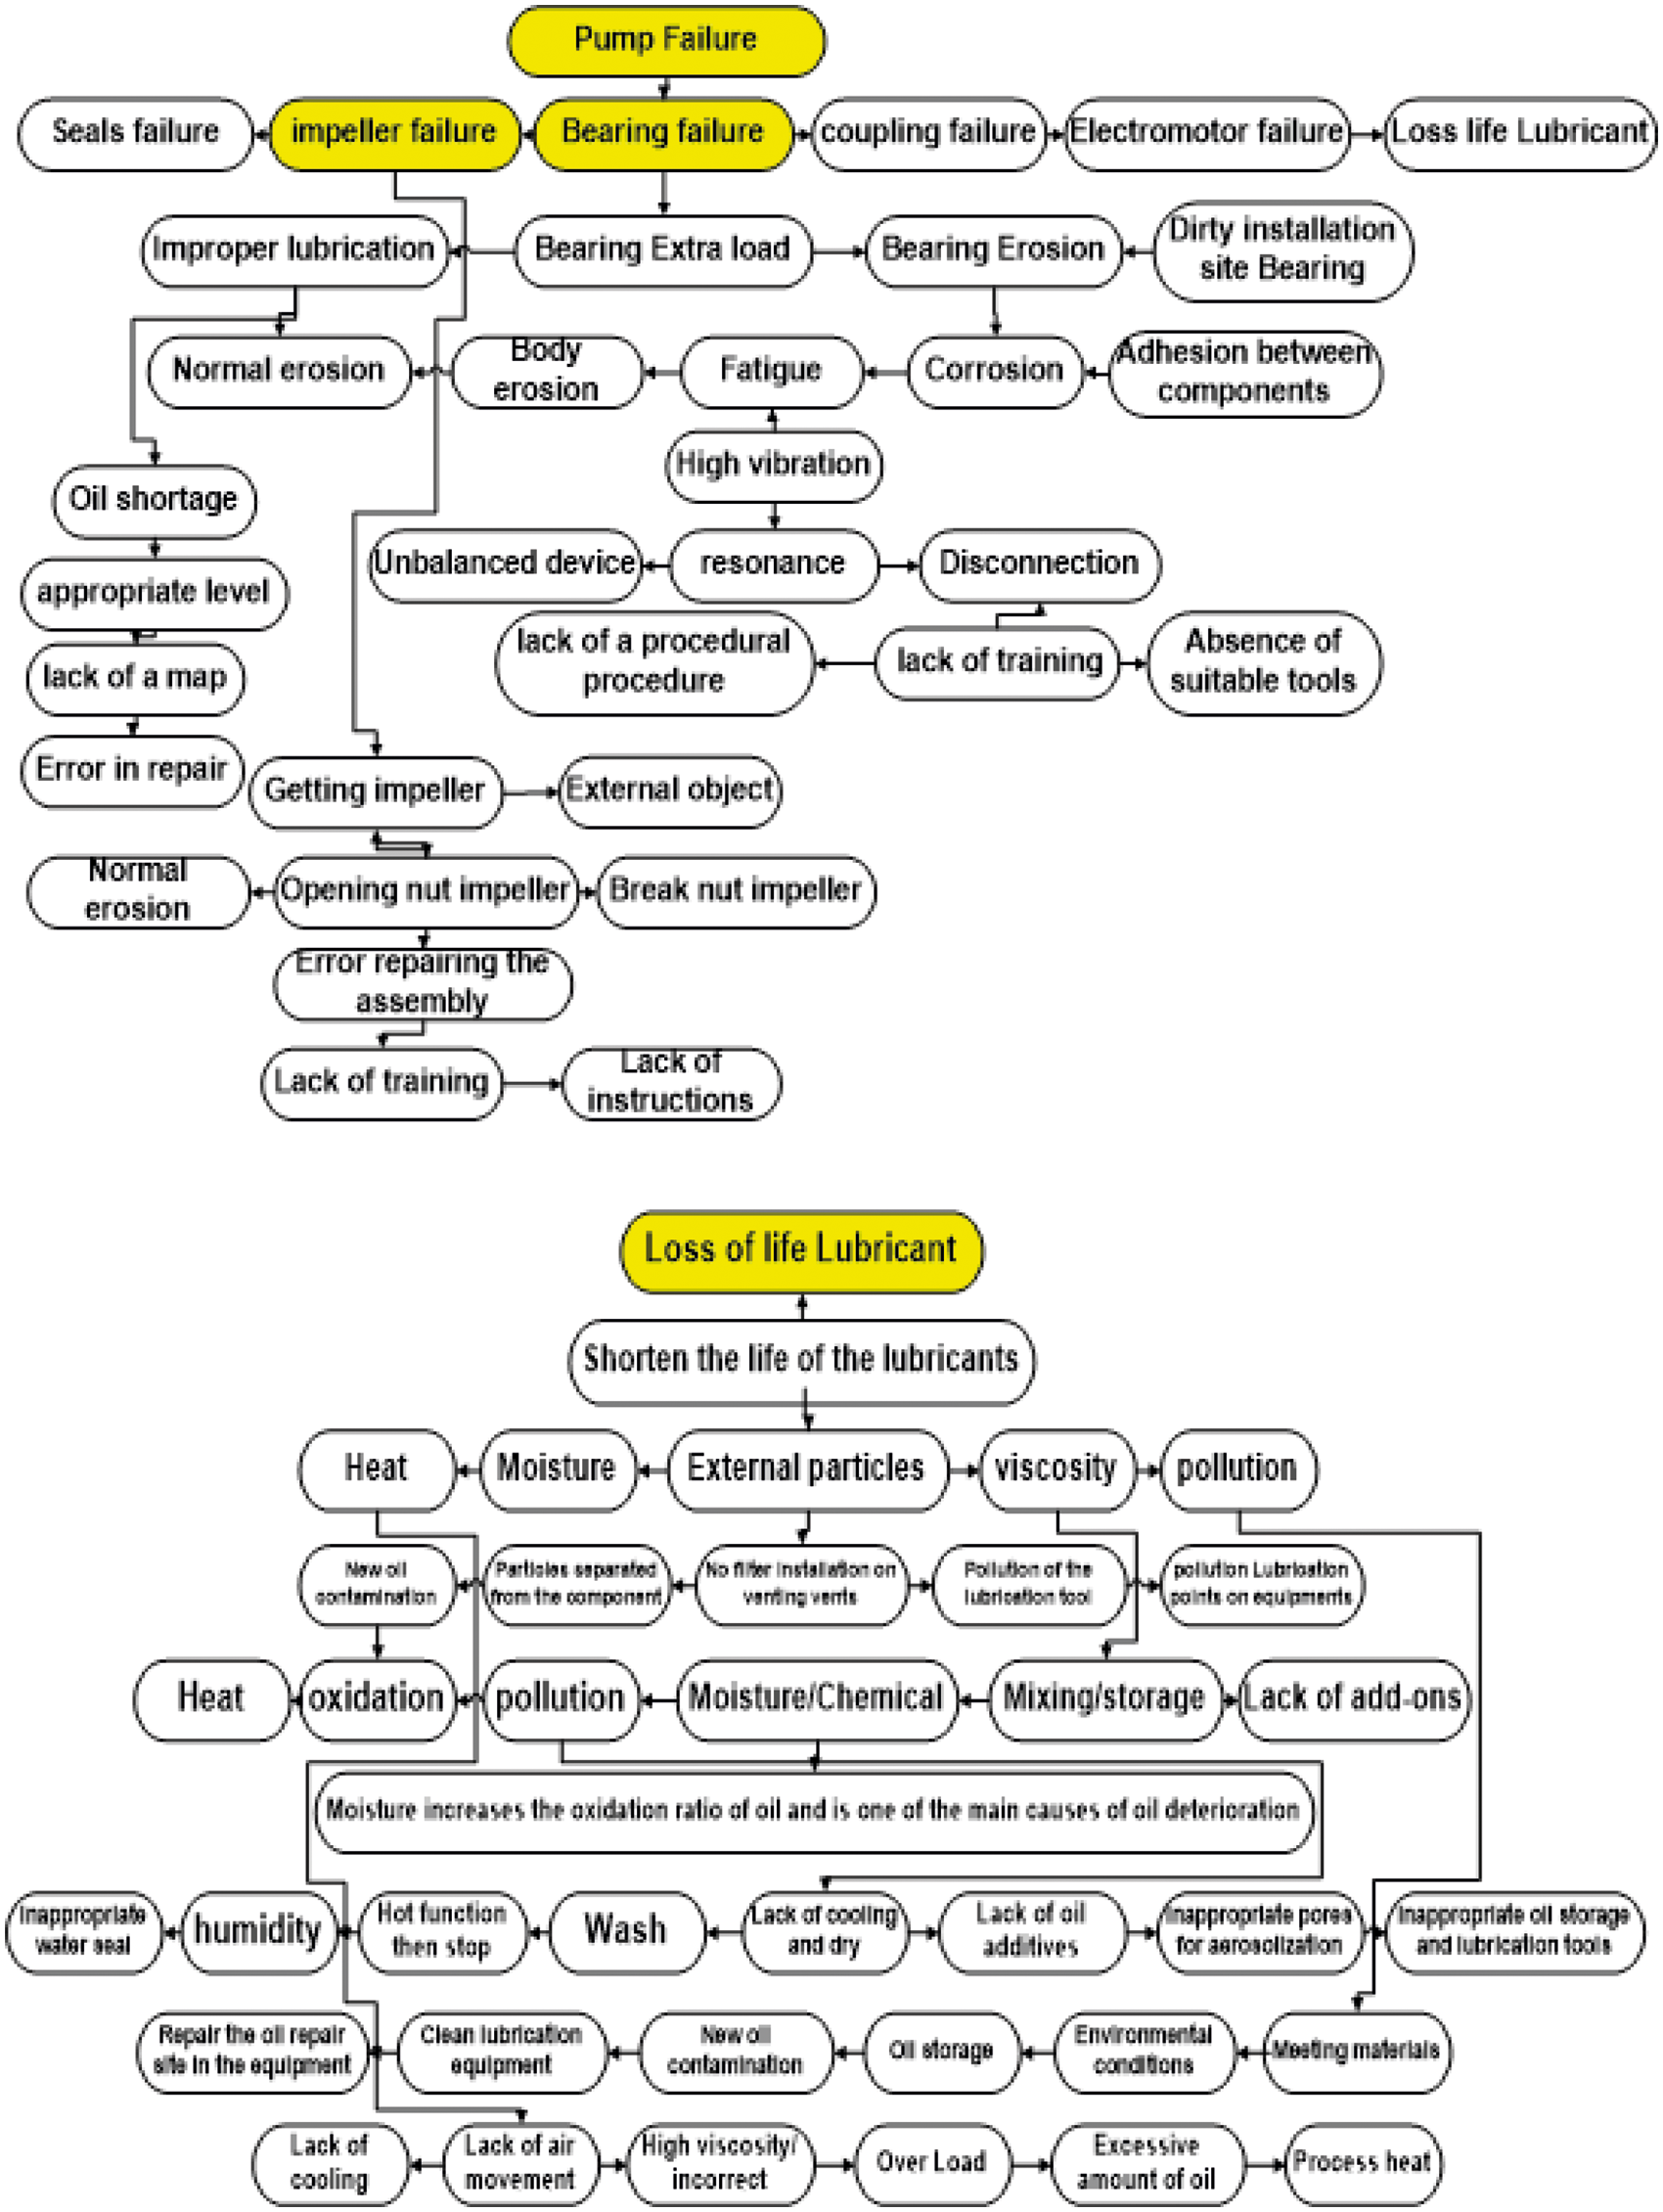
Figure 2: Fault tree drawn for pump dysfunction
Twenty Two-Year Failure Analysis for Pump 101
In order to analyze equipment behavior, those equipment was used that were more vulnerable to failure, and actually their average time interval was smaller. Maintenance and repair policy of the company is the preventive maintenance based on different check and inspection periods proposed by the equipment constructor. Thus, there are specific periods for inspection of equipment under study as the criterion standard, and then unexpected failure diagram is drawn based on function hours and number of emergency failures. Their lines are fitted in order to analyze equipment failure behavior analysis. Their behavioral model is studied and finally its function is obtained, their behavior is analyzed, and standard deviation is specified. In the following, two selected sensitive equipment of the complex are given according to Figs. 3 and 4.
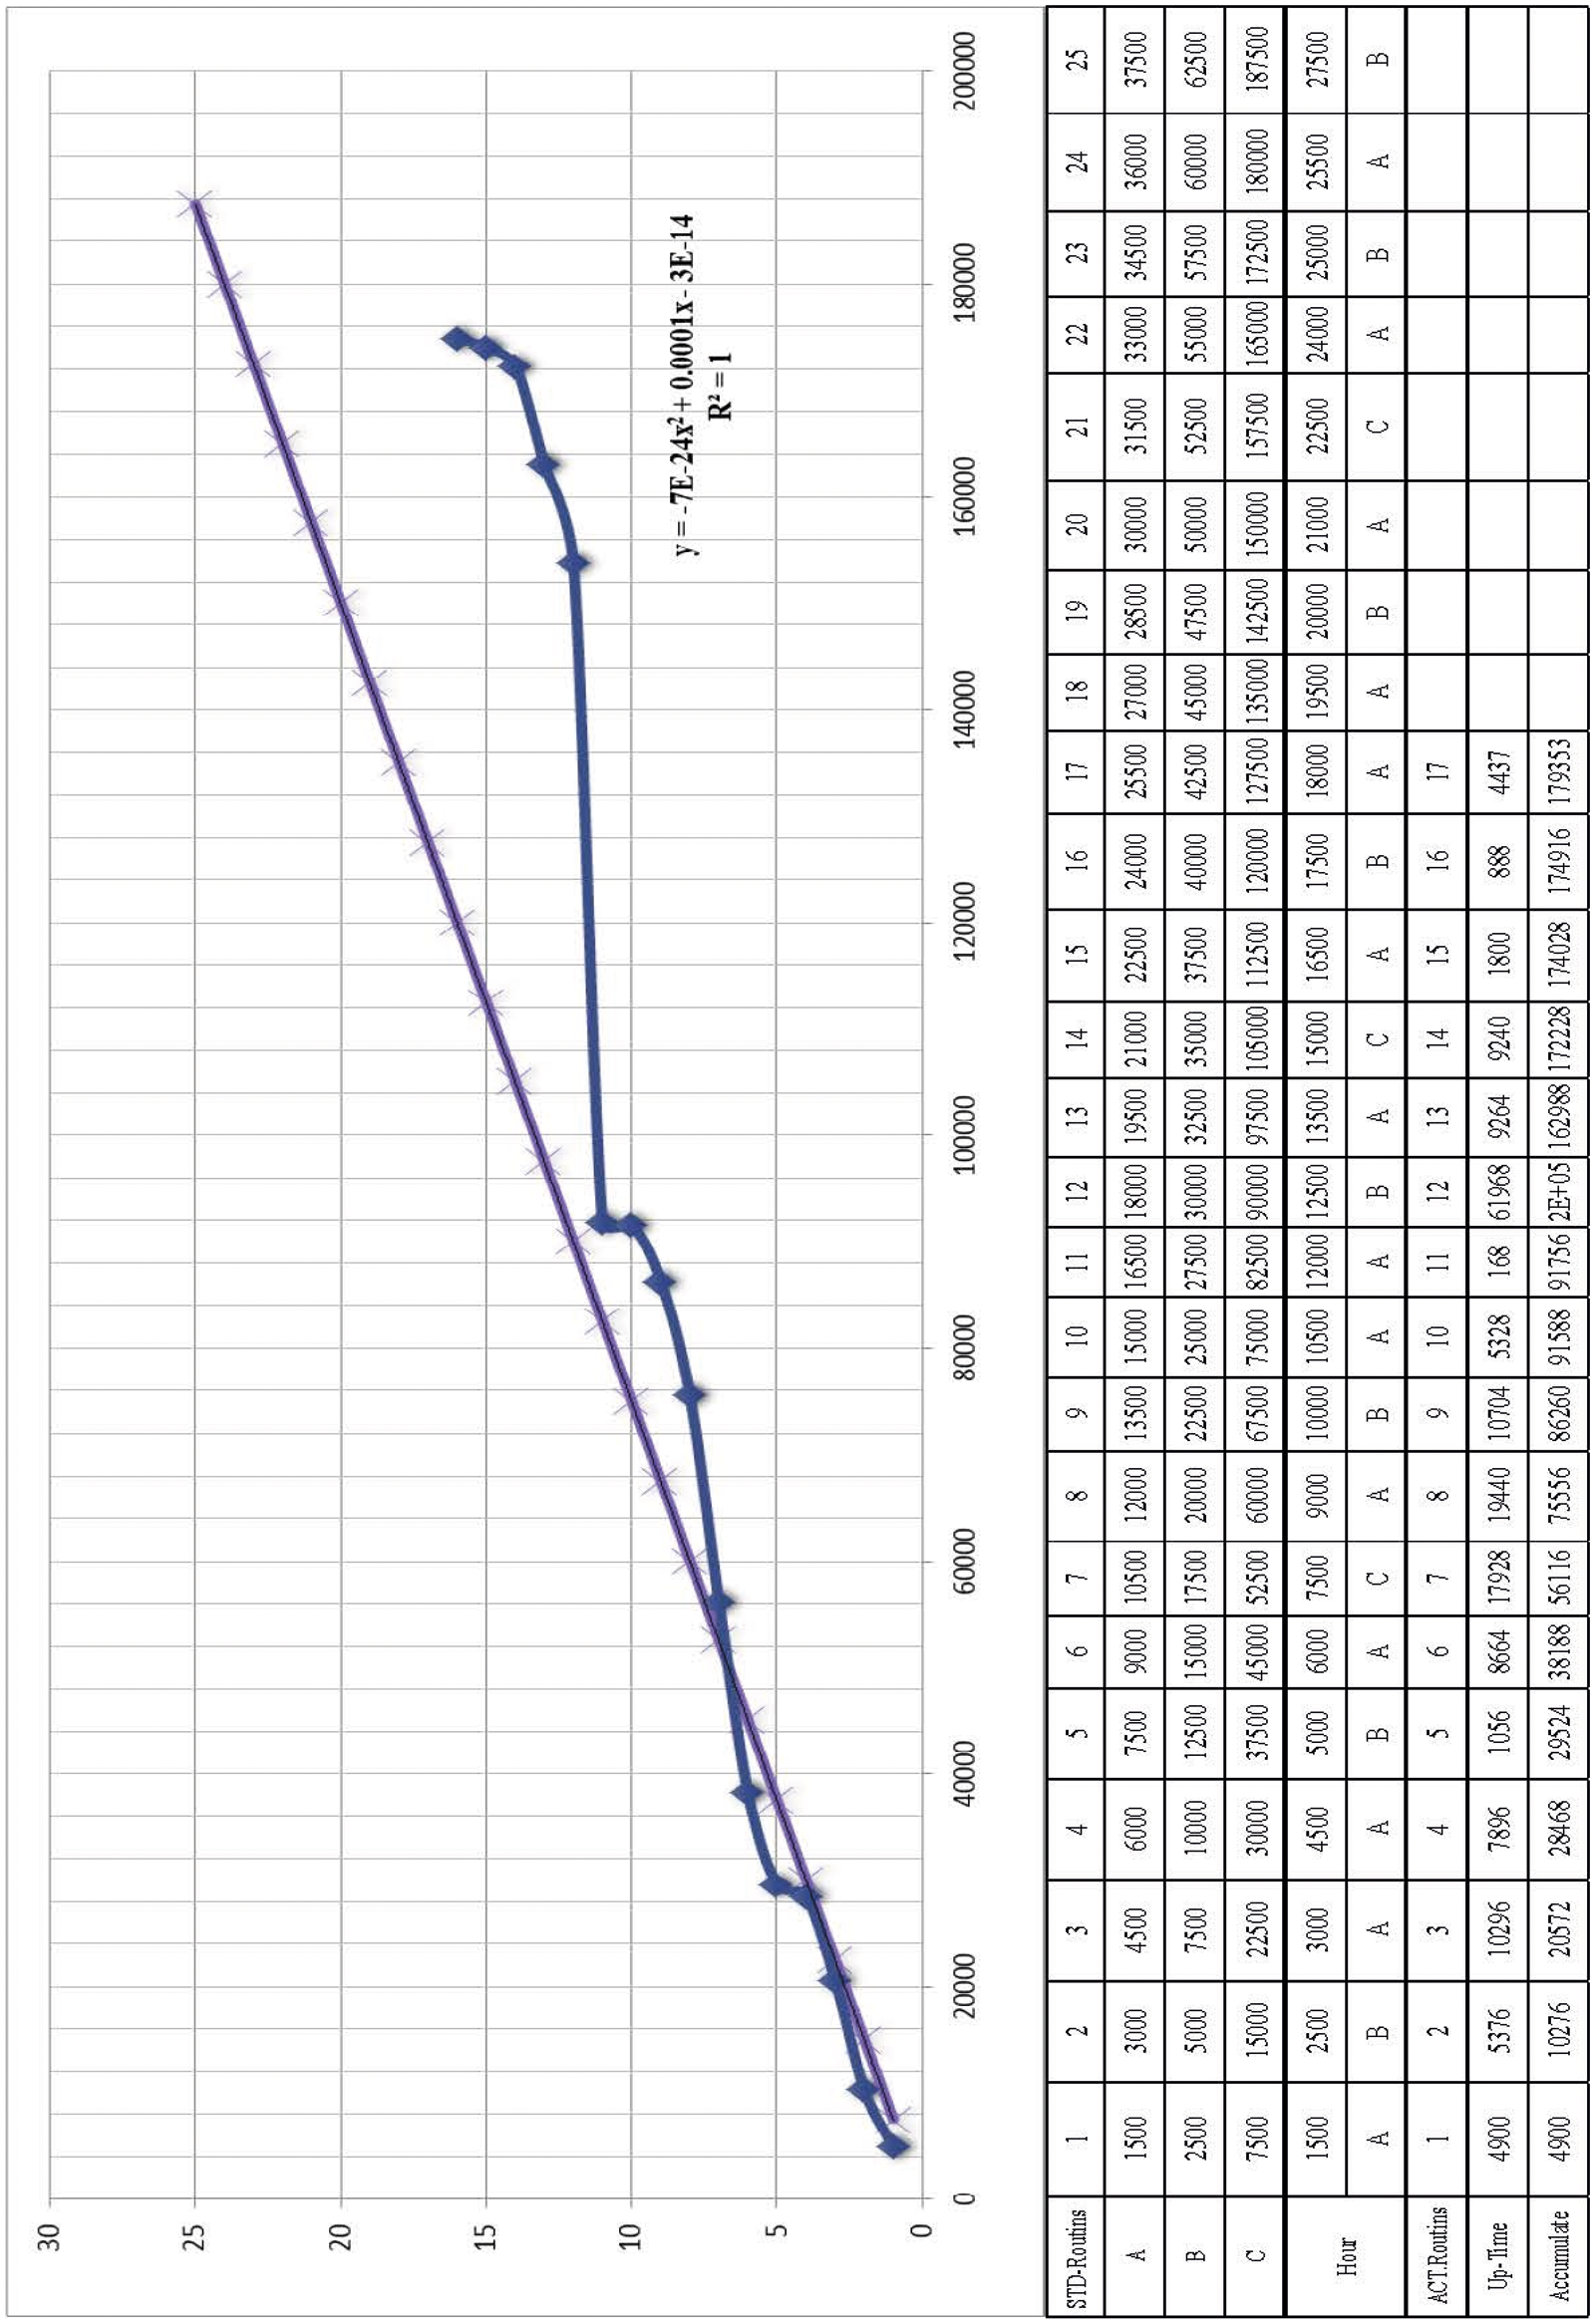
Figure 3: Pattern of unexpected failures in pump 50 P 101 A
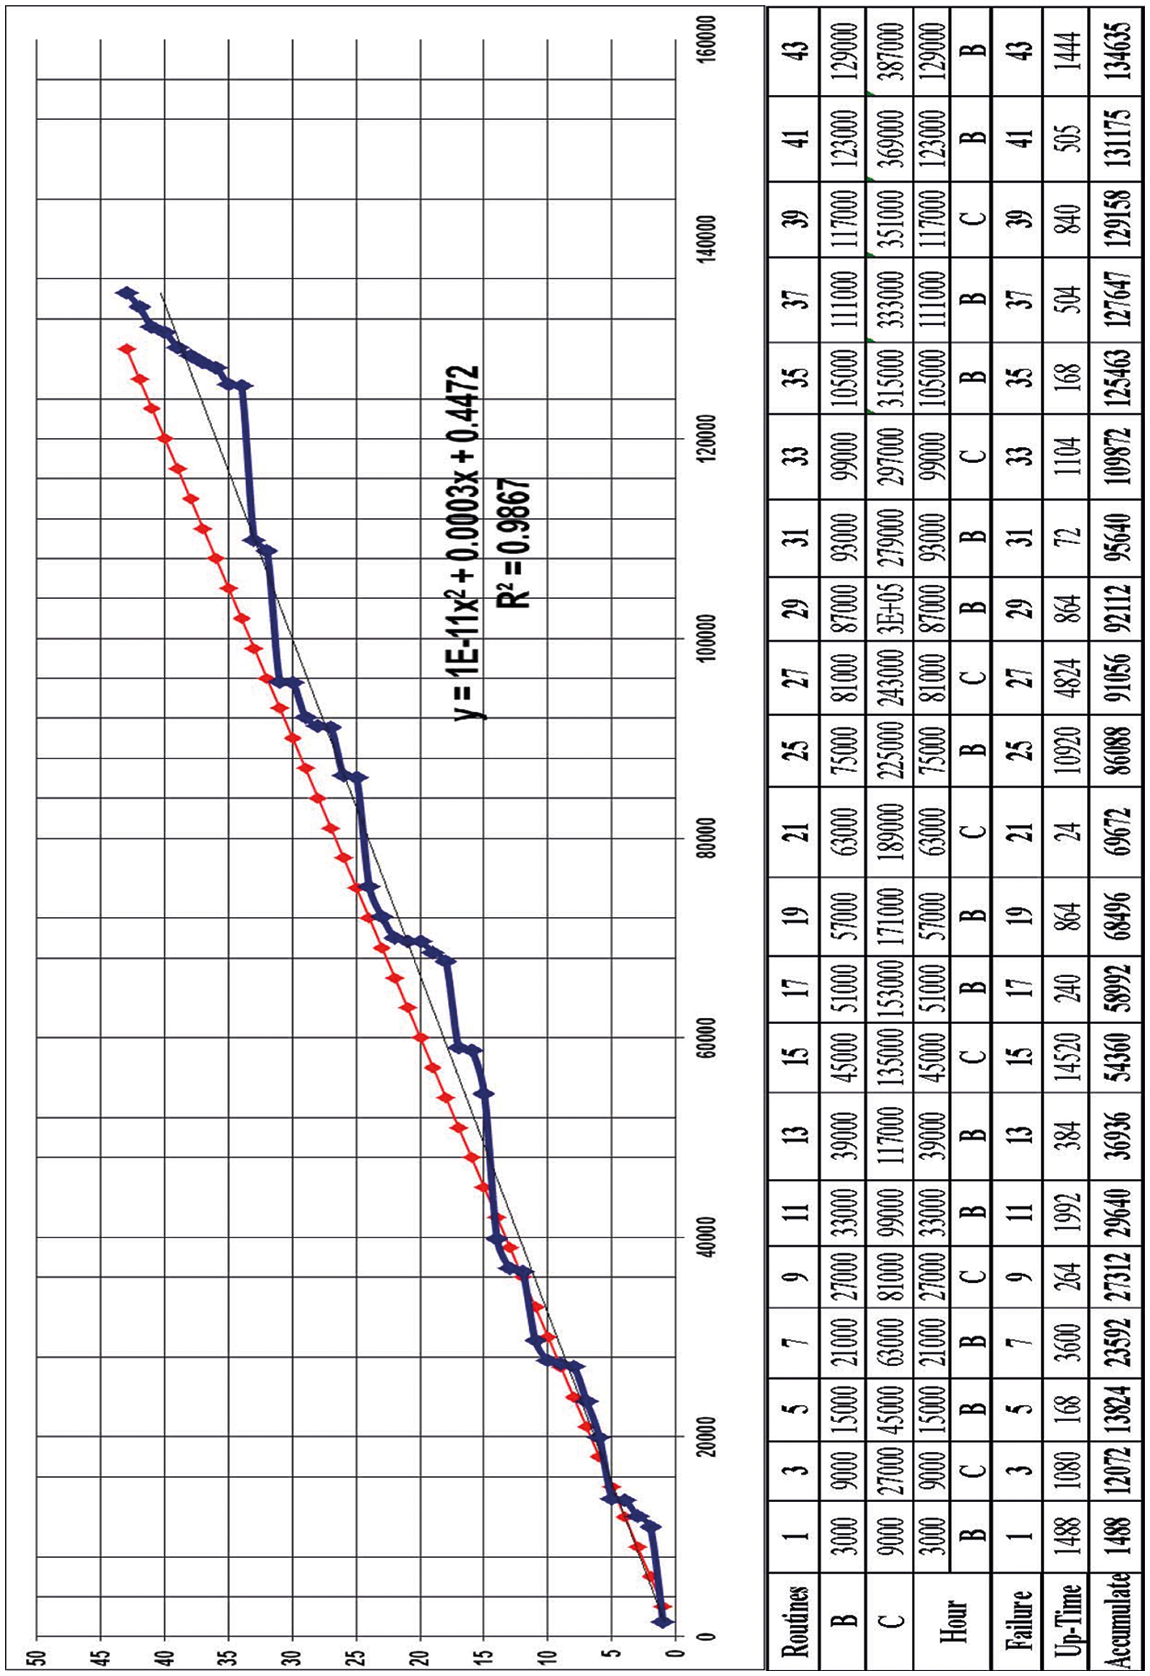
Figure 4: Pattern of unexpected failures in Drier 32 DH 301 B
According to Fig. 3, the standard and current status diagrams for centrifuge pump 50-P-101A in area 1 was accurately analyzed based on above techniques, results of which are described in the following:
1. Delay in issuing preventive routine, failure to observe the issuing intervals, or non-implementation of preventive routine caused increasing intervals between two curves.
2. At point 3, routine of current status, which is trivially functionally different from routine 7 of standard status, both suggest basic repairs of the equipment. In current trend with 500 h fewer function and 4 routines fewer than in equipment compared to emergency routine was repaired. That is, failure in the equipment was so that there was no option other than stop and repair of the equipment, while the equipment was working when issuing routine C, indicating its service. Implementation of routine C is merely for prevention from occurrence of unpredicted failures and avoiding sudden stops in the production process.
3. In routines 5 and 6 of the current trend, two emergency repairs were done within 14 months of time intervals. Considering the function table, which suggests 350 h of functioning between two emergency failures, and according to the list of changed pieces in two routines, it is found that there is fault in repair operations. Routines 5, 6, and 7 of the current trend give a steep slope to the trend leading to decreasing in the distance between the two diagrams.
4. At point 9 in current trend, and point 14 in standard status, the same current as clause 2 is exactly repeated.
5. Routine C is recommended at point 21 in standard status, while according to this point at current status (routine 12), routine C is transformed to B. it leads to implementation of emergency maintenance (EM) at point 13 after 200 h of functioning. In case of non-transformation of routines C to B, occurrence of an emergency maintenance could be prevented.
Implementing emergency maintenance after routine cat point 18 in current trend indicates existence of fault in qualitative operation of the repair.
Eighteen-Year Failure Analysis for Drier 301
As observed in Fig. 4, the bold line indicates trend of unplanned failures in terms of different periods since operation of this equipment. Its trend is ascending by increasing function of the equipment. Its line equation and correlation coefficients of the points are fitted. The faded (Red) line in fact indicates trend of periodic inspections of the equipment based on the manufacturer’s recommendations. Although in this method, repair activities were implemented after occurrence of failures, since there is readiness for coping with such failures among repair forces in the repair office of the Tabriz Petrochemical Company, the experiences and taken measures are recorded in the equipment file, and they are analyzed in the repair planning office. Following drawing the diagrams, analytical tools would be required, so that the weaknesses and strengths of the system are identified and weaknesses are corrected and strengths are enhanced and effective maintenance and repair approach is realized. In other words, the most important analytical methods used in effective maintenance and repair system are used in this step, including root cause analysis (RCA) and root cause failure analysis (RCFA). The basic causes of failure in equipment and machines are smartly searched in these methods. Five Whys and Fish-Bone Diagram are the most practical and simplest methods. The goal of these methods is finding quick, efficient, and economical cause of failures and correcting the failure causes, rather than just finding the effect, as well as collecting information in order to help to prevent from re-occurrence of the failure.
Spot analysis related to failures of 32 DH 301 B is presented in the following:
1. As observed, the first emergency failure occurred after 1488 h of working due to abnormal sound, which led to replacement of bearing. It will be discussed in its place, because it occurred about 2 months after launching the equipment. Therefore, different factors may be effective including inadequate expertise in operation, inappropriate establishment in the location, etc.
2. Regarding preventive routines 2, 3, and 4, it should be noted that the first one was issued with 816 h delay, the second one was issued earlier than due time, and the third one was issued 1000 h earlier. Thus, routine C (basic repair of equipment) had to be issued and implemented, because implementation of preventive routine C, especially in such sensitive equipment, is highly economical than emergency failures, and our preventive system is essentially aimed at reducing emergency failures. Thus, preventive routine C had to be issued and implemented at its due time.
3. As observed, because of non-implementation of preventive routine C at its due time, the second emergency failure occurred after about 1000 h at point 5 because of unusual sound of bearing, and the bearings were replaced. However, despite replacement of the bearings, again the next emergency failure occurred after 1000 h at point 6 with the same cause. The interesting point in this regard is similarity of replaced equipment code.
4. The next preventive routine B (point 9), which occurred after emergency failure, was issued much earlier than the due time, and not only lacked the necessary efficacy, but also it can be stated that it led to emergency failure at point 8, 700 h after implementation of preventive routine. The interesting point is occurrence of the next emergency failure exactly 168 h after repair, or in other words, replacement of its bearings, which is contemplative.
5. Two cases of preventive routines of type B were issued at points 10 and 11; however, they lacked the required efficacy and led to the subsequent emergency failures 525 h after preventive routines. Nevertheless, rotor balance was also added to the implemented repair actions at point 12.
6. Again, preventive routine B was issued by mistake and much earlier than the due time at point 13, which occurred 1800 h after the next emergency failure (point 14). It was due to severe unbalance and led to a rotor balance. It was the same cause observed in the previous emergency failure, but it had been neglected.
7. Two cases of failures occurred 700 h after preventive routine at points 16 and 17. Interestingly, the interval between these two failures is 600 h, and they are due to the bearing failure and severe rotor corrosion, leading to rotor welding and turning, and replacement of turbo coupling bearing and balancing of the rotor.
8. Again, preventive routine B was issued by mistake and much earlier than the due time at point 18, which occurred 348 h after the next emergency failure (point 19). It was due to abnormal sound and severe shaking that led to the rotor balancing and bearing replacement. It was the same cause observed in the previous emergency failure.
9. Three cases of preventive routines, which were issued at points 20, 21, and 22, either were issued earlier than the due time or lacked required efficacy because of incorrect transformations at wrong times. It is approved at point 22, where the preventive.
10. Routine C was transformed to routine B. it is clearly observed that three cases of emergency failures consecutively occurred (at points 23, 24, and 25) one week after these transformations and implementation of routine B. These failures occurred mainly due to the causes observed in the previous failures, and incurred great costs, which will be accurately discussed at financial phase.
11. Preventive routine was issued by mistake and in a very short interval to the emergency failure at point 26, that is, 300 h after it. It was not necessary at all to issue such routine at this time in an interval much shorter than 3000-h time interval.
As shown in Figs. 3 and 4, studying the drier 301 break down pattern and fitting it based on the liner trend of Excel software with a correlation coefficient to predict future failures of this equipment is obtained from function 1. Accordingly, for the pump 101, this calculation is made and the formula (2) is obtained, whose coefficient of correlation are RDH = 0.9867 and Rp2 = 1.
The analysis shows that a specific cause of a different set of failures occurs. Hence we determined these failures and determined their number over the 20-year for two studied equipment. Then, we combine these data together and then place the failures of the highest value to the lowest value in a horizontal row. As shown in Fig. 5, for drier 301 and Fig. 6, for pump 101, a histogram exists in which its columns represent a variety of failures and, on the other hand, there cumulative values are used to indicate the priority of improvement. At this point, the points that represent the 80% cumulative line are determined and the focus on the types of failures that are on the left side of this line will be of particular important.
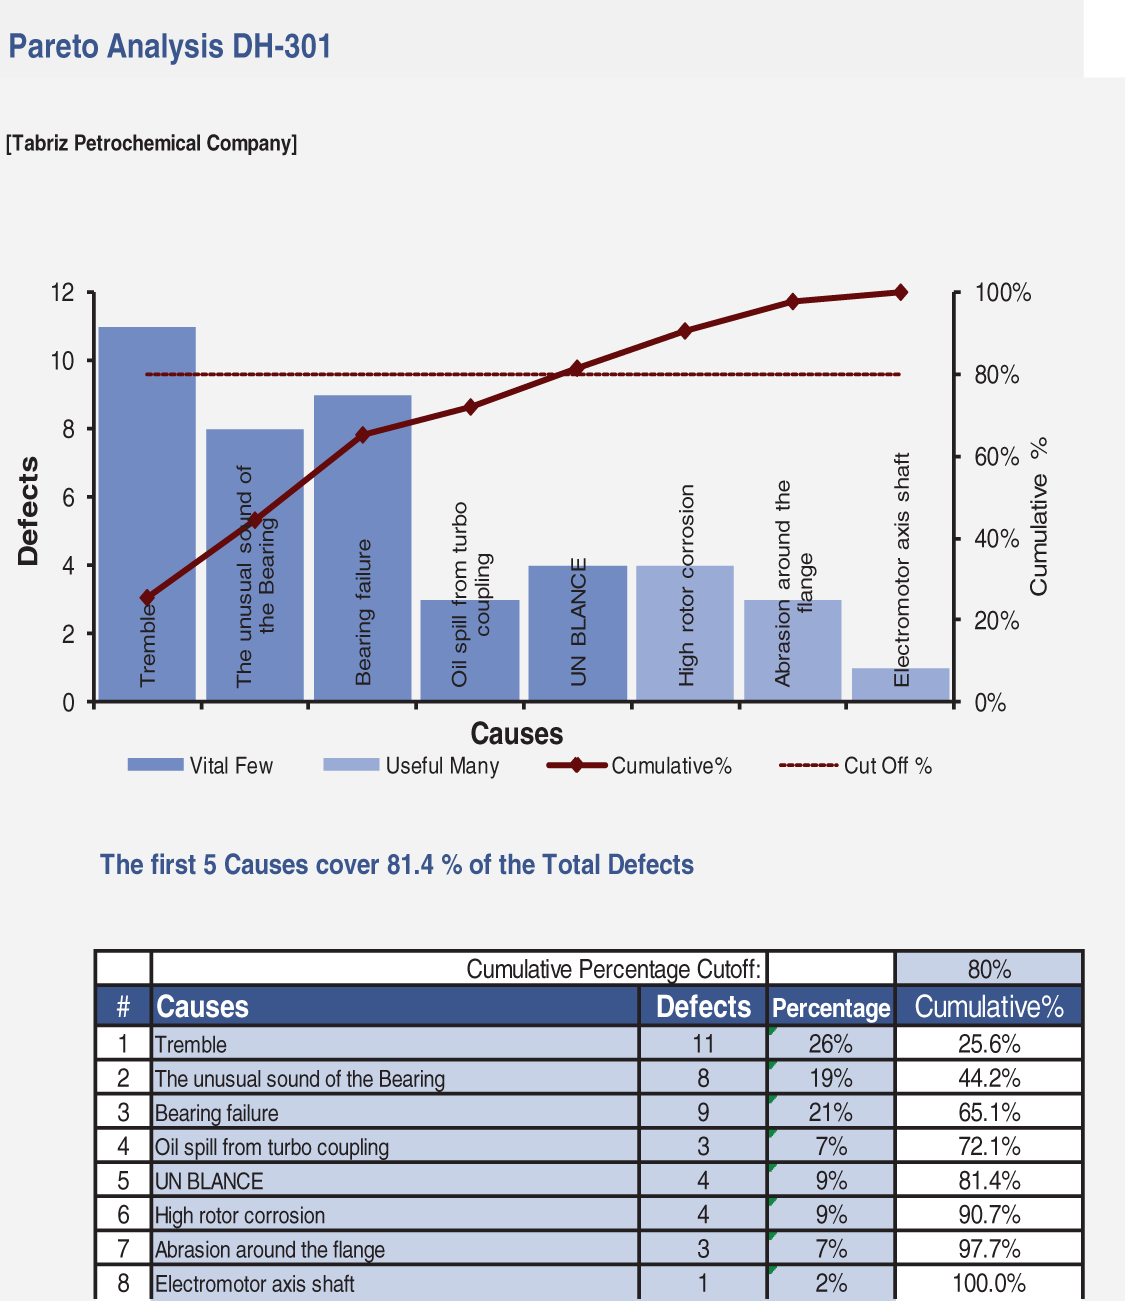
Figure 5: Pareto analysis for DH-301
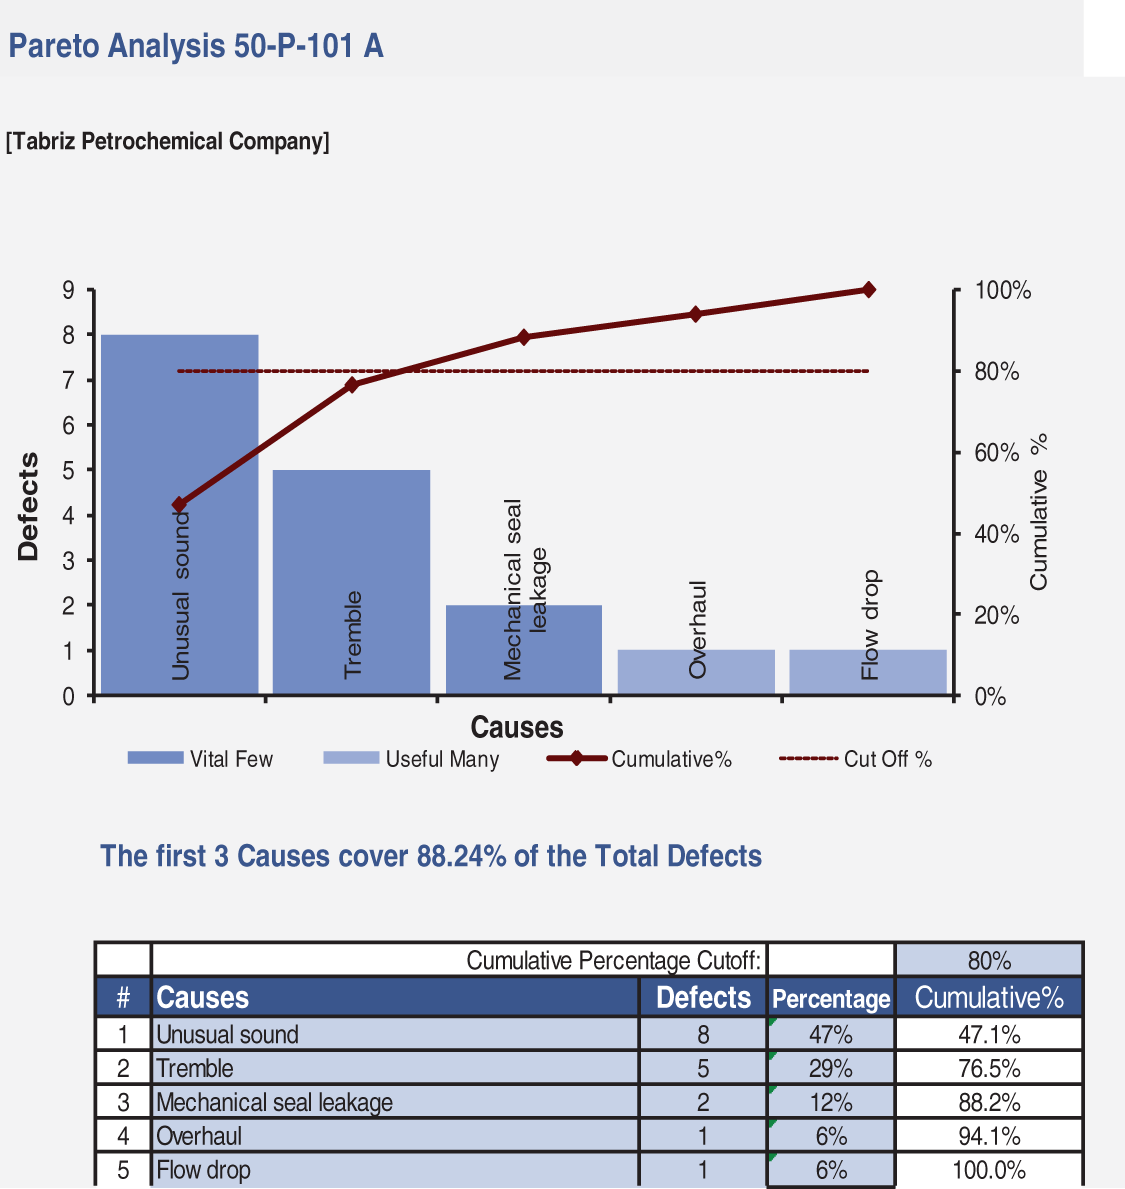
Figure 6: Pareto analysis for P-101
According to the studies on failures within the last ten years in the complex equipment as well as the information collected in the form of cause and effect diagrams, fish-bone technique, and Pareto technique regarding failure causes in equipment of Tabriz petrochemical Company denote that cause of over 60 percent of failures in equipment may occur in direct relationship with the human factors. In fact, the equipment is affected essentially by unexpected failures, because firstly we do not know how to maintain them. Secondly, the policy adopted for maintenance of the process equipment is applied uniformly, and finally, we do not have enough trained personnel with high motivation to implement maintenance programs and can improve the programs using proper feedbacks (Fig. 7).
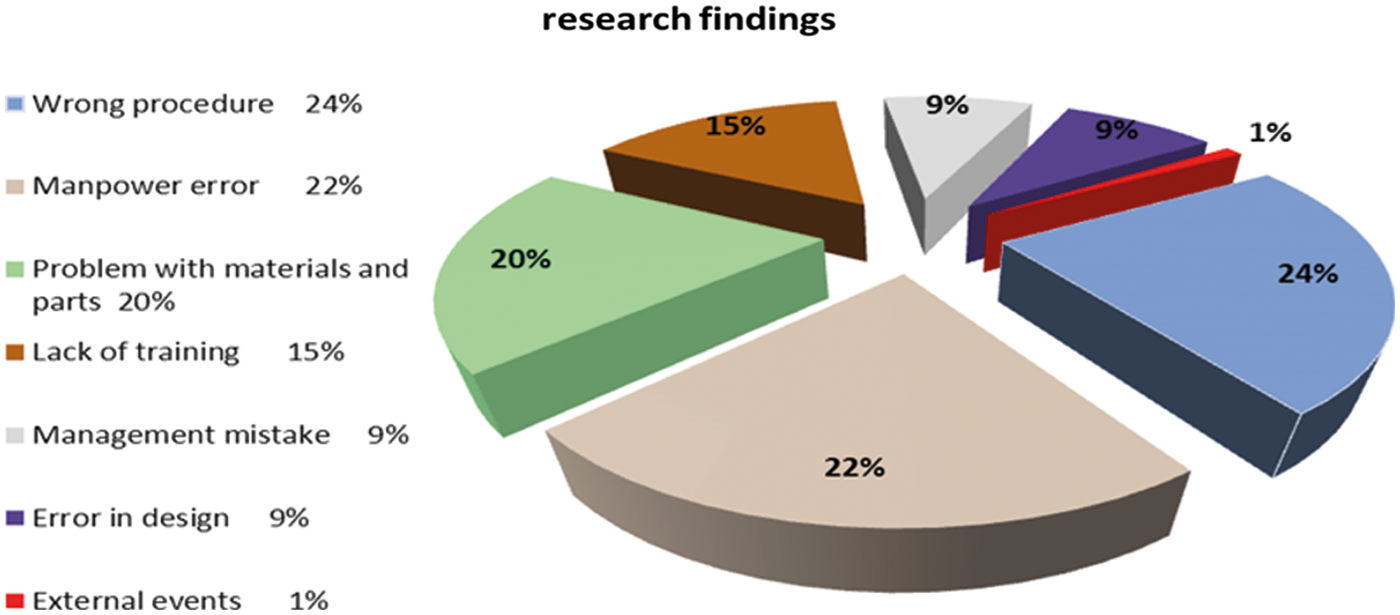
Figure 7: Percent of failures in equipment
Following spot analysis and case analysis, the main causes of emergency failures in equipment were identified as follows:
1. Human performance variability could lead to production losses and in effective maintenance
2. Failure of equipment is the result of combination of multiple factors
3. Low quality of materials and spare parts used in the repair process
4. Lack of adequate knowledge for operation and inappropriate use of equipment in an excessive load
5. Disproportionation between the material purchased for replacement with the respective equipment
6. Improper deployment of equipment in its place
7. Weakness of repair unit in effective implementation of routines and not paying attention to the qualitative maintenance
8. Failure to observe the specified intervals for routine issuance
9. Lack of proper integration between maintenance and operation units
10. Safety and morale of employee are the key areas on which more attention is still required
11. Quality is also integral part of reliability and without it, reliability loses its significance
12. Insufficient knowledge of equipment’s function and behaviors
13. Lack of using appropriate RCFA technique
In this paper the total exergetic efficiency and the system net power was improved by investigation of effects of current preventive maintenance program of the company on equipment reliability and availability as well as identification of their failure models and relationship between failure rate, preventive maintenance and maintenance approach based on the status monitoring showed that major failures in this equipment are due to low quality of consumed bearings and lack of adequate education for proper lubrication of bearings. In fact, the consumed parts used for replacement lacked required quality in most cases, and poor education for proper lubrication or inappropriate establishment of the equipment at its place in some causes caused reduction of equipment reliability and availability. On the other hand, the extent of effectiveness was evaluated by analysis of relationship between PM, failure rate, reliability, and availability. To this end, it would be easy to estimate that how many of failures were resolved by the current preventive maintenance. Therefore, such activities should certainly be implemented according to proper and systematic planning and they should be based on statistical and mathematical computations and probability theory. Analysis of causes for increasing emergency failures in pumps of chemical tanks due to severe corrosion and behavioral analysis and identification of their failure model led to registration of patent in this regard. However, 100% risk mitigation is generally not possible and a compromise between conflicting needs must be found to fix the acceptable risk or safety level for a given system. Cost of EM can be studied in next investigation.
Acknowledgement: We would like to thank Mr. Shahab Asadi, Planning Supervisor of Tabriz Petrochemical Company, for taking part in survey of Planning Data.
Funding Statement: The authors received no specific funding for this study.
Conflicts of Interest: The authors declare that they have no conflicts of interest to report regarding the present study.
1. Adebayo, T. S., Rjoub, H., Akinsola, G. D., Oladipupo, S. D. (2021). The asymmetric effects of renewable energy consumption and trade openness on carbon emissions in Sweden: New evidence from quantile-on-quantile regression approach. Environmental Science and Pollution Research, 29(2), 1875–1886. DOI 10.1007/s11356-021-15706-4. [Google Scholar] [CrossRef]
2. Lin, X., Zhao, Y., Ahmad, M., Ahmed, Z., Rjoub, H. et al. (2021). Linking innovative human capital, economic growth, and CO2 emissions: An empirical study based on Chinese provincial panel data. International Journal of Environmental Research and Public Health, 18(16), 8503. DOI 10.3390/ijerph18168503. [Google Scholar] [CrossRef]
3. Patmal, M. H., Shiran, H. (2021). Public awareness and their attitudes toward adopting renewable energy technologies in Afghanistan. International Journal of Innovative Research and Scientific Studies, 4(2), 82–91. DOI 10.53894/ijirss.v4i2.61. [Google Scholar] [CrossRef]
4. Sibuea, M. B., Sibuea, S. R., Pratama, I. (2021). The impact of renewable energy and economic development on environmental quality of ASEAN countries. AgBioForum, 23(1), 12–21. DOI 10.1080/21622671.2019.1632220. [Google Scholar] [CrossRef]
5. Mogano, P., Mokoele, N. (2019). South African climate change adaptation politics: Urban governance prospects. International Journal of Social Sciences and Humanity Studies, 11(1), 68–83. DOI 10.3389/fenvs.2021.765927. [Google Scholar] [CrossRef]
6. Zhou, S., Hu, Z., Gu, W., Jiang, M., Chen, M. et al. (2020). Combined heat and power system intelligent economic dispatch: A deep reinforcement learning approach. International Journal of Electrical Power & Energy Systems, 1(120), 106016. DOI 10.1016/j.ijepes.2020.106016. [Google Scholar] [CrossRef]
7. Zhou, Z. (2021). Numerical study on the blade channel vorticity in a francis turbine. Fluid Dynamics & Materials Processing, 17(6), 1091–1100. DOI 10.32604/fdmp.2021.016618. [Google Scholar] [CrossRef]
8. Carazas, F. J. G., Souza, G. F. M. (2009). Availability analysis of gas turbines used in power plants. International Journal of Thermodynamics, 12(1), 28–37. DOI 10.5541/ijot.235. [Google Scholar] [CrossRef]
9. Hoseini, M., Haghtalab, A., Navid Family, M. (2020). Elongational behavior of silica nanoparticle-filled low-density polyethylene/polylactic acid blends and their morphology. Rheologica Acta, 59(9), 621–630. DOI 10.1007/s00397-020-01225-5. [Google Scholar] [CrossRef]
10. Ahmadizadeh, P., Mashadi, B., Lodaya, D. (2017). Energy management of a dual-mode power-split powertrain based on the Pontryagin’s minimum principle. IET Intelligent Transport Systems, 11(9), 561–571. DOI 10.1049/iet-its.2016.0281. [Google Scholar] [CrossRef]
11. Montazeri-Gh, M., Pourbafarani, Z., Mahmoodi-k, M. (2018). Comparative study of different types of PHEV optimal control strategies in real-world conditions. Proceedings of the Institution of Mechanical Engineers, Part D: Journal of Automobile Engineering, 232(12), 1597–1610. DOI 10.1177/0954407017732858. [Google Scholar] [CrossRef]
12. Wu, W., Zhou, C. (2020). A numerical study of the tip wake of a wind turbine impeller using extended proper orthogonal decomposition. Fluid Dynamics & Materials Processing, 16(5), 883–901. DOI 10.32604/fdmp.2020.010407. [Google Scholar] [CrossRef]
13. Charaf, K., Ding, H. (2015). Is overall equipment effectiveness (OEE) universally applicable. International Journal of Economics and Finance, 7(2), 9–16. DOI 10.5539/ijef.v7n2p241. [Google Scholar] [CrossRef]
14. Assaf, S. A. (2015). Performance evaluation and benchmarking at petrochemical corporation using a DEA model. International Journal of Advanced Manufacturing Technology, 76(9–12), 1957–1967. DOI 10.1007/s00170-014-6422-2. [Google Scholar] [CrossRef]
15. Gabbar, A., Abdussami, M. R., Adham, M. (2020). Techno-economic evaluation of interconnected nuclear-renewable micro hybrid energy systems with combined heat and power. Energies, 13(7), 1642. DOI 10.3390/en13071642. [Google Scholar] [CrossRef]
16. Wei, W., Skye, H. M. (2021). Residential net-zero energy buildings: Review and perspective. Renewable and Sustainable Energy Reviews, 1(142), 110859. DOI 10.1016/j.rser.2021.110859. [Google Scholar] [CrossRef]
17. Galchynska, J., Larina, Y., Varchenko, O., Struk, N., Gryshchenko, O. (2021). Perspectives of Ukrainian bioenergy development estimation by means of cluster analysis and marketing approach. Economic Annals-XXI, 187(1/2), 63–74. [Google Scholar]
18. Shasfand, S., Husseini, S. M. S., Shahanghi, K. (2016). Enlightening resistive production case study: Oil, gas and petrochemicals. Mediterranean Journal of Social Sciences, 7(4 S2), 82. DOI 10.5901/mjss.2016.v7n4S2p82. [Google Scholar] [CrossRef]
19. Tham, T. T., Nguyen, H. P. (2021). An integrated approach of fuzzy-AHP-TOPSIS for e-commerce evaluation. Industrial Engineering & Management Systems, 20(2), 82–95. DOI 10.7232/iems.2021.20.2.82. [Google Scholar] [CrossRef]
20. Yin, S., Xia, J., Jiang, Y. (2020). Characteristics analysis of the heat-to-power ratio from the supply and demand sides of cities in Northern China. Energies, 13(1), 242. DOI 10.3390/en13010242. [Google Scholar] [CrossRef]
21. Roozitalab, A., Tadbiri, S., Branch, S. (2017). The role of knowledge-oriented leadership and knowledge management processes in innovation in Kalleh Dairy Co. in Tehran. 2nd International Conference on Management and Economics in 21st Century, pp. 259. Tehran, Iran. [Google Scholar]
22. Kareem, B., Jewo, A. O. (2015). Development of a model for failure prediction on critical equipment in the petrochemical industry. Engineering Failure Analysis, 56(3), 338–347. DOI 10.1016/j.engfailanal.2015.01.006. [Google Scholar] [CrossRef]
23. Sheikhalishahi, M. (2017). Human factors effects and analysis in maintenance: A power plant case study. Quality and Reliability Engineering, 33(4), 895–903. DOI 10.1002/qre.2065. [Google Scholar] [CrossRef]
24. Golubev, S., Efremov, A., Gorokhova, A., Gayduk, V., Kravets, E. (2021). Development of the scientific and technological forecasting methodology based on using TIPS instruments. Economic Annals-XXI, 187(1–2), 223–231. [Google Scholar]
25. Márquez, A. C., Mártinez, L. B., Kobbacy, K. A. H., Rosique, A. S., López, A. G. et al. (2019). Combining reliability assessment with maintenance performance analysis using GAMM. In: Asset intelligence through integration and interoperability and contemporary vibration engineering technologies, pp. 107–117. Cham: Springer. [Google Scholar]
26. Ramos, M. A. (2020). A human reliability analysis methodology for oil refineries and petrochemical plants operation: Phoenix-pro qualitative frame work. Reliability Engineering and System Safety, 193, 106672. DOI 10.1016/j.ress.2019.106672. [Google Scholar] [CrossRef]
27. Braglia, M. (2019). A novel operational approach to equipment maintenance: TPM and RCM jointly at work. Journal of Quality in Maintenance Engineering, 25(4), 612–634. DOI 10.1108/JQME-05-2016-0018. [Google Scholar] [CrossRef]
28. Maszke, A. (2019). TPM safety impact–Case study. System Safety: Human-Technical Facility-Environment, 1(1), 639–646. DOI 10.2478/czoto-2019-0081. [Google Scholar] [CrossRef]
29. Ilie, G., Ciocoiu, C. N. (2010). Application of fishbone diagram to determine the risk of an event with multiple cause. Management Research and Practice, 2(1), 1–20. DOI 10.1007/s11277-018-5344-y. [Google Scholar] [CrossRef]
30. Miao, S., Zhang, H., Tian, W., Li, Y. (2021). A study on the unsteady flow characteristics and energy conversion in the volute of a pump-as-turbine device. Fluid Dynamics & Materials Processing, 17(6), 1021–1036. DOI 10.32604/fdmp.2021.016925. [Google Scholar] [CrossRef]
31. Astanakulov, O., Asatullaev, K., Saidaxmedova, N., Batirova, N. (2021). The energy efficiency of the national economy assessment in terms of investment in green energy. Economic Annals-ХХI, 189(5/6), 26–34. [Google Scholar]
 | This work is licensed under a Creative Commons Attribution 4.0 International License, which permits unrestricted use, distribution, and reproduction in any medium, provided the original work is properly cited. |