| Fluid Dynamics & Materials Processing |
DOI: 10.32604/fdmp.2022.017884
ARTICLE
Intelligent Control of Cabin Environment Using Computational Fluid Dynamics for Intelligent Manufacturing
School of Computer and Communication Engineering, University of Science and Technology Beijing, Beijing, 100083, China
*Corresponding Author: Xi Wang. Email: 15010200955@163.com
Received: 14 June 2021; Accepted: 02 August 2021
Abstract: An efficient and versatile intelligent algorithm is developed for the control of the cabin environment of wind power generators. The method can be used to monitor and solve wind power generation problems at the same time. It also provides several advantages with respect to other traditional methods which imply significant workload and maintenance personnel. The functional requirements of the intelligent control system are analyzed, and a control algorithm for the stepping motor is selected and evaluated. Through the comparative analysis of the active power and internal temperature curve for three kinds of output power of the prototype, it is proved that the environmental intelligent control system greatly improves the operation efficiency, solves typical problems in the ventilator room environment, and provides a solid theoretical basis for further research in this field.
Keywords: Wind turbine; cabin environment; control system; computational fluid dynamics
Energy is the most crucial material basis for the development of human society, as well as the focus of the world. It often leads to economic, military and diplomatic conflicts. The world economy has maintained rapid growth for a long time, which benefits from the protection of various energy sources. However, it must be admitted that the world’s energy resources are limited, especially coal, oil, natural gas and other non-renewable resources, and their proven reserves are very limited [1]. Moreover, global industrialization has led to a further increase in the demand for these traditional energy sources. Only vehicles such as cars and airplanes can consume most of the resources every year.
Relevant statistics prove that the consumption of coal, oil and natural gas in the world has increased rapidly since the 20th century. The total amount has increased 20 times from the beginning of this century to the end of this century. It seriously affects the scope of the ecosystem, and directly affects the living environment of the country to a great extent [2]. In particular, the combustion of fossil fuels will produce massive carbon monoxide and dust, leading to serious air pollution. Improper control will cause water pollution, and the greenhouse effect is also caused by the combustion of fossil fuels [3]. The production of carbon dioxide (CO2) is also increasing rapidly at present, leading to a significant increase in the global greenhouse effect, and making the trend of global warming more obvious. Even worse, the melting of polar glaciers will exert an irreversible impact on people’s living environment, and cause damage [4].
This exploration is to study the control of the ventilation system and intelligent filtering system in the ventilator room, so as to improve the cleanliness of the ventilator room environment, reduce the overall environment temperature, reduce the gearbox oil temperature fault, save manpower and material resources, and improve the operation efficiency of the wind turbine. Hence, it has a good application prospect and crucial practical significance. The research innovation is that the online identification and analysis of the cabin data is conducted through the comparison and research of various control algorithms, along with the operation of the fan and the internal characteristics of the cabin. The temperature difference and temperature change are taken as the input, and the temperature value detected is adjusted to meet the requirements of the cabin environment temperature. Meanwhile, the axial-flow motor and stepping motor are controlled, and the air supply action and the feed action of the filter screen are carried out in the cabin, so as to keep a stable temperature and clean environment in the cabin.
The properties of air flow in the cabin, needed for the implementation of the control algorithm, are determined using CFD. The related governing equations and the solution method are illustrated in Sections 2.1 and 2.2.
All CFD simulations are based on these basic governing equations, and the basic governing equations of fluid mechanics are based on the basic physical principles followed by fluid flow (Law of conservation of mass, law of conservation of momentum and law of conservation of energy).
2.1.1 Mass Conservation Equation
According to the law of mass conservation, the increase in mass per unit time of a fluid micro element is equal to the net mass flowing into the fluid micro element at the same time interval. Accordingly, the differential form of the mass conservation equation (also known as the continuity equation) can be obtained [5]:
By introducing the divergence symbol
If vector operator
For an incompressible homogeneous fluid, the density is constant, so it can be obtained that:
For the steady state fluid, the density will not change with time, so it can be obtained that:
2.1.2 Momentum Conservation Equation
The momentum conservation equation can be derived from Newton’s second law “F = ma”, also known as Navier-Stokes (N-S) equation or equation of motion [6]. Its differential form is as follows:
x direction:
y direction:
z direction:
p is the pressure on the fluid micro element; τxx, τxy, and τxz are components of viscous stress acting on the surface of fluid micro elements due to molecular viscosity.
For Newtonian fluids, the viscous stress is proportional to the deformation rate of the fluid, including:
μ is the dynamic viscosity, and λ is the second viscosity.
After the expansion of Eqs. (15)–(17), it can be obtained that:
2.1.3 Energy Conservation Equation
The first law of thermodynamics suggests that for any fluid micro cluster, the change rate of energy is equal to the net heat flow into the micro cluster plus the power of volume force and area force to work on the fluid micro cluster. Thus, the energy conservation equation of fluid can be obtained [7]:
It should be noted that the equation is derived for Newtonian fluid. For non-Newtonian fluids, other forms of energy conservation equations should be used.
2.2.1 Discretization of Calculation Area and Governing Equations
In the process of discretization, the solution domain and the governing equation need to be discretized. Discretization is to divide the solution domain according to certain principles to form a certain number of non-overlapping control bodies. The appropriate node is selected to represent the change of the physical quantity of the control volume. The discretization of the governing equation is to convert this equation to obtain the corresponding algebraic equation, and correlate the changes of the physical quantities of each node. In the process of solving the finite element method, a crucial step is to deal with the governing equations in the solution domain and obtain the corresponding discrete equations. The commonly used methods in the discretization process include the discretization of hybrid scheme, central difference scheme and exponential scheme, which can be selected according to needs in the actual application process.
Different discretization schemes have different orders. The lower the order of the discretization scheme is, the faster the solution speed is and the better the stability is. However, the accuracy is relatively poor. How to choose the discretization scheme is not only related to the stability of the solution, but also affects the accuracy of the solution. The solution accuracy mainly considers the influence of false diffusion. False diffusion refers to the error caused by the truncation error of the discretization scheme of the first derivative term is lower than that caused by the second order. In this case, the accuracy of the numerical analytical solution may be significantly affected [8]. In this solution process, on the basis of ensuring the stability of the solution, the solution accuracy of the high-order discretization scheme is higher. Practical problems should be considered in the selection of specific discretization schemes [9]. In the process of discretization scheme selection, considering the influence of these factors, the standard interpolation function is selected to deal with the pressure term, and the second-order upwind interpolation function is used as the energy equation.
2.2.2 Algorithm of Numerical Calculation
The control equations related to air flow in the cabin are established based on the above analysis. Then, it is discretized into algebraic equations by a certain discretization scheme, and the algebraic equations are solved by computer to obtain the corresponding numerical solutions. In the solution process, the corresponding target solution area needs to be discretized and divided into a certain number of small units. Next, all the discretized control equations are calculated and processed. This method is often applied in solving discrete equations, which can be divided into two types: separation method and coupling method. In different cases, the corresponding solution methods are also different. In the actual application process, it can be selected appropriately to better meet the solution requirements. The application proportion of pressure correction method in this aspect is very high, among which the commonly used semi implicit method has high application value in computational fluid software [10]. This method is also called SIMPLE method, which was proposed by Patankar and other scholars in the 1970s. The influence of fluid compressibility is considered in the calculation process of this method. This method is applied in the simulation process.
In order to better meet the relevant application requirements, the SIMPLE algorithm has been improved and perfected in the subsequent application process. Moreover, on this basis, multiple related improved algorithms are established, including SIMPLER, SIMPLEC and PISO algorithms. According to the practical application results, the convergence speed of these improved algorithms is significantly improved, which can better meet the application requirements [11].
2.3 Analysis Method of Temperature Field
The temperature field represents the temperature set of different points in the cabin of the whole wind turbine in the working process. Generally, it can be divided into transient and steady temperature fields. The former tends to change with time, while the latter does not. The temperature field in the cabin studied is a three-dimensional steady temperature field, and its function expression is T (x, y, z) [12]. The research method is analyzed from the point-line-plane angle, so as to accurately describe the distribution of temperature field in the cabin of the wind turbine. The details are as follows.
The change of temperature field at different positions in the cabin is different. First, multiple points symmetrically in the cabin are taken, the temperature of each point is collected through the CFD software FLUENT, and the distribution of the temperature field is observed and analyzed.
2.3.2 The Angle of Line and Surface
The whole cabin of the wind turbine is longitudinally divided. Different sections of typical positions are selected in the cabin, such as the section between the position near the cabin wall and the heat source parts, and the section between the heat source parts and the heat source parts. The temperature field distribution of the whole section is mainly analyzed in connection with the actual heat dissipation of the cabin of the wind turbine group [13,14]. Moreover, the centerline of each section is taken and runs through the front end of the cabin and the rear end of the cabin. The longitudinal variation of temperature in the whole cabin is observed.
2.4 Brief Introduction of Gas Flow Analysis Method
Airflow is the flow of gas. The generation of airflow in the cabin of the wind turbine is complex, which is affected by the coupling of temperature, humidity, wind speed, air pressure and other factors in the cabin. The research on the air distribution in the cabin of the wind turbine is mainly based on the analysis of the airflow path and the distribution of airflow organization. For the wind turbine cabin, the external environment and the wind turbine cabin continuously carry on the gas heat transfer exchange. The air is sent into the cabin by the external environment through the air supply outlet. The cold air entering the cabin flows through the gearbox, generator and other main heat sources and heats them to observe the movement state of the air in the whole cabin.
The heat dissipation performance is evaluated according to the corresponding cabin structure of the wind turbine. In the research process, the cabin analysis modeling method is mainly adopted, and the airflow organization model is established and solved.
2.5 Analysis of Heat Production of Gearbox
2.5.1 Heat Calculation of Gear Engagement
If all the energy generated by friction is converted into heat, the heat generated by the gear in the gear meshing box is completely generated by meshing and close contact. The whole process of gear meshing will also include the sliding caused by the blocking of a transparent oil cover that may be formed outside the gear, and the actual meshing completion rate is a function of the close contact coefficient generated in the process of sliding and meshing. 6 m/s < v < = 30 m/s is usually selected as the pitch line velocity of the gear during the working time of the fan. The strength K of the load-bearing charge is within the range of 2.5 N/mm < K < 25 N/mm. The power loss equation of gear engagement is:
The above equation includes the friction factor of meshing and the mechanical efficiency M. fm represents the function among applied loads, which can mainly explain the mechanical properties M produced in the process of tooth meshing.
The internal gear ring of the transmission part and the internal meshing of the planetary gear. The meshing efficiency among gears can be expressed as ηm = 1 − ψm. The loss coefficient ψm is usually calculated as follows:
Δ represents the correlation coefficient related to meshing. If α0 = 20°, under the condition of constant position and high displacement, the transmission of spur gear can be determined by consulting relevant drawings; for internal meshing transmission, the final value in the figure needs to be multiplied by
2.5.2 Bearing Heat Generation Calculation
The bearing can be said to be the part supporting the transmission parts in the whole gearbox, and the whole bearing will produce contact between points or lines in the process of movement. The heat formed by constant friction is the main heat source of the whole gearbox in the process of movement. It will also be accurately calculated in various projects. In general, Palmgren equation is adopted. It is obtained from the comprehensive detection of the heat data of the gearbox engaged by the gear. Most of the hot energy generated by the gearbox comes from the close contact of the roller. If the contact generated power is not consumed, the relationship equation between the energy generated by the bearing is obtained by using the friction contact torque M and the rotation speed:
3 Prototype Test of the Intelligent Control System in Cabin Environment
3.1 Composition of System Test Prototype
The system has been installed in a wind farm through simple integration and combination. The power grid capacity is 100 MW and there are three wind turbines, 12#, 13# and 14#. The environmental protection intelligent control system has been installed in Dongfang FD70-1500kw 13# wind turbine. Fig. 1 presents the system wiring topology.
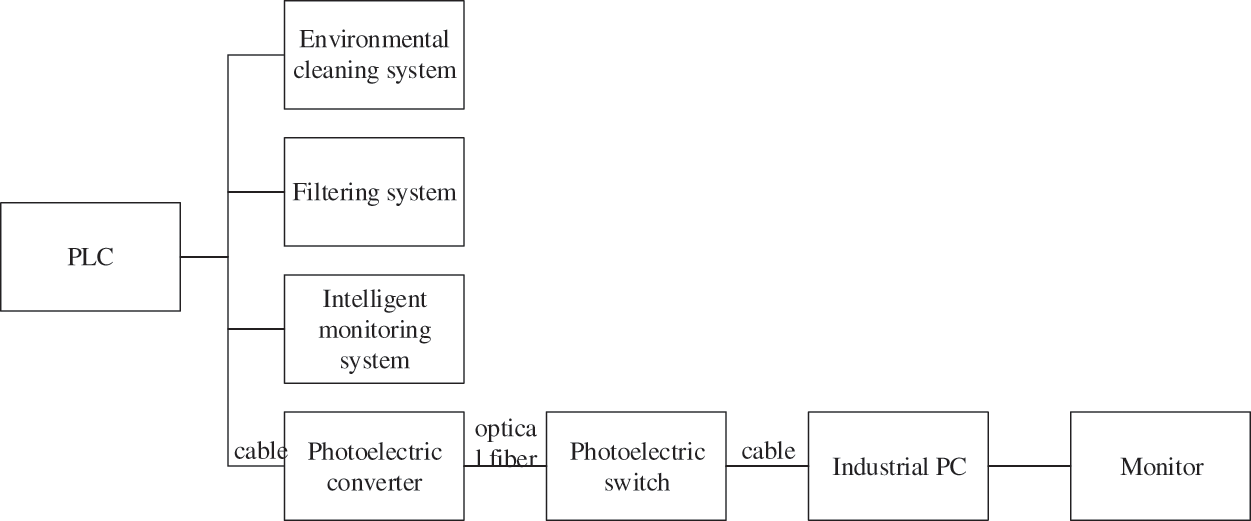
Figure 1: System wiring topology
3.1.1 Design Concept of FD70 Wind Turbine
The main concept to design the FD70 wind turbine is based on the successful experience of 600–750 kW wind turbine (mainly MW level). People focus on design innovation, while designers focus on the structure of the whole system and do more research on the system application.
The successful development of FD70 wind turbines has actually led to the adoption of new standards for second-generation megawatt plants. Regarding economy and reliability of system operation, it is a very typical wind turbine, and has long-term engineering technology and advanced component technology.
3.1.2 Introduction of the Rotor of FD70 Wind Turbine
The wind wheel can basically maintain a speed between 10.6–19 rpm, and can be replaced at any time during the operation of the wind turbine. In fact, it is also directly connected to the pitch control system, thus providing better energy output for the whole system and blade shape [15]. The blade shape is optimized in the development of wind turbine, and the final blade design fully conforms to aerodynamics and high-precision technology.
3.1.3 FD70 Fan Control Concept
In the working state of wind turbine, the blade pitch and the whole wind turbine speed regulating device can achieve the good joint working effect, and basically achieve the ideal balance state. If a part of a specific load system is also in a low wind speed state, driving the wind turbine can better maintain a more constant blade pitch and speed, which can be changed at any time [16]. Its main purpose is to maintain the best aerodynamic range of the wind turbine and achieve the best efficiency.
The wind turbine can obtain a higher wind speed when it works at rated power. At this time, the relevant speed control system and pitch control system can also maintain good efficiency. The low short-circuit power of the whole system makes the available grid capacitors work more stably. Fig. 2 shows the communication control information between the wind turbine variable frequency drive and the main controller.
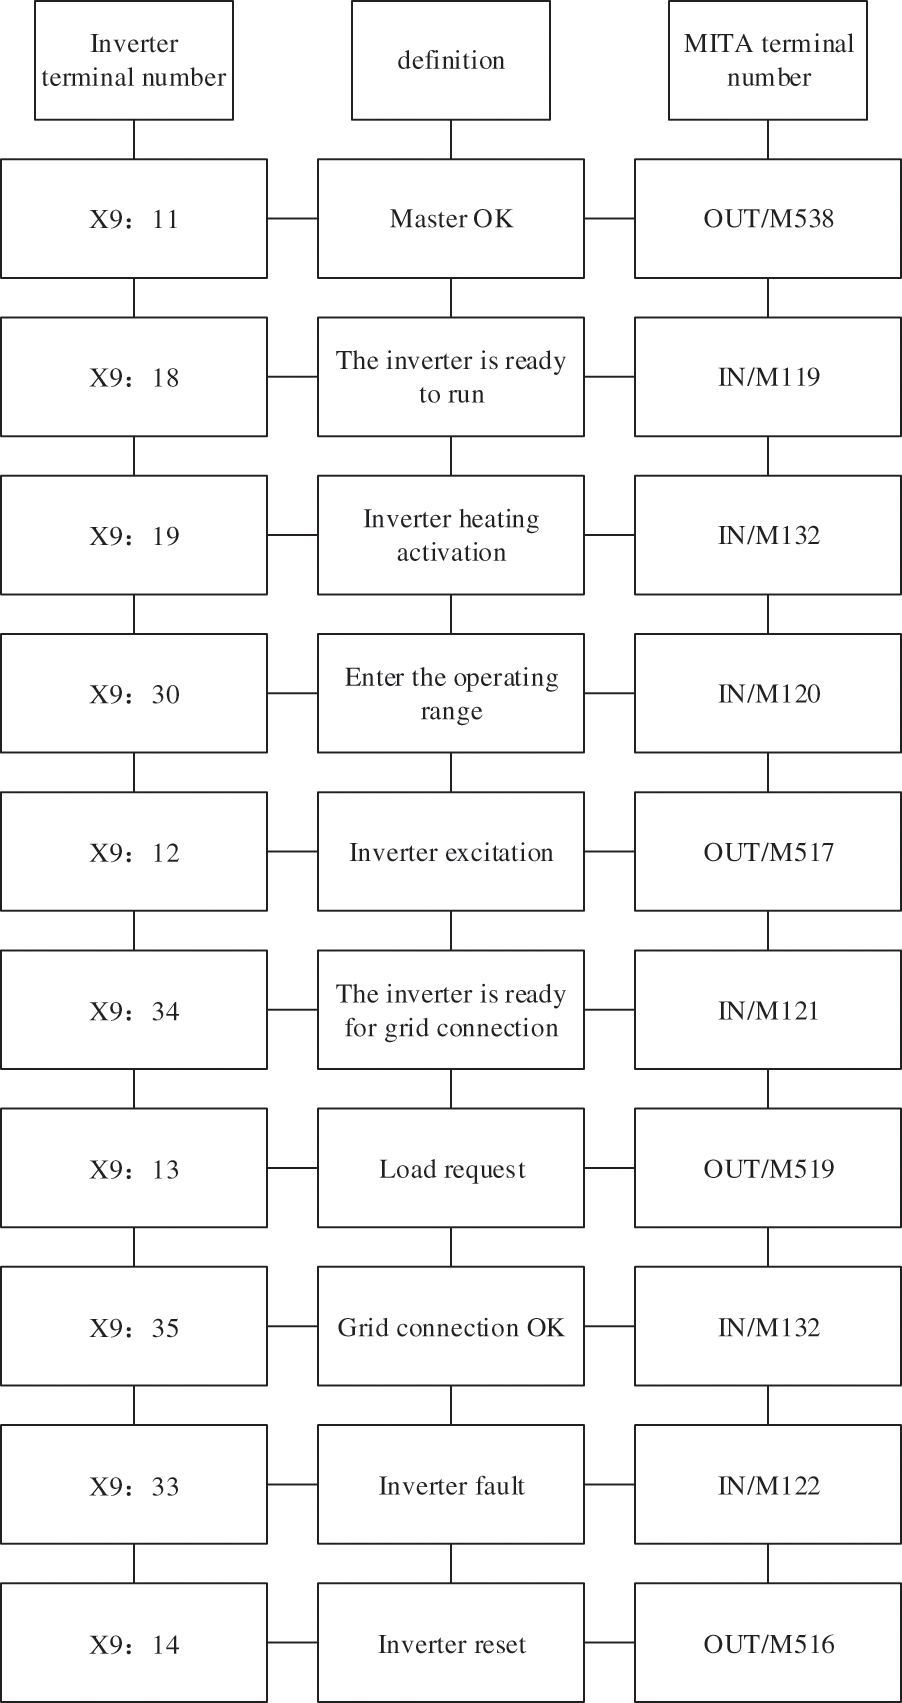
Figure 2: Communication control information between variable-frequency drive and main controller of wind turbine
In general, the blade of this system is a double-row-four-point contact combination. Especially, the roller bearing and the wind turbine can be adjusted independently when they are connected. Among them, the DC motor mainly drives the pinion after the planetary gear is replaced. The corresponding pinion can be taken as internal teeth to better mesh with the four-point contact bearing and drive the whole blade to rotate.
The variable pitch power supply may fail during operation. The whole system should keep a good pitch to keep a good pitch in this case [17–19]. Each wind turbine blade has a backup battery that rotates with the blade.
The pitching mechanism can well support the system in addition to more effective control of power output. The air inlet side of the blade will directly become air if the wind turbine is in the normal working state of braking operation. The pitch mechanism of each blade works independently. Fig. 3 shows the schematic block diagram.
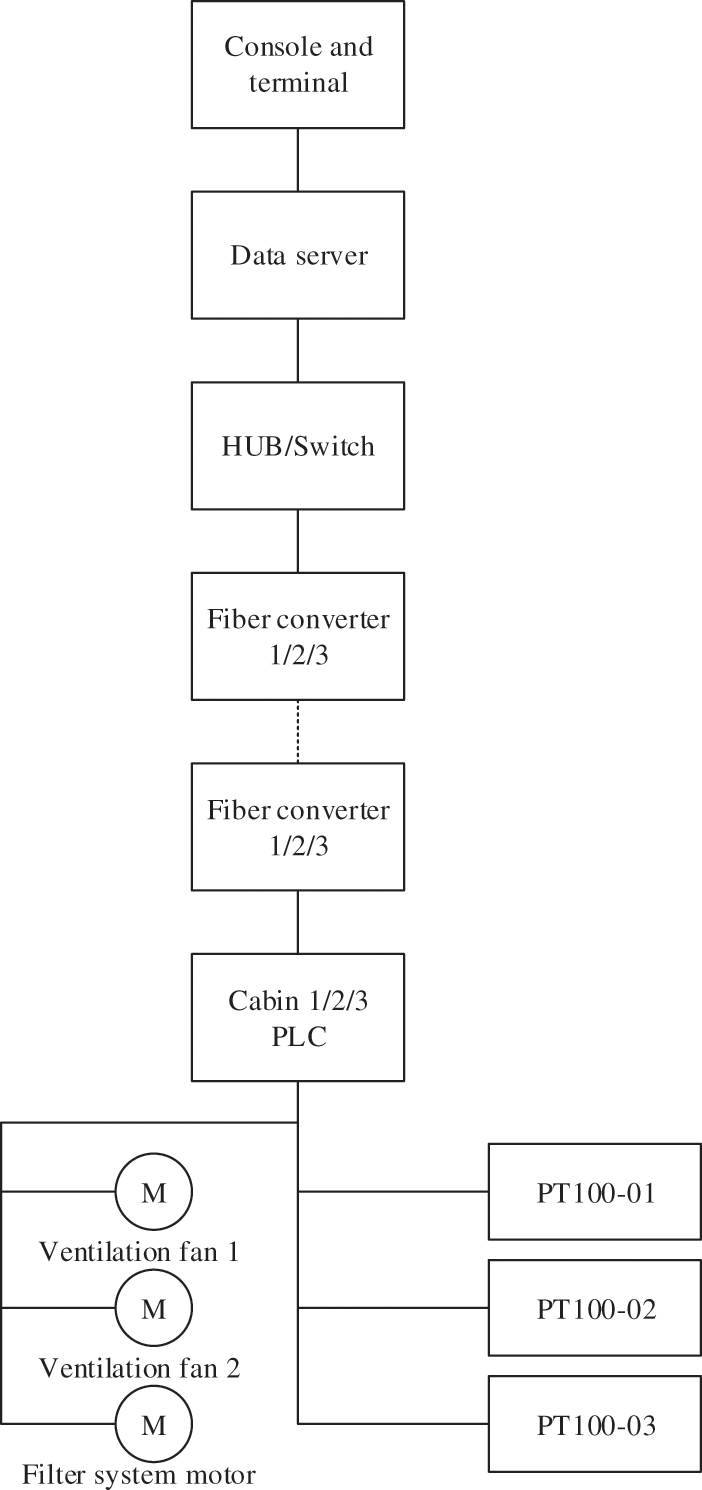
Figure 3: Schematic block diagram
3.1.4 Power Supply System of FD70 Wind Turbine
The main function of the wind power generation system is to obtain the best energy output and the first-class power supply quality, which is a crucial structure. In the commonly used doubly fed induction generator, the wind turbine can still work normally under the condition of continuously variable speed. Besides, it does not need a high-power inverter to transmit all the power [20]. In other words, it provides the most effective case for this mode of operation. A great advantage of the variable speed generator is that it can provide considerable power fluctuation filtering conditions for the system under partial load conditions. It can realize complete filtering under the rated power. In this case, the wind turbine will not produce too much noise when it continues to run, which can further reduce the dynamic load on the structure.
The inverter is also equipped with an electronic microprocessor developed with the latest IGBT technology. The power supply can fully meet the reactive power management adjustment, and truly provide high-quality “wind power” with low distortion and low harmonic content.
The low short circuit power of the whole system makes the available grid capacitors work more stably. Fig. 4 shows the communication control information between variable-frequency drive and main controller of wind turbine.
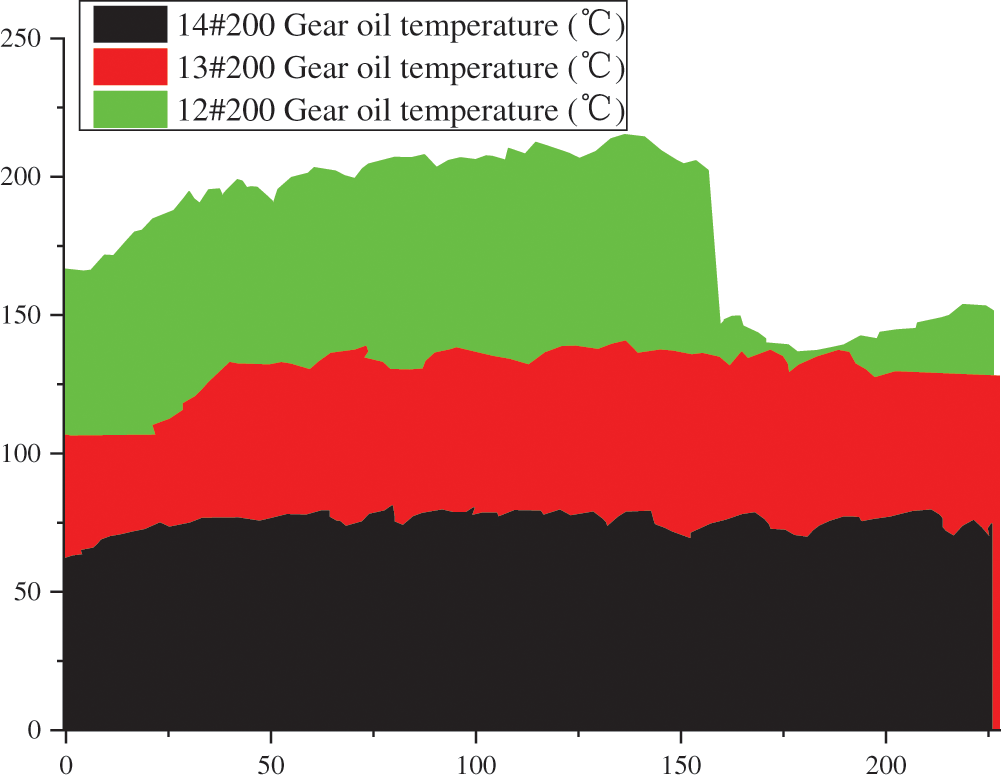
Figure 4: Temperature comparison curve of three groups of prototype gearboxes
3.2 Field Application Feedback of SCADA (Supervisory Control and Data Acquisition) System
3.2.1 Working Principle of SCADA System
The temperature information from the cabin is usually the corresponding analog signal. The signal needs to be simulated by modem and then converted into digital after it is sent out. Finally, two different output ports are sent to DCC50, which allows the structure of multi-machine and multi-network. Two groups of different signals are sent to the network switch 12#, 13#, 14#, and then sent to other master servers for data processing. The master server needs to send the signals to the corresponding network switches after processing them, and then send them to different workstations through optical fiber devices and network devices. These signals are monitored on the workstations. Various commands from the main control room will be sent to the server during the centralized control, and then to the cabin ventilation and filtration system for control [21,22].
Fast, reliable and stable data acquisition is the premise to ensure the good operation of the SCADA system. Different applications in different industries also have different data acquisition methods. Discrete manufacturing workshop itself has the characteristics of multi-variety, small batch and customized production, which brings great difficulties to field data acquisition [23]. In the traditional discrete manufacturing workshop, data acquisition is mainly manual input of production process information, and then the summary in the form of a W table. This traditional data acquisition method will affect the real-time, integrity and accuracy of the information, and reduce the value of information [24]. The data acquisition and processing of the SCADA system should be combined with sensor technology and field wiring technology in the discrete manufacturing digital workshop to realize the automatic acquisition of the whole process.
The main function of the SCADA system is to collect the information contained in each control point scattered in the field, and then transmit it to the central processing computer through the network. At this time, the operator can view all information in real-time and monitor all production processes or devices [25]. Hence, the main components of the SCADA system include the control center, communication facilities and field device.
A) Control center. It is a crucial part of the SCADA system and contains multiple different devices, such as the SCADA server (called maximum transmission unit, MTU), multiple communication routers and man-machine, all of which are connected to the same local area network [26].
B) Field device. SCADA system also includes multiple related field devices with different functions. Some of them are adopted to collect all kinds of field data, such as Remote Terminal Unit (RTU), power line communication (PLC), and some intelligent electronic devices.
C) Communication facilities. MTU is located in the control center and connected with various remote field devices through various communication facilities set in the system. There are multiple ways of communication, including telephone lines and special lines. Satellite communication or radio wave communication can be established according to needs. Fig. 5 displays the systematic block.
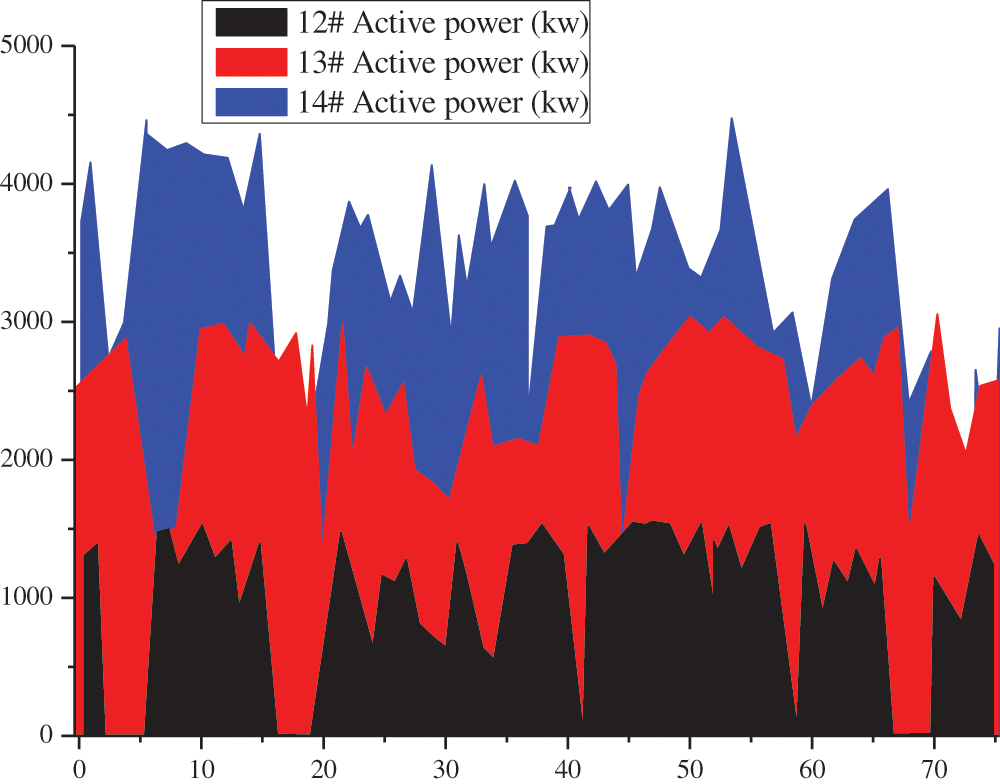
Figure 5: Comparison curve of output active power of three groups of prototypes
4 Feedback Data Analysis of Prototype Test
4.1 Comparative Analysis on the Temperature of Prototype Gearbox
The prototype is installed in the transmission of the intelligent control system in the cabin environment through the temperature sensor. The SCADA system prototype has no system connection. It is connected to the SCADA system for 30 days of test data collection to generate the SCADA generation curve, as shown in Fig. 5.
Fig. 5 displays the temperature curves of the three groups of prototype gearboxes. The intelligent environmental monitoring system is equipped with 13 fans in the windy and hot weather, and the gearbox oil temperature is significantly lower than the adjacent 12°C system. Moreover, the temperature can be kept in a stable range, and the system can fully reduce the working temperature in the cabin.
4.2 Comparative Analysis of Output Active Power of Prototype
In addition to testing the feasibility of cabin temperature intelligent control in the cabin environment system, the impact on wind turbines can be also determined by comparing the output of three prototypes. Present computer simulation algorithms for calculating the active power of wind turbines mainly include the extreme value method, marginal value method and maximum likelihood method. The comparison of output power curves of three different models shows that the most possible method is more effective. Hence, the measured power curve model is obtained by the nearest probability method and applied to the comparative analysis of the active power of the prototype.
The 13# function prototype with cabin environment intelligent control system is connected with the 12#-14# function prototype without cabin environment intelligent control system. The test data of 30 days are collected to get the SCADA generation curve.
Fan 13# is equipped with an intelligent monitoring system in the cabin compared with the prototype curve. When the fan power level is in strong wind and high temperature, the fan power will drop or even stop every few hours if it does not reach the standard, thus increasing the unavailable time and generating loss. Hence, the intelligent control system in the indoor environment greatly improves the operation efficiency and power generation efficiency of the fan, and brings more economic benefits.
The cabin environment intelligent control system of three groups of fan prototypes is tested, the FD70 fan used in the test prototype is introduced, and the working principle of the SCADA system used in the test is described. The comparative analysis of the output active power and the gearbox temperature in the cabin of the three groups of prototypes suggests that the output of the 13# fan has been in a high-level power generation state in the environment with strong wind and high temperature, and the gearbox temperature is lower; if the output of the neighboring 12# and 14# fans without the system is not up to the standard, the output will be reduced every few hours, and the gearbox temperature will be higher or even shut down. It reveals that the cabin environment intelligent control system has played a significant role in improving the operation and power generation efficiency of the fan, thus bringing more economic benefits.
This research is about the intelligent control system for wind turbine cabin environment. The research purpose is to solve the adverse impact of the fan on the wind turbine due to the environment and the high temperature in the cabin. The main research work is as follows. The internal ventilation structure of cabin is analyzed by using CFD, and the application of CFD results in intelligent algorithm and the equation of controlling fluid motion are introduced completely. The gearbox, one of the main heat sources in the cabin, is analyzed, and the common heating causes in the gearbox are summarized. A simple model is established by comparing the total heat generated by the gearbox in the working process and the heat dissipation capacity of different heat dissipation components. Gear bite heat, bearing heat, heat generated by lubricating oil and heat generated by gearbox are described in detail, which can put forward corresponding improvement suggestions for lubrication and cooling system of gearbox working process. The cabin environment intelligent control system of three groups of fan prototypes is tested, and the FD70 fan used in the test prototype is introduced. The working principle of SCADA system used in the test is described. By collecting and comparing the temperature data of the gearbox in the cabin of the three groups of prototypes, and combining three maximum methods, method of bins and maximum probability method, the output useful power curves of the three groups of prototypes are compared, and the economic benefits brought by the cabin environment intelligent control system are further analyzed.
The intelligent control system in the wind turbine room environment has been initially established, and the hot spots and causes of high temperature in the room have been mastered. The operating environment of the wind turbine is diverse and complex in practical application, and the causes of temperature rise are also diverse. In the research of control systems, only the common causes and unit models of typical temperature rise are analyzed. Hence, the data acquisition of the sensor should be further improved in the follow-up research, and the vibration sensor can be installed in the cabin heat source. In this way, it can obtain more internal information of the cabin, and provide a more accurate control scheme for the environmental intelligent control system of the wind turbine room. At present, there are still many difficulties in improving the environment and temperature of the wind turbine room, and the analysis needs to be further improved. It is essential to constantly learn from advanced methods and combine them with engineering practice to better promote the development of new energy and emerging power industry. Therefore, the sensor data collection should be further improved in the follow-up research, and vibration sensors can be installed in the heat source of cabin, so as to obtain more internal information of the cabin, which can provide a precise control scheme for the cabin environment intelligent control system of the wind turbine.
Funding Statement: The authors received no specific funding for this study.
Conflicts of Interest: The authors declare that they have no conflicts of interest to report regarding the present study.
1. Hamza, A., Ben Yahia, N. (2021). Heavy trucks with intelligent control of active suspension based on artificial neural networks. Proceedings of the Institution of Mechanical Engineers, Part I: Journal of Systems and Control Engineering, 235(6), 952–969. DOI 10.1177/0959651820958516. [Google Scholar] [CrossRef]
2. Bataglin, F. S., Viana, D. D., Formoso, C. T., Bulhões, I. R. (2020). Design to order prefabricated building system delivery and assembly planning and control model: Exploration of lean and BIM synergistic effect. Canadian Journal of Civil Engineering, 47(2), 165–177. DOI 10.1139/cjce-2018-0462. [Google Scholar] [CrossRef]
3. Martinez, P., Al-Hussein, M., Ahmad, R. (2020). Intelligent vision-based online inspection system of screw-fastening operations in light-gauge steel frame manufacturing. The International Journal of Advanced Manufacturing Technology, 109(3), 645–657. DOI 10.1007/s00170-020-05695-y. [Google Scholar] [CrossRef]
4. Phuyal, S., Bista, D., Bista, R. (2020). Challenges, opportunities and future directions of smart manufacturing: A state of art review. Sustainable Futures, 2, 100023. DOI 10.1016/j.sftr.2020.100023. [Google Scholar] [CrossRef]
5. Dadvand, A., Bagheri, M., Samkhaniani, N., Marschall, H., Wörner, M. (2021). Advective phase field method for bounded solutions of Karn-Hiliadnavier-Stokes equation. Fluid Physics, 33(5), 053311. DOI 10.1063/5.0048614. [Google Scholar] [CrossRef]
6. Zeng, T. H., Sun, Z. Z., Shao, B. (2020). Statistical and strict momentum conservation. International Journal of Theoretical Physics, 59(1), 229–235. DOI 10.1007/s10773-019-04315-0. [Google Scholar] [CrossRef]
7. Kim, J. M. (2020). The energy conservations and lower bounds for possible singular solutions to the 3D incompressible mhd equations. Acta Mathematica Scientia, 40(1), 237–244. DOI 10.1007/s10473-020-0116-x. [Google Scholar] [CrossRef]
8. Villa, A., Barbieri, L., Malgesini, R., Buccella, G. (2021). Discretization of poisson’s equation in two domains with non algebraic interface conditions for plasma simulations. Applied Mathematics and Computation, 403(4), 126179. DOI 10.1016/j.amc.2021.126179. [Google Scholar] [CrossRef]
9. Biasi, B. (2021). The labor market for teachers under different pay schemes. American Economic Journal: Economic Policy, 13(3), 63–102. DOI 10.1257/pol.20200295. [Google Scholar] [CrossRef]
10. Amin, R., Shah, K., Asif, M., Khan, I. (2021). A computational algorithm for the numerical solution of fractional order delay differential equations. Applied Mathematics and Computation, 402, 125863. DOI 10.1016/j.amc.2020.125863. [Google Scholar] [CrossRef]
11. Odibat, Z., Baleanu, D. (2020). Numerical simulation of initial value problems with generalized Caputo-type fractional derivatives. Applied Numerical Mathematics, 156, 94–105. DOI 10.1016/11.apnum.2020.04.015. [Google Scholar] [CrossRef]
12. Novák, P., Vyskočil, J., Wally, B. (2020). The digital twin as a core component for industry 4.0 smart production planning. IFAC-PapersOnLine, 53(2), 10803–10809. DOI 10.1016/j.ifacol.2020.12.2865. [Google Scholar] [CrossRef]
13. Ziar, H., Manganiello, P., Isabella, O., Zeman, M. (2021). Photovoltatronics: Intelligent PV-based devices for energy and information applications. Energy & Environmental Science, 14(1), 106–126. DOI 10.1039/D0EE02491K. [Google Scholar] [CrossRef]
14. Walton, N., Nayak, B. S. (2021). Rethinking of marxist perspectives on big data, artificial intelligence (AI) and capitalist economic development. Technological Forecasting and Social Change, 166, 120576. DOI 10.1016/j.techfore.2021.120576. [Google Scholar] [CrossRef]
15. Hangli, G., Hamada, T., Sumitomo, T., Koshizuka, N. (2020). Intellevator: An intelligent elevator system proactive in traffic control for time-efficiency improvement. IEEE Access, 8, 35535–35545. DOI 10.1109/Access.6287639. [Google Scholar] [CrossRef]
16. Kuru, K., Khan, W. (2020). A framework for the synergistic integration of fully autonomous ground vehicles with smart city. IEEE Access, 9, 923–948. DOI 10.1109/Access.6287639. [Google Scholar] [CrossRef]
17. Lam, B., Gan, W. S., Shi, D., Nishimura, M., Elliott, S. (2021). Ten questions concerning active noise control in the built environment. Building and Environment, 200, 107928. DOI 10.1016/j.buildenv.2021.107928. [Google Scholar] [CrossRef]
18. Vodyaho, A., Osipov, V., Zhukova, N., Chernokulsky, V. (2020). Data collection technology for ambient intelligence systems in Internet of Things. Electronics, 9(11), 1846. DOI 10.3390/electronics9111846. [Google Scholar] [CrossRef]
19. Gautam, M. K., Pati, A., Mishra, S. K., Appasani, B., Kabalci, E. et al. (2021). A comprehensive review of the evolution of networked control system technology and its future potentials. Sustainability, 13(5), 2962. DOI 10.3390/su13052962. [Google Scholar] [CrossRef]
20. Hemmati, S., Doshi, N., Hanover, D., Morgan, C., Shahbakhti, M. (2021). Integrated cabin heating and powertrain thermal energy management for a connected hybrid electric vehicle. Applied Energy, 283, 116353. DOI 10.1016/j.apenergy.2020.116353. [Google Scholar] [CrossRef]
21. Cheng, X., Jiang, Y., Li, M., Zhang, S. (2020). Influence of the axial position of the guide vane on the fluctuations of pressure in a nuclear pump. Fluid Dynamics & Materials Processing, 16(5), 1047–1061. DOI 10.1007/s40430-019-1854-0. [Google Scholar] [CrossRef]
22. Suwoyo, H., Tian, Y., Wang, W., Li, L., Adriansyah, A. et al. (2021). Maximum likelihood estimation-assisted ASVSF through state covariance-based 2D SLAM algorithm. Telkomnika, 19(1), 327–338. DOI 10.12928/telkomnika.v19i1.16223. [Google Scholar] [CrossRef]
23. Violidakis, Ι., Zeneli, M., Atsonios, K., Strotos, G., Nikolopoulos, N. et al. (2020). Dynamic modelling of an ultra high temperature PCM with combined heat and electricity production for application at residential buildings. Energy and Buildings, 222, 110067. DOI 10.1016/j.enbuild.2020.110067. [Google Scholar] [CrossRef]
24. Löhner, R., Antil, H., Idelsohn, S., Oñate, E. (2020). Detailed simulation of viral propagation in the built environment. Computational Mechanics, 66(5), 1093–1107. DOI 10.1007/s00466-020-01881-7. [Google Scholar] [CrossRef]
25. Ali, D., Frimpong, S. (2021). Deepimpact: A deep learning model for whole body vibration control using impact force monitoring. Neural Computing and Applications, 33(8), 3521–3544. DOI 10.1007/s00521-020-05218-6. [Google Scholar] [CrossRef]
26. Mboreha, C. A., Sun, J. H., Wan, Y., Sun, Z., Zhang, Y. T. (2021). Investigation of thermal comfort on innovative personalized ventilation systems for aircraft cabins: A numerical study with computational fluid dynamics. Thermal Science and Engineering Progress, 26, 101081. DOI 10.1016/j.tsep.2021.101081. [Google Scholar] [CrossRef]
 | This work is licensed under a Creative Commons Attribution 4.0 International License, which permits unrestricted use, distribution, and reproduction in any medium, provided the original work is properly cited. |