

 | Fluid Dynamics & Materials Processing |  |
DOI: 10.32604/fdmp.2022.017594
ARTICLE
Optimal Scheduling of Electrical Energy Systems Using a Fluid Dynamic Analogy
Xi’an Traffic Engineering Institute, Xi’an, 710300, China
*Corresponding Author: Juanjuan Wang. Email: wang1228109631@163.com
Received: 22 May 2021; Accepted: 30 July 2021
Abstract: The electricity-gas transformation problem and related intrinsic mechanisms are considered. First, existing schemes for the optimization of electricity-gas integrated energy systems are analyzed through consideration of the relevant literature, and an Electricity Hub (EH) for electricity-gas coupling is proposed. Then, the distribution mechanism in the circuit of the considered electricity-gas integrated system is analyzed. Afterward, a mathematical model for the natural gas pipeline is elaborated according to the power relationship, a node power flow calculation method, and security requirements. Next, the coupling relationship between them is implemented, and dedicated simulations are carried out. Through experimental data, it is found that after 79 data iterations, the optimization results of power generation and gas purchase cost in the new system converge to $54,936 in total, which is consistent with the data obtained by an existing centralized optimization scheme. However, the new proposed optimization scheme is found to be more flexible and convenient.
Keywords: Spatial coupling; integrated energy; natural gas; system optimal scheduling
In today’s era, the rapid development of science and technology has improved the overall social productivity level substantially. Various industries, such as information and communication, Artificial Intelligence (AI), aerospace, and medical technology, have made continuous breakthroughs in their respective fields [1]. People’s living standards have also been raised with mankind’s continuous exploration and pursuit of truth [2]. However, advanced science and technologies, when used unproperly, might easily turn into a catastrophic force to not merely transform but destroy the world. Mankind’s exploitation of earth resources is climbing out of their self-interests, and overexploitation has led to the depletion of numerous non-renewable resources [3,4]. The biggest constraint on human development is no longer science and technology itself [5], but how to make more scientific utilization of resources to maintain a harmonious relationship with the natural environment under sustainable development.
People have tasted some bad fruits out of the long-term excessive exploitation and utilization of the earth’s resources. Nowadays, the global climate is changing more dramatically and unpredictably. Countries worldwide begin to carry out energy reform, hoping to alleviate the trend of environmental deterioration by exploring new energy and using clean energy [6,7]. In this context, almost all countries have focused on the exploitation and utilization of renewable energy. Wind energy, solar energy, nuclear energy, and other new energy have come into people’s sight, among which, natural gas is believed to be the only clean fossil energy and is constantly replacing the original oil and coal. It has become the second-largest fuel source in the world [8].
Under this background, an integrated electricity-gas energy scheduling optimization system is proposed based on spatial coupling by analyzing the shortcomings of traditional electrical energy scheduling. The mutual transformation and the complementarity of multi-energy forms can be realized through comprehensive energy scheduling and utilization in a region. A coupling mechanism is constructed based on Energy Hub (EH) by modeling the energy flow in an integrated electricity-gas energy network. Additionally, a multi-agent collaborative optimal scheduling model is proposed according to the distribution characteristics of natural gas energy to optimize the existing centralized interconnected integrated energy system. There are two research innovations:
1. A integrated electricity-gas energy scheduling optimization system based on spatial coupling is proposed through spatial coupling EH. 2. The mathematical models of distribution network and natural gas pipeline are implemented respectively according to the energy conservation principle and fluid mechanics. The optimization effect is quantitatively analyzed by mathematical means.
2 Optimal Scheduling of Integrated Energy System Based on Coupling Relationship and Mathematical Modeling
The urgency for ecological environment protection is forcing all countries to start exploring renewable and clean energy to provide for industrial production and reduce the exploitation and use of nonrenewable energy for the sustainable development of human civilization [9,10]. The surging demand for energy in industrial production and people’s life far exceed the current new energy production. Therefore, the more rational use of new energy has become a new heated discussion all around the world. In particular, natural gas, as the world’s only fossil clean energy, with its rich reserves, is getting the attention of many governments and scholars [11], so the research of coupling the relationship between natural gas and electricity is of great significance [12]. By studying the shortcomings of traditional energy scheduling and electricity-gas energy scheduling mechanism, an integrated electricity-gas energy optimization system is established based on EH, and the system is tested through circuit principle and hydrodynamics analysis.
2.1 Overview of Fluid Dynamics
Fluid dynamics is a rigorous scientific discipline, which can be used to solve fluid motion equations by establishing the concepts of force, acceleration, and flow field in fluid mechanics analysis based on classical mechanics [13]. In a broad sense, fluid mechanics studies any flowing objects, including gas and liquid, as well as natural gas in the integrated electricity-gas energy scheduling optimization system. Fluid mechanics and fluid dynamics can be analyzed using the Lagrange method and the Euler method. Computational Fluid Dynamics (CFD) mainly discretizes the computational domain of the fluid dynamics equation to solve the fluid control equation. Digital (Computer) simulation is getting increasingly advantageous with the development of computer technologies, showing low cost and by simulating more complex or ideal working conditions, thus seeing wider application in various fields, especially, in engineering design. CFD is almost omnipresent in problem-solving involving fluid, heat, and molecular transport. The analysis and mathematical modeling of the motion state of natural gas in the pipeline are based on fluid mechanics to vectorize the flow state of natural gas.
2.2 Existing Research and Problem Analysis of Traditional Centralized Scheduling Optimization Methods
Electricity-gas energy scheduling is a rich research topic, involving many related studies. Tang et al. [14] discovered that energy transmission in cooling/heating and gas pipelines had a time delay, which will affect the power balance between various energy and loads in the optimal dispatching of the microgrid in integrated energy campuses. Consequently, an optimal scheduling model was proposed, concerning the time delay of energy transmission in cooling/heating and gas pipelines. The model took the power and natural gas procurement cost of the integrated energy campus microgrid as the objective function and used the Partial Differential Equation (PDE) to describe the time delay in the pipeline and the discrete variables of the switching times of the absorption refrigerator and the heat exchange unit. Cheng et al. [15] proposed a model for building typical substation systems. Based on this model, the solution framework of predictive control effectively solved the joint scheduling problem of random renewable energy and battery energy storage in substations. The economic operation of the substation was realized through the optimal operation model of the substation. Wu et al. [16] constructed a multi-region integrated power scheduling system for natural gas systems, considering reserve optimization. The standby scheduling was integrated into the multi-area optimal scheduling model to reduce the risk caused by hedging the uncertainty of power and gas systems.
In these studies, it is more or less pointed out that the planning of traditional power grid systems, natural gas networks, thermal networks, and transportation network is very rigid and has great defects in system operation and information transmission and processing; meanwhile, these traditional systems are inefficient and lack sound interaction functions. Hence, the overall scheduling and utilization of integrated energy are difficult to reach a high level, because these power grids are scheduled disorderly, and the management systems of different market entities are mixed for different energy sources. However, the management channels among various types of energy are relatively independent and have not been clearly planned and integrated, lacking interactions and relevancy. Under such situations, a multi-regional integrated energy system has to depend on multiple interconnected and autonomous EH to realized integrated energy scheduling. Moreover, the complexity and diversity of multi-energy scheduling decision-making bring greater difficulties to the energy transmission and integration of multiple decision-makers and even affect the centralized energy allocation and scheduling of the whole integrated energy system. To sum up, the proposed integrated energy scheduling system can avoid the following defects of a centralized optimization method: 1. Large amounts of data collection and low efficiency of information processing; 2. The complex model increasing the difficulty of multi-energy coupling and transformation; 3. The chaotic management unmatching the actual operation mode.
2.3 Modeling of an Integrated Electricity-Gas Energy System Based on EH
EH is a crucial part of the multi-energy system. It can accommodate various energy coupling relationships and realize the mutual transformation between various energy. Fig. 1 displays a simple schematic diagram of the application of EH in the integrated electricity-gas system.
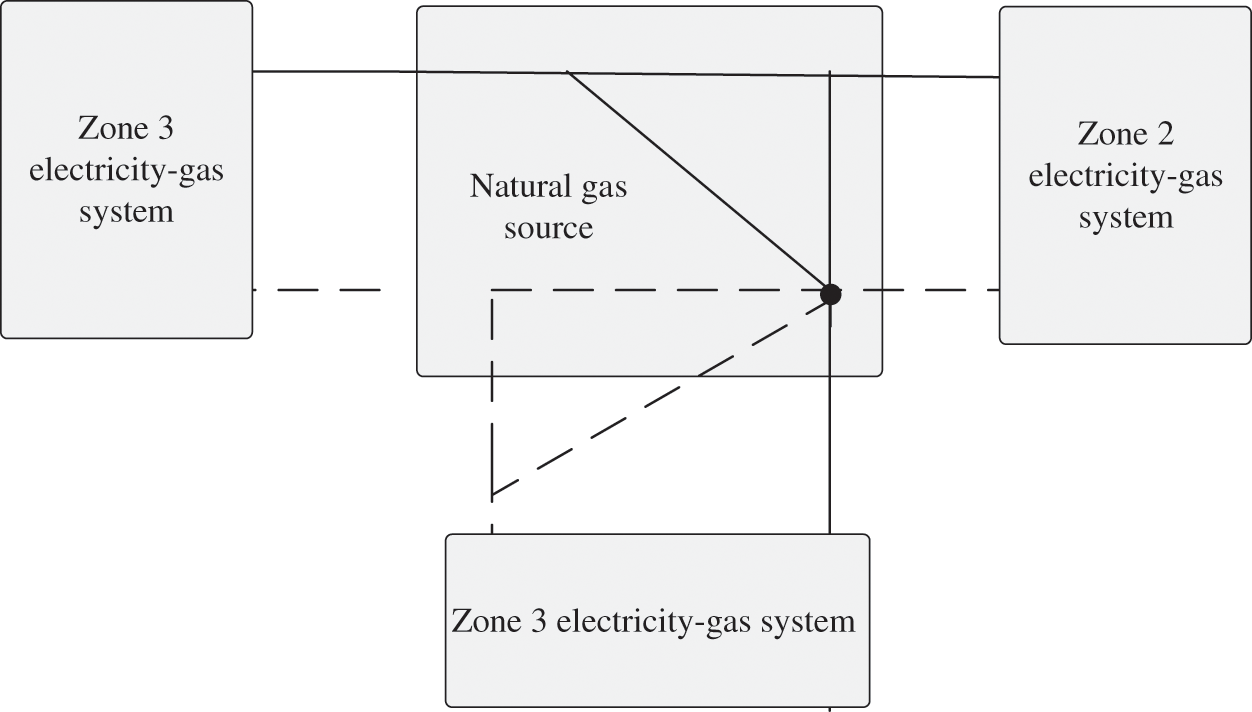
Figure 1: The application of EH in the electrical system
In Fig. 1, the dotted line denotes the trend of natural gas and the solid line represents the trend of power. The nodes of the solid line and dotted line represent the coupling points where power and natural gas are converted to each other [17]. EH plays a key role in energy conversion. Zone 1, Zone 2, and Zone 3 stand for the electric energy areas of power flow during energy conversion.
2.4 Modeling of the Multi-Area Electricity-Gas Interconnected Energy System
The distribution network of the region should be analyzed and studied to optimize the integrated electricity-gas energy scheduling system in a certain region. The coupling relationship in the integrated electricity-gas energy scheduling system is very complex. It includes electricity-gas coupling, electrothermal coupling, and electromagnetic coupling [18]. Moreover, the distribution network is very complex, and it is difficult to allocate and optimize the distribution system reasonably with the natural gas distribution system. Therefore, this paper only discusses the EH models with gas units and electric gas transfer equipment. Fig. 2 displays the structure of a multi-area electricity-gas coupling system based on EH.
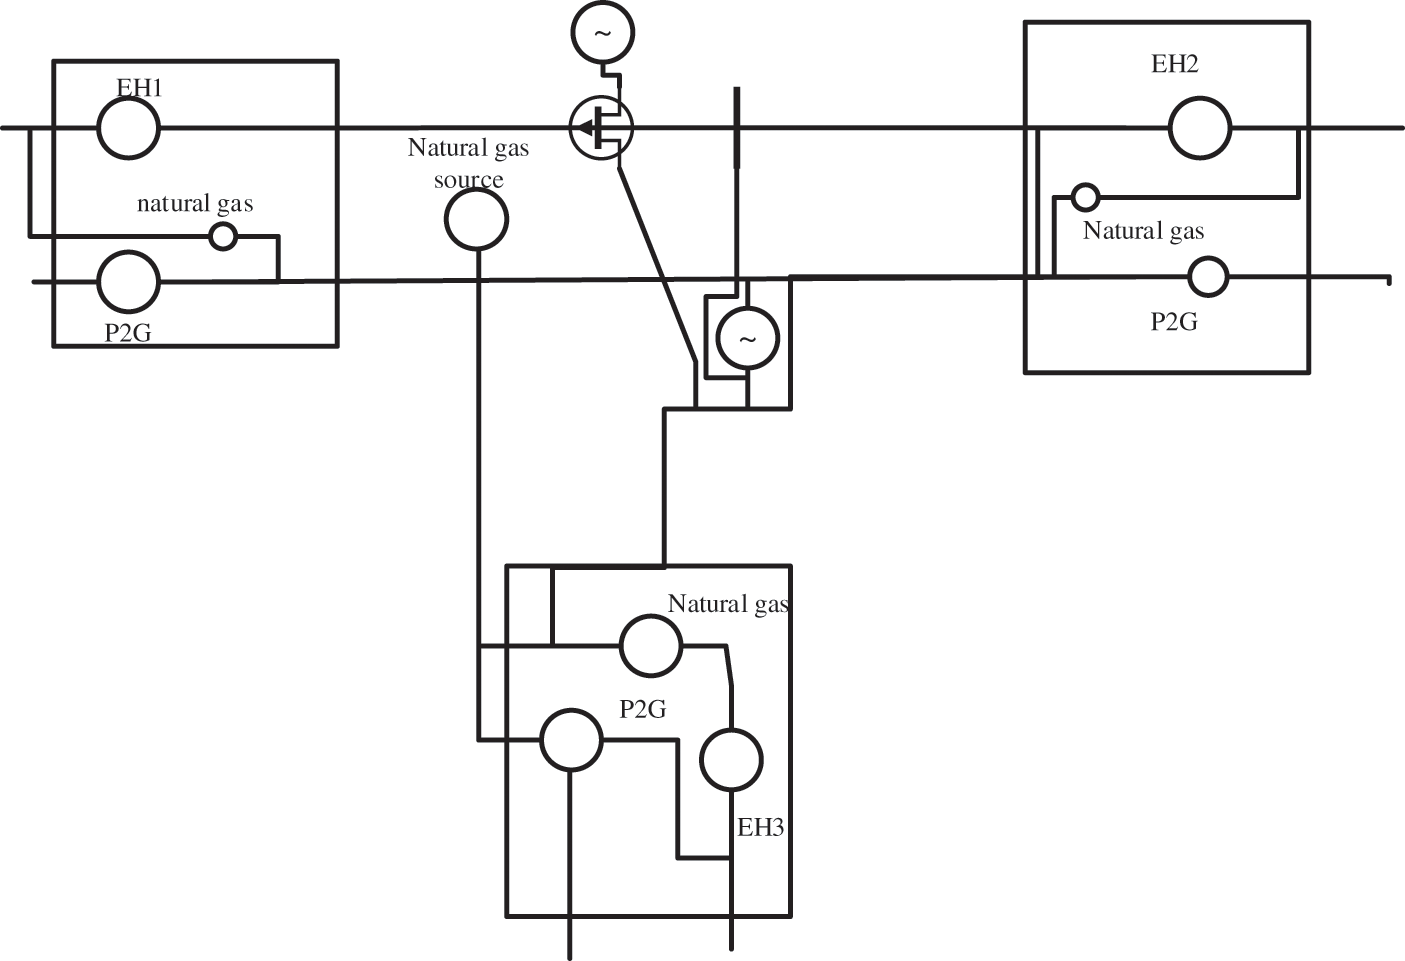
Figure 2: Multi-area electrical coupling system based on EH
As shown in Fig. 2, the multi-area electricity-gas coupling system based on the EH schedule the electricity-gas transform based on the air pressure of natural gas, namely, the natural gas abundancy. When the natural gas supply in a certain area has been sufficient, to reduce environmental pollution and waste of energy, it is necessary to avoid the conversion of electric energy to natural gas as far as possible. In case of insufficient natural gas supply, the system will receive corresponding information and schedule the conversion of electric energy to natural gas or schedule from areas with sufficient natural gas to meet the usage demand of natural gas according to actual needs.
The mathematical model is as follows:
ue−e,i refers to the electricity distribution coefficient of the i-th EH in the circuit; ue−g,i refers to the distribution coefficient when electricity is converted into gas; vg−e,i refers to the distribution coefficient of the i-th EH when the natural gas is converted into electricity; vg−g,i denotes the natural gas distribution coefficient of the i-th EH; Δg−e,i is the unit conversion coefficient when electricity is converted into gas; Δe−g,i is the unit conversion coefficient when natural gas is converted into electricity; ηg−e,i represents the gas generation efficiency of the i-th EH; ue−g,i is the efficiency of converting electricity into gas in the i-th EH;
Eqs. (1)–(4) describe the input-output energy conversion mode of the EH (1) The distribution coefficient must meet the constraint form (2), and the conversion capacity constraint of the power flow type (3) and the natural gas flow (4), respectively.
The distribution network needs to be modeled to optimize the integrated electricity-gas energy system based on spatial coupling.
First, the power output constraints of the unit are modeled.
The equation reads:
ΩENG,i is the set of generator units at the input end of the i-th EH; Pm is the active output of the m-th generator unit in the EH;
The first part of distribution network modeling is node power flow calculation, which is modeled according to the power conservation equation [20]. The modeling equation reads:
ΩEB,i represents the collection of power nodes adjacent to node i in the EH; Pf,ij indicates the active power of the circuit transmitted from node i to node j in the EH.
Safety should also be considered in circuit simulation. Hence, the power flow modeling of the distribution network is carried out based on the security problem [21].
θ represents the voltage phase angle; x denotes the reactance parameter; P represents the transmission power limit. i and j are two power nodes, respectively.
The mathematical modeling of the natural gas transmission pipeline is implemented after the mathematical modeling of the distribution network. The motion state of natural gas is analyzed according to fluid mechanics and transformed into vectors for more accurate testing and quantification [22]. The mathematical transformation of natural gas’s network model is performed based on the constraints of natural gas supply, gas pipeline, and gas balance. The equations read:
ΩEHS,i is the collection of air sources at the input end of the i–th EH;
The output end after coupling needs to be modeled after the modeling of the distribution network and natural gas distribution pipeline is completed, respectively, and the EH is responsible for scheduling and distributing the converted natural gas and electricity resources, respectively [24]. Thereupon, three models are implemented according to the constraints of regional power system, regional natural gas system, and electricity-gas coupling.
Eqs. (12)–(14) are the mathematical models of the output power system operation constraints after the regional electricity-gas energy coupling [25], where CU is the conventional unit, and NG signifies the gas unit; Cb represents the power node set; ELx denotes the power load; Tp stands for the power transmission distribution coefficient matrix of the integrated electricity-gas energy system [26]; PCB means the node active power input column vector of the electrical integrated energy system;
Eqs. (15)–(20) are the mathematical models of the operation constraints of the output natural gas system after the regional energy coupling [27]. Cs represents the gas source set; CN is the node set of natural gas network; g denotes the load gas consumption of natural gas; fH is the flow through the pipeline h;
Eq. (21) refers to the mathematical model of electricity-gas coupling constraints, where g1 and NG refer to the natural gas consumption of gas generating units, and am, bm and cm denote the consumption coefficient of gas generating units.
2.5 Optimal Scheduling Model and Algorithm
According to the energy coupling, a mathematical model centered on the EH is implemented.
In (22), ρE,m is the fuel price coefficient of generator set m; ρG,n represents the price coefficient of gas source n; in
After the completion of mathematical modeling, to test the optimization effect, the centralized optimization method (derived from the “13th five-year plan for energy development” document of the National Development and Reform Commission and the National Energy Administration) and Alternating Direction Method of Multipliers (ADMM) optimization method are adopted to set the control group [30]. Fig. 3 shows the algorithm flow.
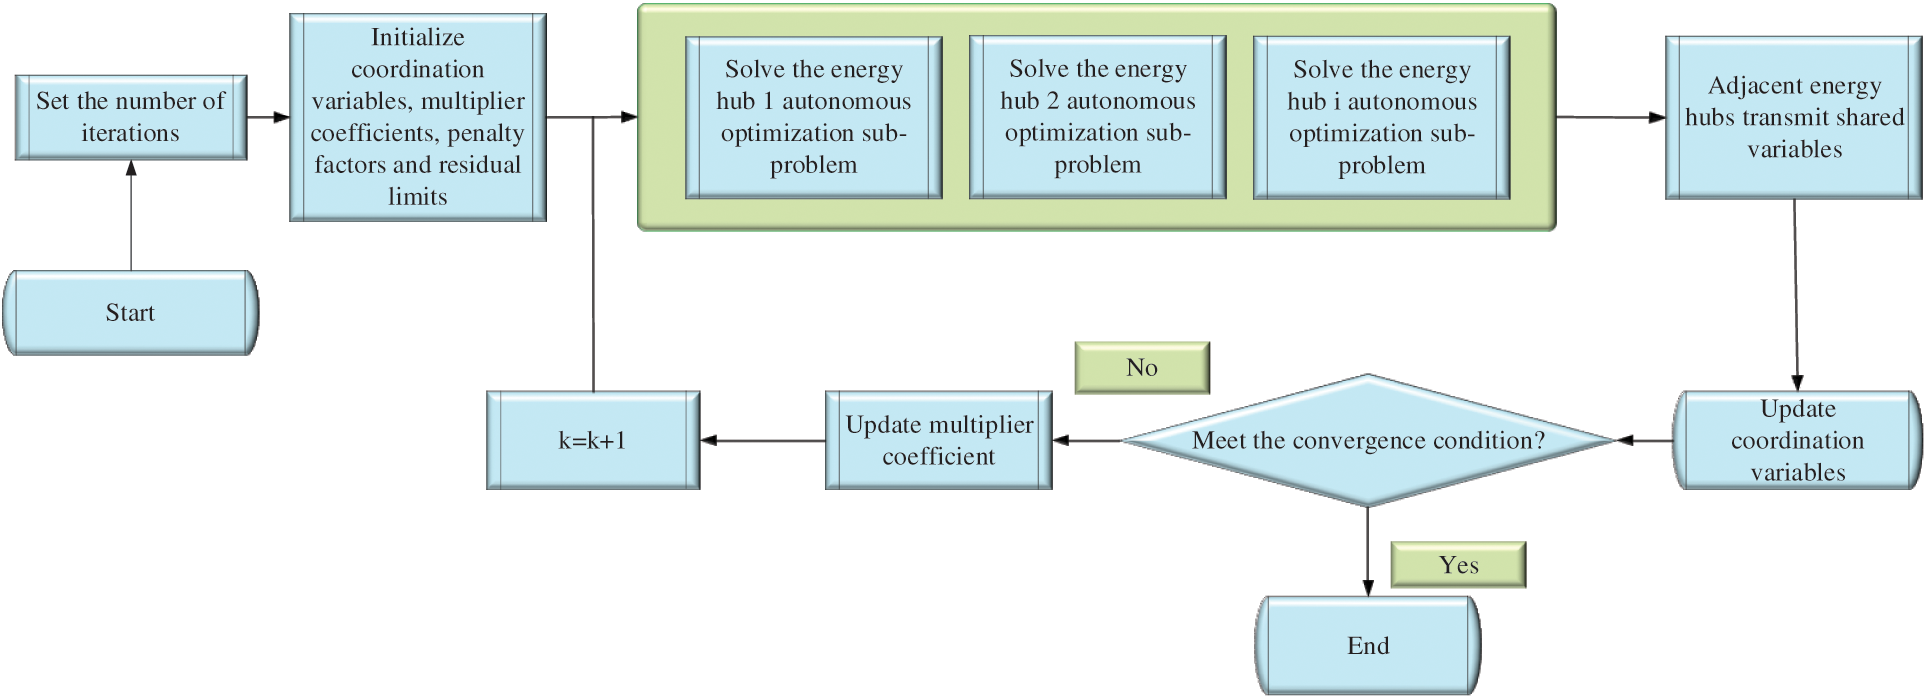
Figure 3: Flow chart of optimal scheduling model
This experiment is based on the computer windows system, the MATLAB platform is employed for coding, and the IPOPT solver is adopted to help solve the problems in the optimization of EH [31]. Two simple and complex multi-area electricity-gas energy systems of coupled EHs are selected for simulation analysis. Fig. 4 is the experimental simulation system.
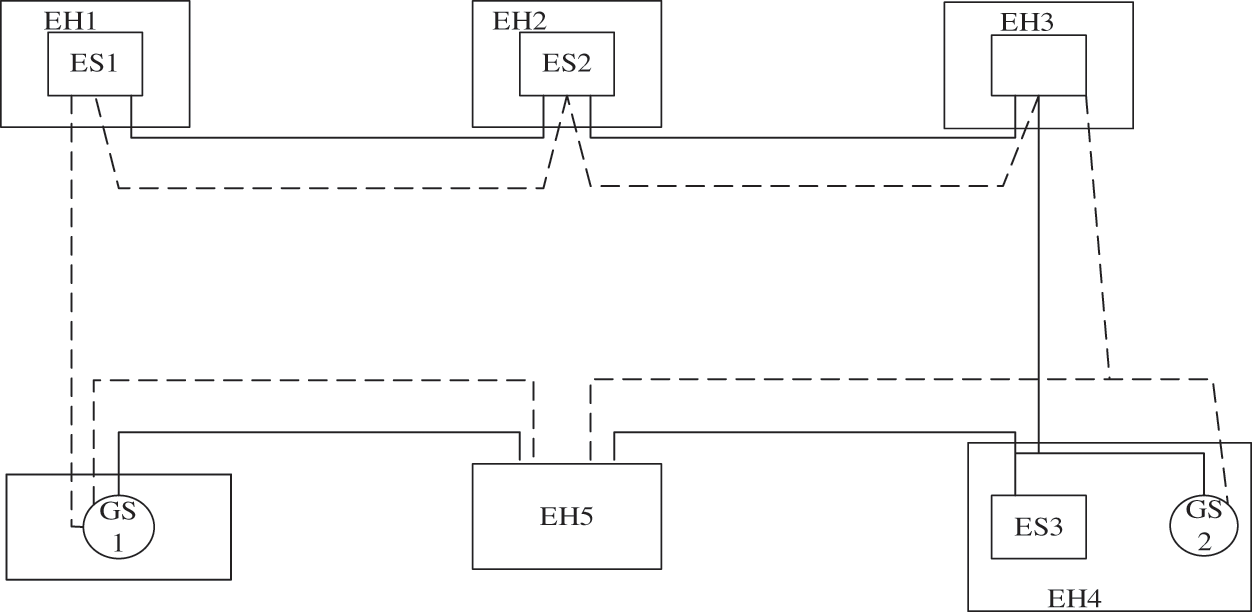
Figure 4: Simple electricity-gas interconnected energy system
As shown in Fig. 4, ES represents the power output of the system, namely, the power provided by the unit, and GS is the natural gas supply of the system. The trend of electric power is represented by solid lines, and the trend of natural gas is denoted by dotted lines. Each node is the main body of optimization decision-making, that is, each node can make a decision on the very need for electrical conversion. Each EH inputs end is connected to the natural gas pipeline through the power line, and the EH output end is directly connected to the power load and natural gas load. In this system, the initial value of the coordination variable is set to zero, and the initial value of the multiplier coefficient is set to 1 [32].
The experimental data are processed by the ADMM algorithm proposed in [33]. ADMM algorithm is one of many step-by-step algorithms, which has good convergence and strong robustness.
3 Optimization Results and Analysis of Electrical Integrated Energy System
3.1 Analysis of Residual Value and Operation Cost Based on Shared Variables
Based on the experimental results, the residual convergence curve based on ADMM step-by-step algorithm is drawn as in Fig. 5, while Fig. 6 is the cost convergence curve of the operation of the comprehensive energy optimization system of electric resources in the EH.
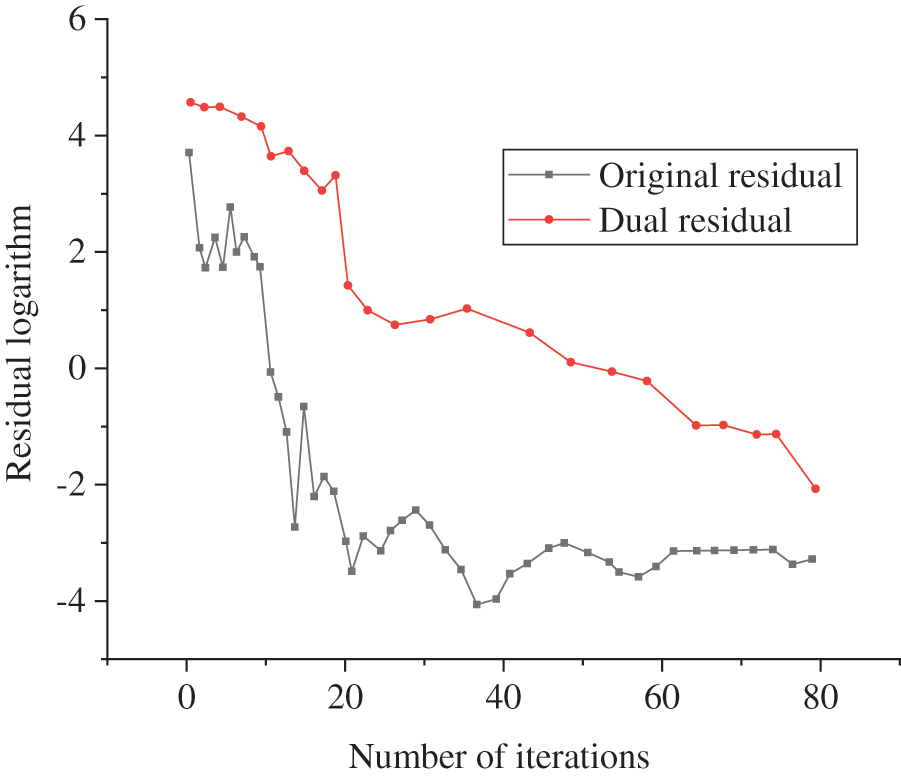
Figure 5: Residual convergence curve
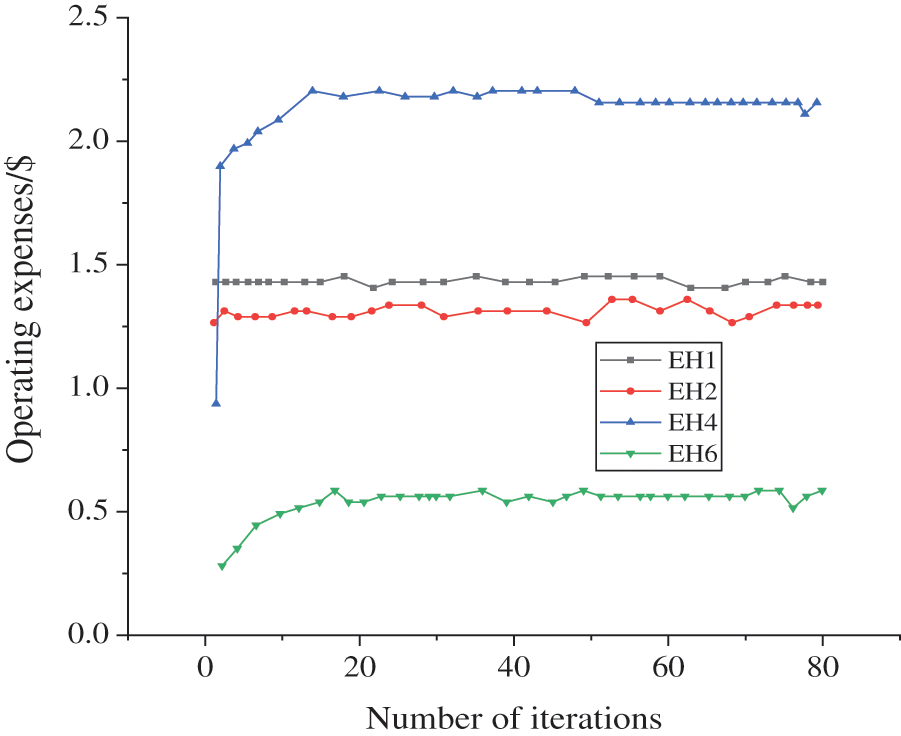
Figure 6: Convergence curve of operation cost of EH
Fig. 6 reveals that at the beginning of the iteration, the coefficient of the multiplier term in the objective function of the integrated electricity-gas energy optimal scheduling problem of each EH is small. The goal is to get the optimal solution with the minimum operation cost. The operation cost is the lowest in the iteration in this direction, among which the lowest one is EH 6, and the conversion cost is just $25,000. However, the initial and dual residuals of shared variables are the largest. It is essential to find a coordinated scheduling scheme of electricity-gas energy flow to reduce the residual of shared variables by increasing the number of iterations, and the corresponding operation cost will increase. Finally, the optimal solution based on the operating cost and the residual of shared variables is obtained after several iterations. The total cost of power generation and gas purchase converges to $54,936 after 79 iterations, including $42,350 for power generation and the US $12,586 for gas purchase, which takes 3.34 s. The result is basically the same as the existing centralized optimal scheduling algorithm, which proves the correctness and feasibility of the proposed integrated electricity-gas energy optimal scheduling algorithm.
3.2 Analysis of Natural Gas Load Change and Energy Distribution Results
According to the experimental data, the operation cost convergence curves of EH 1, EH 2, and EH 3 are drawn in Fig. 7. Figs. 8 and 9 show the variation curve of the natural gas load rate distribution coefficient and the variation diagram of unit output.
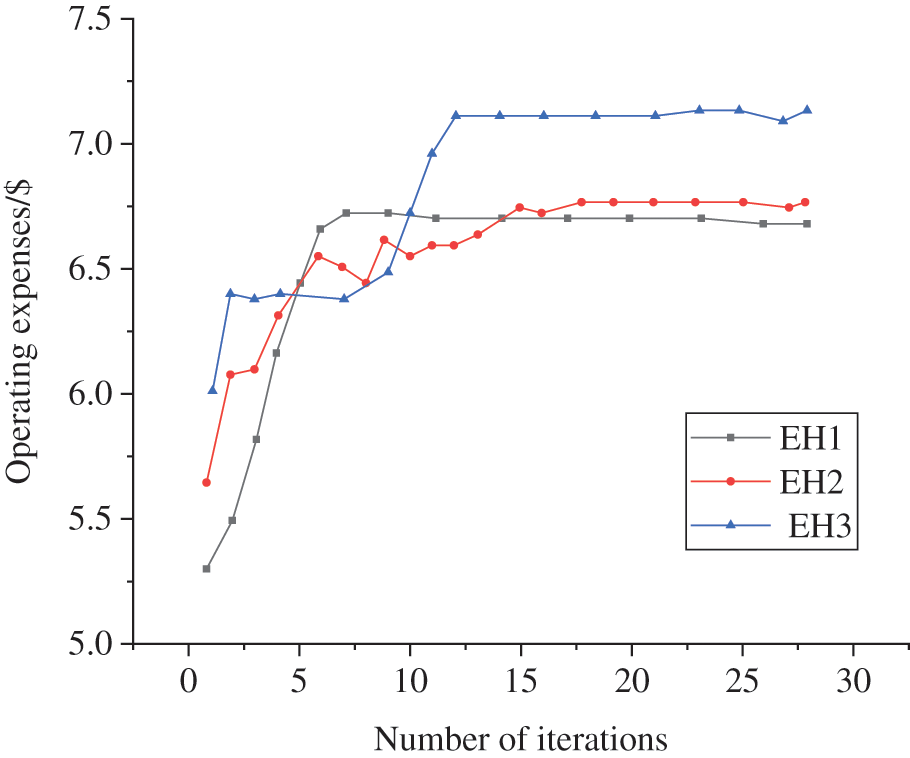
Figure 7: Convergence curve of operation cost of EH (EH 1, EH 2, and EH 3 represent EHs numbered 1, 2, and 3, respectively)
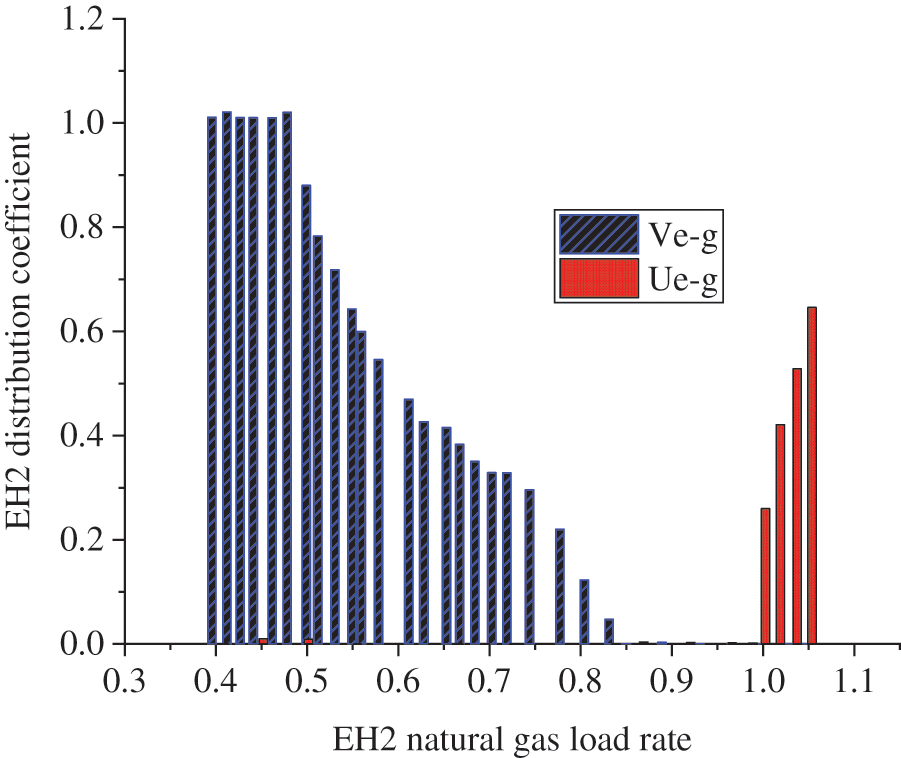
Figure 8: Variation diagram of EH 2 natural gas load rate distribution coefficient (Ve-g represents the gas to electricity conversion, and Ue-g denotes electricity to gas conversion)
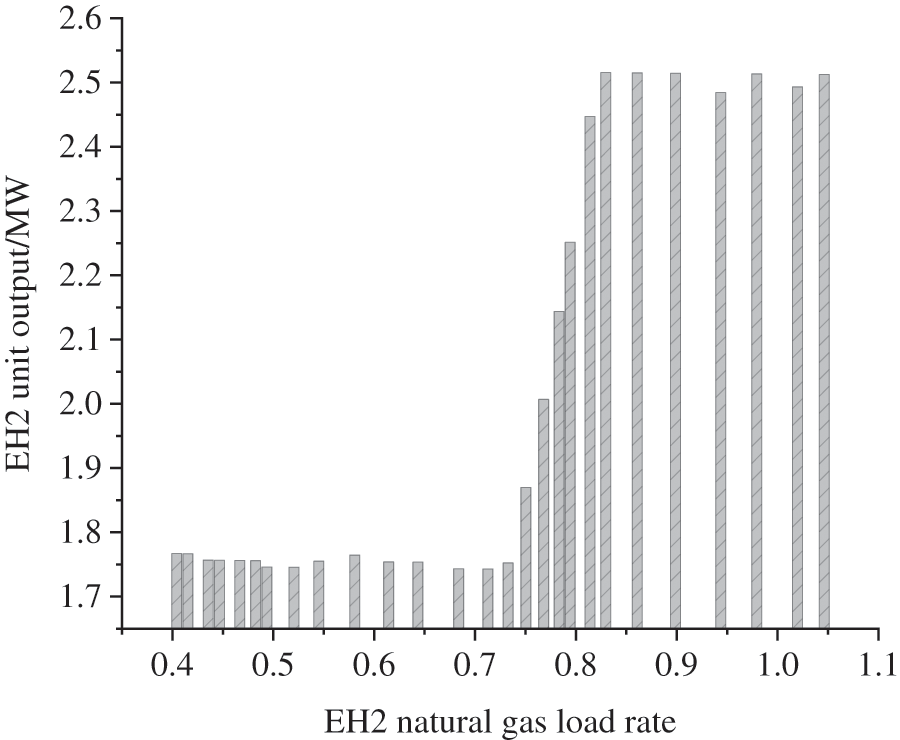
Figure 9: Histogram of unit output change of EH 2 natural gas load rates
Fig. 7 displays the convergence curve of operation cost of EH 1, EH2, and EH 3 with the change of the natural gas load. It suggests that the operating costs of the three hubs have reached a stable state when the number of iterations exceeds 15, showing that the performance of electricity-gas conversion hubs at different locations will eventually stabilize after short-term operation in the early stage. This further proves that the proposed optimization method of the integrated electricity-gas energy scheduling system has stable performance and wide applicability.
Fig. 8 illustrates that when the natural gas load changes, the energy change relationship within the EH can be used to explain the conversion of natural gas and electricity in EH. The comparison results of the data in Figs. 8 and 9 show that the unit output and natural gas load interact and transform with each other. The operation cost of using natural gas for power generation in the EH will be reduced when the natural gas load is low or the natural gas supply is very sufficient; the natural gas load in the whole EH will increase with the continuous consumption of natural gas, and the proportion of natural gas used for power generation will continue to decline until it drops to zero. This is the adjustment made by the system to meet the natural gas load; when the natural gas supply is seriously insufficient, the EH will convert the electricity in the system into natural gas supply to meet the natural gas load.
To sum up, the proposed optimization method of the integrated electricity-gas energy system based on spatial coupling has good practical results in terms of convergence speed and electrical transformation. Moreover, the EH is adopted to directly interconvert power and natural gas, avoiding the complex operation of scheduling based on information collected in the traditional centralized optimization method, as well as large amounts of information, complex model, and chaotic management. Thus, the proposed optimization scheme is relatively successful.
This paper explores the optimization mechanism of integrated electricity-gas energy scheduling systems by studying the coupling relationship between power supply systems and natural gas systems. First, the existing problems of the traditional centralized scheduling optimization methods are analyzed through a literature review. According to the analysis results, an optimal scheduling algorithm is proposed for an integrated electricity-gas energy system based on EH and the step-by-step algorithm. The mathematical models of the circuit and natural gas circuit are implemented based on the analysis of aerodynamics. The feasibility of the proposed system is proved by data iteration. The mechanism of electricity-gas mutual transformation in EH is studied. The results show that the proposed optimization scheme takes EH as the scheduling center to schedule power resources and natural gas resources, and there is no need for the traditional single power scheduling center and single natural gas scheduling center. This avoids the defects of massive information, complex model, and chaotic management, and has stronger flexibility. Thus, the proposed optimization scheme is successful. However, the scheduling cost of power resources is often affected by the price of natural gas, which, however, is not involved in this paper, thereby pointing out the research deficiency. The design and optimization of the integrated energy system is a research hotspot of new energy reform. The network of the integrated electricity-gas energy scheduling system is complex, and the transportation line is long. Combining computer technology to build a multi-agent cooperative scheduling platform is also a research direction in the future.
Funding Statement: The authors received no specific funding for this study.
Conflicts of Interest: The authors declare that they have no conflicts of interest to report regarding the present study.
1. Hewitt, R. J., Cremades, R., Kovalevsky, D. V., Hasselmann, K. (2021). Beyond shared socioeconomic pathways (SSPs) and representative concentration pathways (RCPsClimate policy implementation scenarios for Europe, the US, and China. Climate Policy, 21(4), 434–454. DOI 10.1080/14693062.2020.1852068. [Google Scholar] [CrossRef]
2. Zahid, R. M., Buhari, D., Shaiara, H., Huang, S., Umer, S. (2021). Role of economic complexity to induce renewable energy: Contextual evidence from G7 and E7 countries. International Journal of Green Energy, 18(7), 745–754. DOI 10.1080/15435075.2021.1880912. [Google Scholar] [CrossRef]
3. Edward, M., Prince, M., David, A., Yevu, M. (2021). Household energy choice for cooking among the time and consumption poor in Ghana. Energy, 226, 408. DOI 10.1016/J.ENERGY.2021.120408. [Google Scholar] [CrossRef]
4. Khan, B., Cheng, J., Xu, D., Khizar, A., Imad, A. et al. (2021). Asymmetric impact of fossil fuel and renewable energy consumption on economic growth: A nonlinear technique. Energy, 226, 120. DOI 10.1016/J.ENERGY.2021.120357. [Google Scholar] [CrossRef]
5. Mudali, U., Patil, M., Saravanabhavan, R., Saraswat, V. K. (2021). Review on E-waste recycling: Part I—A prospective urban mining opportunity and challenges. Transactions of the Indian National Academy of Engineering, 21, 1–22. DOI 10.1007/s41403-021-00216-z. [Google Scholar] [CrossRef]
6. Boffardi, R., Ioppolo, G., Arbolino, R. (2021). A two-step approach to evaluate drivers and barriers to clean energy policies: Italian regional evidence. Environmental Science and Policy, 120, 173–186 DOI 10.1016/j.envsci.2021.03.006. [Google Scholar] [CrossRef]
7. Duan, X., Pan, N., Sun, C. (2021). MOF-Derived Co-MOF, O-doped carbon as trifunctional electrocatalysts to enable highly efficient Zn–air batteries and water-splitting. Journal of Energy Chemistry, 56, 290–298. DOI 10.1016/j.jechem.2020.08.007. [Google Scholar] [CrossRef]
8. Ma, A., Ji, J., Khayatnezhad, M. (2021). Risk-constrained non-probabilistic scheduling of coordinated power-to-gas conversion facility and natural gas storage in power and gas based energy systems. Sustainable Energy, Grids and Networks, 23, 100478. DOI 10.1016/j.segan.2021.100478. [Google Scholar] [CrossRef]
9. Fatai, A. F., Bein, M. A., Akwasi, G. B. (2021). Does agricultural development induce environmental pollution in E7? A myth or reality. Environmental Science and Pollution Research International, 2, 21. DOI 10.1007/s11356-021-13586-2. [Google Scholar] [CrossRef]
10. Miguel, B., Marcos, F., Lydia, B. (2021). Evaluation of the effects on regional production and employment in Spain of the Renewable Energy Plan 2011–2020. Sustainability, 13(6), 3587–3587. DOI 10.3390/su13063587. [Google Scholar] [CrossRef]
11. Amin, S., Masoud, A., Amin, M. M. (2021). A hybrid robust-stochastic approach for optimal scheduling of interconnected hydrogen-based energy hubs. IET Smart Grid, 4(2), 241–254. DOI 10.1049/stg2.12035. [Google Scholar] [CrossRef]
12. Santamarta, J. C., Alejandro, G. G., Expósito, M. C. (2021). The clean energy transition of heating and cooling in touristic infrastructures using shallow geothermal energy in the Canary Islands. Renewable Energy, 171, 505–515. DOI 10.1016/j.renene.2021.02.105. [Google Scholar] [CrossRef]
13. Rui, X., Lin, L., Wang, J., Ye, X., He, H. et al. (2020). Experimental and comparative RANS/URANS investigations on the effect of radius of volute tongue on the aerodynamics and aeroacoustics of a sirocco fan. Processes, 8(11), 1442. DOI 10.3390/pr8111442. [Google Scholar] [CrossRef]
14. Tang, Z., Lin, S., Liang, W., Xie, Y., Liu, M. (2020). Optimal dispatch of integrated energy campus microgrids considering the time-delay of pipelines. IEEE Access, 8, 178782–178795. DOI 10.1109/Access.6287639. [Google Scholar] [CrossRef]
15. Cheng, Z., Wang, H., Yang, C., Ji, X., Zhao, X. (2021). Optimal energy dispatch of integrated electricity substation considering the operational uncertainties in an edge-cloud environment. Journal of Physics: Conference Series, 1881(2), 022048. DOI 10.1088/1742-6596/1881/2/022048. [Google Scholar] [CrossRef]
16. Wu, G., Xiang, Y., Liu, J., Gou, J., Jawad, S. (2020). Decentralized day-ahead scheduling of multi-area integrated electricity and natural gas systems considering reserve optimization. Energy, 198, 117271. DOI 10.1016/j.energy.2020.117271. [Google Scholar] [CrossRef]
17. Ghassan, C., Ibrahim, D. (2020). Development and analysis of a polygenerational smart energy hub for sustainable communities. Energy Conversion and Management, 226, 113475. DOI 10.1016/j.enconman.2020.113475. [Google Scholar] [CrossRef]
18. Wang, J., Zeng, P., Liu, J., Li, Y. (2020). Coordinated planning of multi-energy systems considering demand side response. Energy Reports, 6(S9), 745–751. DOI 10.1016/j.egyr.2020.11.136. [Google Scholar] [CrossRef]
19. Jakob, A., Sebastian, R., Timm, T. (2020). The impact of political instruments on building energy retrofits: A risk-integrated thermal energy Hub approach. Energy Policy, 147, 111851. DOI 10.1016/j.enpol.2020.111851. [Google Scholar] [CrossRef]
20. Mu, Y., Chen, W., Yu, X., Jia, H., Hou, K. et al. (2020). A double-layer planning method for integrated community energy systems with varying energy conversion efficiencies. Applied Energy, 279, 115700. DOI 10.1016/j.apenergy.2020.115700. [Google Scholar] [CrossRef]
21. Yang, H., You, P., Shang, C. (2021). Distributed planning of electricity and natural gas networks and energy hubs. Applied Energy, 282, 210. DOI 10.1016/j.apenergy.2020.116090. [Google Scholar] [CrossRef]
22. Li, M., Sun, J., Liu, D., Li, Y., Hu, J. (2020). A model for the optimization of the shale gas horizontal well section based on the combination of different weighting methods in the frame of the game theory. Fluid Dynamics and Materials Processing, 16(5), 993–1005. DOI 10.32604/fdmp.2020.010443. [Google Scholar] [CrossRef]
23. Jakob, A., Sebastian, R., Timm, T., Simon, W. (2020). The impact of political instruments on building energy retrofits: A risk-integrated thermal energy Hub approach. Energy Policy, 147, 111851. DOI 10.1016/j.enpol.2020.111851. [Google Scholar] [CrossRef]
24. Yong, P., Wang, Y., Capuder, T., Tan, Z., Zhang, N. et al. (2021). Steady-state security region of energy hub: Modeling, calculation, and applications. International Journal of Electrical Power and Energy Systems, 125, 106551. DOI 10.1016/j.ijepes.2020.106551. [Google Scholar] [CrossRef]
25. Matteo, A., Silvia, P., Simona, L., Maurizio, C., Donatella, C. et al. (2020). “The loss of golden touch”: Mitochondria-organelle interactions, metabolism, and cancer. Cells, 9(11), 106. DOI 10.3390/cells9112519. [Google Scholar] [CrossRef]
26. Oskouei, M. Z., Behnam, M., Mehdi, A. (2021). Techno-economic and environmental assessment of the coordinated operation of regional grid-connected energy hubs considering high penetration of wind power. Journal of Cleaner Production, 280, 124. DOI 10.1016/j.jclepro.2020.124275. [Google Scholar] [CrossRef]
27. Jairo, R., Adriaen, V., Johannes, J., Nord, L. O. (2021). Optimal scheduling of flexible thermal power plants with lifetime enhancement under uncertainty. Applied Thermal Engineering, 191, 116. DOI 10.1016/j.applthermaleng.2021.116794. [Google Scholar] [CrossRef]
28. Andoni, C., Sylwia, G., Beatriz, R. (2021). Design, characterization and evaluation of Ce-modified cobalt catalysts supported on alpha alumina in the abatement of methane emissions from natural gas engines. Applied Catalysis A: General, 617, 118. DOI 10.1016/j.apcata.2021.118105. [Google Scholar] [CrossRef]
29. Yedi, R., Diming, R., Tan, P. (2021). Emission reduction characteristics of after-treatment system on natural gas engine: Effects of platinum group metal loadings and ratios. Journal of Cleaner Production, 298, 126. DOI 10.1016/j.jclepro.2021.126833. [Google Scholar] [CrossRef]
30. Kotaro, N., Takehiko, M., Takashi, O., Takao, N. (2021). Prediction of de-NOx performance using monolithic SCR catalyst under load following operation of natural gas-fired combined cycle power plants. Energy, 227, 120. DOI 10.1016/j.energy.2021.120383. [Google Scholar] [CrossRef]
31. Assunção, R. C., Lorena, A. S., Pietro, M., Stelvia, M., Suzana, B. (2021). Technology roadmap of renewable natural gas: Identifying trends for research and development to improve biogas upgrading technology management. Applied Energy, 292, 116. DOI 10.1016/j.apenergy.2021.116849. [Google Scholar] [CrossRef]
32. Talaghat, M. R., Roozkhosh, S., Jokar, S. (2021). Experimental study of Iranian natural gas hydrate formation using Persian Gulf seawater in the presence or absence of propanol as a thermodynamic inhibitor. Energy Sources, Part A: Recovery, Utilization, and Environmental Effects, 43(11), 1348–1362. DOI 10.1080/15567036.2019.1636904. [Google Scholar] [CrossRef]
33. Tao, M., Yuan, X. (2018). Convergence analysis of the direct extension of ADMM for multiple-block separable convex minimization. Advances in Computational Mathematics, 44(3), 773–813. DOI 10.1007/s10444-017-9560-x. [Google Scholar] [CrossRef]
 | This work is licensed under a Creative Commons Attribution 4.0 International License, which permits unrestricted use, distribution, and reproduction in any medium, provided the original work is properly cited. |