| Fluid Dynamics & Materials Processing |
DOI: 10.32604/fdmp.2022.017519
ARTICLE
CFD Analysis and Optimization of a Diesel Engine Cooling Water Jacket
1State Key Laboratory of Engine Reliability, Weichai Power Co., Ltd., Weifang, 261061, China
2School of Energy and Power Engineering, Shandong University, Jinan, 250061, China
*Corresponding Author: Ke Sun. Email: sunkeke@sdu.edu.cn
Received: 09 May 2021; Accepted: 16 August 2021
Abstract: The STAR-CCM + software is used to investigate the flow inside a cooling water jacket of an in-line six-cylinder diesel engine. The results show that the average flow velocity of the cooling water inside the jacket is 1.669 m/s while the flow velocity distribution is not uniform for each cylinder. Moreover, the fluid velocity in proximity to the cylinder head is too low, thereby affecting the cooling performances of the water jacket. Two corresponding structural optimization schemes are proposed to mitigate this issue and the post-optimization performances of the water jacket are discussed in detail.
Keywords: Diesel engine; cooling water jacket; CFD
At present, internal combustion engines (ICEs), and diesel in particular, have come under significant emissions pressure. With the increasingly stringent emission regulations and the development of various new technologies, diesel engines are developing in the direction of high power, light weight and low emissions [1]. The increase in power, reduction in size and the complexity of the structure put forward higher requirements for the engine cooling system [2]. The cooling water jacket is an important component of the cooling system, as the cooling effect of the cooling system is directly affected by the flow of the coolant inside the cooling water jacket. It is also related to the reliability of the cylinder head and body [3–5].
Generally, for diesel engines, either air or liquid cooling systems are employed, both with their own advantages and disadvantages. The liquid cooling systems have the advantage of being able to keep the temperature of all of the cylinders quite even. In addition, the coolant is usually thermostatically controlled, so that the engine heats up quickly when starting, and always works all the time around the optimal operating temperature [6]. The diesel engine model in this paper also chooses the liquid cooling system.
Since the cooling water jacket is completely enclosed inside the engine body, it is difficult to use test methods to study the flow characteristics inside [7]. But modern CFD technology has been developed rapidly with the advancement of computer technology and numerical calculation technology, the flow field of the cooling water jacket can be obtained through CFD simulation calculation and reliability analysis can be performed, which has become the development trend in the design and optimization of modern engine cooling system [8]. Meanwhile, most studies for engine cooling systems are conducted in steady state [9].
In this paper, a certain in-line six-cylinder diesel engine is used as the research object. The flow condition of the coolant inside the cooling water jacket is simulated and calculated in the STAR-CCM + software, and the flow field distribution of the cooling water jacket is given. The unreasonable flow area is given structural improvement measures according to the calculation results, and the flow conditions of the optimized model and the original machine model are compared and analyzed.
2.1 Establishment of Calculation Model
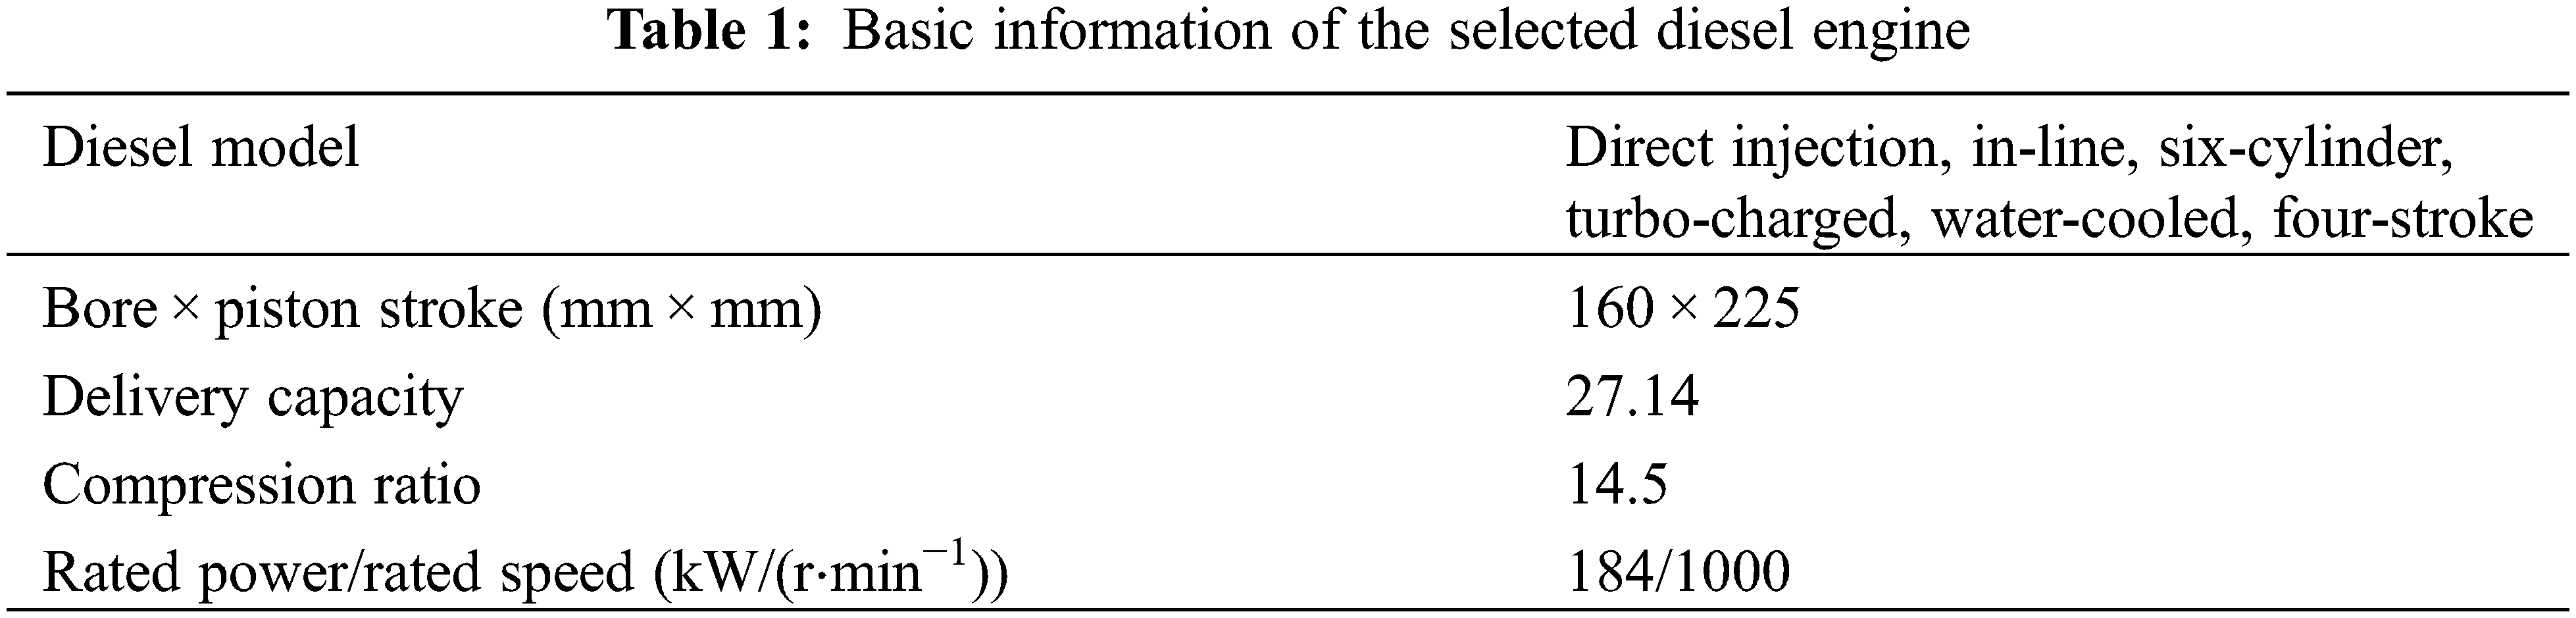
In this paper, a certain in-line six-cylinder diesel engine is the research object, the main technical parameters are shown in Table 1. In order to ensure the true and reliable calculation results, except for the simplified calculation of the outer surface of the cylinder head water jacket, other structures of the model are not simplified calculation. Fig. 1 is a geometric model of the engine cooling water jacket. The geometric model is mainly composed of four parts: Water distribution pipe, cylinder block water jacket, cylinder head water jacket and water collection pipe.
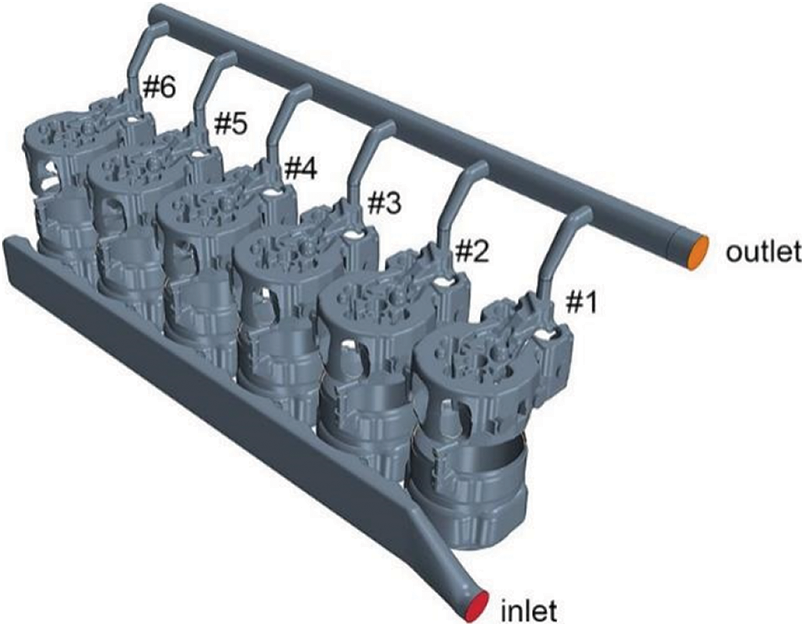
Figure 1: Geometry model of the engine cooling system
Label each cylinder in turn according to the distance from the water inlet. The flow route of the coolant is as follows: The coolant flows in from the water distribution pipe inlet on the exhaust side of the cylinder block water jacket, goes into the cylinder block water jacket of Cylinders 1 to 6 through the water distribution pipe, goes through the up-per water holes on both sides that connect the cylinder block and the cylinder head water jacket to flows into the cylinder head water jacket, and finally flows out of the cooling water jacket from the water outlet of the water col-lection pipe.
The structure of the cooling water jacket model in this calculation is complicated, for its calculation area is com-posed of irregular curved surfaces. Considering this, the paper uses Hyper Mesh and STAR-CCM + software to mesh the geometric model of the cooling water jacket [10]. First, import the geometric model into Hyper Mesh and perform geometric cleanup. According to the cooling water jacket structure, divide them into different areas and a surface mesh is generated. The parts where the mesh quality does not meet the requirements are then manually modified. Import the surface mesh generated in Hyper Mesh into the STAR-CCM + software and perform surface repair to make the overall surface mesh quality meet the requirements, and then use the automatic meshing function of the STAR-CCM + software to generate a body mesh.
The generated fluid area volume mesh is shown in Fig. 2. Boundary layer grid is generated on the wall surface except for the inlet and outlet, and the boundary layer number is 2. In order to prevent the water outlet backflow from affecting the calculation results, a stretched layer grid is set at the water outlet. The grid has 20 layers with the overall length of 40 mm.
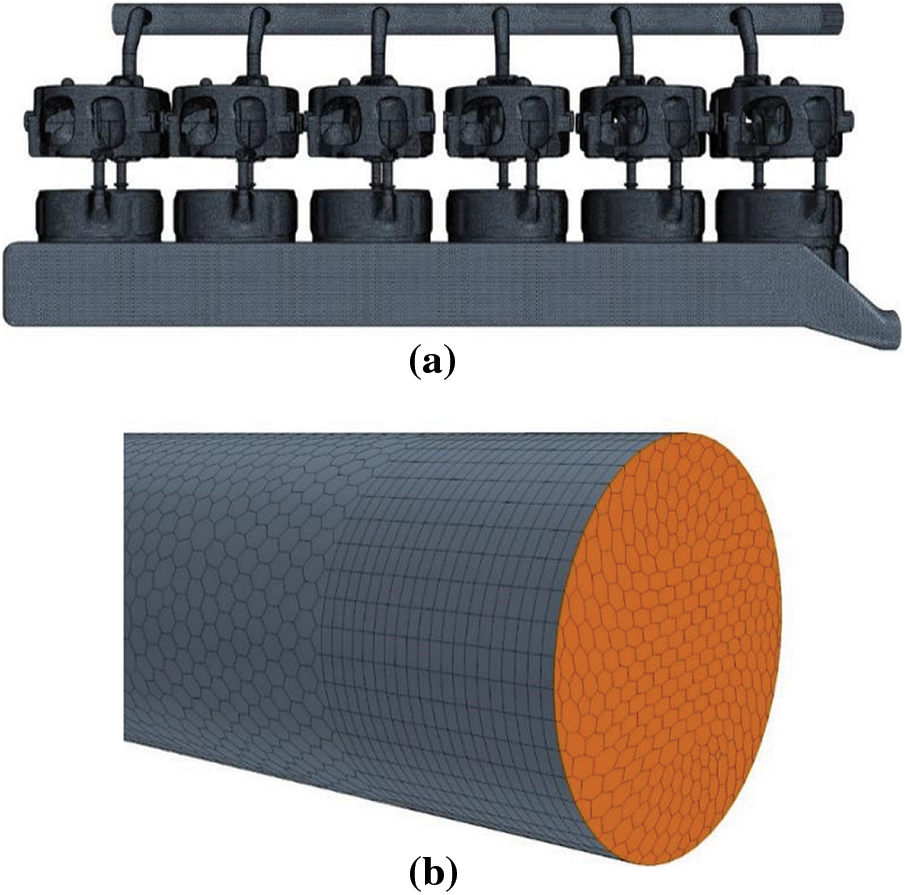
Figure 2: Grid model of engine cooling system (a) Overall view (b) Local view
2.2 Setting of Calculation Model
According to the actual working conditions of the engine cooling water jacket of the research object, the following assumptions are made on the flow condition of the coolant inside the cooling water jacket without affecting the authenticity during the simulation calculation [11]:
(1) Regardless of the boiling effect of the coolant, the simulation calculation of the cooling water jacket is a steady-state process, that is, its flow and heat transfer do not change with time, and the final result tends to be convergent and stable.
(2) Regardless of the boiling effect of the coolant, the flow of the coolant inside the cooling water jacket is a single-phase flow, assuming that all the internal coolant is in liquid state, and the influence of the vapor state is ignored.
(3) The coolant is forced to circulate in the water jacket through the water pump. The coolant Flow velocity is set at the inlet of the fluid area during the simulation calculation, and the velocity direction is the normal direction of the water inlet.
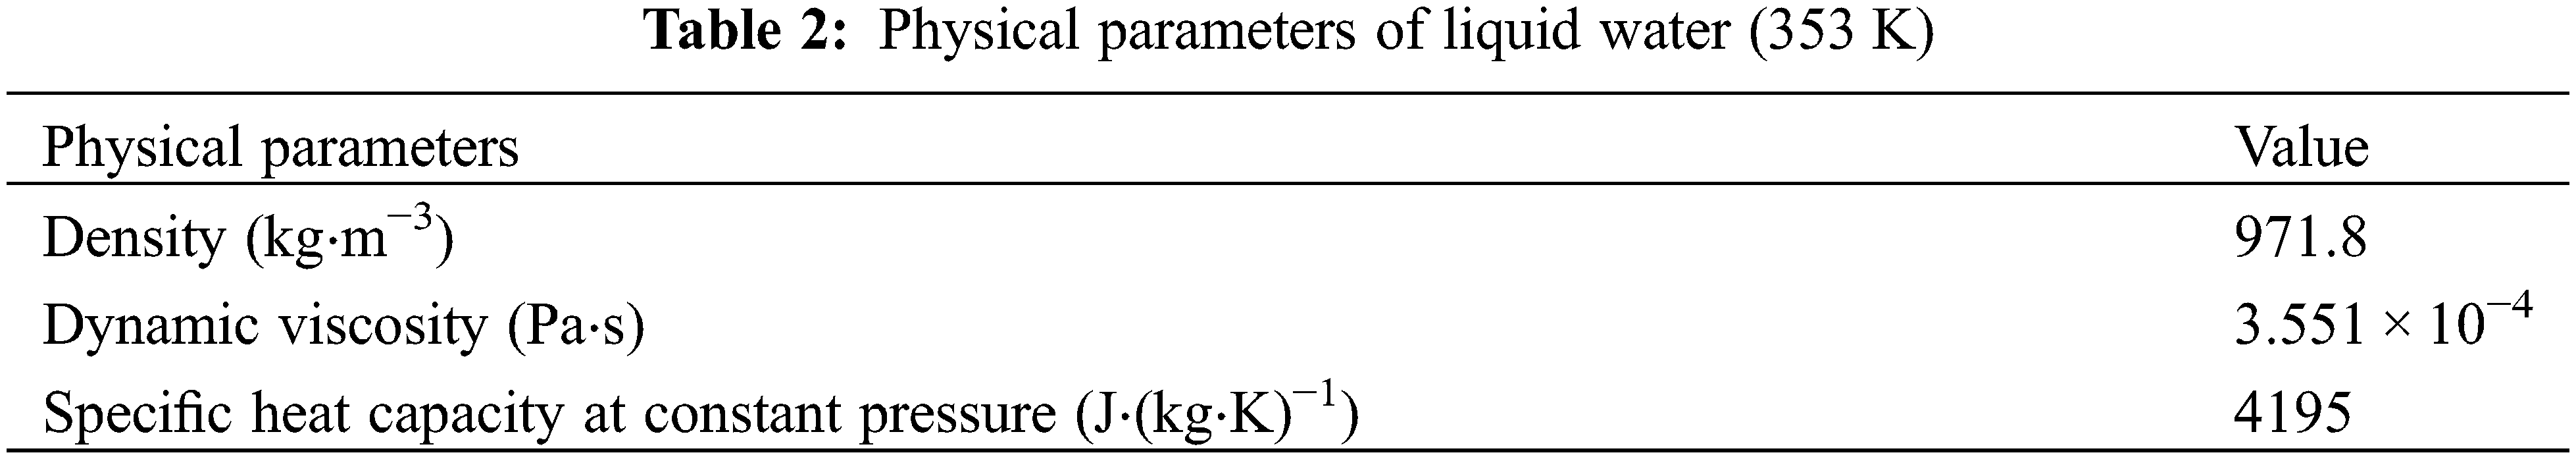
In the CFD simulation calculation of the cooling water jacket, the calculation condition is selected as the rated operating condition of the diesel engine. Liquid water is selected as the coolant, and the physical parameters are set. For the physical parameters that change with temperature (density, dynamic viscosity, etc.), select the value at 353 K. The specific values are shown in Table 2.
The flow of the coolant is under a three-dimensional steady state with incompressible viscous turbulence. The boiling state of the liquid water and the wall roughness of the water jacket are not considered in the calculation process according to the basic assumptions.
Using the Segregated Flow Solver, which solves the integral conservation equations of mass and momentum in a sequential manner. The segregated solver employs a SIMPLE-type pressure-velocity coupling algorithm, where the mass conservation constraint on the velocity field is fulfilled by solving a pressure-correction equation [12,13].
Reynolds-Averaged Navier-Stokes (RANS) Turbulence Models provide closure relations for the Reynolds-Averaged Navier-Stokes equations, that govern the transport of the mean flow quantities [14]. To obtain the Reynolds-Averaged Navier-Stokes equations, each solution variable ϕ in the instantaneous Navier-Stokes equations is decomposed into its mean, or averaged, value
where ϕ represents velocity components, pressure, energy, or species concentration.
The steady Navier-Stokes equations are shown in Eqs. (2) and (3):
where ρ and μ are the density and dynamic viscosity of the fluid, ui and uj are the velocity components in the xi and xj directions, respectively, and p is the pressure.
The turbulence model of the simulation uses the K − ε standard turbulence model, which is a two-equation model that solves transport equations for the turbulent kinetic energy and the turbulent dissipation rate in order to deter-mine the turbulent viscosity [15].
where μt is the turbulent viscosity, k is the turbulent kinetic energy, reflecting the characteristic velocity, ε is the viscous dissipation rate of turbulence, reflecting the characteristic length scale.
Turbulent kinetic energy equation:
Turbulent dissipation rate equation:
where Gk is the turbulent production, Gb is the buoyancy production, YM is the compressibility modification. For incompressible flow, Gk = 0 , YM = 0.
According to the coefficient suggested by Launder and Sharma, the value of constant Cε1, Cε2,
For the area near the wall, two-layer full y+ wall processing is used, and the maximum number of calculation steps is set to 500 steps.
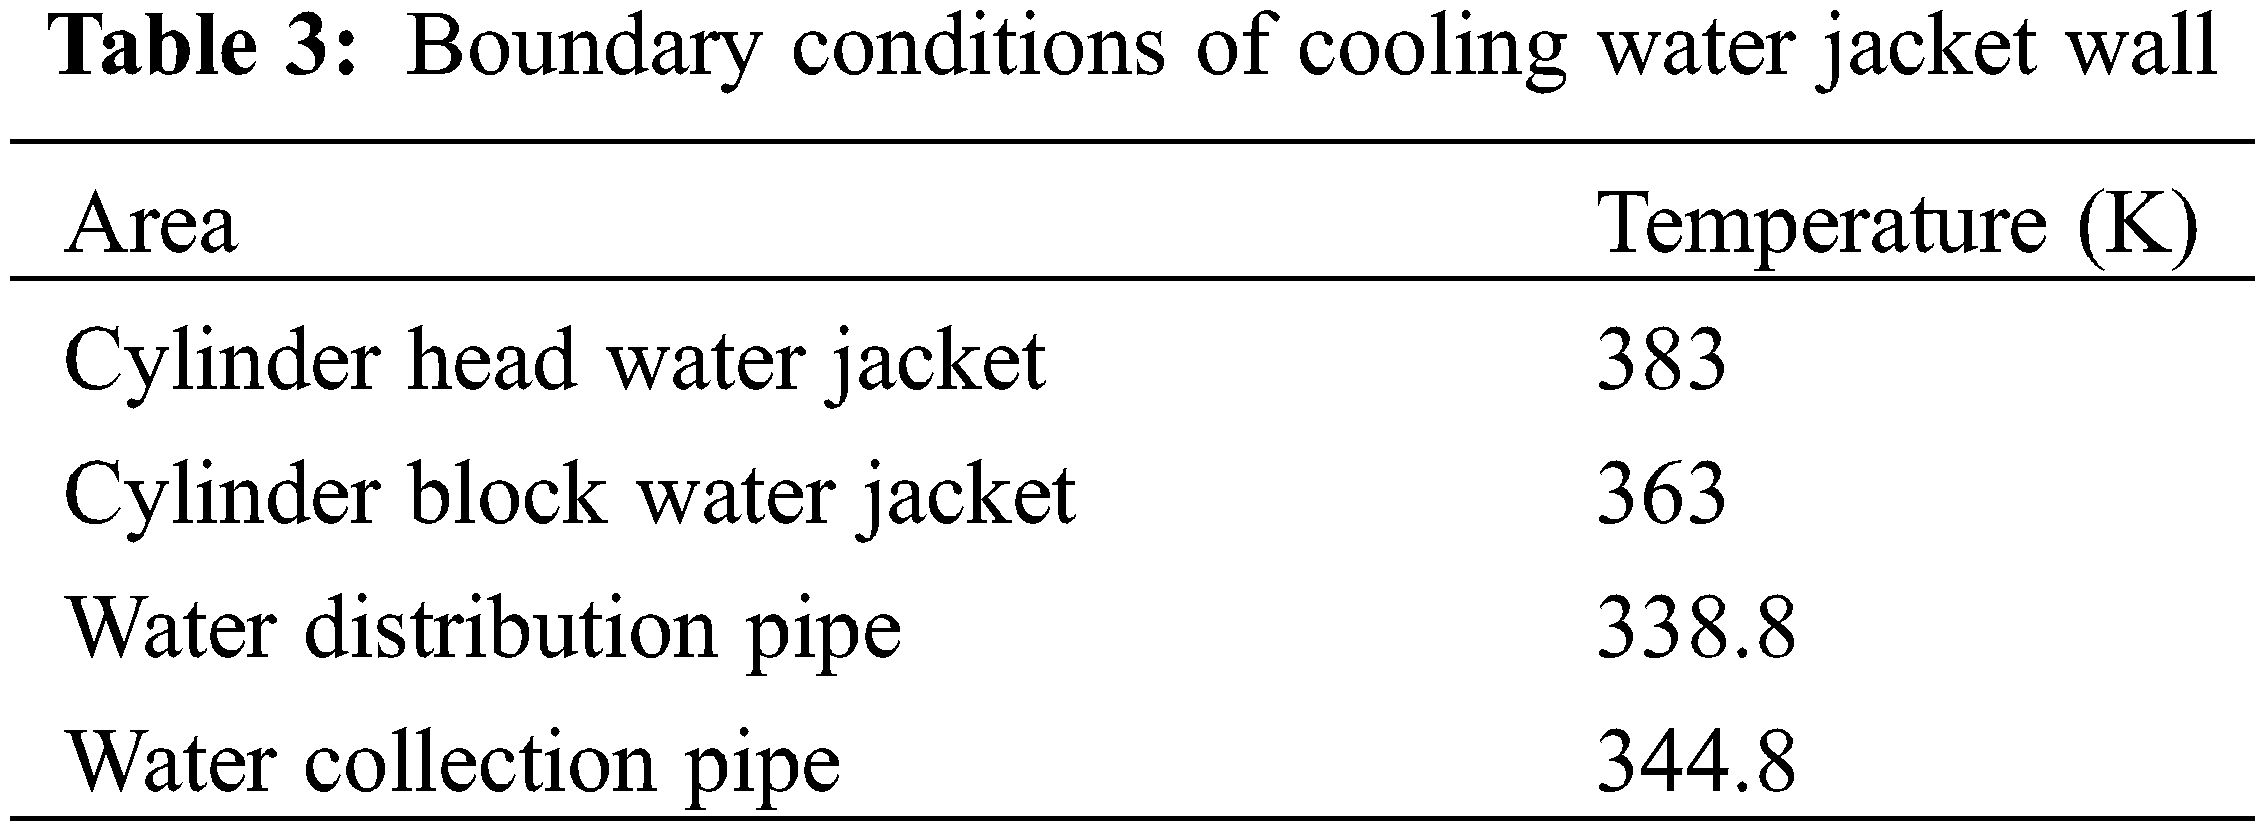
For the flow calculation in the fluid area of the cooling water jacket, the flow inlet uses the velocity inlet, and the inlet velocity is set to 7 m/s according to the parameters of the diesel engine water pump. The inlet temperature is set to 338.8 K. The flow outlet uses the pressure outlet, the outlet pressure value is set to 0, this boundary pressure can be regarded as the static pressure of the environment into which the fluid enters, and the outlet temperature is set to 344.8 K. The turbulence designation method of the inlet and outlet adopts the method of turbulence intensity + length scale, the turbulence intensity is 0.01, and the turbulence length scale is 10 mm. The wall of the cooling water jacket follows the non-slip wall boundary condition. For a given wall temperature, the specific values are shown in Table 3.
3 Model Development and Validation
Unstructured polyhedral meshes are used for this calculation. To determine the final mesh configuration, different density of mesh has been built for the Grid Refinement Study [16]. Table 4 shows three mesh types with different mesh densities for mesh sensitivity analysis.
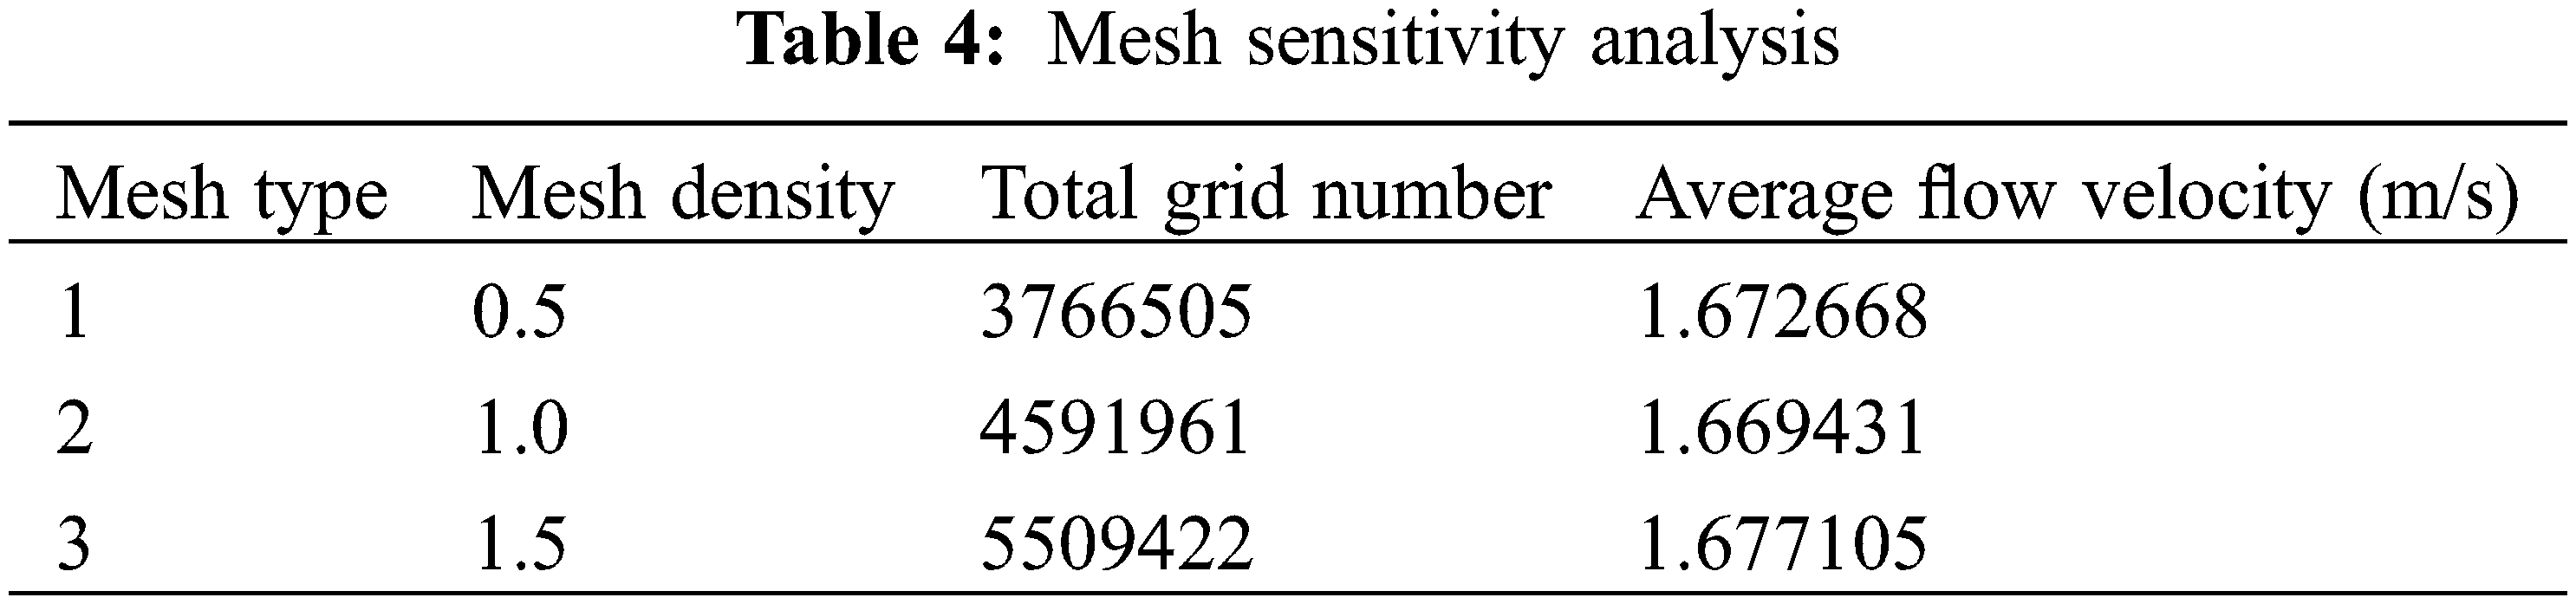
When the number of grids was increased from 3,766,505 to 5,509,422, the relative deviation of average flow velocity was less than 1%. Within the allowable range of the project, the number of grids used for the cooling water jacket was 4,591,961.
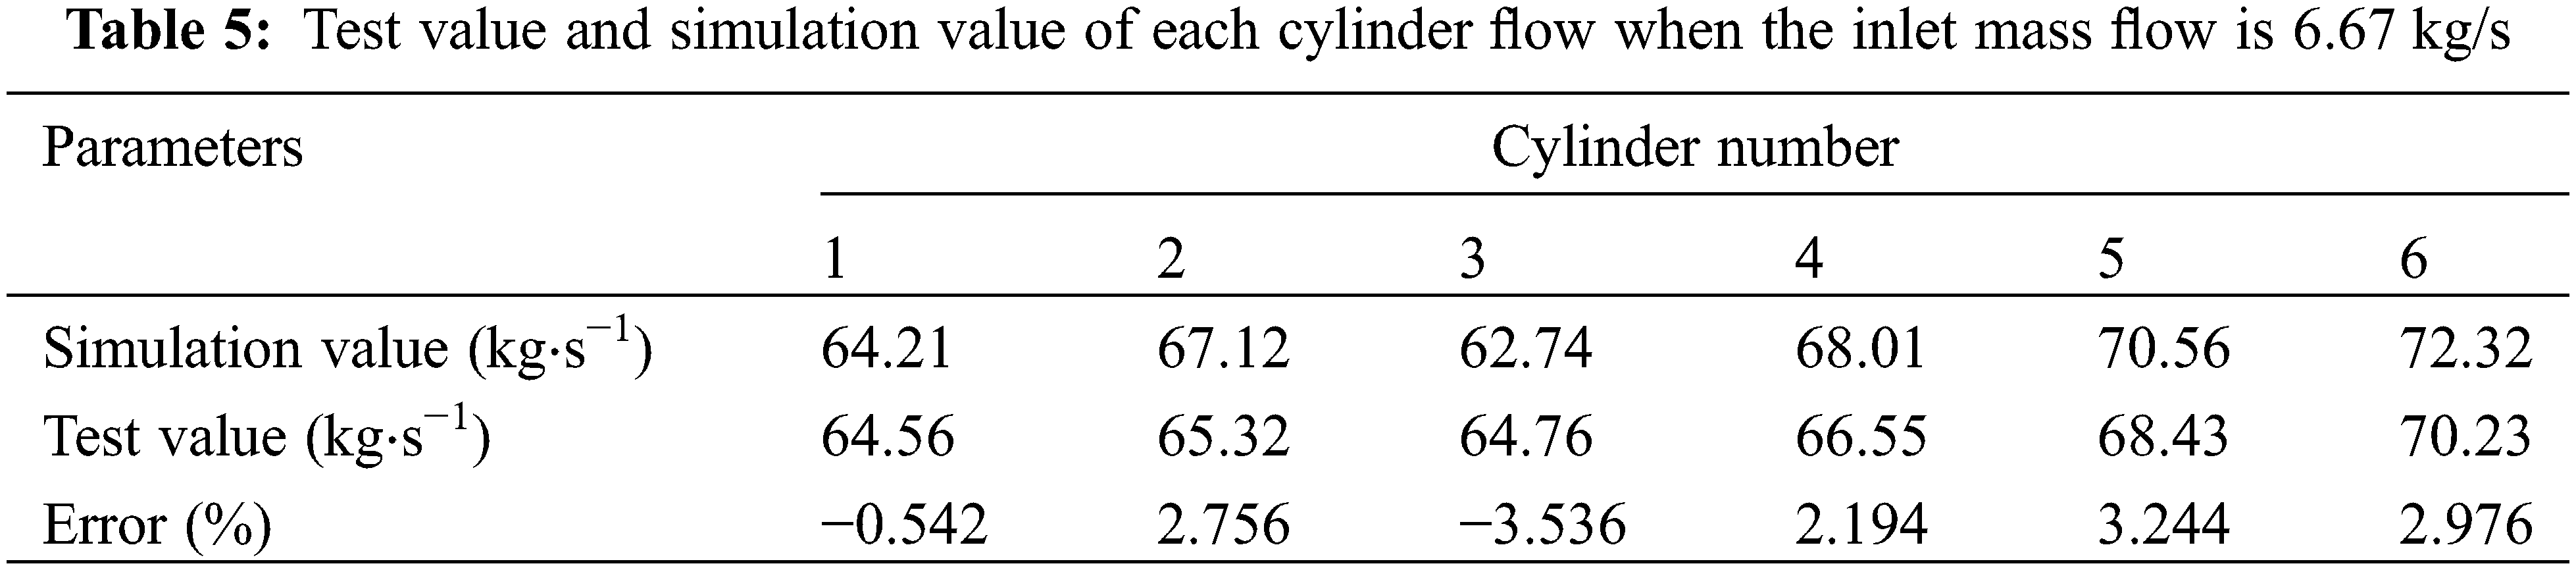
To validate the simulation model, according to Zhang et al.’s calculation model settings [17], some boundary conditions were redefined. The inlet boundary conditions are determined by the inlet mass flow. The inlet mass flow is 6.67 kg/s. The outlet boundary condition is determined by the outlet pressure, and the outlet pressure is 0. The maxi-mum number of calculation steps is 500 s.
Table 5 shows the simulation calculation value and experimental measurement value of cooling water flow of each cylinder when the inlet mass flow is 6.67 kg/s, the error between experimental value of Zhang et al. [17] and simulation value is less than 4%. The maximum error of −3.566% is less than −4.252% of Zhang’s simulation result. Considering the simplification of the grid model, the simulation ac-curacy is acceptable. The results show that the numerical simulation results of the cooling water jacket are reliable.
4 Analysis of the Model Calculation Results of the Original Engine
The flow condition of the coolant inside the cooling water jacket determines the temperature distribution of the cooling water jacket. The higher the Flow velocity of the coolant in the water jacket is, the less dead space in-side the cooling water will be, and better cooling effect will the cooling system will get. According to calculation experience in relevant reference, it is usually required that the Flow velocity of coolant in the water jacket of the cylinder block is greater than 0.5 m/s, and the highest average Flow velocity is less than 2 m/s, while the Flow velocity of the cooling water in the area with greater thermal load in cylinder head water jacket is greater than 1 m/s [18]. Zhang et al. [17] simulated the cooling water jacket under the rated condition, the coolant flow rate in the water jacket of the engine block is about 0.5 m/s, and the water flow rate in the water cavity of the cylinder head nose beam area is 2∼4.5 m/s. The cooling demand can be satisfied when the water flow rate in the nose area of cylinder head is kept above 1.5 m/s [17].
The streamline distribution of the coolant inside the cooling water jacket is shown in Fig. 3. It can be seen from the figure that the cooling water jacket does not show a flow dead zone. Through calculations, the average flow velocity of the cooling water is 1.669 m/s, which meets the requirements of diesel engines on the cooling water jacket. However, there is also a considerable low-velocity zone in the cylinder head water jacket and local areas of the water inlet and outlet pipes, which will affect its cooling performance. Because of its structure, the coolant in the water jacket of the cylinder generally forms a circumferential flow, which helps to improve the cooling effect.
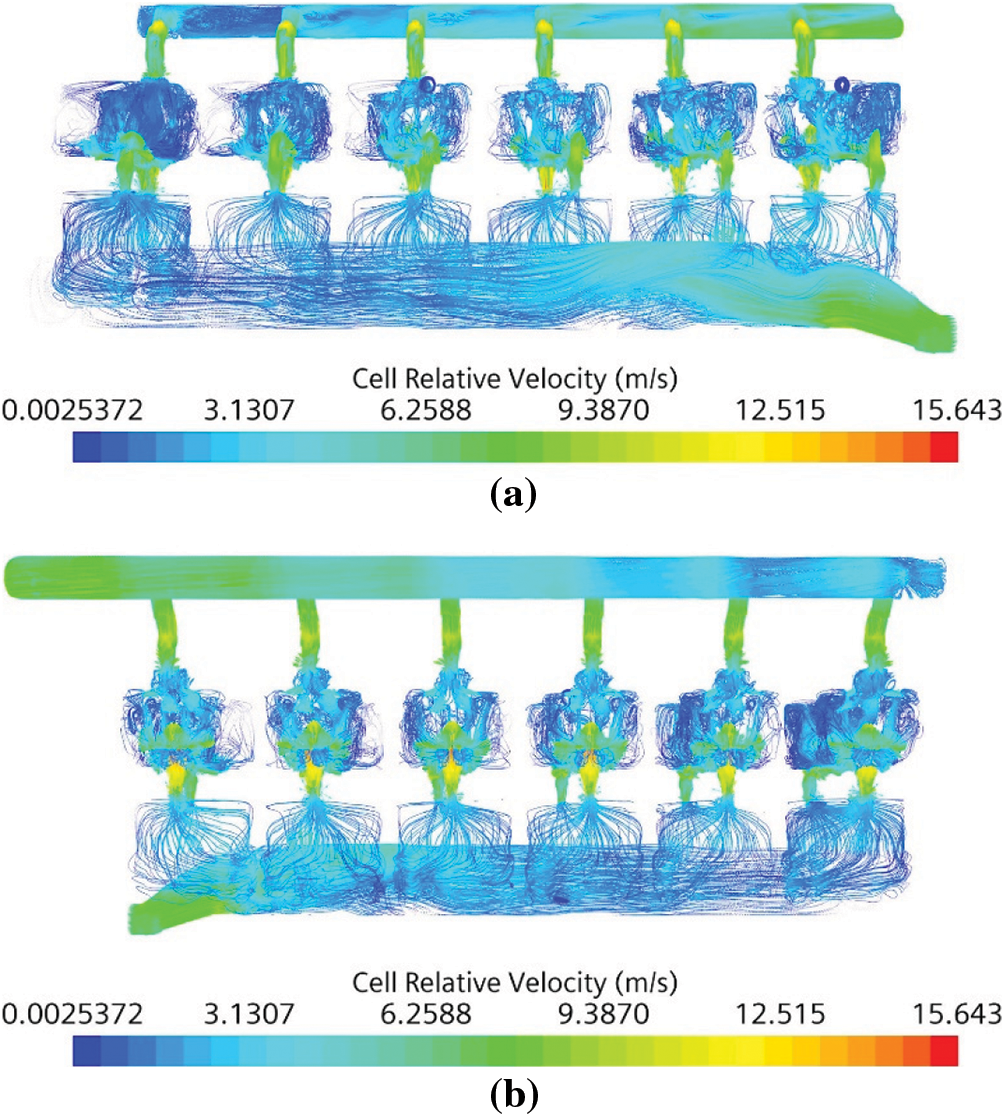
Figure 3: Coolant streamline distribution (a) Front view (b) Rear view
The cloud diagram of the flow velocity distribution of the coolant is shown in Fig. 4. For the single-cylinder flow field, Cylinders 1 and 2 are close to the water inlet, so the overall flow rate and the flow velocity at the upper water hole are large, which has a better cooling effect. The flow of Cylinders 3 and 4 is the second, and the flow rate becomes slower. The Cylinders 5 and 6 are far away from the water inlet, the overall flow rate and the flow velocity at the upper water hole are small, and the cooling water flow of Cylinder 6 is obviously slower than other cylinders’. The flow velocity in the local area is less than 0.5 m/s, and the cooling effect is poor, which also leads to poor cooling uniformity for the entire cooling water jacket.
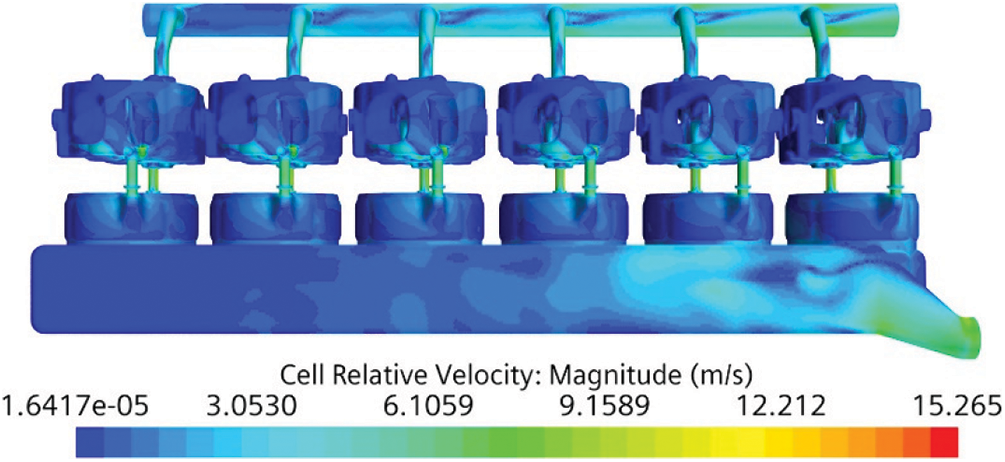
Figure 4: Cloud diagram of coolant velocity distribution
Fig. 5 shows the cloud diagram of the coolant velocity distribution at the lower section of water jacket of the cylinder head. As can be seen from the figure, because the water inlet hole on the side of the exhaust side is placed horizontally, when the coolant flows in from the water inlet hole on this side, the lower plane of the water jacket of the cylinder head can be swept with the flow, so the flow velocity is higher in area from the water duct on the exhaust side to the surroundings of the injector hole. The flow velocity of this section shows a downward trend along Cylinders 1 to 6. Due to the same structure, the flow velocity distribution of each cylinder is similar, but the flow velocity in some areas is less than 0.5 m/s, and the cooling is insufficient.
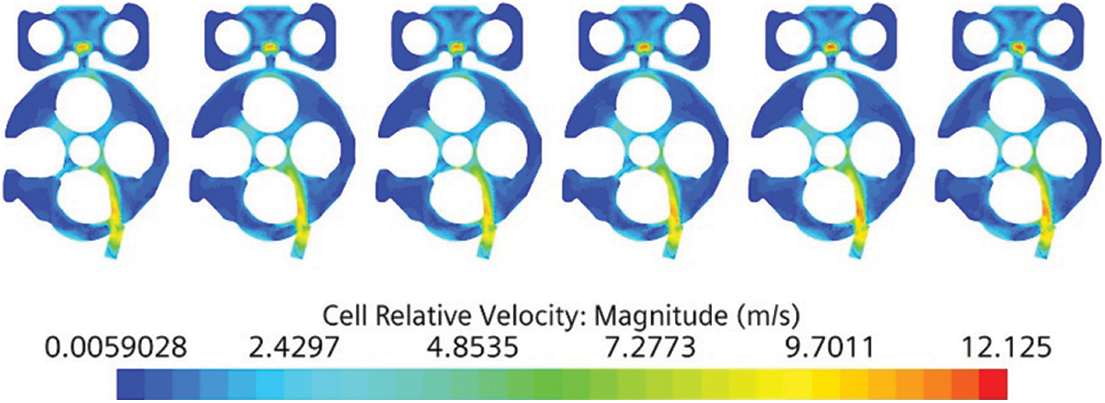
Figure 5: Cloud diagram of the coolant velocity distribution in the lower section of the cylinder head water jacket
The cloud diagram of the coolant velocity distribution on the upper part of the water jacket of the cylinder block is shown in Fig. 6. It can be seen from the figure that the average flow velocity of Cylinder 1 is the largest in this section, and the velocity of the area near the water inlet hole on the air intake side of Cylinder 1 reaches 4.7 m/s. This is because Cylinder 1 is close to the water inlet and the connection between the water jacket of the cylinder and the water distribution pipe are slightly different from the other cylinders. The flow velocity distribution of each cylinder in this section is roughly the same as that of the lower section of the water jacket of the cylinder.
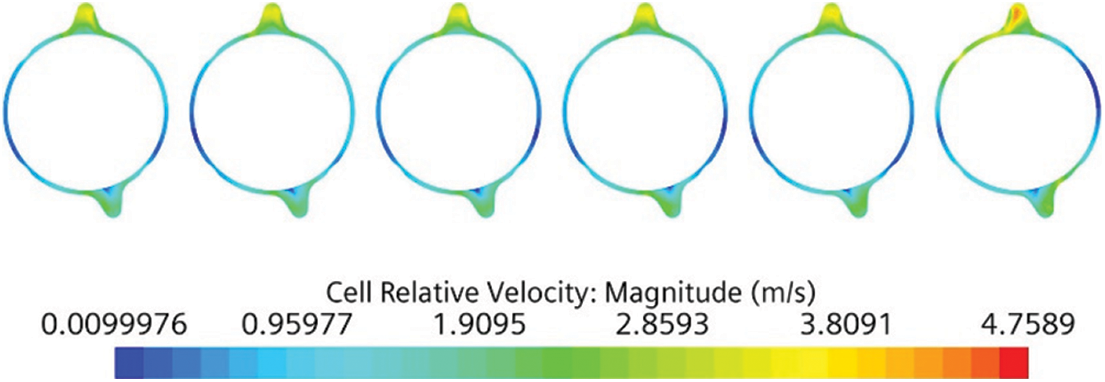
Figure 6: Cloud diagram of the coolant velocity distribution in the upper section of the cylinder block water jacket
For the cooling system, if the pressure loss is too large, it means that the flow resistance of the internal coolant is also large, which will reduce the mechanical efficiency of the engine and increase the requirements for the performance of the water pump and the sealing surfaces in the cooling water jacket. If the pressure loss is too small, the cooling effect will be insufficient, and it will not meet the design requirements [19].
The pressure distribution cloud diagram of the cooling water jacket is shown in Fig. 7. It can be seen from the figure that the overall water jacket pressure distribution gradually decreases along the cooling water flow direction, which is caused by the structural changes of different parts and the resistance loss along the way. It is calculated that the pressure loss of the overall water jacket is about 151.5 kPa, which meets the cooling requirements.
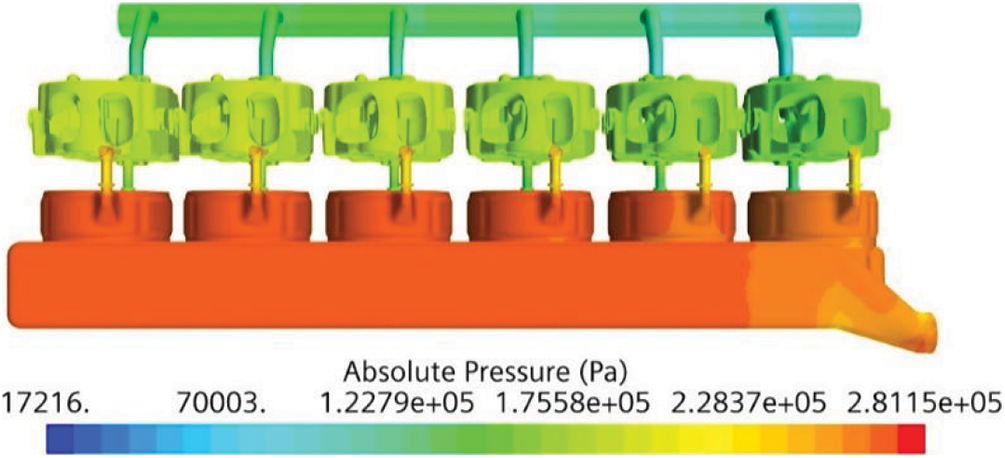
Figure 7: Cloud diagram of pressure distribution of cooling water jacket
5 Water Jacket Optimization and Comparative Analysis of Results
5.1 Water Jacket Structure Optimization Plan
Through the analysis of the simulation results of the original engine model and the problems found, according to the structural characteristics of the cooling water jacket combined with the previous theoretical data and experience [20,21], the following optimization schemes are proposed:
(1) In view of the uneven flow velocity of each cylinder of the original engine model, the main consideration is to keep the flow velocity of each cylinder as consistent as possible. During the flow of coolant, due to the resistance loss along the way, the flow velocity continues to decrease. So the farther away from the water inlet, the lower the flow velocity is in the water jacket, and the lower the flow into the water jacket at the same time, which affects the cooling effect.
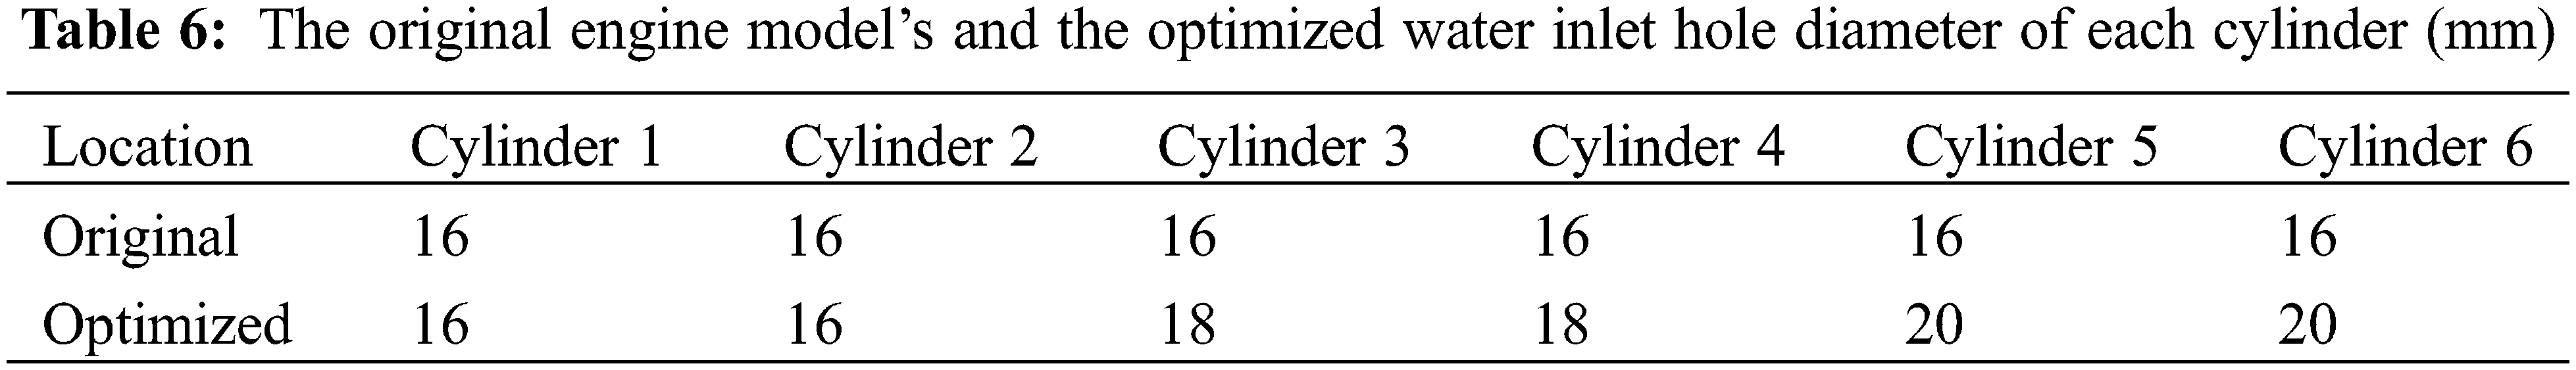
The optimization plan is to adjust the diameter of the water inlet holes on both sides of each cylinder to increase the flow velocity and improve the cooling effect. The optimized positions of the water inlet holes of each cylinder are shown in Fig. 8. The original engine model’s and the optimized scheme of the diameter of the water inlet holes of each cylinder are shown in Table 6.
(2) In view of the low-velocity area problem of the cylinder head water jacket of the original engine model, the optimization plan is to adjust the size of the processing hole at the lower section of the cylinder head water jacket from ø7 to ø10, which is used to strengthen the cooling of the key area of the lower section of the cylinder head water jacket. The location is shown in Fig. 9.
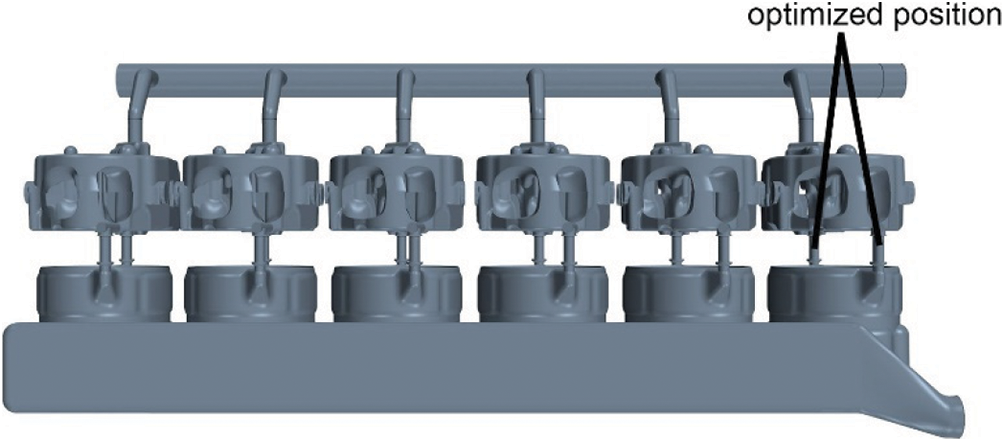
Figure 8: The location of the optimized water inlet holes
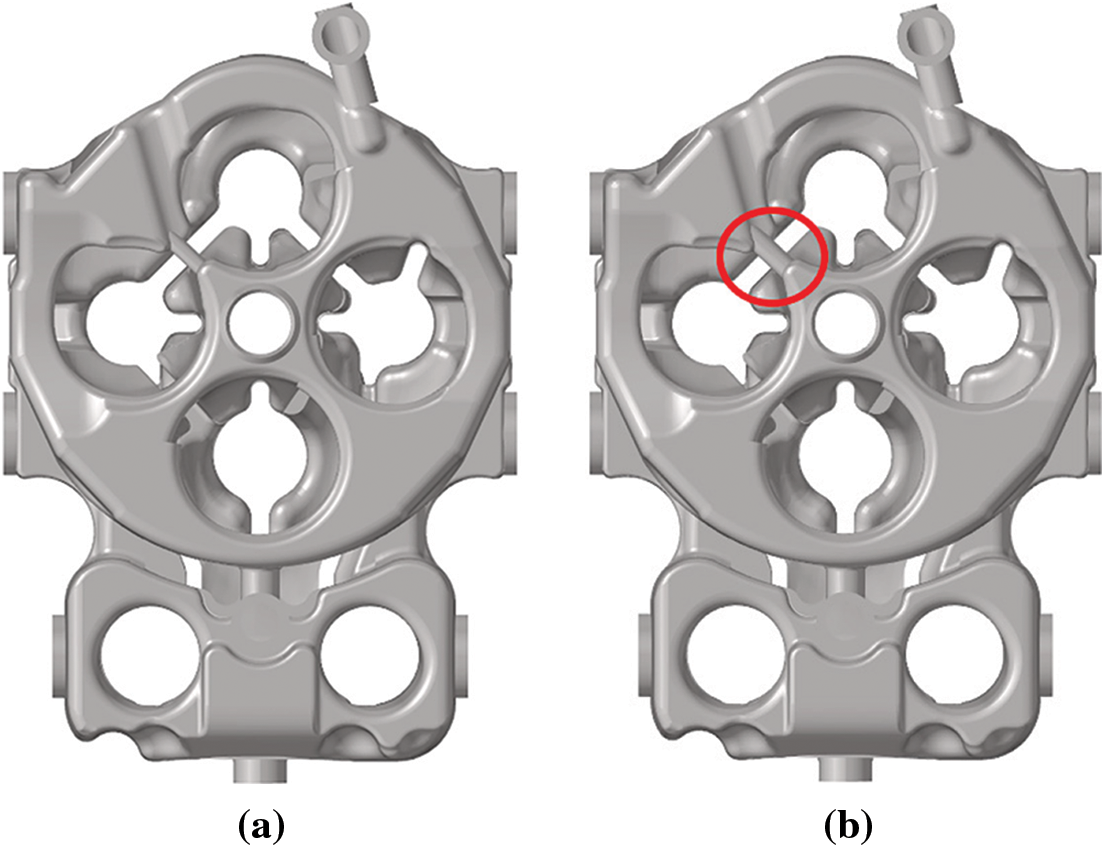
Figure 9: The optimized position of the lower section of the cylinder head water jacket (a) Original (b) Optimized
5.2 Comparative Analysis between Original and Optimized Results
The original engine model’s and optimized water jacket flow velocity distribution cloud diagrams are shown in Fig. 10. It can be seen from the figure that, compared with the original model, the maximum flow velocity of the optimized cooling water jacket is increased by about 0.5 m/s, which is an increase of 3.1%. Through calculations, the average flow velocity of the coolant inside the optimized water jacket is 1.727 m/s, which is greater than the average flow velocity of the original machine model of 1.669 m/s, an increase of about 3.5%. The optimization scheme makes the flow velocity distribution of each cylinder more uniform, and the flow dead zone of Cylinders 5 and 6 of the water distribution pipe has been improved. The flow velocity of the water inlet holes of Cylinders 3 to 6 of the water jacket has been increased, due to the diameter of the water inlet hole increase and the reduced resistance received by the water flow. The flow from the water jacket of the cylinder block to the water jacket of the cylinder head has been improved.
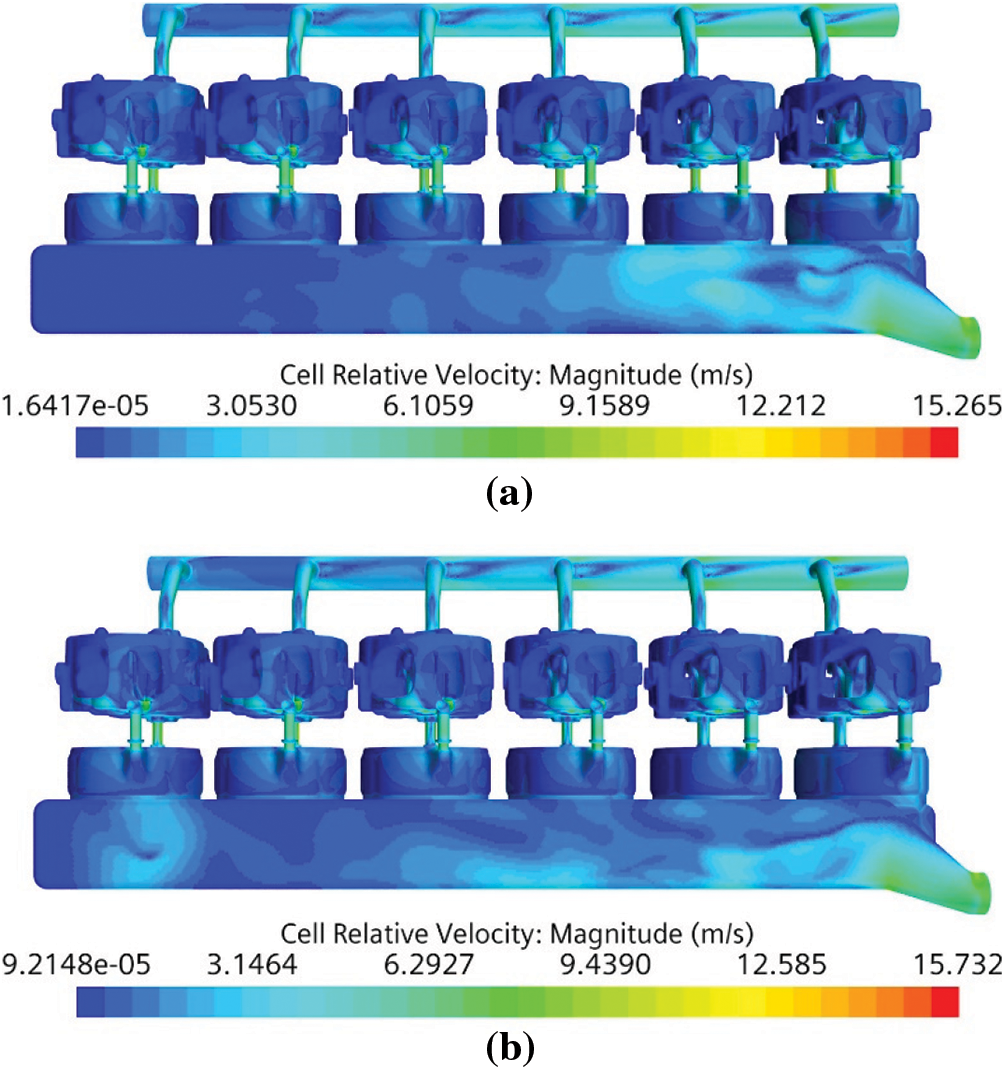
Figure 10: Cloud diagram of flow velocity distribution of cooling water jackets of different schemes (a) Original (b) Optimized
The original engine model’s and optimized plans for the cross-sectional velocity distribution cloud diagram of the lower section of the cylinder head water jacket are shown in Fig. 11. It can be seen from the figure that, compared with the original model, the optimized maxi-mum flow velocity at the lower section of the water jacket of the cylinder head is slightly lower, and the flow conditions of Cylinders 5 and 6 have not changed significantly. This is because the cooling water needs to flow through a long way to Cylinders 5 and 6. Although the diameters of the water inlet holes are increased, the effect on Cylinders 5 and 6 is not significant.
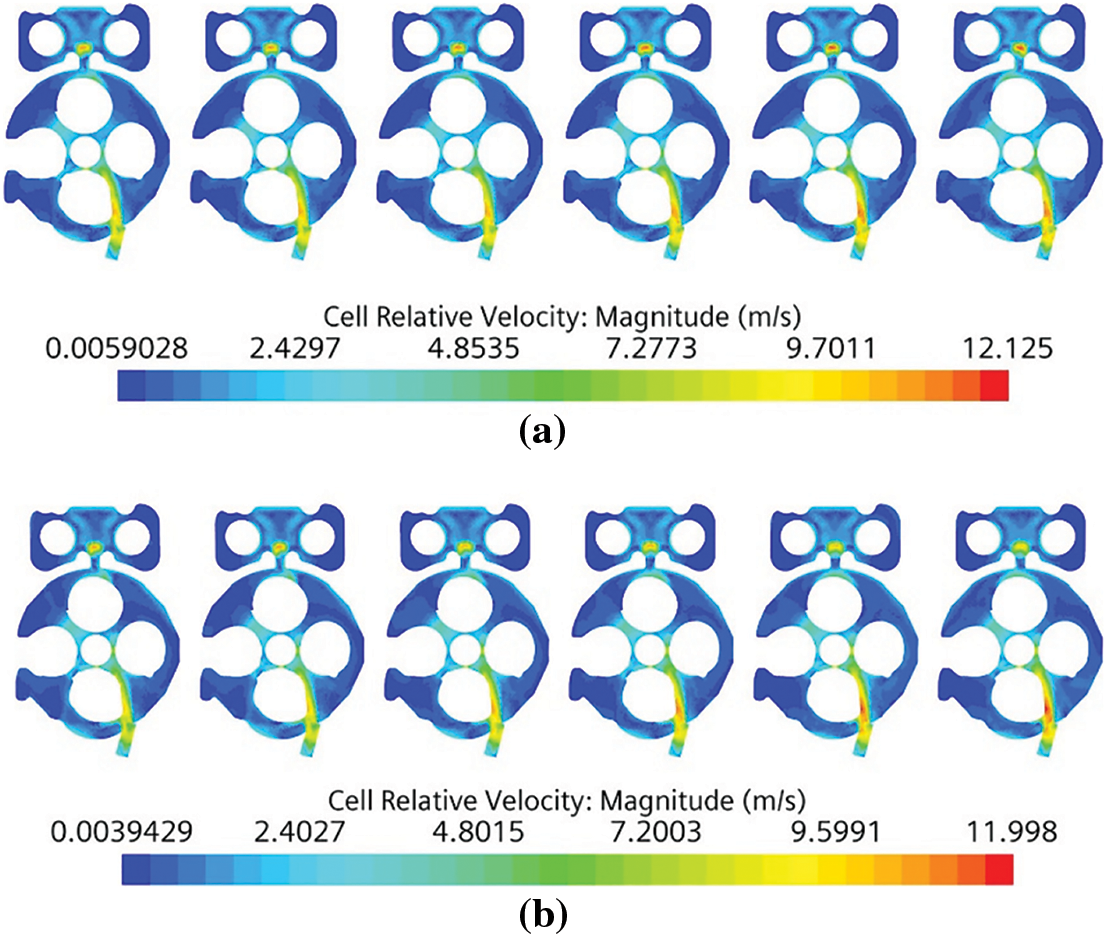
Figure 11: Cloud diagram of the cross-sectional velocity distribution of the lower section of the cylinder head water jacket with different schemes (a) Original (b) Optimized
The coolant flowing into the water jacket of the cylinder head from the water inlet holes of Cylinders 1 to 4 has been significantly enhanced, the low-velocity area of the cylinder head water jacket has been reduced, and the flow uniformity has also been improved. This proves that the optimized solution can achieve the improvement purpose of cooling water.
Based on the CFD simulation calculation of the flow condition of the cooling water jacket of the engine in the STAR-CCM + software, the flow velocity distribution and pressure distribution of the coolant in the cooling water jacket of the original engine model are obtained, which would provide a basis for the optimal design of the cooling water jacket.
The flow velocity of each cylinder of the original engine model is uneven, and the local flow velocity of the water jacket of the cylinder head is too low, which affects the cooling effect. Therefore, two structural optimization schemes are proposed for these two problems. By comparing the calculation results of the original engine model and the calculated results, an optimized scheme was obtained to improve the flow performance of the cooling water jacket.
Acknowledgement: Personally, I would like to thank support from our team members, and the reviews whose constructive and detailed critique contributed to the quality of this paper.
Funding Statement: The authors received no specific funding for this study.
Conflicts of Interest: The authors declare that they have no conflicts of interest to report regarding the present study.
1. Johnson, T., Joshi, A. (2017). Review of vehicle engine efficiency and emissions. SAE Technical Paper, 11(6), 1307–1330. DOI 10.4271/2018-01-0329. [Google Scholar] [CrossRef]
2. Zhao, D. F. (2018). Thermal design optimization and strength analysis of engine cooling water jacket (Master Thesis). Chongqing University, China. [Google Scholar]
3. Jafarabadi, M., Chamani, H., Jazayeri, S. A. (2013). Improvement of a diesel engine water cooling performance through implementation of different cooling designs. ASME 2013 Internal Combustion Engine Division Fall Technical Conference, Dearborn, Michigan, USA. DOI 10.1115/icef2013-19212. [Google Scholar] [CrossRef]
4. Gholinia, M., Pourfallah, M., Chamani, H. R. (2018). Numerical investigation of heat transfers in the water jacket of heavy duty diesel engine by considering boiling phenomenon. Case Studies in Thermal Engineering, 12, 497–509. DOI 10.1016/j.csite.2018.07.003. [Google Scholar] [CrossRef]
5. Fadaei, M., Vafadar, H., Noorpoor, A. (2011). New thermo-mechanical analysis of cylinder heads using a multi-field approach. Scientia Iranica, 18(1), 66–74. DOI 10.1016/j.scient.2011.03.009. [Google Scholar] [CrossRef]
6. Coclite, A., Faruoli, M., Viggiano, A., Caso, P., Magi, V. (2020). Liquid-cooling system of an aircraft compression ignition engine: A CFD analysis. Fluids, 5(2), 17. DOI 10.3390/fluids5020071. [Google Scholar] [CrossRef]
7. Wu, Q. W., He, F. G., Bai, S. Z., Hu, Y. P. (2015). A consideration of boiling heat transfer and optimization of the cooling water jacket of cylinder heads in a diesel engine. Internal Combustion Engine & Powerplant, 32(4), 38–42. [Google Scholar]
8. Fontanesi, S., Giacopini, M. (2013). Multiphase CFD–CHT optimization of the cooling jacket and FEM analysis of the engine head of a V6 diesel engine. Applied Thermal Engineering, 52(2), 293–303. DOI 10.1016/j.applthermaleng.2012.12.005. [Google Scholar] [CrossRef]
9. Zhang, J., Xu, Z., Lin, J., Lin, Z., Wang, J. et al. (2018). Thermal characteristics investigation of the internal combustion engine cooling-combustion system using thermal boundary dynamic coupling method and experimental verification. Energies, 11, 2127. DOI 10.3390/en11082127. [Google Scholar] [CrossRef]
10. Liu, F. S., Min, X. F., Fan, F., Li, X. R., Guo, L. P. (2014). Optimization design of cooling water jacket in diesel engines. Automotive Engineering, 36(6), 728–733. [Google Scholar]
11. Jiang, X. (2017). Research on the flow and heat transfer performance of 6265 diesel engine cooling water system (Master Thesis). Dalian Jiaotong University, China. [Google Scholar]
12. Siemens PLM Software (2019). Simcenter STAR-CCM + User Guide. USA. https://www.siemens.com/mdx. [Google Scholar]
13. Mathur, S. R., Murthy, J. Y. (1997). A pressure-based method for unstructured meshes. Numerical Heat Transfer, Part B: Fundamentals, 31(2), 195–215. DOI 10.1080/10407799708915105. [Google Scholar] [CrossRef]
14. Kajishima, T., Taira, K. (2017). Computational fluid dynamics: Incompressible turbulent flows. Germany: Springer. [Google Scholar]
15. Jones, W. P., Launder, B. E. (1972). The prediction of laminarization with a two-equation model of turbulence. International Journal of Heat and Mass Transfer, 15(2), 301–314. DOI 10.1016/0017-9310(72)90076-2. [Google Scholar] [CrossRef]
16. Jafarabadi, M., Chamani, H., Malakizadi, A., Jazayeri, S. A. (2008). A fast coupled CFD-thermal analysis of a heavy duty diesel engine water cooling system. ASME International Mechanical Engineering Congress and Exposition, vol. 10, pp. 663–670. DOI 10.1115/imece2008-68163. [Google Scholar] [CrossRef]
17. Zhang, B., Zhang, P., Zhang, Z., Yang, S. B., Zeng, F. M. (2021). Numerical simulation of flow field characteristics of the cooling water jacket of a marine diesel engine. E3S Web of Conferences, 261(2), 02040, DOI 10.1051/e3sconf/202126102040. [Google Scholar] [CrossRef]
18. Zhang, Q., Li, N., Wang, Z. M. (2005). CFD analysis of cooling water-jacket in cylinder head for automotive diesel engine. Vehicle Engine, 6, 59–62. [Google Scholar]
19. Zheng, Q. P., Zhang, M. H., Li, S. (2009). Flow analysis in cooling water jacket of engine based on three dimensional CFD technology. Chinese Internal Combustion Engine Engineering, 30(6), 37–40. DOI 10.13949/j.cnki.nrjgc. [Google Scholar] [CrossRef]
20. Kruger, M., Kessler, M. P., Ataídes, R., de la Rosa Siqueira, C., dos Reis, M. V. F. et al. (2008). Numerical analysis of flow at water jacket of an internal combustion engine. SAE Technical Paper, 1. DOI 10.4271/2008-01-0393. [Google Scholar] [CrossRef]
21. Wu, Y. J. (2010). Simulation research on steady flow and heat transfer of car engine cooling water jacket (Master Thesis). Zhejiang University, China. [Google Scholar]
 | This work is licensed under a Creative Commons Attribution 4.0 International License, which permits unrestricted use, distribution, and reproduction in any medium, provided the original work is properly cited. |