| Fluid Dynamics & Materials Processing |
DOI: 10.32604/fdmp.2022.017915
ARTICLE
Optimization of the Air Deck Blasting Parameters on the Basis of the Holmquist-Johnson-Cook Constitutive Model
1School of Civil & Resource Engineering, University of Science and Technology Beijing, Beijing, China
2Beijing General Research Institute of Mining & Metallurgy, Beijing, China
3MCC Construction Research Institute Co., Ltd., Beijing, 100082, China
*Corresponding Author: Zuoming Yin. Email: yinzuoming@xs.ustb.edu.cn
Received: 16 July 2021; Accepted: 26 August 2021
Abstract: The present study considers the so-called air deck blasting, one of the most commonly used techniques for the improvement of blasting efficiency in mining applications. In particular, it aims to improve the operating conditions of large-scale equipment, increase the efficiency of the slope enlarging process, and reduce the mining cost. These objectives are implemented through a two-fold approach where, first, a program for slope enlarging based on the middle air-deck charge blasting-loosening technology is proposed, and second, the physical mechanism responsible for the stress wave attenuation in the rock is analyzed in the framework of a Holmquist–Johnson–Cook constitutive model. Field test results verify that the proposed approach is highly efficient and economical when used in medium-hard rock blasting and thus provides a basis for the practical implementation of slope enlargement for high benches in Open-Pit Mines.
Keywords: Air deck blasting parameters; holmquist–johnson–cook constitutive model; fluid-structure coupling; loosening blasting
Given that rocks are non-uniform materials, their fracture process depends on the strain rate, and their air-deck charge has a complicated mechanism and flexible setting [1–6]. Therefore, studies on the change process of the stress field around the blast hole that used the dynamic crack propagation model have theoretical significance and an engineering value. The numerical simulation method has been utilized to research the factors that insluence dynamic crack propagation model. These factors include the loading rate of the explosive load, distance from the blast hole to the free boundary, and size of the air deck in the blast hole [7–15]. The stress wave or initial velocity is adopted as an input, and analyzed step by step in accordance with the time step. The influence of mass and acceleration on the mechanical balance is considered in each step [16]. Moreover, the elastic dynamic finite element program has been used for stress analysis. The maximum tensile stress criterion and the Mohr–Coulomb criterion have also been employed to determine whether an element is damaged and obtain the dynamic crack propagation process of the rock material under the explosive load of the air-deck charge [17].
Typically, metal mines have a bench height of 10–12 m. There is a problem in Open-Pit Mine is that when second-phase slope enlargment uses the conventional step-by-step, near-slope method, the temporary slope becomes steep, the slope enlargment site becomes narrow, and the operation safety of large-scale equipment is difficult to guarantee. Therefore, a technical solution for the slope enlargment of a 24 m high bench is introduced in this study. The proposed solution addresses the technical problem of high-efficiency and low-cost blasting of a 24 m high bench in the case of a deep vertical hole with a large-diameter [18–22].
A large air-deck charge structure and a large density coefficient are usually utilized to arrange blast holes. However, the blast hole has no charge in the middle, making the explosion energy insufficient and the production of large rocks easy [23]. The Open-Pit has undergone the 24 m high-level blasting tests in its early stages. Although several useful results have been achieved, promoting the use of such tests in mines remains problematic. Specifically, the slope enlargment of the 24 m-high bench still needs to address three technical problems [24]. First, the perforation depth of a domestic ordinary roller drill cannot work for the large diameter drilling of the 24 m-high benches directly. Second, the slope of the bench is limited. With the increase in step height, the resistance line of the chassis on the front row of blast holes is doubled. Lastly, the unit consumption of explosives become much higher than ordinary [25–28].
The upper air-deck charge has been partially studied in the early stage, and it has been promoted and applied in some working conditions, and good results have been achieved [29]. This study uses LS-DYNA to investigate the stress distribution generated by columnar charge with an air-deck charge structure on the middle. A fluid-structure coupling simulation is conducted on a 24 m-high bench blasting under this condition to analyze the stress of the blasted rock mass and provide a reference for on-site high-bench blasting tests.
2 Holmquist–Johnson–Cook Theoretical Model
Holmquist, Johnson, and Cook proposed the Holmquist–Johnson–Cook (HJC) damage constitutive model to describe the nonlinear deformation and fracture characteristics of engineering and geological materials under large strain and high variability. This model considers high hydrostatic pressure, high strain rate, and the material damage effect [30–35].
The HJC strength model is described by the characteristic equivalent stress, as shown in Fig. 1. It is expressed in this study as follows:
where
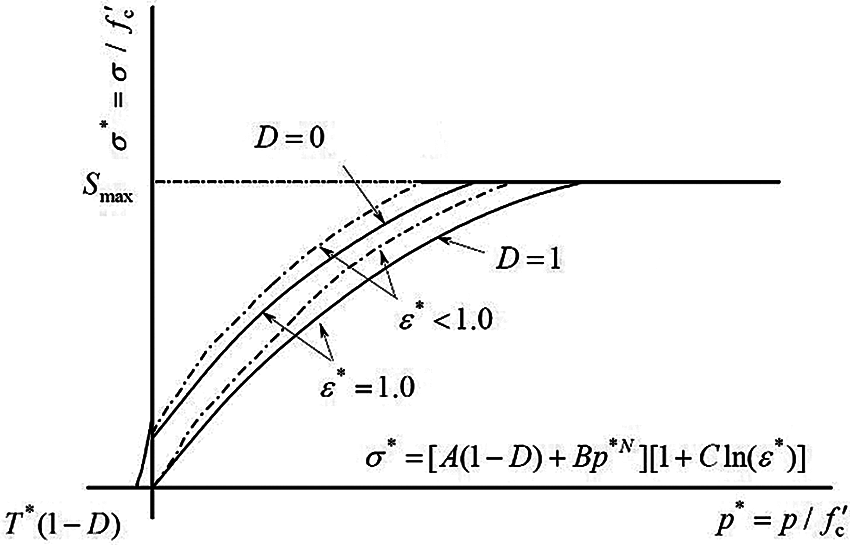
Figure 1: HJC strength model
The damage in the HJC model is formed by the accumulation of plastic strain. Plastic strain has two parts: shear deformation plastic strain (equivalent plastic strain) and volume compressive plastic strain, as shown in Fig. 2. The damage model is expressed as follows:
where
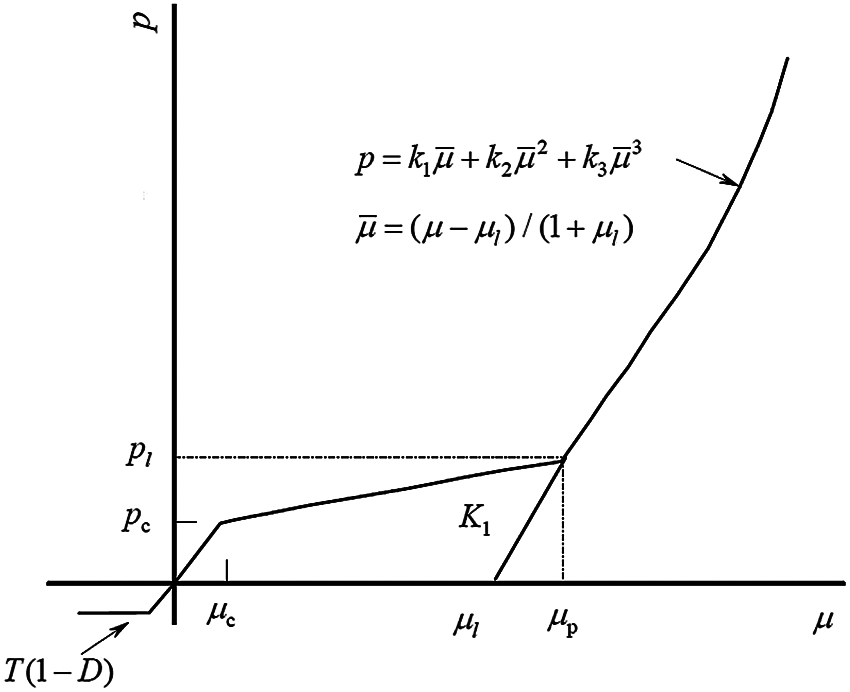
Figure 2: HJC damage model
The state equation of the HJC model is shown in Fig. 3. It is used to describe the relationship between hydrostatic pressure and volumetric strain. It is divided into three stages: elastic compression, compaction deformation, and post-compaction deformation.
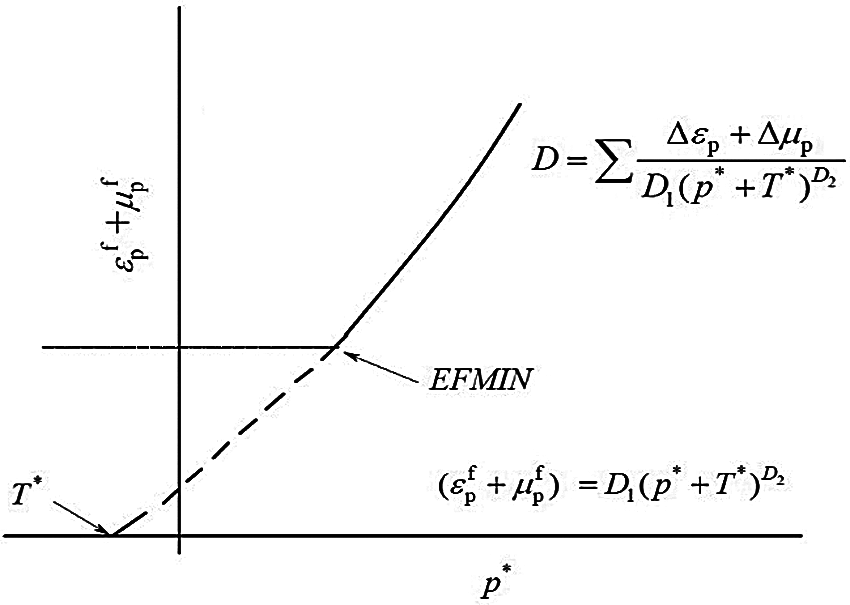
Figure 3: State equation of the HJC model
The first stage (P < Pc) involves the linear elastic zone. Hydrostatic pressure has a linear relationship with the volumetric strain, and the relationship is expressed as follows:
The second stage (Pc ≤ P ≤ Pl) involves the plastic transition zone. At this time, the voids in the material are gradually compressed to produce plastic deformation. The loading and unloading equations are as follows:
Loading section:
Uninstall section:
The third stage (P > Pl) involves the high-compression zone. At this stage, the material has been completely broken. The loading and unloading equations are as follows:
Loading section:
Uninstall section:
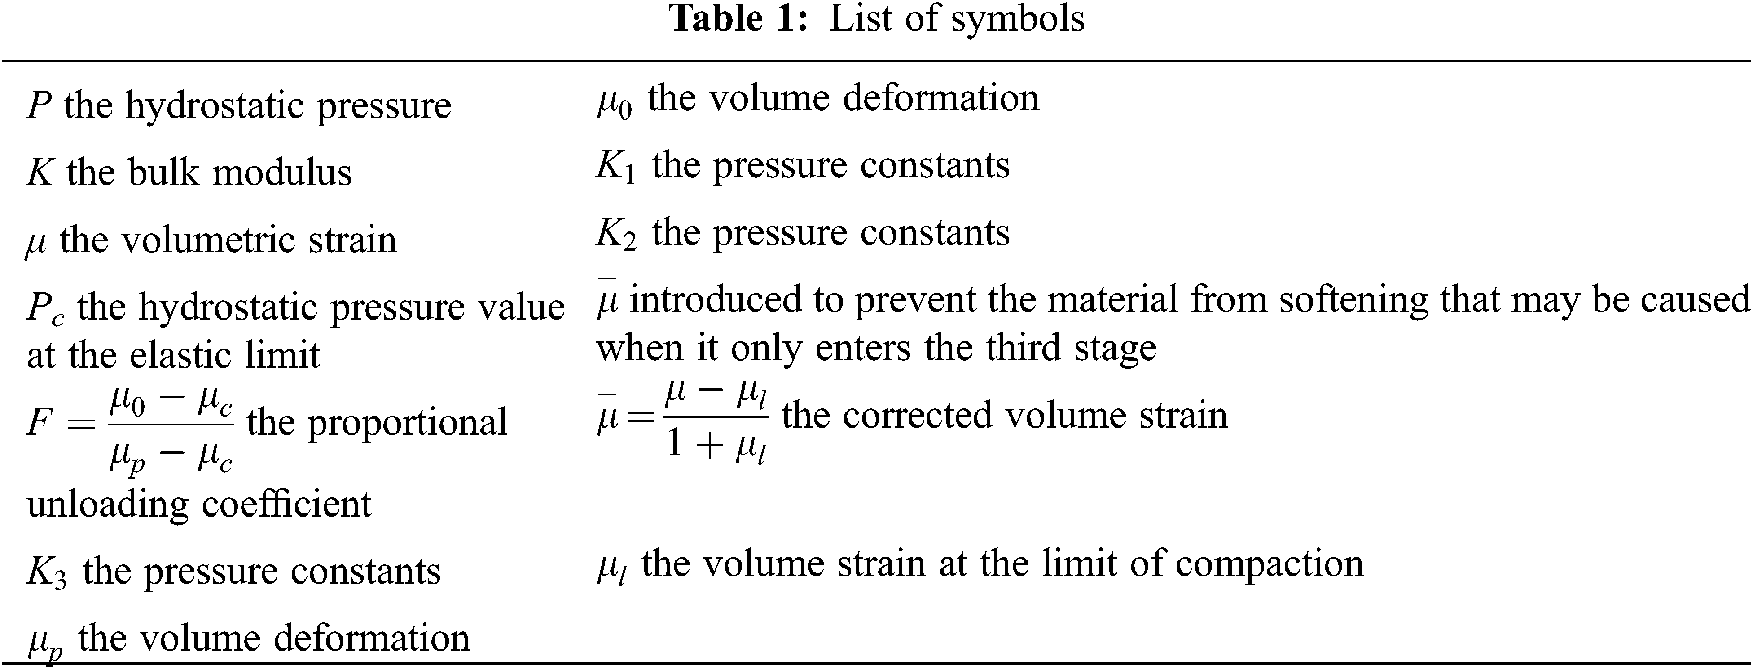
where the meanings of the symbols are listed in Table 1.
3 HJC Model Parameters and Determination Methods
A cylindrical specimen with a diameter of 40 mm and height of 80 mm was used to measure density via the volumetric method. Under the same water-bearing condition, each group of test pieces was divided into three pieces, and the density of the test pieces was measured. The average density of each group of samples was obtained as the rock density. The density ρ of dolomite was 2,950 kg/m3. Afterward, the specimen was subjected to a uniaxial compression test. On the basis of the test results, the uniaxial compressive strength (UCS) of the specimen was determined to be 159.65 MPa, elastic modulus E was 24.16 GPa, and Poisson’s ratio v was 0.238. The final failure form of the specimen is shown in Fig. 4.
Figure 4: Rock failure in the uniaxial compression test
The rock specimen had a diameter of 40 mm, height of 20 mm, and a disk shape. It was placed horizontally between the pressure plates of the press. A hard steel wire mat with a diameter of 2 mm was also placed between the upper and lower bearing plates. The cushion strip was perpendicular to the symmetry axis of the test piece. The cushion strip changed the applied pressure into a linear load and made the test piece produce a tensile force perpendicular to the direction of the upper and lower loads. The test piece was damaged in tension along the radial direction (Fig. 5). On the basis of the test result, the tensile strength (TS) of dolomite was 7.84 MPa.
Figure 5: Rock failure in the Brazilian split test
Elastic modulus, shear modulus, and other measures were calculated by using the formula:
Figure 6: Rock failure in the triaxial compression test
3.2 Strain Rate Effect Parameter
The SHPB experimental system was used to measure the uniaxial dynamic strength of sandstone under different strain rates. The result was combined with the measured quasi-static uniaxial compressive strength to obtain the dimensionless equivalent stress of the sandstone specimen at different strain rates as follows:
Without considering the damage and rate effects, the strong expression of the HJC model becomes
On the basis of plastic yield surface theory, if damage and rate effects are not considered, then the HJC model and the cap model would pass through two points of pure shear and uniaxial compression on the compression meridian plane, as shown in Fig. 7. The following derivation establishes the relationship between the cap model parameters and the characteristic viscosity strength parameters.
Figure 7: Schematic of the blast hole layout
The cap model has two stress tensor invariants: the first stress tensor invariant
B and N are the characteristic pressure hardening coefficient and pressure hardening coefficient, respectively. A universal testing machine was used to perform a triaxial compression experiment, which
3.4 Pressure, Damage, and Software Parameters
The damage parameter is expressed as
4 Numerical Simulation Research on the Air-Deck Charge of the 24 m-High Bench Blasting
The high bench blasting was analyzed using the HJC constitutive model. The explosive and air results employed a multi-material ALE algorithm, and the rock used the LAGRANGE algorithm. The fluid-solid coupling algorithm reflects the stress transfer and attenuation between explosives, air, and rocks.
The basic principle is to combine the explosive detonation research results with the explosive gas state equation to describe the dynamic expansion of the entire explosion cavity. LS-DYNA can directly simulate the explosion process of high-energy explosives. After igniting the explosive, the explosive load is generated to act on the surrounding medium and the pressure at one point in the explosive source at any time is expressed as
where P is the explosion pressure;
With regard to explosive model selection, *MAT_HIGH_EXPLOSIVE_BURN high-performance explosive material was used to simulate the detonation of explosives, several of the parameters are shown in Table 4. The JWL equation of state was used to simulate the entire detonation process. In the numerical simulation of the explosion field, due to the large pressure fluctuation range of the detonation product, a state equation that is suitable for all pressure ranges is difficult to find. In 1965, Kury et al. [36] proposed the JWL equation based on the work of Jones and Wilkins. Its general form is
where
The parameters of the air model (*MAT_NULL) and the state equation (*EOS_LINEAR_ POLYNOMIAL) are shown in Table 5. Air density was taken as 1.225 kg/m3, and the pressure was simulated using a linear polynomial equation of state (*EOS-LINEAR-POLYNOMIAL). The equation is expressed as
where
4.2 Numerical Simulation Results and Analysis of the Air Deck in the Middle Part
The upper and lower explosives were detonated at the same time. After the detonation, the stress wave spread around in the form of a spherical wave. The rocks around the explosion point were destroyed first, resulting in a cavity. The load stress on the blast hole wall at the blasting source reached the maximum value of 1.3 Gpa, as shown in Fig. 8. At 6 ms, the bottom of the columnar charge completed the detonation and met the upper part of the charge in middle air-deck, and the mutual superposition effect was obvious. With the propagation of the detonation wave, the columnar charge reaction was completed at 13 ms, and the stress wave expanded in an ellipsoidal shape. At the same time, the detonation wave generated by the explosion of the ammonium explosive propagated upward and downward along the blast hole, which characterized the detonation transfer process of the ammonium explosives. At 18 ms, the detonation wave was transmitted to the bottom and top of the blast hole, and the wavefront of the explosion stress wave was centered on the blast hole and expanded outward in an ellipsoid shape, as shown in Fig. 8d.
Figure 8: Stress cloud diagram of the front row (a) t = 0 ms (b) t = 6 ms (c) t = 13 ms (d) t = 18 ms
At 25 ms, the second blast hole bagan to detonate, and the initial process of detonation was similar to that of the first blast hole. At 38 ms, the reaction of the second blast hole was completed, and the stress of the first blast hole attenuated to zero; they acted together on the rock between the two blast holes. As the stress spread, the stresses of the two blast holes in the front row was transmitted to all parts of the bench and superimposed, thereby destroying the rock and creating a free surface for the holes in the back row. As shown in Fig. 9.
Figure 9: Stress cloud diagram of the front row. (a) t =25 ms (b) t = 31 ms (c) t = 37 ms (d) t = 42 ms
The two stress cloud diagrams of the front row of holes show that the position where the stresses were superimposed occupied most of the slope of the entire bench, indicating that most of the rock at the slope of the bench was destroyed with a good crushing effect.
5 Field Blasting Test on a 24 m-High Bench
The design of the high bench blasting used vertical drilling. Given the large density factor, the hole spacing was 18 m, and the row spacing was 6 m. The method of hole-by-hole initiation was adopted, and the interval time difference was 25 ms. The shape of the muck pile after blasting is shown in Fig. 10. The blasting effect was better, and the degree of looseness was higher.
Figure 10: On-site muck pile shape
(1) The analysis results obtained from the effective stress–time diagram of the air-deck charge structure showed that when the air-deck was in the hole, the effective stress peak value of the stress monitoring point on the slope surface was greater than the rock tensile strength. The blasting effect of the charge structure with the air deck in the hole produced good results.
(2) The comparison of the stress cloud diagrams and the effective stress of the rock at the observation point indicated that the middle air-deck charge exerted a good effect on different blast holes.
(3) The comparison and analysis results of the three blast holes showed that when the air-desk was in the hole, the gas pressure was balanced, and the action time was prolonged. This condition reduced the use of explosives and improved the bottom rock shattering effect.
(4) The application of the air-deck charge structure in the hole improved the quality of loose blasting, reduced the bulk rate, and decreased the appearance of roots. The cost of bench blasting was reduced and achieved good results in Open-Pit Mine.
Acknowledgement: The author would like to thank the Barun Mining Co., Ltd. of Baotou Steel Group, China.
Funding Statement: The authors received no specific funding for this study.
Conflicts of Interest: The authors declare that they have no conflicts of interest to report regarding the present study.
1. Aler, J., Mouza, J. D., Arnould, M. (1996). Measurement of the fragmentation efficiency of rock mass blasting and its mining applications. International Journal of Rock Mechanics & Mining Sciences & Geomechanics Abstracts, 33(2), 125–139. DOI 10.1016/0148-9062(95)00054-2. [Google Scholar] [CrossRef]
2. Chi, L. Y., Zhang, Z. X., Aalberg, A., Yang, J., Li, C. C. (2018). Fracture processes in granite blocks under blast loading. Rock Mechanics and Rock Engineering, 52(3), 853–868. DOI 10.1007/s00603-018-1620-0. [Google Scholar] [CrossRef]
3. Chi, L. Y., Zhang, Z. X., Aalberg, A., Li, C. C. (2019). Experimental investigation of blast-induced fractures in rock cylinders. Rock Mechanics and Rock Engineering, 52(8), 2569–2584. DOI 10.1007/s00603-019-01749-0. [Google Scholar] [CrossRef]
4. Zhang, Z. X., Hou, D. F., Guo, Z., He, Z. (2020). Laboratory experiment of stemming impact on rock fragmentation by a high explosive. Tunnelling and Underground Space Technology, 97, 103257. DOI 10.1016/j.tust.2019.103257. [Google Scholar] [CrossRef]
5. Melnikov (1962). Charge construction influence on explosion operations efficiency. Reports of the YI science symposium on drilling, explosives, explosion operations and study of physical and mechanical properties of rocks. Rolla, USA: Gosgortekhizdat. [Google Scholar]
6. Melnikov, N. V., Marchenkov, L. N. (1971). Effective methods of application of explosion. 12th U.S. Symposium on Rock Mechanics, pp. 359–378. New York, AIME. [Google Scholar]
7. Fourney, W. L., Barker, D. B., Holloway, D. C. (1981). Model studies of explosive well stimulation techniques. International Journal of Rock Mechanics and Mining Sciences & Geomechanics Abstracts, 18(2), 113–127. DOI 10.1016/0148-9062(81)90737-3. [Google Scholar] [CrossRef]
8. Little, T. N. (1991). Design of blast using an expert system. ACADS, 1991 Conference, pp. 6–11. Perth. [Google Scholar]
9. Bahadori, M., Amnieh, H. B. (2017). Numerical analysis of the primer location effect on ground vibration caused by blasting. International Journal of Mining and Geo-Engineering, 51(1), 53–62. DOI 10.22059/ijmge.2017.62153. [Google Scholar] [CrossRef]
10. Yarbrough, D. W., Anderson, R. W. (1993). Use of radiation control coatings to reduce building air-conditioning loads. Energy Sources, 15(1), 59–66. DOI 10.1080/00908319308909011. [Google Scholar] [CrossRef]
11. Lou, X., Wang, Z., Chen, B., Yu, J. (2018). Theoretical calculation and experimental analysis on initial shock pressure of borehole wall under axial decoupled charge. Shock and Vibration, 2018(2), 1–14. DOI 10.1155/2018/7036726. [Google Scholar] [CrossRef]
12. Soni, A. K., Murthy, V., M. S. R., Raina, A. K. (2015). Estimating flyrock distance in bench blasting through blast induced pressure measurements in rock. International Journal of Rock Mechanics & Mining Sciences, 76, 209–216. DOI 10.1016/j.ijrmms.2015.03.002. [Google Scholar] [CrossRef]
13. Yang, G. L., Yang, R. S., Huo, C., Che, Y. L. (2011). Numerical simulation of air-deck slotted charge blasting. Advanced Materials Research, 143–144, 787–791. DOI 10.4028/www.scientific.net/AMR.143-144.787. [Google Scholar] [CrossRef]
14. Balagansky, I. A., Stepanov, A. A. (2016). Numerical simulation of composition b high explosive charge desensitization in gap test assembly after loading by precursor wave. Shock Waves, 26(2), 109–115. DOI 10.1007/s00193-015-0584-1. [Google Scholar] [CrossRef]
15. Yi, C. P., Johansson, D., Greberg, J. (2018). Effects of in-situ stresses on the fracturing of rock by blasting. Computers and Geotechnics, 104, 321–330. DOI 10.1016/j.compgeo.2017.12.004. [Google Scholar] [CrossRef]
16. Sang, C. (2004). Influence of the applied pressure waveform on the dynamic fracture processes in rock. International Journal of Rock Mechanics and Mining Sciences, 41(5), 771–784. DOI 10.1016/j.ijrmms.2004.02.006. [Google Scholar] [CrossRef]
17. Stacey, T. R. (1981). A simple extension strain criterion for fracture of brittle rock. International Journal of Rock Mechanics & Mining Sciences & Geomechanics Abstracts, 18(6), 469–474. DOI 10.1155/2020/8891248. [Google Scholar] [CrossRef]
18. Johansson, D., Ouchterlony, F. (2013). Shock wave interactions in rock blasting: The use of short delays to improve fragmentation in model-scale. Rock Mechanics & Rock Engineering, 46, 1–18. DOI 10.1007/s00603-012-0249-7. [Google Scholar] [CrossRef]
19. Chakraborty, T., Mishra, S., Loukus, J., Halonen, B., Bekkala, B. (2016). Characterization of three Himalayan rocks using a split Hopkinson pressure bar. International Journal of Rock Mechanics and Mining Sciences, 85(1), 112–118. DOI 10.1016/j.ijrmms.2016.03.005. [Google Scholar] [CrossRef]
20. Mishra, S., Khetwal, A., Chakraborty, T. (2019). Dynamic characterisation of gneiss. Rock Mechanics and Rock Engineering, 52(1), 61–81. DOI 10.1007/s00603-018-1594-y. [Google Scholar] [CrossRef]
21. Peng, Y., Zhou, W., Lu, W., Ming, C., Zhou, C. (2016). Simulation of bench blasting considering fragmentation size distribution. International Journal of Impact Engineering, 90, 132–145. DOI 10.1016/j.ijimpeng.2015.11.015. [Google Scholar] [CrossRef]
22. Asprone, D., Cadoni, E., Prota, A. (2009). Dynamic behavior of a Mediterranean natural stone under tensile loading. International Journal of Rock Mechanics and Mining Sciences, 46(3), 514–520. DOI 10.1016/j.ijrmms.2008.09.010. [Google Scholar] [CrossRef]
23. Cadoni, E. (2010). Dynamic characterization of orthogneiss rock subjected to intermediate and high strain rates in tension. Rock Mechanics and Rock Engineering, 43(6), 667–676. DOI 10.1007/s00603-010-0101-x. [Google Scholar] [CrossRef]
24. Gao, G., Yao, W., Xia, K. (2015). Investigation of the rate dependence of fracture propagation in rocks using digital image correlation (DIC) method. Engineering Fracture Mechanics, 138(1), 146–155. DOI 10.1016/j.engfracmech.2015.02.021. [Google Scholar] [CrossRef]
25. Gao, G., Huang, S., Xia, K. (2015). Application of digital image correlation (DIC) in dynamic notched semi-circular bend (NSCB) tests. Experimental Mechanics, 55(1), 95–104. DOI 10.1007/s11340-014-9863-5. [Google Scholar] [CrossRef]
26. Xing, H. Z., Zhang, Q. B., Braithwaite, C. H. (2017). High-speed photography and digital optical measurement techniques for geomaterials: Fundamentals and application. Rock Mechanics and Rock Engineering, 50(6), 1611–1659. DOI 10.1007/s00603-016-1164-0. [Google Scholar] [CrossRef]
27. Yin, Z., Ma, H., Hu, Z. (2014). Effect of static-dynamic coupling loading on fracture toughness and failure characteristics in marble. Journal of Engineering Science & Technology Review, 7(2), 169–174. DOI 10.25103/jestr.072.25. [Google Scholar] [CrossRef]
28. Chen, R., Li, K., Xia, K. (2016). Dynamic fracture properties of rocks subjected to static pre-load using notched semi-circular bend method. Rock Mechanics and Rock Engineering, 49(10), 3865–3872. DOI 10.1007/s00603-016-0958-4. [Google Scholar] [CrossRef]
29. Yin, Z. M., Wang, X. G., Wang, D. S., Dang, Z. H., Bi, J. H. (2021). Analysis and application of stress distribution in 24-m high bench loosening blasting with axially uncoupled charge structure in Barun Open-Pit Mine. IOP Conference Series: Earth and Environmental Science, vol. 804, 22059. [Google Scholar]
30. Kai, L., Wu, C. Q., Li, X. B., Li, Q. Y. (2020). A modified hjc model for improved dynamic response of brittle materials under blasting loads. Computers and Geotechnics, 123(3), 103584. DOI 10.1016/j.compgeo.2020.103584. [Google Scholar] [CrossRef]
31. Weerheijm, J., Doormaal, J. (2007). Tensile failure of concrete at high loading rates: new test data on strength and fracture energy from instrumented spalling tests. International Journal of Impact Engineering, 34(3), 609–626. DOI 10.1016/j.ijimpeng.2006.01.005. [Google Scholar] [CrossRef]
32. Polanco-Loria, M., Hopperstad, O. S., Børvik, T., Berstad, T. (2008). Numerical predictions of ballistic limits for concrete slabs using a modified version of the HJC concrete model. International Journal of Impact Engineering, 35(5), 290–303. DOI 10.1016/j.ijimpeng.2007.03.001. [Google Scholar] [CrossRef]
33. Kong, X., Fang, Q., Wu, H., Peng, Y. (2016). Numerical predictions of cratering and scabbing in concrete slabs subjected to projectile impact using a modified version of hjc material model. International Journal of Impact Engineering, 95(Sep.), 61–71. DOI 10.1016/j.ijimpeng.2016.04.014. [Google Scholar] [CrossRef]
34. Du, Y., Wei, J., Liu, K., Huang, D., Yang, B. (2020). Research on dynamic constitutive model of ultra-high performance fiber-reinforced concrete. Construction and Building Materials, 234, 117386. DOI 10.1016/j.conbuildmat.2019.117386. [Google Scholar] [CrossRef]
35. Lei, L., Chen, W., Li, H., Shi, S. (2020). Numerical simulation of fire-smoke diffusion caused by vehicles in a tunnel. Fluid Dynamics & Materials Processing, 16(5), 837–856. DOI 10.32604/fdmp.2020.09631. [Google Scholar] [CrossRef]
36. Kury, J. W., Honig, H. C., Lee, E. L., Mcdonnel, J. L., Wilkins, M. L. (1965). Metal acceleration by chemical explosive. Fourth Symposium (International) on Detonation, pp. 3–13. Washington DC, Office of Naval Research-Department of the Navy (ARC-126). [Google Scholar]
 | This work is licensed under a Creative Commons Attribution 4.0 International License, which permits unrestricted use, distribution, and reproduction in any medium, provided the original work is properly cited. |