| Fluid Dynamics & Materials Processing |
DOI: 10.32604/fdmp.2022.017382
ARTICLE
Analysis of the Heat Transfer Efficiency of an Automobile Engine under Different Grille Opening and Closing Conditions
College of New Energy Vehicles, Jingzhou Institute of Technology, Jingzhou, 434020, China
*Corresponding Author: Jian Song. Email: kyoomann@163.com
Received: 06 May 2021; Accepted: 05 July 2021
Abstract: Computational Fluid Dynamics is used to assess the thermal (heat transfer) performances of an automobile engine considering different grille opening and closing degrees. For this purpose the entire vehicle is modelled and three fundamental aspects are examined, namely, the open area of the air intake grille, the position of the upper and lower grilles and their shape. The results show that the opening area and position of the grille have some influence also on the aerodynamic characteristics of the automobile. With an increase in the opening angle of the grille, the CD (Drag Coefficient) value of the whole vehicle becomes higher. When the air intake grille of the car is fully open or closed, the CD value is 0.35434 or 0.31777, respectively, that is, the flow resistance in the engine compartment accounts for 10.32% of the CD value for the whole automobile.
Keywords: Air intake grille; opening and closing degree; automobile engine; heat transfer function; simulation and optimization
The automobile has entered the ordinary people’s family as a common means of transportation [1], and its application has been popularized. In 2016, the volume of automobile shipments kept growing, and the annual automobile production and sales exceeded 28 million, making the proportion of the automobile industry in the pillar industry of the national economy high all the time. Due to the continuous popularization of automobiles and the improvement of people’s living standards, nowadays, every household basically uses cars as one of the main travel tools; then, people’s requirements for cars are not only limited to travel, but also focus more on the performance indexes of the vehicle. This makes the design of the car more and more personalized and detailed. Meanwhile, the emergence of the oil crisis has put forward new requirements for the design and development of modern vehicles. The design of the automobile should focus on the performance index of the automobile, together with some energy and environmental problems. The increase in car ownership will emit more pollutants [2], thus bringing great negative pressure to the ecological environment and people’s lives. Hence, the research on how to improve fuel economy becomes increasingly urgent, and promotes the research work of automobile drag reduction and energy saving.
Different opening areas, positions and forms of grille influence the wind resistance and engine compartment heat dissipation [3]. Among them, the opening area directly indicates that different air intake and heat dissipation effects can be obtained by controlling the effective opening area of the grille. For small flow demand, part of the grille can be closed to make the vehicle obtain good fuel economy. Reasonable structure design and control make the gas flow more reasonable, reduce the wind resistance of the car under the premise of not letting the engine overheat under long-time driving, and further improve the power and economy of the vehicle. The research of active air intake grille in foreign countries has reached the product stage. Hoback et al. found that FORD Focus’s active closing system of air intake grille can achieve 90° angle. 15 different opening states can be realized by different air intake requirements, which greatly improves the power and economy of the model [4]. There are also Buick Lacrosse eAssist, BMW 530i, Ford Yihu and other models with active air intake grille. The application of this technology in multiple foreign brands and models proves that the active air intake grille has great value. The exploration and research of active air intake grille start relatively late, and it has been staying in the theoretical stage. In recent years, there have been sporadic research results in patents and papers. Wu Baozhong of Tianjin Bodun Electronics Co., Ltd. (China) and Li Haiyan of Beijing HiRain Technologies Co., Ltd., (China) have studied and applied for relevant patents on the active air intake grille device [5].
The method of computer numerical simulation technology can visualize the velocity field and temperature field of the whole vehicle flow field, and calculate the CD (Drag Coefficient) value of the whole vehicle under different grille structures, which facilitates the data reading and analysis. In a word, there are still multiple deficiencies in the research of heat transfer function of automotive engine, so the further theoretical and practical research of active grille air intake is still needed.
2 Model Construction of Active Air Intake Grille
2.1 Research Framework of Active Air Intake Grille
Based on the professional commercial CFD (computational fluid dynamics) analysis software Fluent, the method of numerical simulation technology [6] is adopted to study the influence of grille structure parameters on vehicle wind resistance and engine compartment heat dissipation [7]. The detailed data of the flow field outside the cabin are compared and analyzed. Fig. 1 displays the research framework of the active air intake grille.
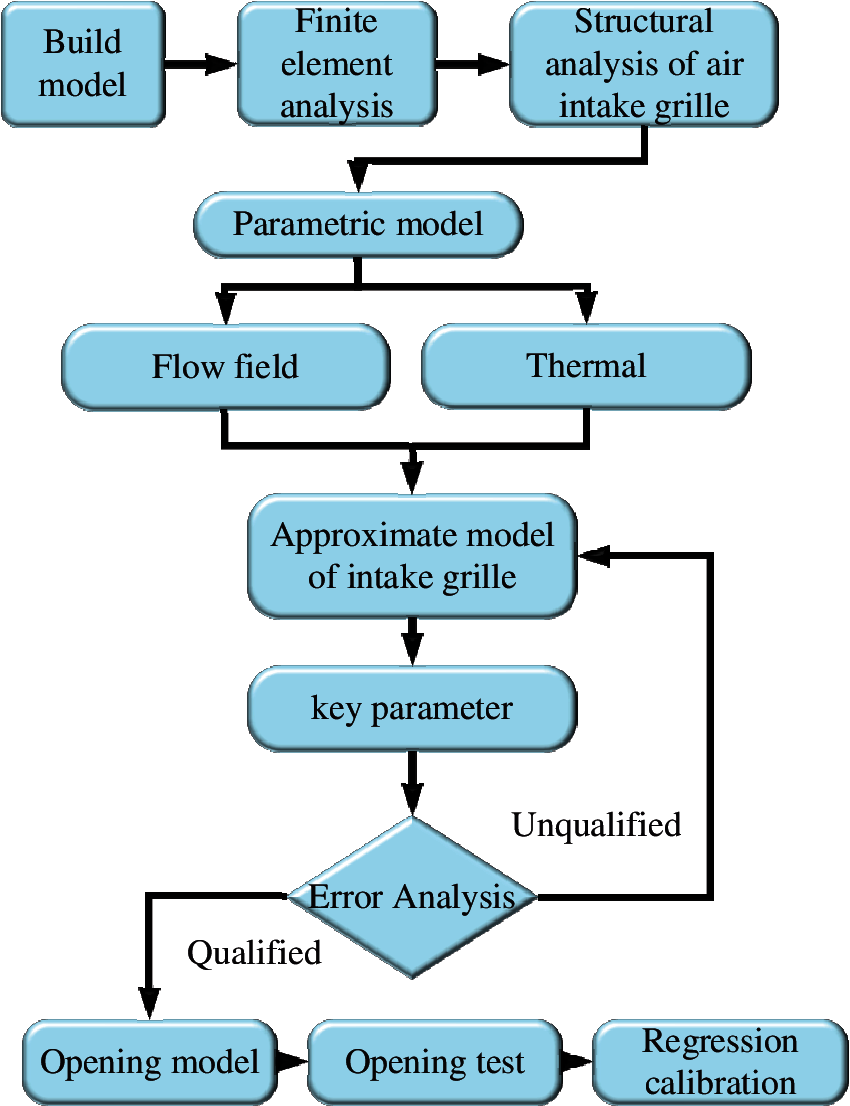
Figure 1: Research framework of active air intake grille
2.2 Governing Equations of Fluid Flow and Heat Transfer
CFD is the product of the combination of modern fluid mechanics, numerical mathematics and computer science, which is a cross science with strong vitality. It approximately expresses the integral and differential terms in the governing equations of fluid mechanics as discrete algebraic forms, making them become algebraic equations. Then, it solves these discrete algebraic equations by computer to obtain the numerical solution at discrete time/space points [8]. For CFD and related computational heat transfer, the principle of computational combustion is to solve the nonlinear simultaneous differential equations of mass, energy, component, momentum and user-defined scalar by numerical method. The solution results can predict the details of flow, heat transfer, mass transfer, combustion and other processes, and become a powerful tool for process device optimization and amplification quantitative design. The basic characteristics of CFD are numerical simulation and computer experiment. Based on the basic physical theorems, CFD replaces the expensive fluid mechanics experimental equipment to a great extent, and exerts a great impact on scientific research and engineering technology. The general structure of CFD software consists of pre-processing, solver and post-processing, which have their own unique functions. The pre-processing functions include establishing geometric model and dividing network. The functions of the solver include: a. determining the control equation of CFD method; b. selecting the discretization method for discretization; c. selecting numerical calculation method; d. entering relevant parameters. At present, the mainstream CFD software includes CFX, Fluent, and Phoenics. The theoretical basis of CFD is the three equations of fluid mechanics, which can explain and describe fluid motion [9,10].
(1) Mass-conservation equation
Mass conservation means that the increase of unit mass is the same as the outflow in unit time, and the mass is constant in large watershed, so it is also called continuity equation.
ρ is fluid density, unit: kg/m3; t is time, unit: s; u, v and w are the components of the velocity vector U in x, y and z directions, respectively. The vector form of the mass-conservation equation is expressed by vector after 2 is combined into 4 terms.
The research object of Eq. (1) is a compressible three-dimensional fluid.
(2) P indicates the pressure, which is the pressure on the fluid element [11,12]; μ denotes the dynamic viscosity; the momentum balance equations projected along the three reference axes read:
(3) The energy conservation equation is as follows:
K denotes the heat transfer coefficient of fluid, CP suggests the specific heat capacity, ST represents the viscous dissipation term, and T is the temperature value, which is a variable [13–15].
Based on the above conservation equations, it can be found that there are six variables to be solved, namely, u, v, w, ρ, T and P. A P-state equation about ρ is given below to enable the equations to be solved.
For ideal gas, the equation of state is:
R is the molar gas constant [16].
2.3 Structural Parameters of Active Air Intake Grille
(1) Numerical simulation parameter setting: the air intake grille of the basic vehicle simulation model is in the form of a horizontal bar [17,18]. The opening areas of the upper and lower gratings are 0.078 m2 and 0.05 m2, respectively. In the four simulation models, when the opening area of the air inlet grille is 0, it is completely closed. Only the upper grille is open at 0.078 m2, only the lower grille is open at 0.05 m2, and all the grilles are open at 0.13 m2.
(2) Heat transfer parameter setting: the main function of the opening and closing of the air intake grille is to dissipate heat [19]. Previous studies show that there are some differences between vertical bar and horizontal bar, but the difference is not particularly big. Moreover, this exploration is mainly to study the opening and closing law of the active grid qualitatively, so the form of the active grid is not discussed too much. One form is selected for the study, and the active opening and closing grille studied is vertical bar type. According to experience, it is assumed that the maximum temperature of the radiator outlet is T4 = 95°C. Combined with calculation, it can be known that the temperature is 368.15 K under climbing conditions. The temperature relationship between honeycomb type and vertical bar type is T4 = T1 − 10.2, that is, in honeycomb type, the area that can meet the requirement of 10.2 degrees higher is the area value of vertical bar type. If T1 = T2, it can be obtained that:
Therefore, the effective area of the active grille when it is fully open is set to 0.11825 m2.
(3) Parameter setting of combustion switch closing angle: the cooling water temperature shall not be higher than 110°C. When it reaches about 95°C, the engine is in a more suitable working state [20]. Hence, 95°C is set as the control point of grid opening and closing angle to analyze the
3 Active Grille Air Intake Model Results
3.1 Influence of Air Intake Grille on Heat Transfer Function
Fig. 2 displays the influence curve of the opening and closing environment of the upper and lower grilles on the whole vehicle.
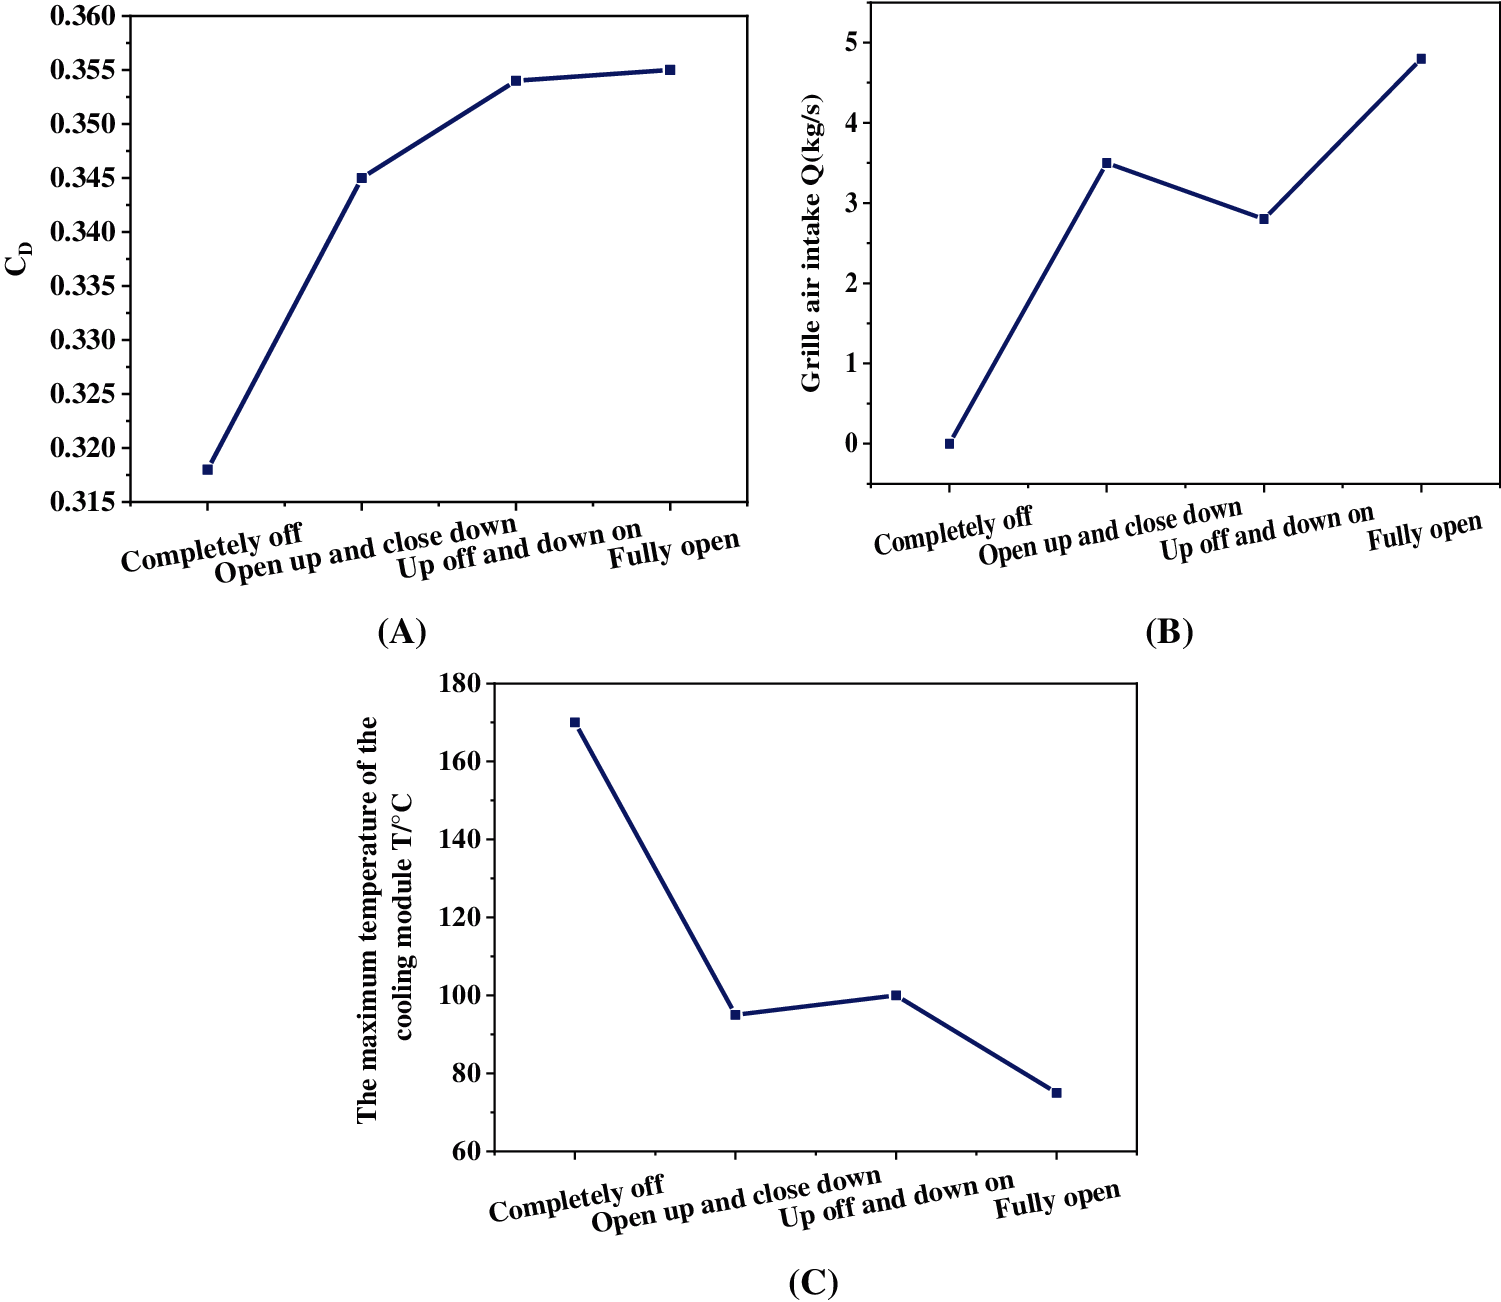
Figure 2: The influence of the opening and closing conditions of the upper and lower grilles on the vehicle characteristics. (A∼C correspond to the CD value, the intake volume of the grilles and the maximum temperature cooling module, respectively)
The opening area and opening and closing situation of the upper and lower grilles suggest that: (1) the trend of air intake increases when the opening area increases. The trend of the two is the same, showing a positive correlation, when the front structure of the car first contacts with the air along the surface, the opening area becomes larger, and the direct blocking effect decreases. (2) when the air intake of the grille increases, the CD value is not positively correlated with it. That is because the opening position of the grille is different when it is only opened up and only opened down, affecting the flow field distribution in the engine compartment, so the position of the grille will also affect the CD value. (3) The CD value is 0.35434 when the grille is fully open and 0.31777 when the grille is fully closed. Hence, the flow resistance coefficient of the engine compartment is 0.03657, accounting for 10.32% of the total resistance coefficient of the car. (4) The cooling capacity of the cooling module is not fully utilized when the fan speed is high and the vehicle is driving at high speed on the straight road, and the cooling performance is surplus.
The crucial results concerned are counted after the completion of numerical calculation. Fig. 3 displays the results.
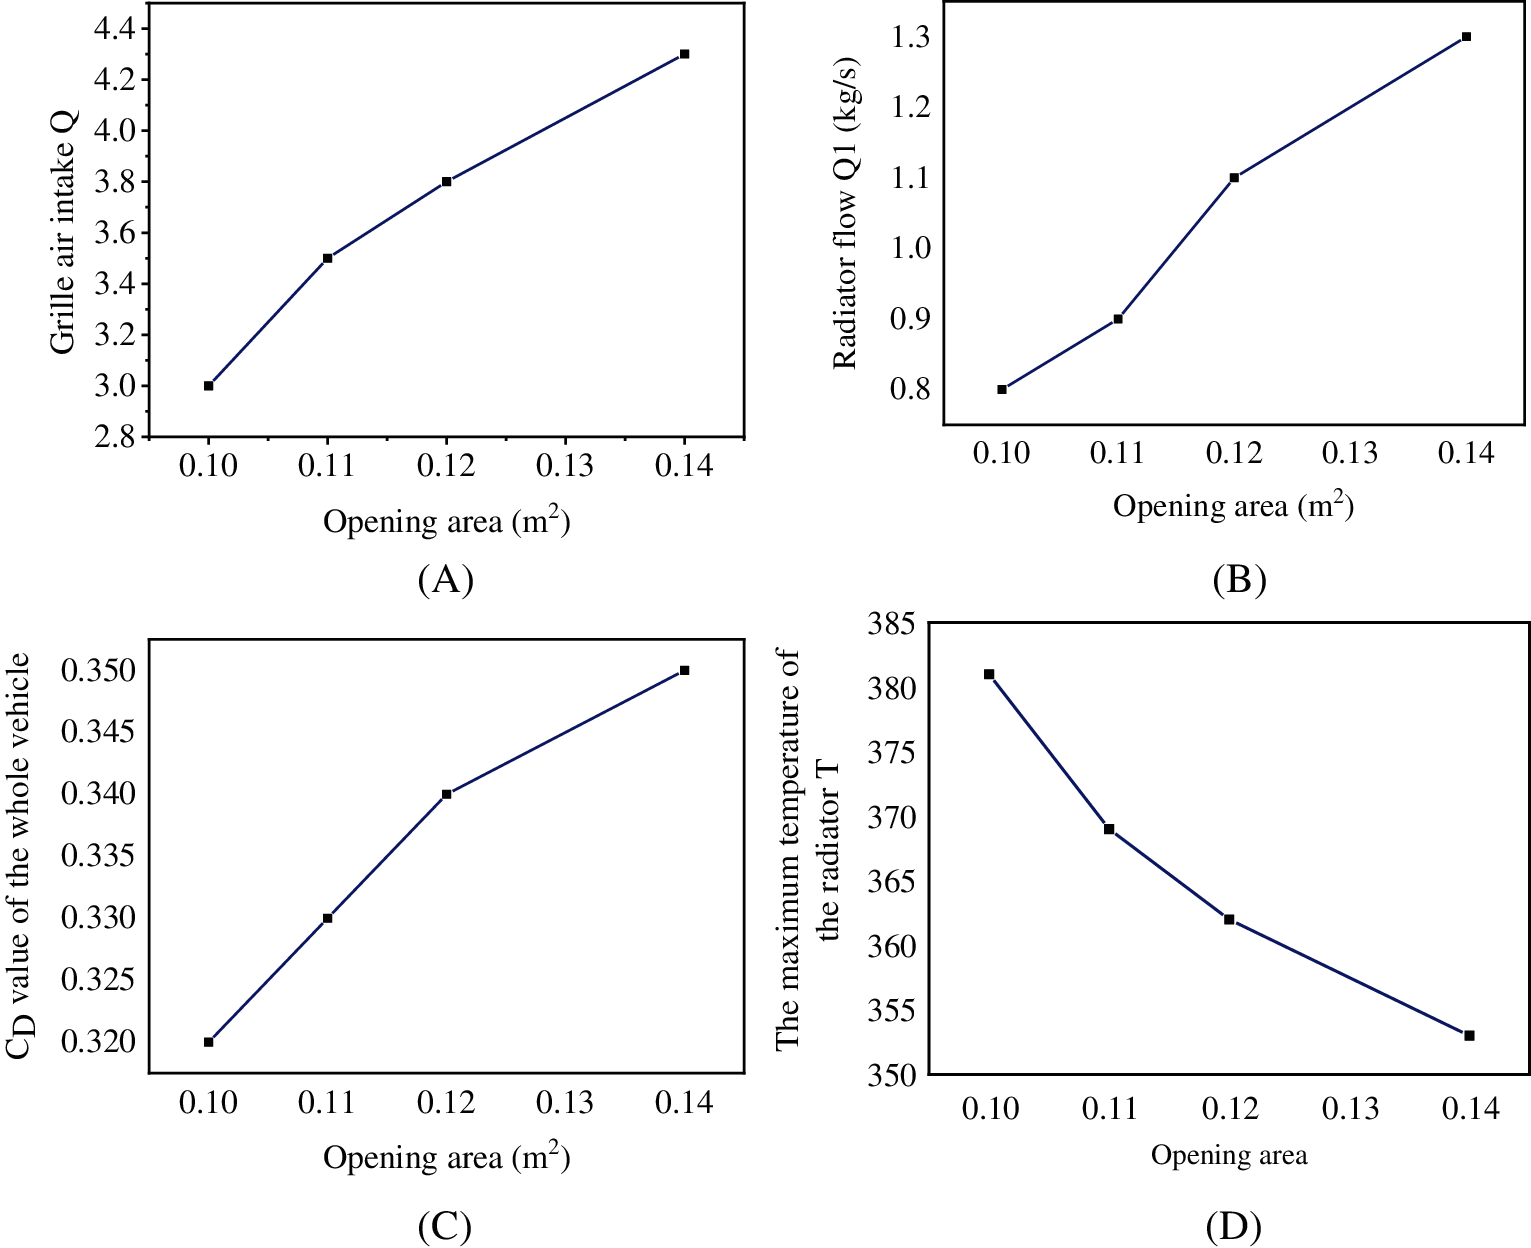
Figure 3: Variation of flow rate and CD value with the opening area under a high speed condition (A∼D correspond to the opening area of Scheme 1 to Scheme 4, respectively)
Fig. 3 reveals that when the effective opening area of the air intake grille increases linearly around 0.1, the CD value and intake volume of the whole vehicle also increase. The opening area increases by 33.86% from area scheme 1 to area scheme 4, resulting in the increase of grille air intake by 41.38%, the increase of radiator air flow by 58.28%, the increase of vehicle CD value by 5.68%, and the decrease of temperature by 7.21%. The goodness of fit R2 = 0.9941.
Fig. 4 displays the change of maximum temperature of the cooling module and the air intake of the grille with the different opening areas.
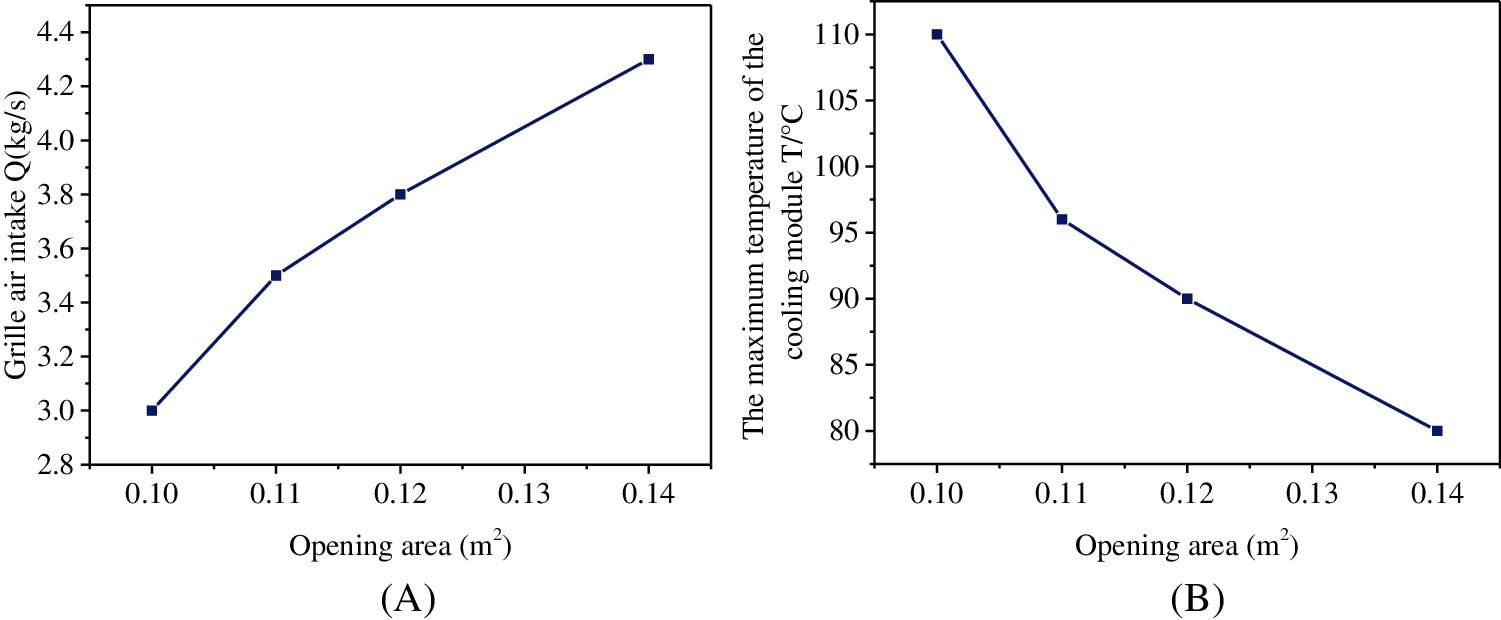
Figure 4: Change of grille flow and maximum temperature of the cooling module with different opening areas (A is grille flow; B is the maximum temperature of the module)
The air intake is positively correlated with the opening area, while the maximum temperature of the cooling module is negatively correlated with the opening area. The whole trend can be summarized as follows. The air flow into the engine compartment increases with the increase of the effective opening area, and the heat carried away increases correspondingly; while the temperature of the radiator and cabin decreases. The analysis suggests that the maximum temperature of the cooling module in the opening area scheme 1 is 107.8°C. Too high temperature will cause serious consequences to the service life and operation of the engine compartment cooling module. The opening area of the car should be larger than it.
3.2 Analysis of Flow Field Characteristics
The first is the relationship between the drag coefficient and the opening. Fig. 5 presents the relationship between the CD value and the opening of the whole vehicle.
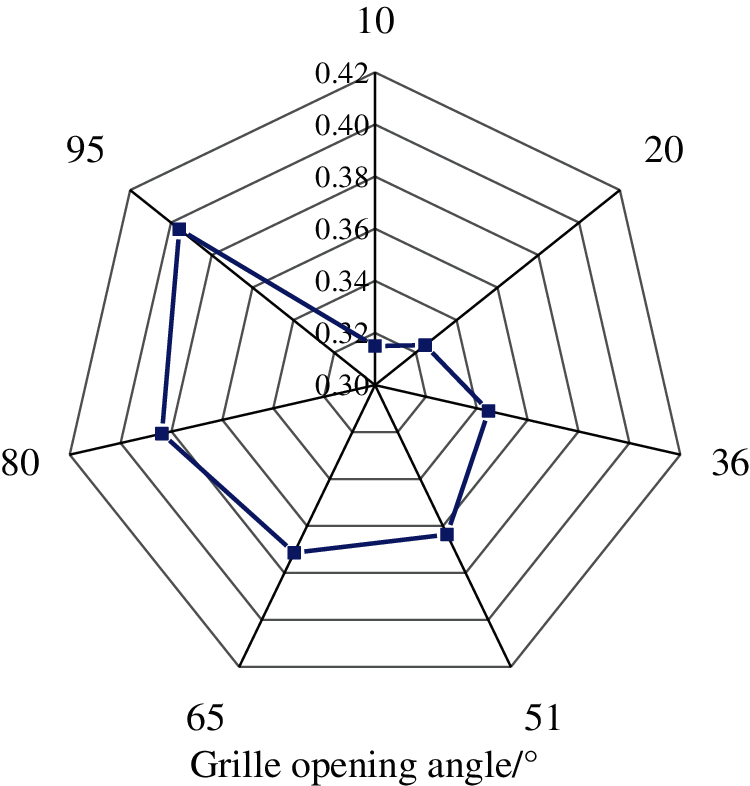
Figure 5: Relationship between vehicle drag coefficient and grille opening degree
The relationship in Fig. 5 suggests that the larger the opening angle of the grille is, the larger the CD value of the whole vehicle is. As long as the opening angle of the air intake grille is not 0, a part of the air flow along the surface will enter the engine compartment through the air intake grille in the front of the vehicle, and this part of the air flow in the engine compartment will produce internal flow resistance.
The second is the analysis of the velocity field of the active air intake grille. The speed change at the grille is that the closer it is to the outside of the vehicle, the greater the speed is, and the greater the mass flow of the intake air is. This is because when the car is driving to the left, part of the air will flow to both sides of the car. Due to the interaction, the closer it is to the outside, the more the air volume and kinetic energy increase, the greater the speed and amount of air intake of the external grille. Furthermore, the flow velocity near the grille accelerates and the air intake volume increases with the increase of the opening. This is because the effective air intake area increases after the opening is large, so the air intake volume increases. The air flow basically follows a straight line when the opening angle is 75° and 90°. There is obvious direction change when the opening angle is 60°. Next, the direction change increases a lot with the decrease of the opening angle; the turbine is formed in the upper right corner when the opening angle is 30°; even when the opening angle is 15°, the air flow has backflow phenomenon, greatly affecting the air intake efficiency and heat dissipation. Hence, the smaller the opening of the air intake grille is, the smaller the air intake of the grille is, the smaller the capacity of the radiator is, and the smaller the CD value of the whole vehicle is.
3.3 Analysis of Grille Opening Results
Fig. 6 presents the values of grid opening, fan speed, vehicle speed level.
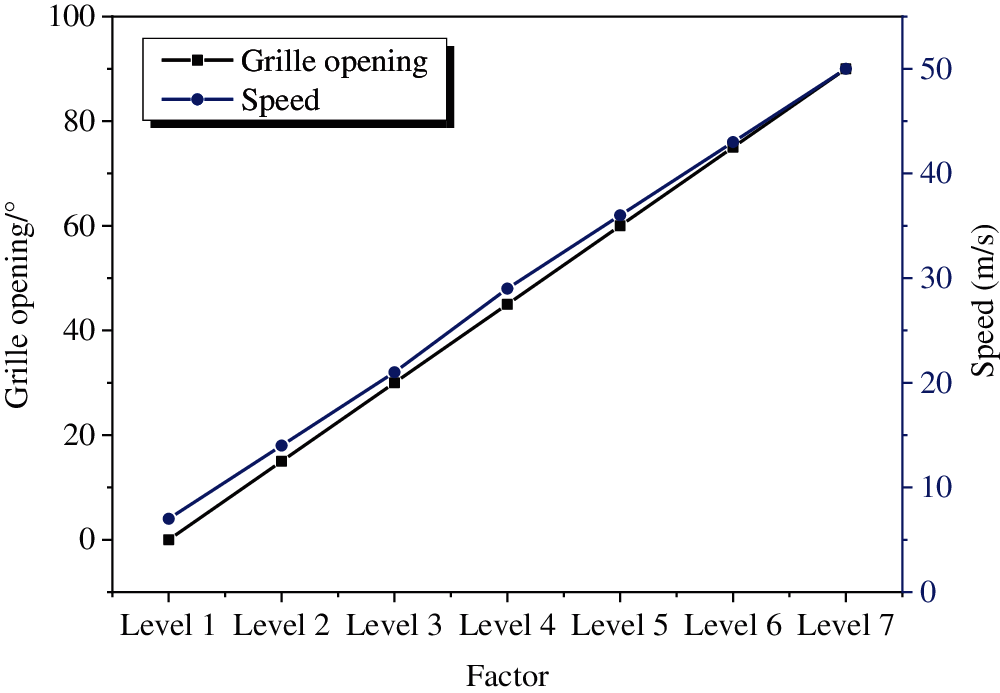
Figure 6: Level chart of active grille
The initial position of each state is determined by the combination of three factors and seven levels orthogonal experimental design and simulation results. Obviously, the speed of fan and the vehicle increases gradually with the increase of the grille opening, which will reach the peak when the grille opening reaches 90°.
3.4 Analysis of Opening Calibration Results
Fig. 7 displays the change curve of grille opening with vehicle speed at each speed.
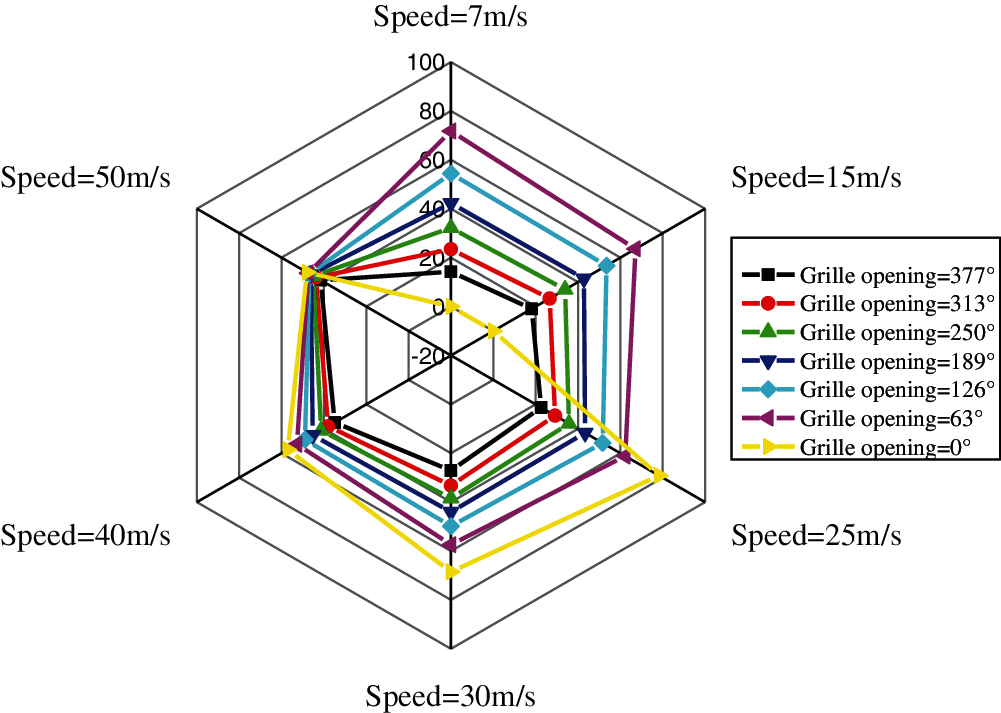
Figure 7: Variation curve of grille opening with vehicle speed at different speeds
The upper area of each fan speed curve in Fig. 7 reveals the relationship between the opening angle range of the grille and the vehicle speed in order to meet the radiator cooling demand at the fan speed. The lower part of the curve indicates that the opening does not meet the heat dissipation requirements of the radiator, which may cause heat damage.
Fig. 7 suggests that the opening angle of the grille decreases with the increase of fan speed when the vehicle speed is constant. The decreasing trend is obvious when the vehicle is driving at low speed, and the influence increases with the decrease of vehicle speed. The innermost curve in Fig. 7 is the curve of vehicle speed and grille opening when the fan speed is 0 rad/s. The projection value of the highest point of 0 rad/s curve on the horizontal axis is vehicle speed = 25 m/s. This indicates that under the set temperature limit of 95°C and the fan speed of 0 rad/s, the fan needs to be turned on when the vehicle speed is lower than 25 m/s; the vehicle can meet the heat dissipation demand of the radiator by adjusting its own grille angle when the vehicle speed is higher than 25 m/s, and the fan does not need to be turned on.
To sum up, the proposed numerical simulation method based on CFD analysis software Fluent can simulate the grid parameters of the actual traffic volume. The flow field simulation analysis is carried out through the establishment of different inlet grille opening and closing angle models, and the influence law of grille opening on vehicle CD value is studied, so as to optimize the wind resistance of vehicle and the heat dissipation performance of engine compartment. In the study of the fluid mechanics performance characteristics of small mobile vehicles, Sun et al. [21] also used CFD technology to simulate the fluid mechanics and performance characteristics of the new elastic blade/wave energy converter, which is similar to the method of this exploration and provides support for this exploration.
The computer numerical simulation technology is adopted to analyze and summarize the influence of the structural parameters of the air intake grille on the heat transfer function of the whole vehicle. Then, the calibration of the active air intake grille is studied. The flow field simulation analysis is conducted through the establishment of different opening and closing angle models of the air intake grille, and the influence law of the grille opening on the vehicle CD value is evaluated. The CD value of the whole vehicle increases with the increase of the opening angle of the grille. Besides, the simulation results of different grille forms are analyzed by the control variable method. The influence of the grille form on the heat transfer function of the whole vehicle is interpreted from different angles. Although the influence of different opening and closing degrees of the grille on the heat transfer function of a vehicle has been explored, there are still multiple deficiencies. First, the ventilation in the passenger compartment, the brake cooling ventilation and the flow of engine intake and exhaust are ignored. Then, the numerical simulation analysis of the flow field in the engine compartment needs to be put into the wind tunnel calculation domain together with the vehicle flow field. In the future, these two aspects will be further explored to continuously improve the model results.
Acknowledgement: This article has received a lot of help from the outside world from the topic of research to the final writing of the manuscript. Here, I would like to express my heartfelt thanks to the units and individuals who have provided help and support for this research.
Funding Statement: The author received no specific funding for this study.
Conflicts of Interest: The author declares that they have no conflicts of interest to report regarding the present study.
1. Garsous, G., Suárez-Alemán, A., Serebrisky, T. (2019). Cable cars in urban transport: Travel time savings from La Paz-El Alto (Bolivia). Transport Policy, 75, 171–182. DOI 10.1016/j.tranpol.2017.05.005. [Google Scholar] [CrossRef]
2. Lozhkin, V., Lozhkina, O., Dobromirov, V. (2018). A study of air pollution by exhaust gases from cars in well courtyards of saint petersburg. Transportation Research Procedia, 36, 453–458. DOI 10.1016/j.trpro.2018.12.124. [Google Scholar] [CrossRef]
3. Ou, J., Li, L. (2020). Alication of the multi-field coupling enhanced heat transfer principle to the engine compartment design of clean gas bus. Mechanical Sciences, 11(1), 205–220. DOI 10.5194/ms-11-205-2020. [Google Scholar] [CrossRef]
4. Hoback, A. S. (2018). Pareidolia and perception of anger in vehicle styles: Survey results international. Journal of Psychological and Behavioral Sciences, 12(8), 1049–1055. DOI 10.5281/zenodo.1340556. [Google Scholar] [CrossRef]
5. Astorqui, J. S. C., Porras-Amores, C. (2017). Ventilated façade with double chamber and flow control device. Energy and Buildings, 149, 471–482. DOI 10.1016/j.enbuild.2017.04.063. [Google Scholar] [CrossRef]
6. Liu, Q., Nie, W., Hua, Y., Jia, L., Li, C. et al. (2019). A study on the dust control effect of the dust extraction system in TBM construction tunnels based on CFD computer simulation technology. Advanced Powder Technology, 30(10), 2059–2075. DOI 10.1016/j.apt.2019.06.019. [Google Scholar] [CrossRef]
7. Buliński, Z., Kabaj, A., Krysiński, T. (2019). A computational fluid dynamics analysis of the influence of the regenerator on the performance of the cold stirling engine at different working conditions. Energy Conversion and Management, 195, 125–138. DOI 10.1016/j.enconman.2019.04.089. [Google Scholar] [CrossRef]
8. Fourie, L. F., Square, L. (2020). Determination of a safe distance for atomic hydrogen depositions in Hot-wire chemical vapour deposition by means of CFD heat transfer simulations. Fluid Dynamics & Materials Processing, 16(2), 225–235. DOI 10.32604/fdmp.2020.08771. [Google Scholar] [CrossRef]
9. Osiptsov, A. A. (2017). Fluid mechanics of hydraulic fracturing: A review. Journal of Petroleum Science and Engineering, 156, 513–535. DOI 10.1016/j.petrol.2017.05.019. [Google Scholar] [CrossRef]
10. Brenner, M. P., Eldredge, J. D., Freund, J. B. (2019). Perspective on machine learning for advancing fluid mechanics. Physical Review Fluids, 4(10), 100501–100210. DOI 10.1103/PhysRevFluids.4.100501. [Google Scholar] [CrossRef]
11. Fily, Y., Kafri, Y., Solon, A. P., Tailleur, J., Turner, A. (2017). Mechanical pressure and momentum conservation in dry active matter. Journal of Physics A: Mathematical and Theoretical, 51(4), 044003–0440012. DOI 10.1088/1751-8121/aa99b6. [Google Scholar] [CrossRef]
12. Osada, A., Gloe, A., Nakamura, Y., Usami, K. (2018). Orbital angular momentum conservation in brillouin light scattering within a ferromagnetic sphere. New Journal of Physics, 20(10), 103018–103027. DOI 10.1088/1367-2630/aae4b1. [Google Scholar] [CrossRef]
13. Chen, Q., Hao, J. H., Zhao, T. (2017). An alternative energy flow model for analysis and optimization of heat transfer systems. International Journal of Heat and Mass Transfer, 108, 712–720. DOI 10.1016/j.ijheatmasstransfer.2016.12.080. [Google Scholar] [CrossRef]
14. Bao, H., Chen, J., Gu, X., Cao, B. (2018). A review of simulation methods in micro/nanoscale heat conduction ES. Energy & Environment, 1(34), 16–55. DOI 10.30919/esee8c149. [Google Scholar] [CrossRef]
15. Zhao, D., Luo, M. (2019). Representations of acting processes and memory effects: General fractional derivative and its alication to theory of heat conduction with finite wave speeds. Alied Mathematics and Computation, 346, 531–544. DOI 10.1016/j.amc.2018.10.037. [Google Scholar] [CrossRef]
16. Peters, M. H. (2021). Nonequilibrium entropy conservation and the transport equations of mass, momentum, and energy. Energies, 14(8), 2196. DOI 10.3390/en14082196. [Google Scholar] [CrossRef]
17. Hajjar, A., Mehryan, S. A. M., Ghalambaz, M. (2020). Time periodic natural convection heat transfer in a nano-encapsulated phase-change suspension. International Journal of Mechanical Sciences, 166, 105243. DOI 10.1016/j.ijmecsci.2019.105243. [Google Scholar] [CrossRef]
18. Qian, P., Wang, J., Wu, Z., Yang, J., Wang, Q. (2019). Performance comparison of methane steam reforming in a randomly packed bed and a grille-sphere composite packed bed. Energy Conversion and Management, 193, 39–51. DOI 10.1016/j.enconman.2019.04.052. [Google Scholar] [CrossRef]
19. Chu, W. X., Hsu, C. S., Tsui, Y. Y., Wang, C. C. (2019). Experimental investigation on thermal management for small container data center. Journal of Building Engineering, 21, 317–327. DOI 10.1016/j.jobe.2018.10.031. [Google Scholar] [CrossRef]
20. Nawi, Z. M., Kamarudin, S. K., Abdullah, S. R. S., Lam, S. S. (2019). The potential of exhaust waste heat recovery (WHR) from marine diesel engines via organic rankine cycle. Energy, 166, 17–31. DOI 10.1016/j.energy.2018.10.064. [Google Scholar] [CrossRef]
21. Sun, C., Shang, J., Luo, Z., Li, X., Wu, G. (2020). CFD simulation and experimental study of a New elastic blade wave energy converter. Fluid Dynamics & Materials Processing, 16(6), 1147–1159. DOI 10.32604/fdmp.2020.09937. [Google Scholar] [CrossRef]
 | This work is licensed under a Creative Commons Attribution 4.0 International License, which permits unrestricted use, distribution, and reproduction in any medium, provided the original work is properly cited. |