| Fluid Dynamics & Materials Processing |
DOI: 10.32604/fdmp.2021.017543
ARTICLE
Development and Application of a Heating Remote Monitoring System Based on KingSCADA
Department of Energy Engineering, Hebei University of Architecture, Zhangjiakou, 075000, China
*Corresponding Author: Yong Sun. Email: xsunyong@126.com
Received: 19 May 2021; Accepted: 15 June 2021
Abstract: A remote monitoring system for a secondary heating pipe network is designed on the basis of the KingSCADA software. Remote data communication is implemented through the IP mapping technology. Remote data are sorted through IOServer, and the remote monitoring of the pipe network unit port return is implemented accordingly. Using data such as water temperature and pressure of the water supply and return pipes, valve opening can be remotely adjusted to optimize the performances of the network to meet user needs in real time. The research results show that this remote monitoring system displays a reasonable degree of stability and efficiency in remote communication.
Keywords: Heating regulation; remote monitoring; data acquisition; IP mapping
Recently, central heating has become the main heating method in cold winter areas. As the heating control system is gradually improved, the requirements for monitoring system also increase. In addition to meeting the basic monitoring requirement, it is necessary to real-time acquire and reduce data of the whole system, and depict the data variation trend to feedback heating effect. Besides, according to the actual need of workers, data has to be transmitted remotely, so that heating system can be monitored remotely at different time and place. In view of these requirements, a remote monitoring system is developed and a virtual server is established, to realize the remote regulation of heating pipe network. This is of great importance to the stable operation of heating system.
At present, some studies have been conducted on heating remote monitoring technique. For remote monitoring technique, Ma [1] proposed to use such tools as Web technology, C# language, Visual Studio 2005 development tool, and SQL database development to design remote monitoring software, and use Web cloud server technology for communication; Yang [2] put forward to realize remote PLC communication by GPRS communication technology, but this communication mode does not apply to big data transmission; Chen et al. [3] showd a remote monitoring communication, which is achieved by ADSL + VLAN networking mode, private network and radio station; in Wang et al. [4–6], the remote communication adopts the cross-gateway remote browsing technology built in KingSCADA software, to browse web page remotely, which has higher requirements for network and is not stable; Wang [7] elaborated the mapping algorithm and global optimization of IP mapping technology at current stage, and introduces the task scheduling, IP core mapping and data block mapping; Shao et al. [8–11] represented the operating mode of IP mapping in practical engineering and their solution to mapping. Therefore, IP mapping technology was used to designed the remote communication technique in this paper to achieve data remote monitoring. Yang [12] performed header compression and data packet cascade processing on data, and performs data processing in the monitoring system database of this article through these methods; Chen [13] developed a new monitoring software for master computer to communicate with slave computer; Zhu et al. [14] performed communication regulation on hydraulic balancing valve with the Internet of Thins technology to realize an actual effect; Wang [15] stated an automatic monitoring system developed by remote communication through TCP/IP and on the existing SNAP-PAC platform; Fan et al. [16] uses GPRS for remote communication in the development of the actual remote monitoring system, the data is transmitted to the network server, and the data is displayed through the query statement of the mobile phone APP; Abbasloo [17] was used to reduce network delay to ensure the accuracy of remote data transmission; Waikul [18] uses Bluetooth technology to cover regional networks for wireless data transmission and sharing; Kirtane [19] designed wearable devices and sets built-in memory cards to perform Time data collection and wireless upload of data to achieve energy-saving effects; Chen [20] used full-duplex (FD) wireless for remote data interaction at the same frequency, thereby eliminating self-interference and reducing data transmission delay; Learning Basi [21] used virtual local area network technology to enhance the security of remote data transmission; Through Eduan [22], wireless communication sensors were used for corresponding data collection, and the intermediate data transmission process is reduced correspondingly, which is quick and convenient.
Overseas and domestic scholars have made many studies on remote monitoring of heating system and obtained a number of remote communication modes. But some modes have certain restrictions, some have distance limits, or some may require highly on the network. In view of this situation, this paper designed a real-time remote monitoring system for heating system by performing IP mapping through virtual server and network IP mapping technology, and realized the monitoring and regulation on the operating process of heating system in Longhuayuan Garden by on-site monitoring and data description. The monitoring system is developed and designed to realize the regulation and control of the secondary heating pipe network under the premise that the heat exchange station is far away from the heating power company. It has a significant contribution to the regulation and control of the secondary heating pipe network anytime and anywhere by the heating power company.
2 KingSCADA-Based Monitoring System Development
The heating monitoring system is composed of communication network and monitoring system. The communication network refers to that sensor data is transmitted by 485 communication protocol to PLC, and then transmitted remotely to IOServer acquisition system via connection optical fiber through switch; the monitoring system displays the data acquired by data acquisition system according to their categories, the data monitoring interface monitors system operation remotely, and the parameter regulation interface regulates the system’s operating parameters remotely. In this way, the operation and maintenance staff could monitor and regulate the heating system remotely at different time and place. See specific work flowchart of system in Fig. 1.
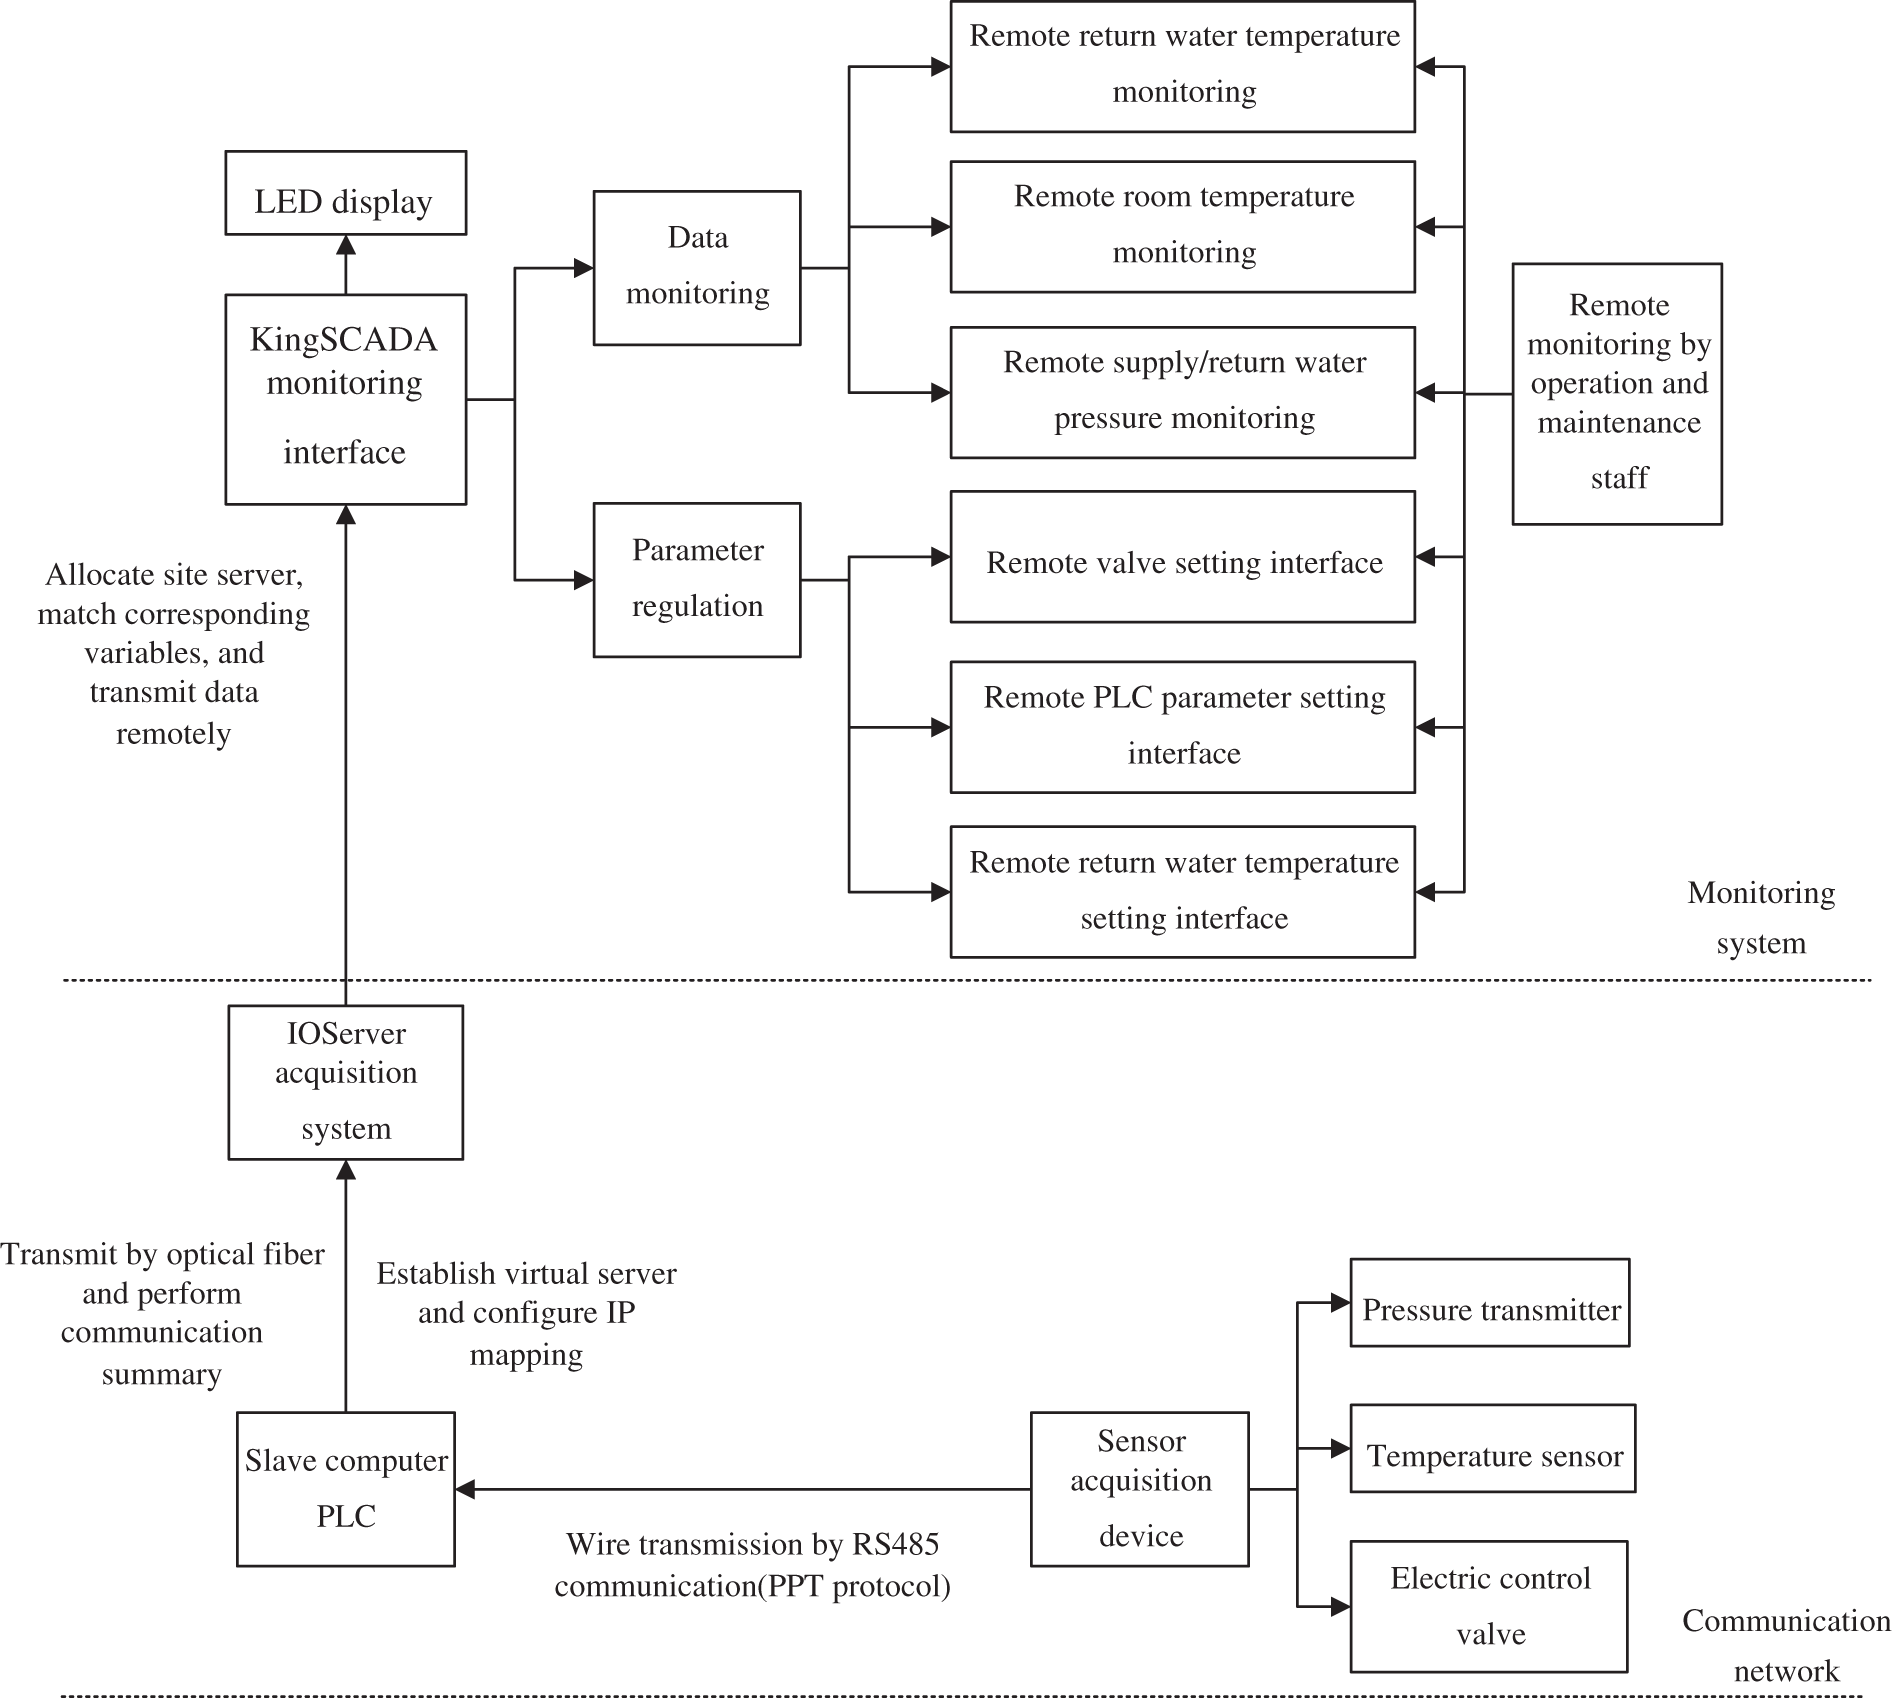
Figure 1: Remote monitoring system
2.2 IOServer Acquisition System Development
2.2.1 Set up IOServer Application
Choose corresponding project to establish IOServer application, select KingSCADA project path, and allocate the acquisition model and communication links (different device is not allowed to use the same link); different data types are grouped into different data sets; edit site name in network configuration (prepare for KingSCADA data interaction), and set port number; set the storage type of slave computer data and the size of a single storage file in the storage configuration, and choose corresponding data storage path.
2.2.2 IOServer Communication Configuration
Set up PLC slave computer devices and activate them, perform data optimization and acquisition, select corresponding PLC (Siemens S7-200smartPLC) communication drive or a general TCP protocol for communication setting, and allocate the device IP address as 192.168.2.#:0:102. Set the communication mode as serial port link, match the set links, and set Baud rat, data bits, verification mode, reconnection interval and so on according to actual need.
Regarding standby communication, s7-200(TCP) communication protocol can be an option for the communication configuration of 200smartPLC, and it is required to modify the configuration file kvs7-200.ini, and change the IP address of device. In addition, the IP address should be added with the slot number and port number of PLC device, and the device IP addresses are limited to 64 groups.
IOServer variables correspond to the data type of slave computer PLC variables, so it is necessary to count the data type of PLC data point. Besides, the data types of IOServer and programming language have certain discrepancies, for example, IODisc belongs to discrete data type; the acquisition attributes should match the register address of corresponding variable and set acquisition frequency and read-write type; and in general, the setting of the storage attributes of basic variables is the same as the acquisition frequency interval.
Some variables should receive attribute transition by means of linear or rooting transition, etc.
2.3 KingSCADA Monitoring Interface Design
The development of the proposed heating monitoring system is centered on the holistic data monitoring and the regulation of electric control valve at unit access. The monitoring interface is divided into two categories: real-time data monitoring and historical data query; the regulation interface of electric control valve at unit access is divided into: unit entry setting and parameter setting of PLC port.
The real-time data monitoring includes: preview interface of community building data and overview interface. The data of each building is monitored at real time; see the monitoring interface of building #2 in the picture below.
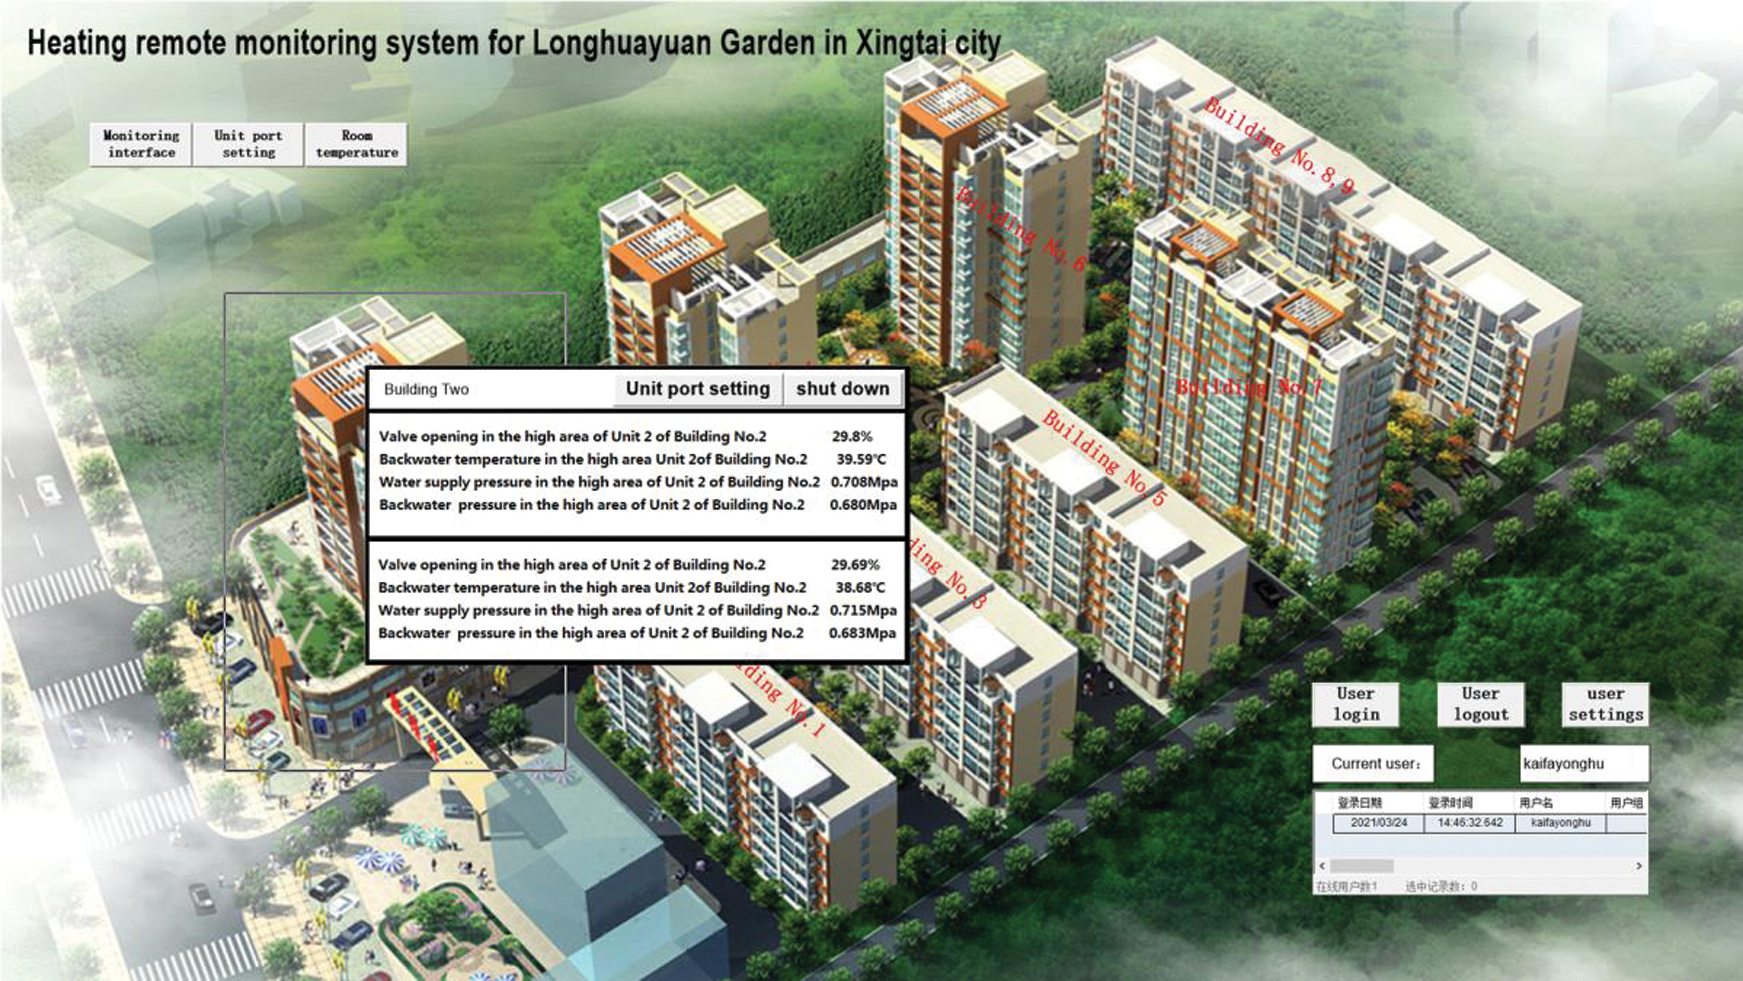
Figure 2: A heating remote monitoring system for a certain district in a certain city
The historical data query includes: real-time data trend curve display, historical data curve query, and historical database data storage. The heating staff could judge the variables in queried time period according to the variation tendency in data trend curve, and get a basic understanding of the entire heating work condition. Take the historical data interface of building #7 as an example, details as below.
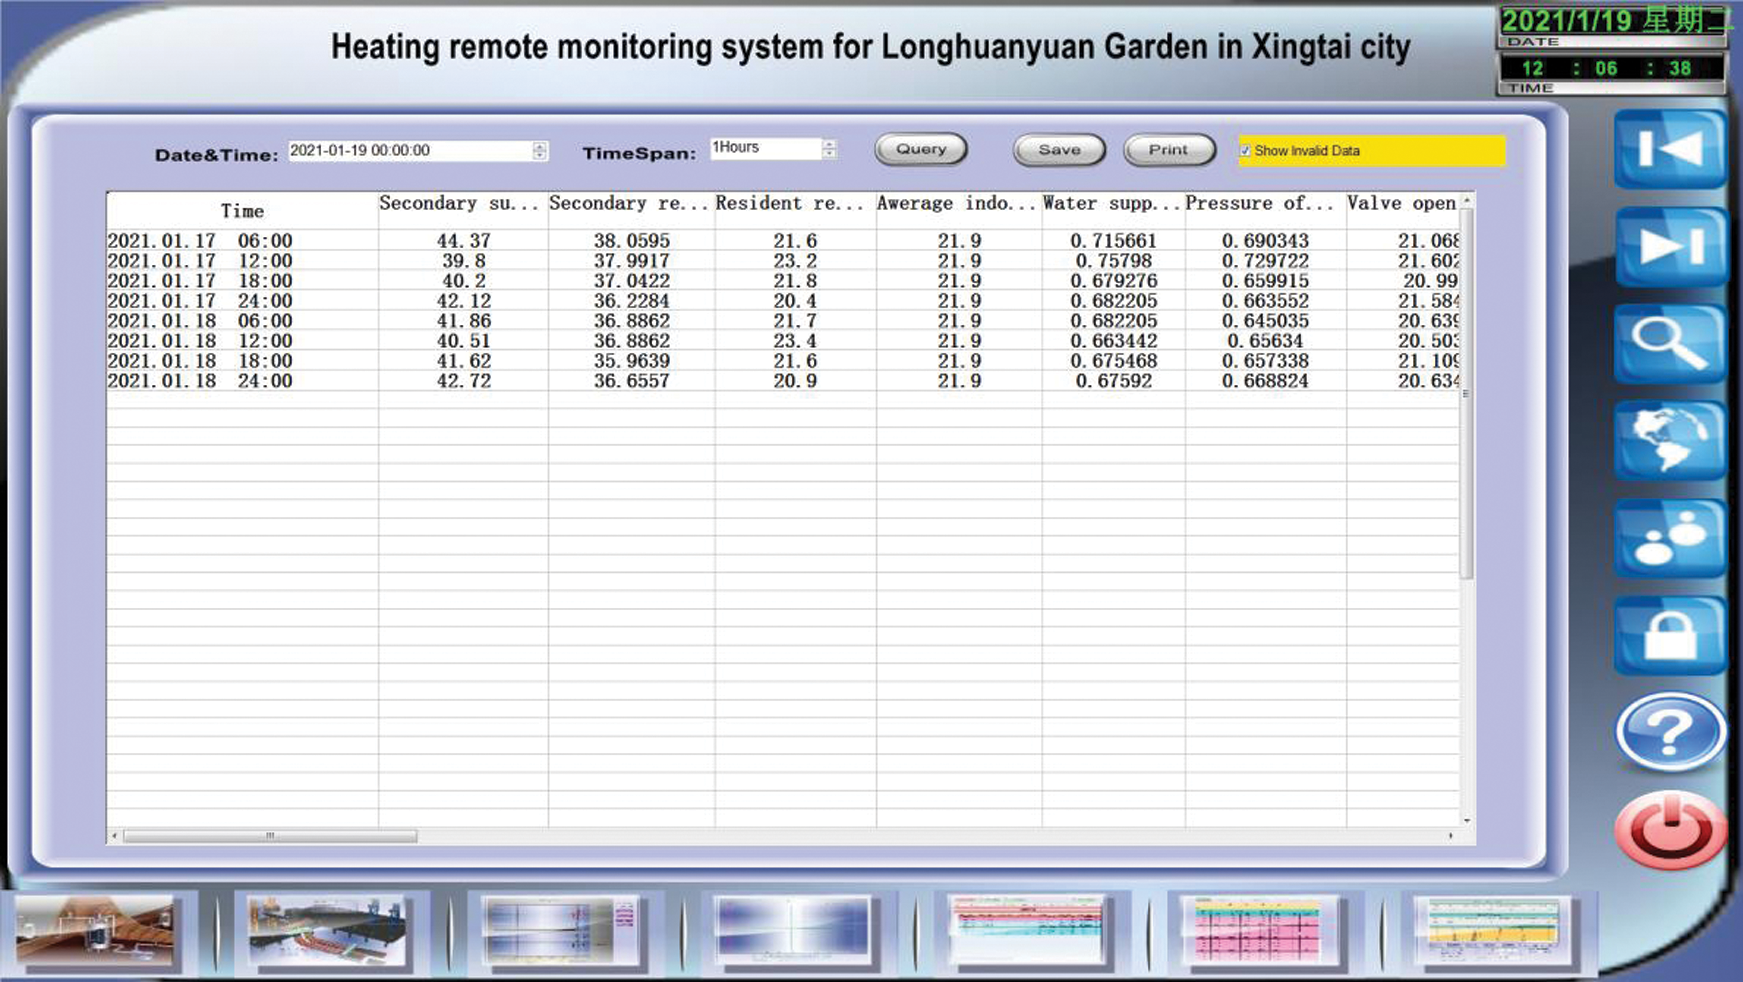
Figure 3: Remote historical data query interface
The unit access setting interface is an regulation interface designed according to the preliminary setting to the hydraulic balance in the secondary network of heating system. By regulating the operating mode of PLC port, this interface can perform automatic integral control or differential regulation, or set valve opening and return water temperature manually; in the manual mode, the master computer is used to establish discrete variables and floating point variable, and the slave computer PLC is continued to be used to change valve opening and regulate return water temperature through data transmission. The specific interface of building #1 is cited as an examples as below.
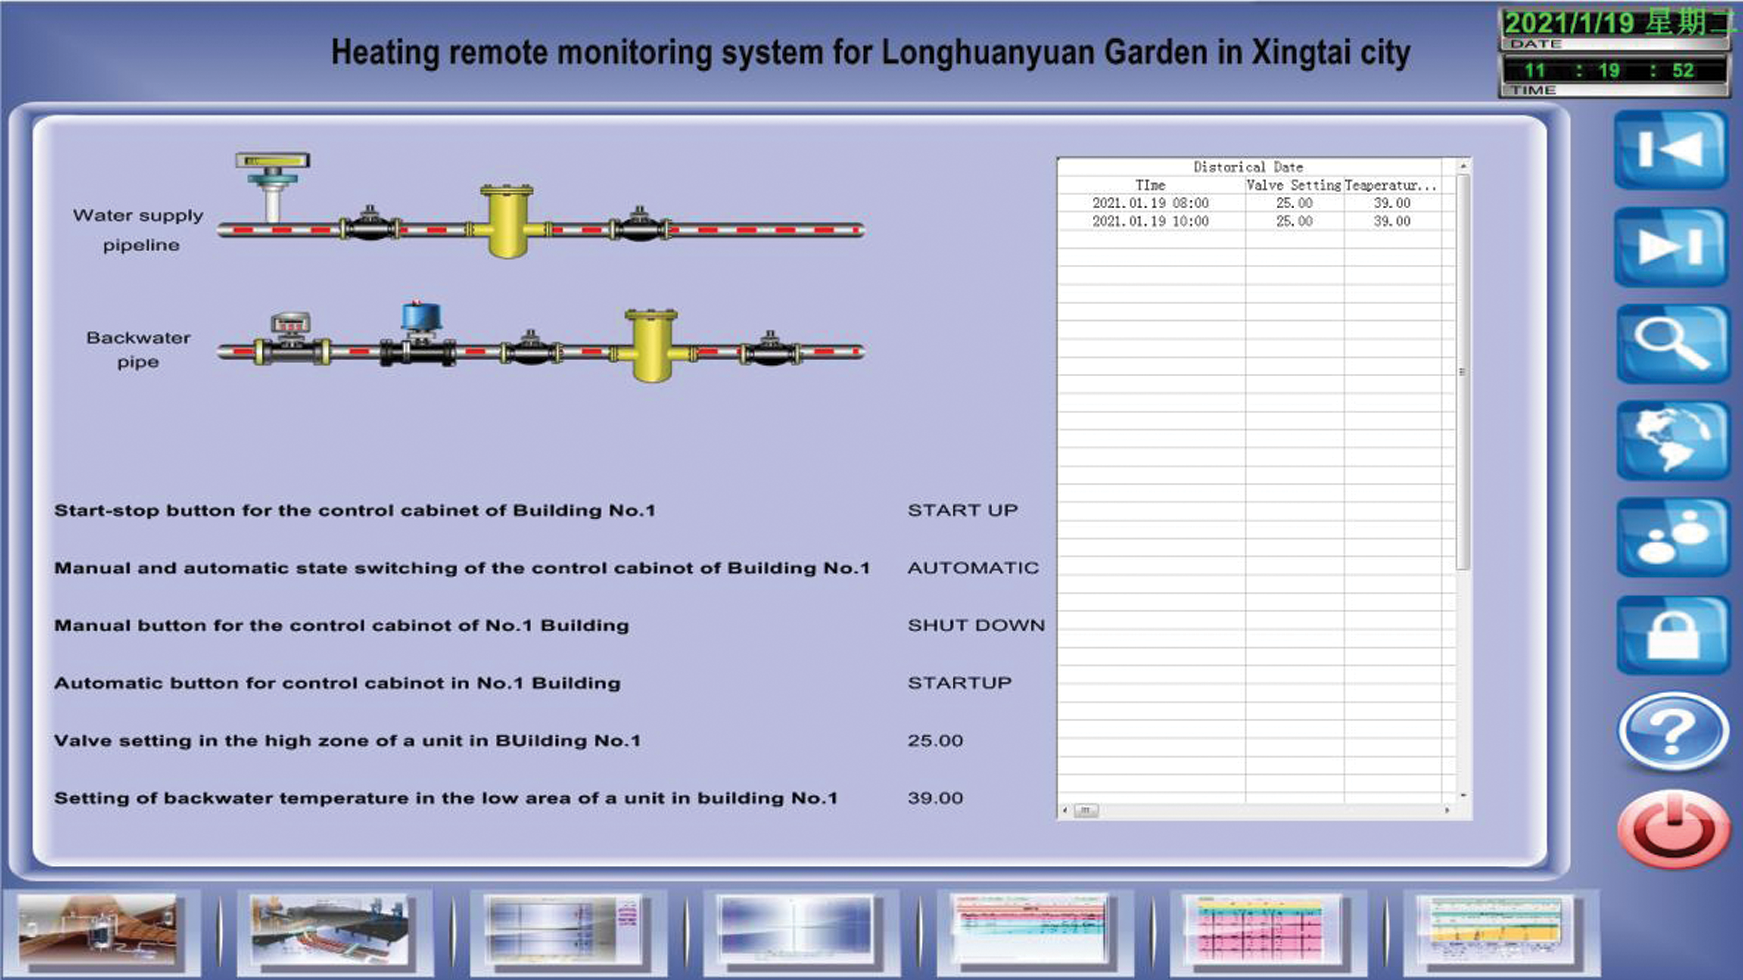
Figure 4: Remote building device control interface
PLC integral and differential setting interface is a control interface for parameter display and setup design when the run program at PLC port. This interface can draw trend curve according to real-time operation data, and cooperate with staffs to regulate. Because this monitoring system aims to realizing remote monitoring, so this interface can cooperate with operation and maintenance staff remotely for remote debugging. The below picture is an example of the interface of building #2.
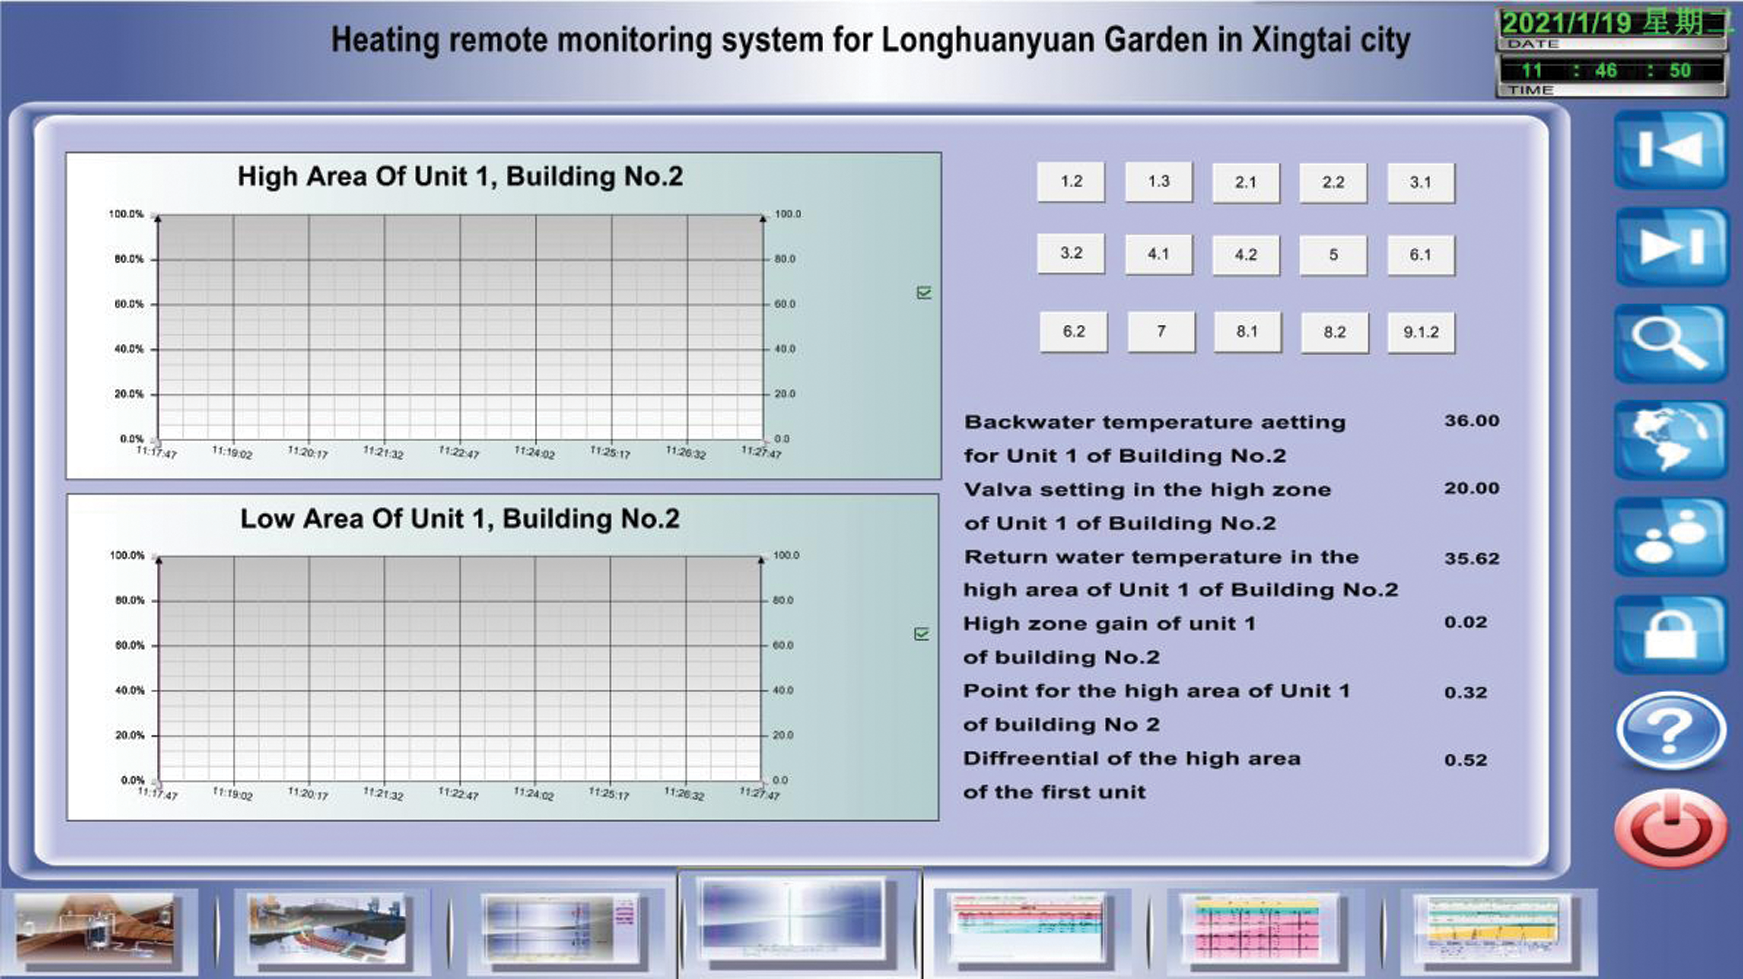
Figure 5: Remote PLC regulation interface
2.4 Data Interaction between IOServer and KingSCADA
After IOServer data acquisition is finished, it is required to conduct site selection and variable matching with the interface programmed by KingSCADA. First, IOServer project patch is duplicated to KingSCADA editor, to allocate site IP address; second, set up data variables corresponding to variables in IOServer, and complete the data types, original state and storage time interval of variables. It is worth noting that the original value of discrete variables is False and True, which should be verified with the variable points of slave computer. KingSCADA can perform data acquisition and issuance of the same variable at the same time.
2.5 KingSCADA Monitoring Function Development
Communication test is performed after data interaction is completed. Add site in KingSCADA, allocate IP address, and automatically run IOServer application. In case the IOServer variables need to be modified later, it is essential to refresh the IOServer site after modification and synchronize variable information to KingSCADA editor.
Design the script program for the query function of KingSCADA, and write basic functions as below:
The fixed variable display is embedded into text box and written as ### (operation display is blank), and IO double precision floating-point analog quantity is output. Then, choose corresponding data point and time interval to make fixed-time storage record. In data display, conduct equal ratio conversion, data display mode and so on, and set according to practical needs. After that, data is issued, embedded into text box and written as ###. Later, match corresponding data type, set analog value output, and match into corresponding slave computer PLC’s register address. Finally, double click the leftup in text box.
Add button framework for button function writing, see function script as below:
Query function script of historical data curve at fixed time:
TrendChart2.SetTimeAxisDialog(“TimeAxis1”).
In which, TrendChart2 refers to the curves corresponding to query function, TimeAxis1 refers to the time axis corresponding to query curve, and operation script can realize the query of one certain time period.
In the process of curve query, the following scripts can be added to calculate the maximum/minimum value and average of corresponding variables within fixed time period, see script as below:
TrendChart2.SetTimeAxisDialog(“TimeAxis1”);
Float min = TrendChart2.GetCurveStisticInTimeAxis(“Curve1”,1,1);
Float max = TrendChart2.GetCurveStisticInTimeAxis(“Curve1”,2,1);
Float averg = TrendChart2.GetCurveStisticInTimeAxis(“Curve1”,3,1);
Txet1.Text = “Minimum:” + min;
Txet2.Text = “Maximum:” + max;
Txet3.Text = “Average:” + averg;
Query function script of historical database for fixed variable at fixed time:
Report1.SetTimes();
Report1.Query();
Report1.HistQueryWizard().
In which, Report1 refer to selecting corresponding data reports and then corresponding time period and variables.
Since then, KingSCADA and IOServer function design and development is completed, which can realize the data upload, display, download, query and so on from wireless communication to slave computer.
3 Setup of Remote Network Communication System
3.1 Realization of Network Mapping
In view of the restriction of public network IP address, IOServer remote acquisition system needs to map the multidevice private network IP address and one public network IP address through IP mapping technology [8]. When using network mapping technology in remote communication of heating system of this community, it is first to use instruction order to obtain router’s static IP address and set PLC’s subnet mask; second, connect computer to router to set IPv4, use Nat technology to map multiple IP address field to one IP address field, and provide route for terminal host computer to solve IP address deficiency problem; finally, establish multiple external ports via virtual server to match multiple PLC addresses of slave computer, and reboot the router.
Presently, network mapping generally adopts Port Address Translation (PAT) of Nat technology, which maps internal address to one globally unique public network IP address at router’s WAN port, and meanwhile add a TCP or UDP port number selected by router to this address. Nowadays, most IP grouping carry TCP payload, including a 16-bit source port and target port, and the port instructs TCP to connect the start and end positions. When two courses communicate with each other, the source port is bound to suited port, through which port data will be issued to this course to indicate the distributed target port.
The transmission flow of remote communication of this monitoring system is shown in Fig. 6.
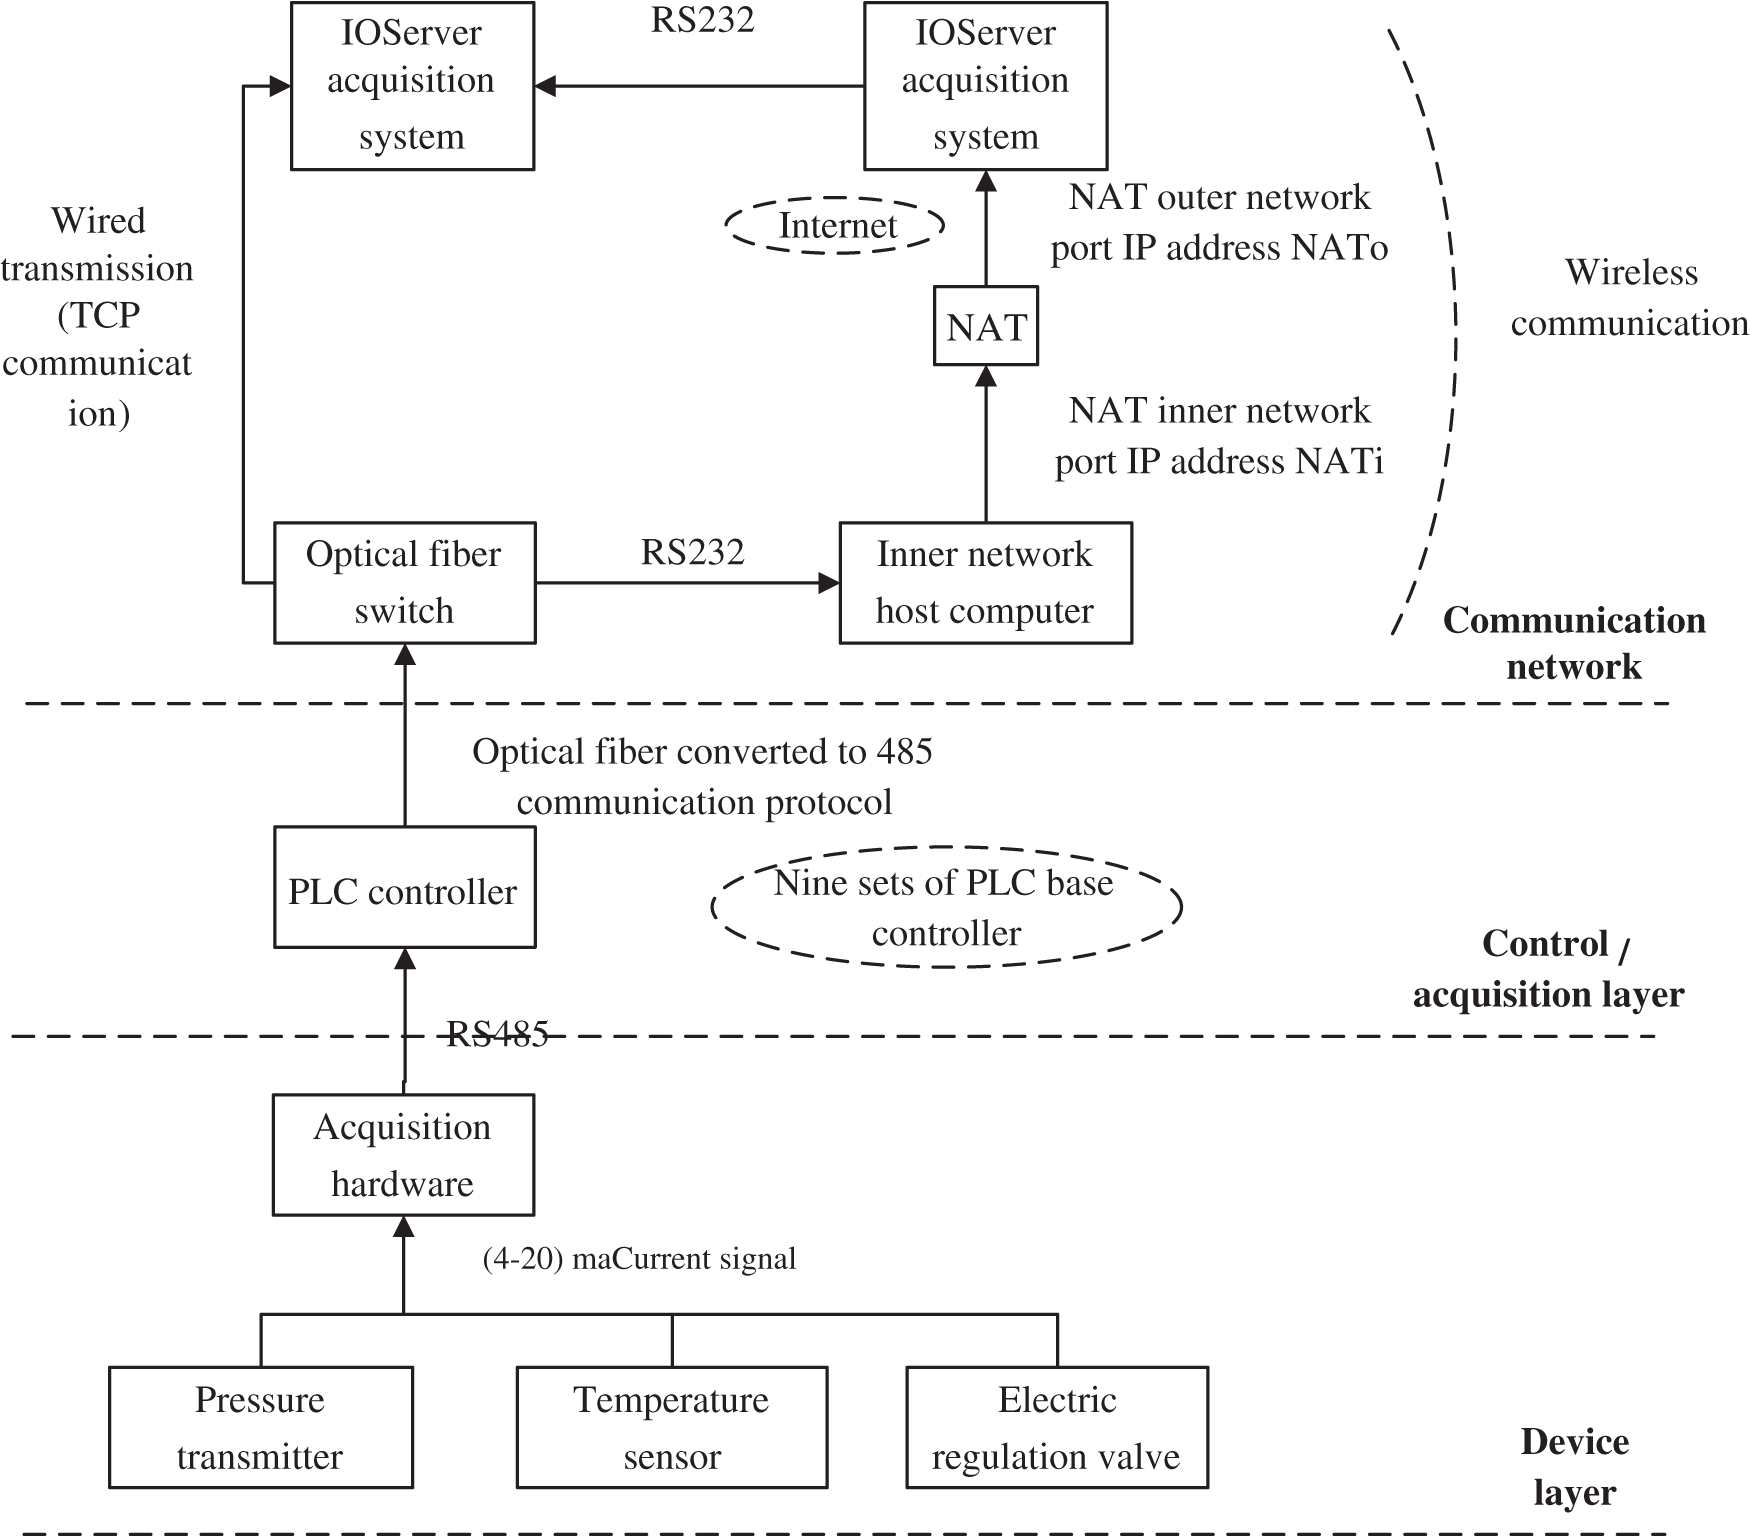
Figure 6: Remote communication flow
Wired communication test is performed at optical fiber terminal box, to ensure the communication between wired hardware and software. We set the IP address of router (FAST duel-frequency wireless router) used in heat exchange station as 10.128.4.11, subnet mask as 255.255.255.224, gateway as 10.128.4.11, preferred DNS server as 222.222.222.222, and standby DNS server as 222.222.0.0.
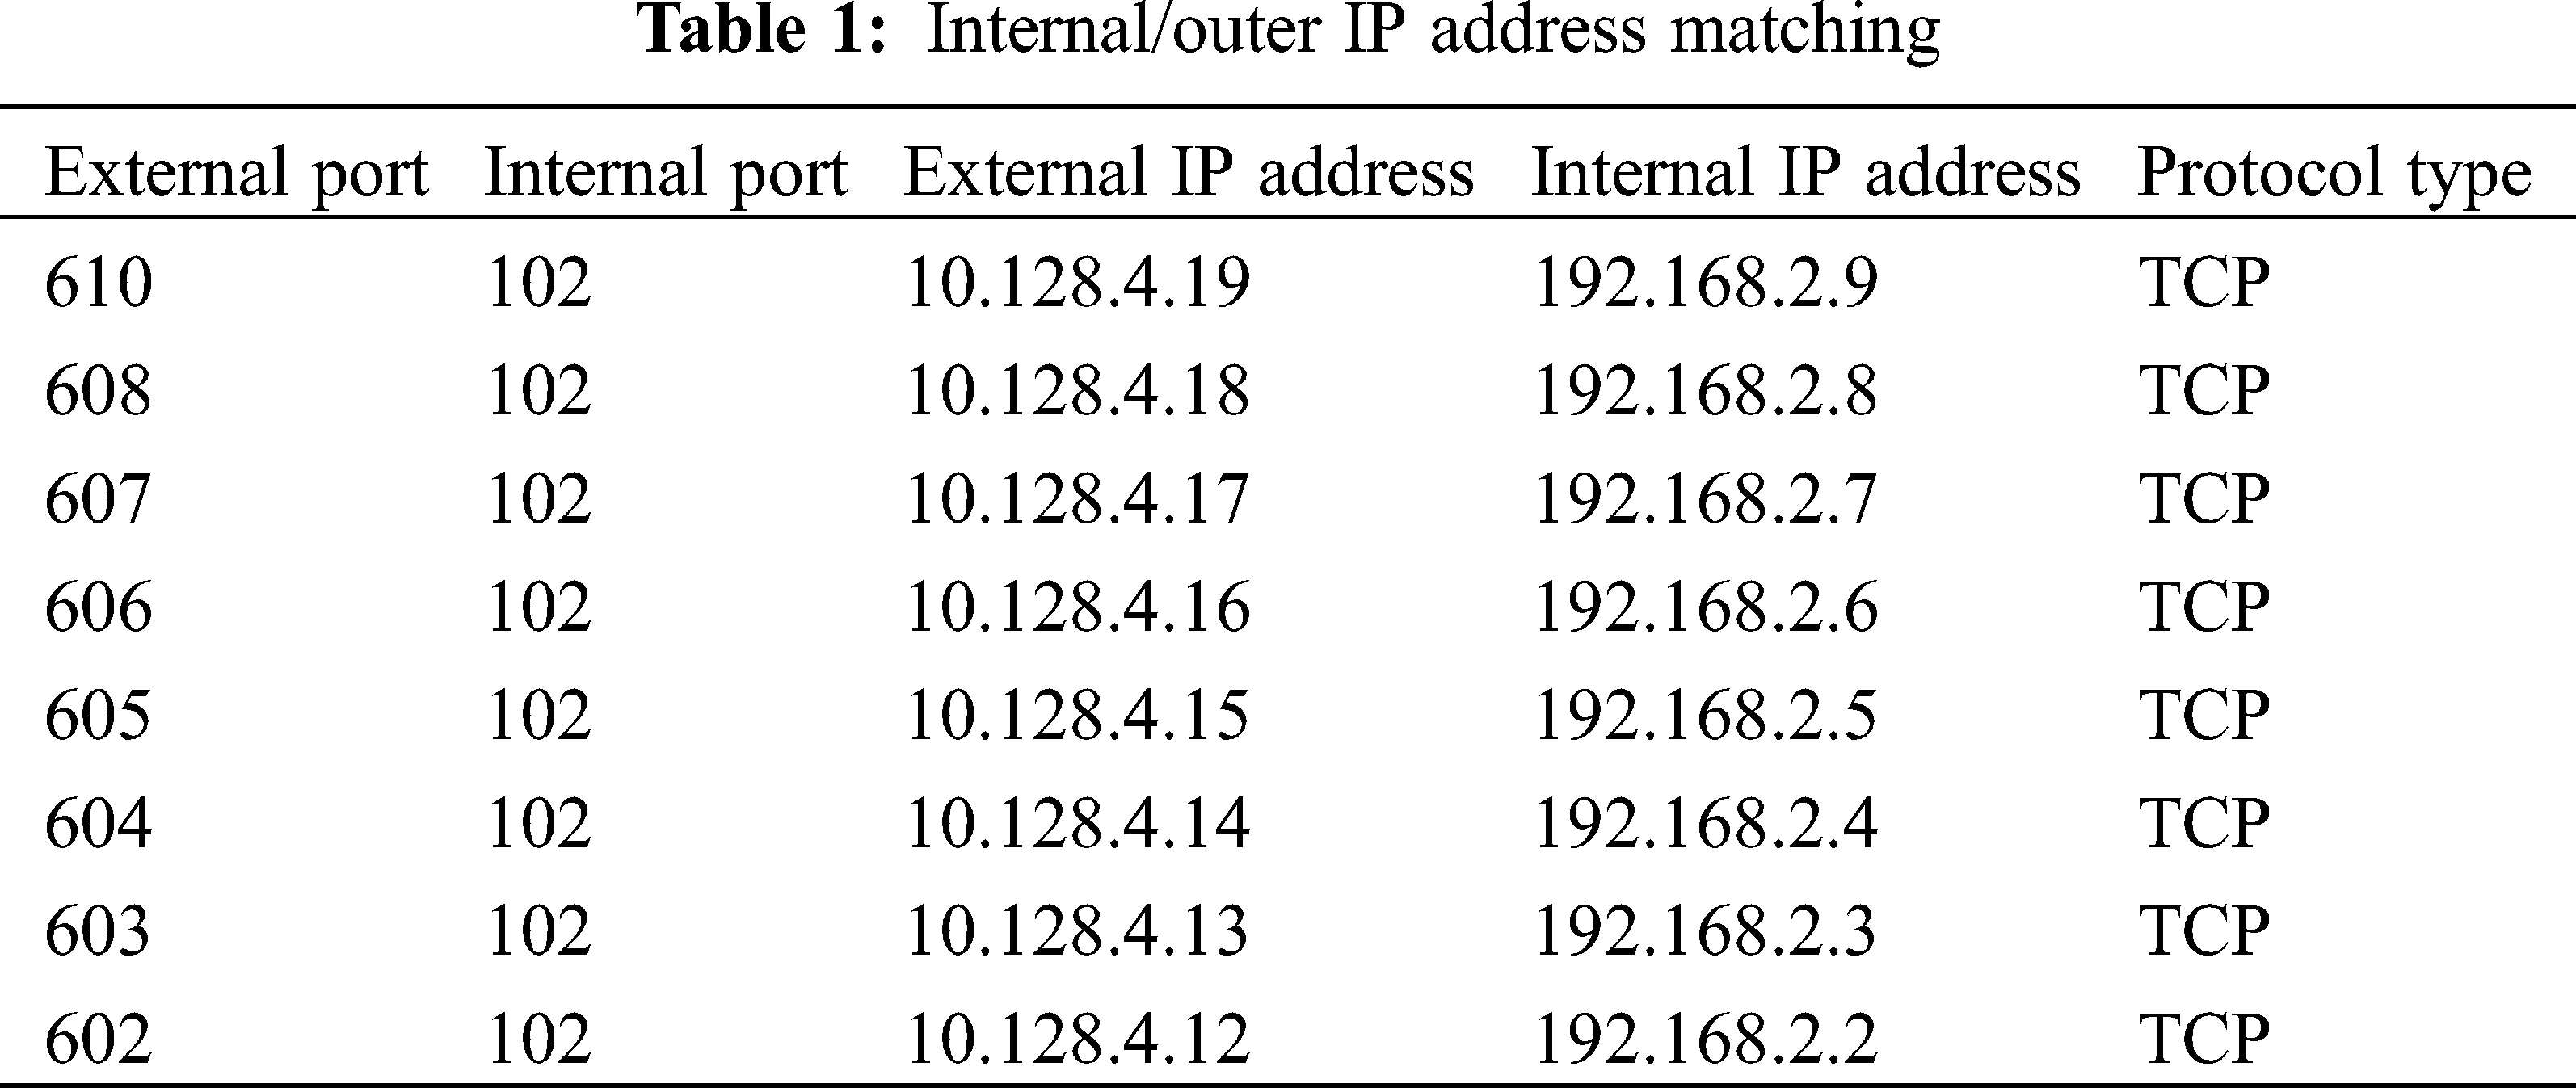
Router’s internal function is selected to set up virtual server, with communication protocol set as TCP. In IOServer, the device address is 192.168.2.#:0:102, 0 is the slot number, 102 is internal port number, which are used to allocate virtual server. Then, distribute different external port for different source IP addresses, for example, set up an external port number 602 to match with internal port #2 through TCP protocol, where in IOServer, device address is 192.168.2.2:0:102. The corresponding IP matching is shown in Fig. 7.
3.3 IOServer Remote Communication Configuration
After virtual server is set well, it is needed to reboot the router. The original wired communication in IOServer could not be used again, and the device IP address should be re-allocated. The new device address is 10.128.4.11:602. The IP address and port numbers of configuration file kvs7-200.ini are allocated to new external addresses. So far, IOServer remote communication configuration is completed. At last, site is refreshed in KingSCADA, to run the server side.
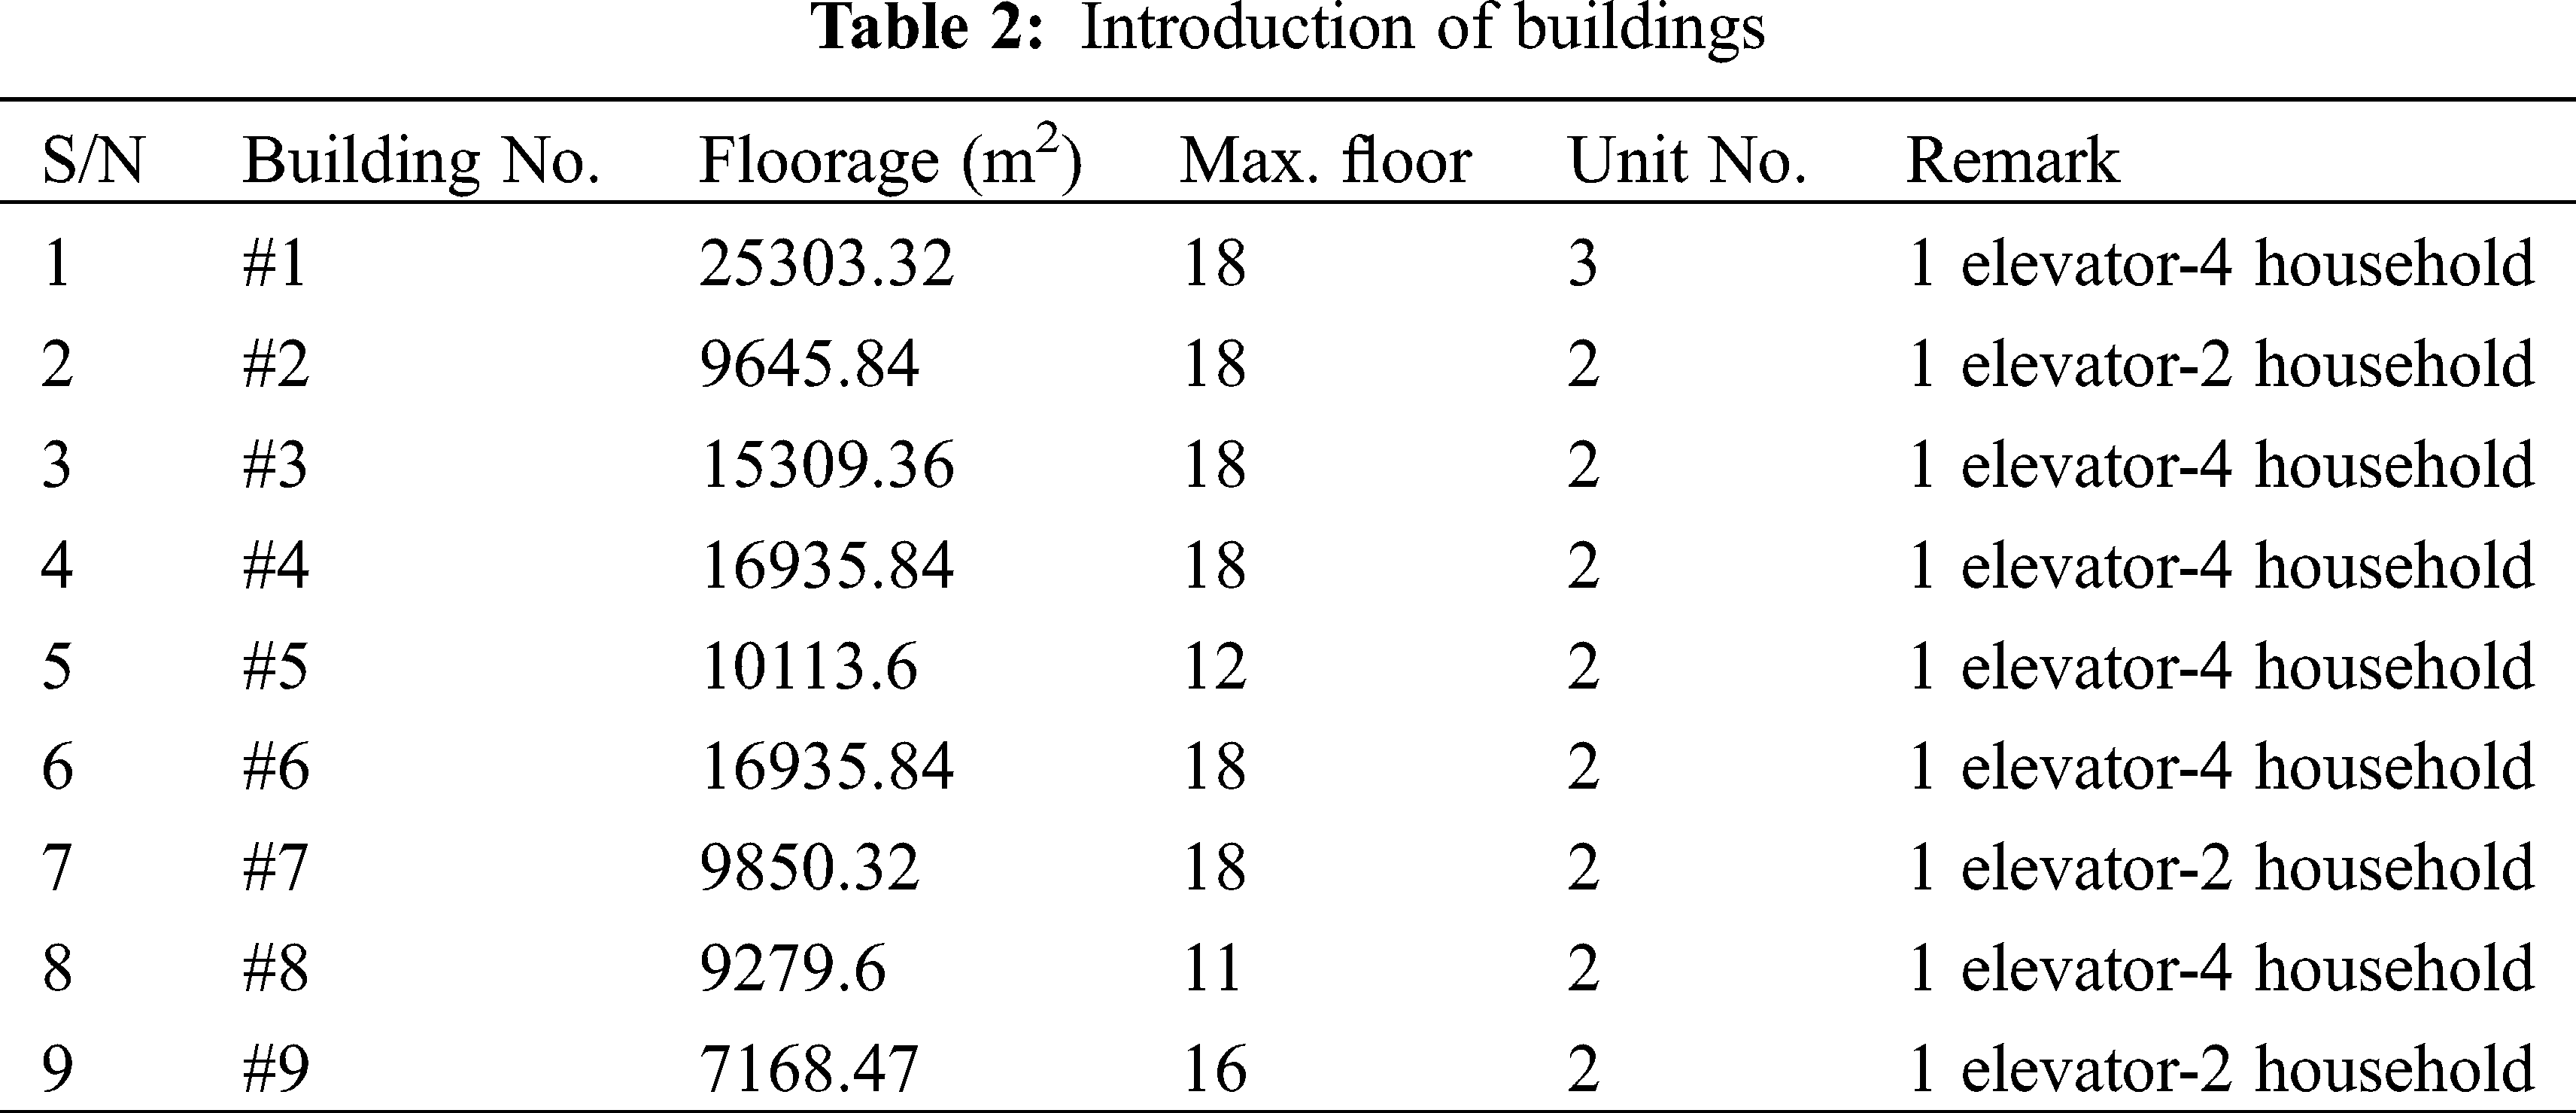
The selected research object is a certain community in a certain city. This community is constructed in 2018, including 9 buildings and 34 units, with the overall floorage of 120,542 m2. The buildings in this community adopt radiant floor heating system, and the heat source is a self-built heat exchange station. The first high-temperature hot water is transported from municipal heat distribution pipeline to the heat exchange station, and then to heating system in the building via secondary pipe network after heat transfer; the secondary pipe network is lifted and laid over garage; the stand pipes of each unit uses paralleled double-pipe system; high-rise buildings are divided into high floors and low floors, so high floors over the 11th floor use high-floor system and low floors below the 11th floor use low-floor system. See the floorage statistics of different floors in Tab. 2 below.
The heating system’s regulation mode is: set return water temperature as the initial variable, and design cascade control system according to pipeline pressure. The cascade control system is designed to include two loops: set return water pipeline temperature as the main loop variable, and the supply/return water pipeline pressure difference as minor loop variable. After stabilizing branch pressure, this system compares the difference between real return water temperature and calculated return water temperature, and regulates the electric regulation valve of return water pipeline at unit access, thereby controlling return water temperature by changing the flow. The work flow is shown in Fig. 7 as below.
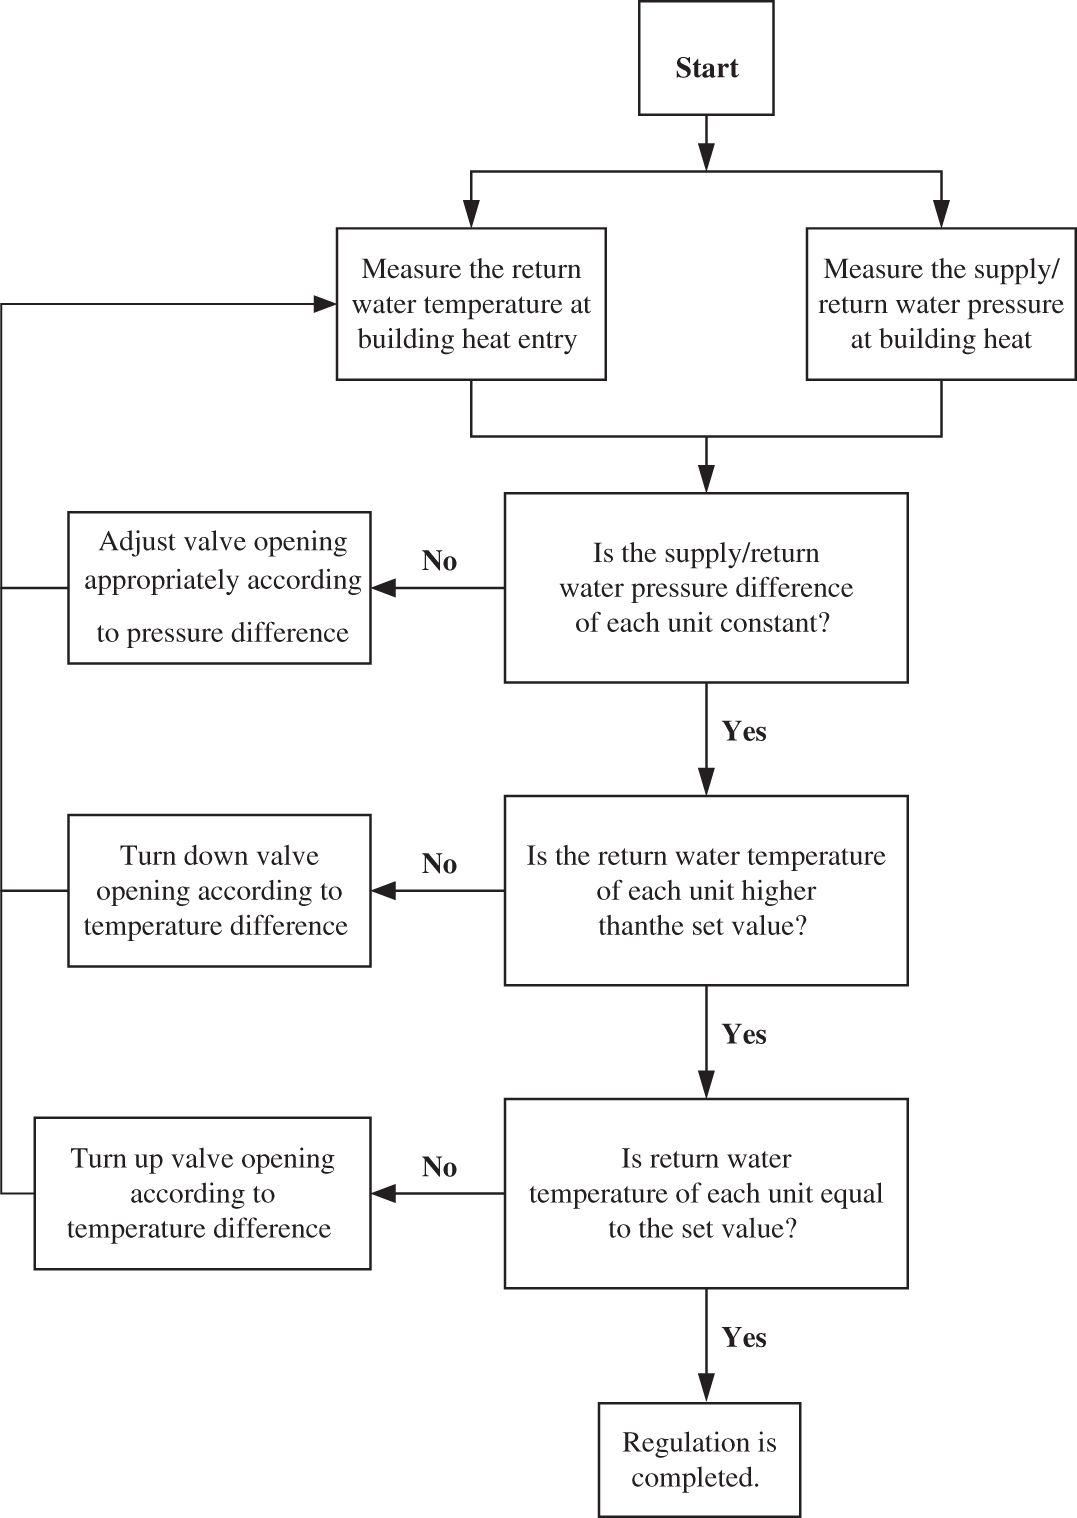
Figure 7: Designed flow chart of regulation balancing system for secondary pipeline network
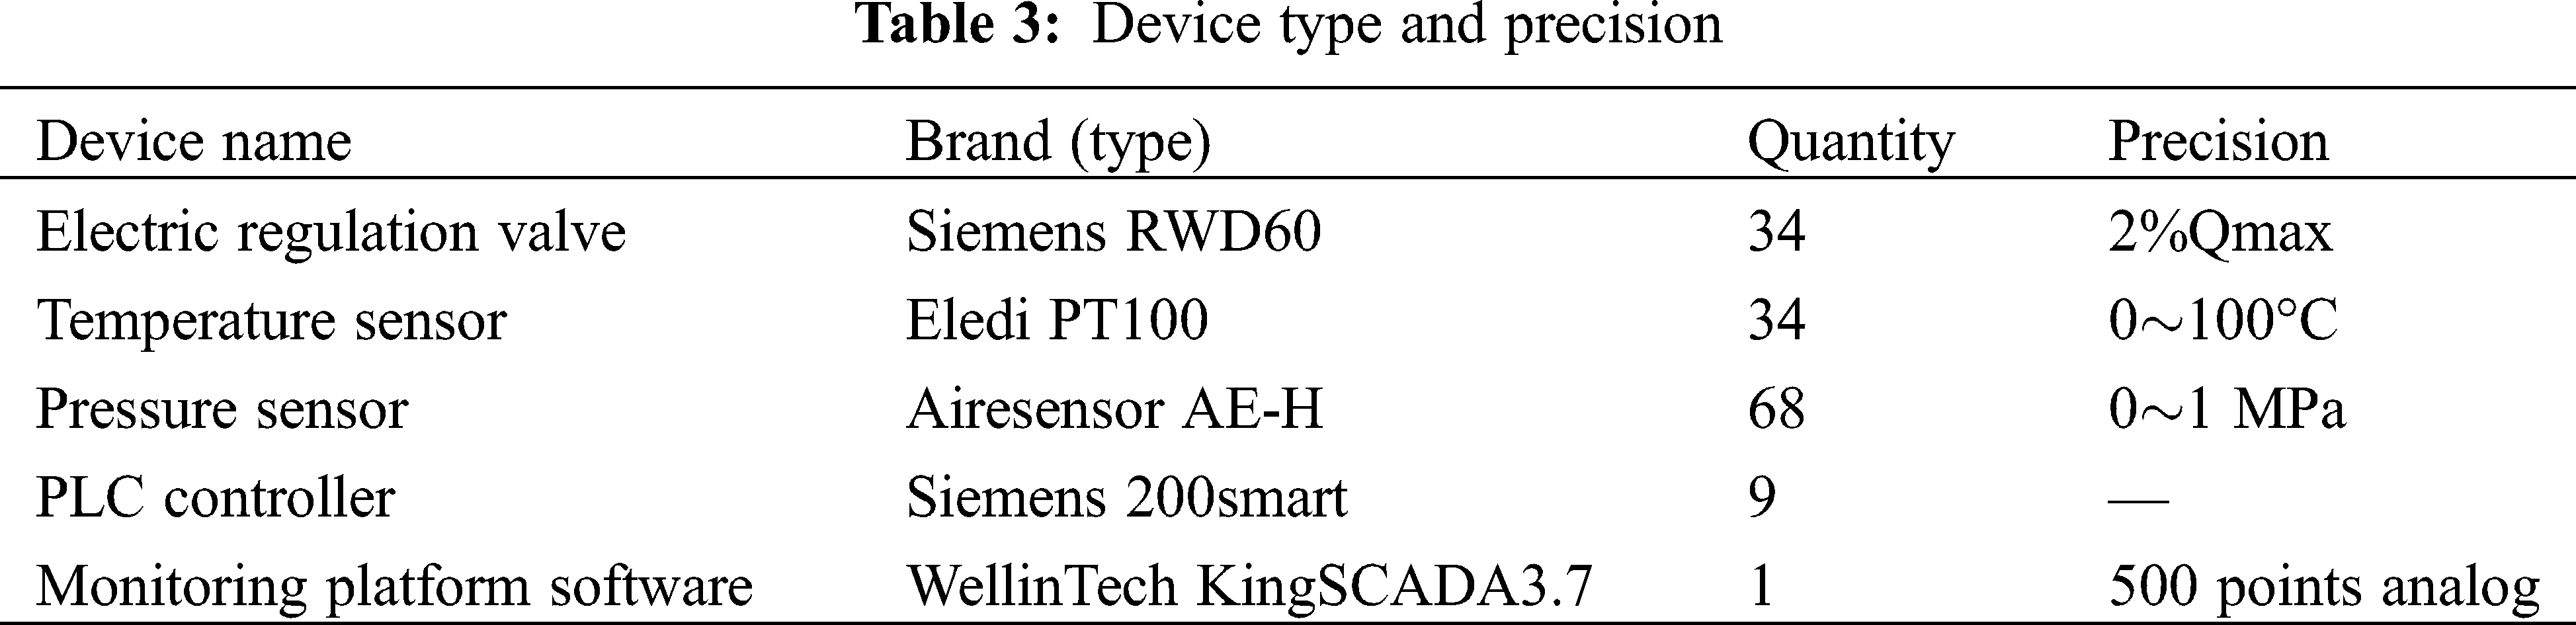
The monitoring software and acquisition device type is shown as below.
4.2.1 Remote Communication Time Test
This remote monitoring system is installed in the control center of thermal company, which network is connected with 200 Mbps broadband and is 13.7 km away from the heat exchange station. By means of public network Internet, a virtual server is established for IP mapping, to achieve remote data communication effect. The IP ping value of virtual server of heat exchange station is tested in the remote monitoring system computer of the thermal company, as below.
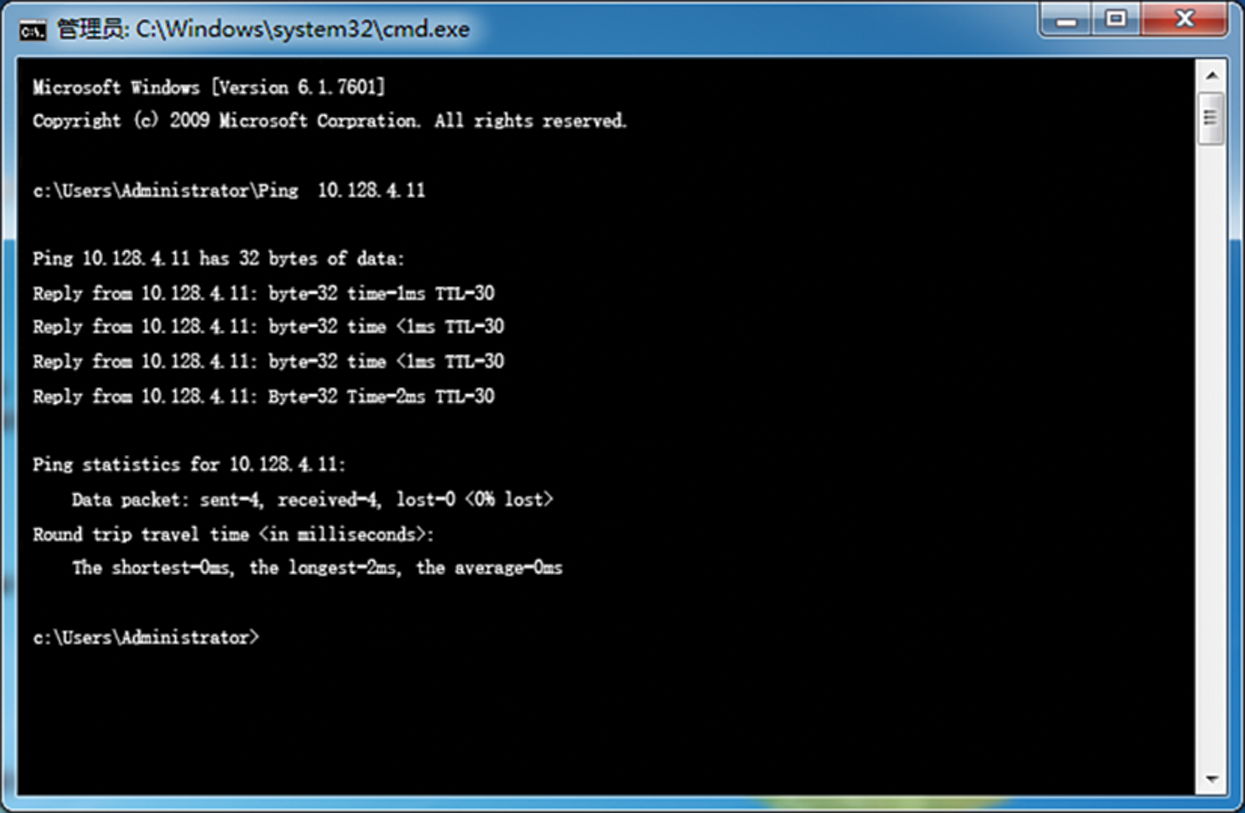
Figure 8: IP transmission respond
Perform IP communication connection for 4 times, with transmission time less than or equal to 2 ms and data loss rate of 0%. Therefore, applying IP mapping technology via network virtual server has good practical effects in remote data transmission of remote heating monitoring system.
4.2.2 System Respond Time Test
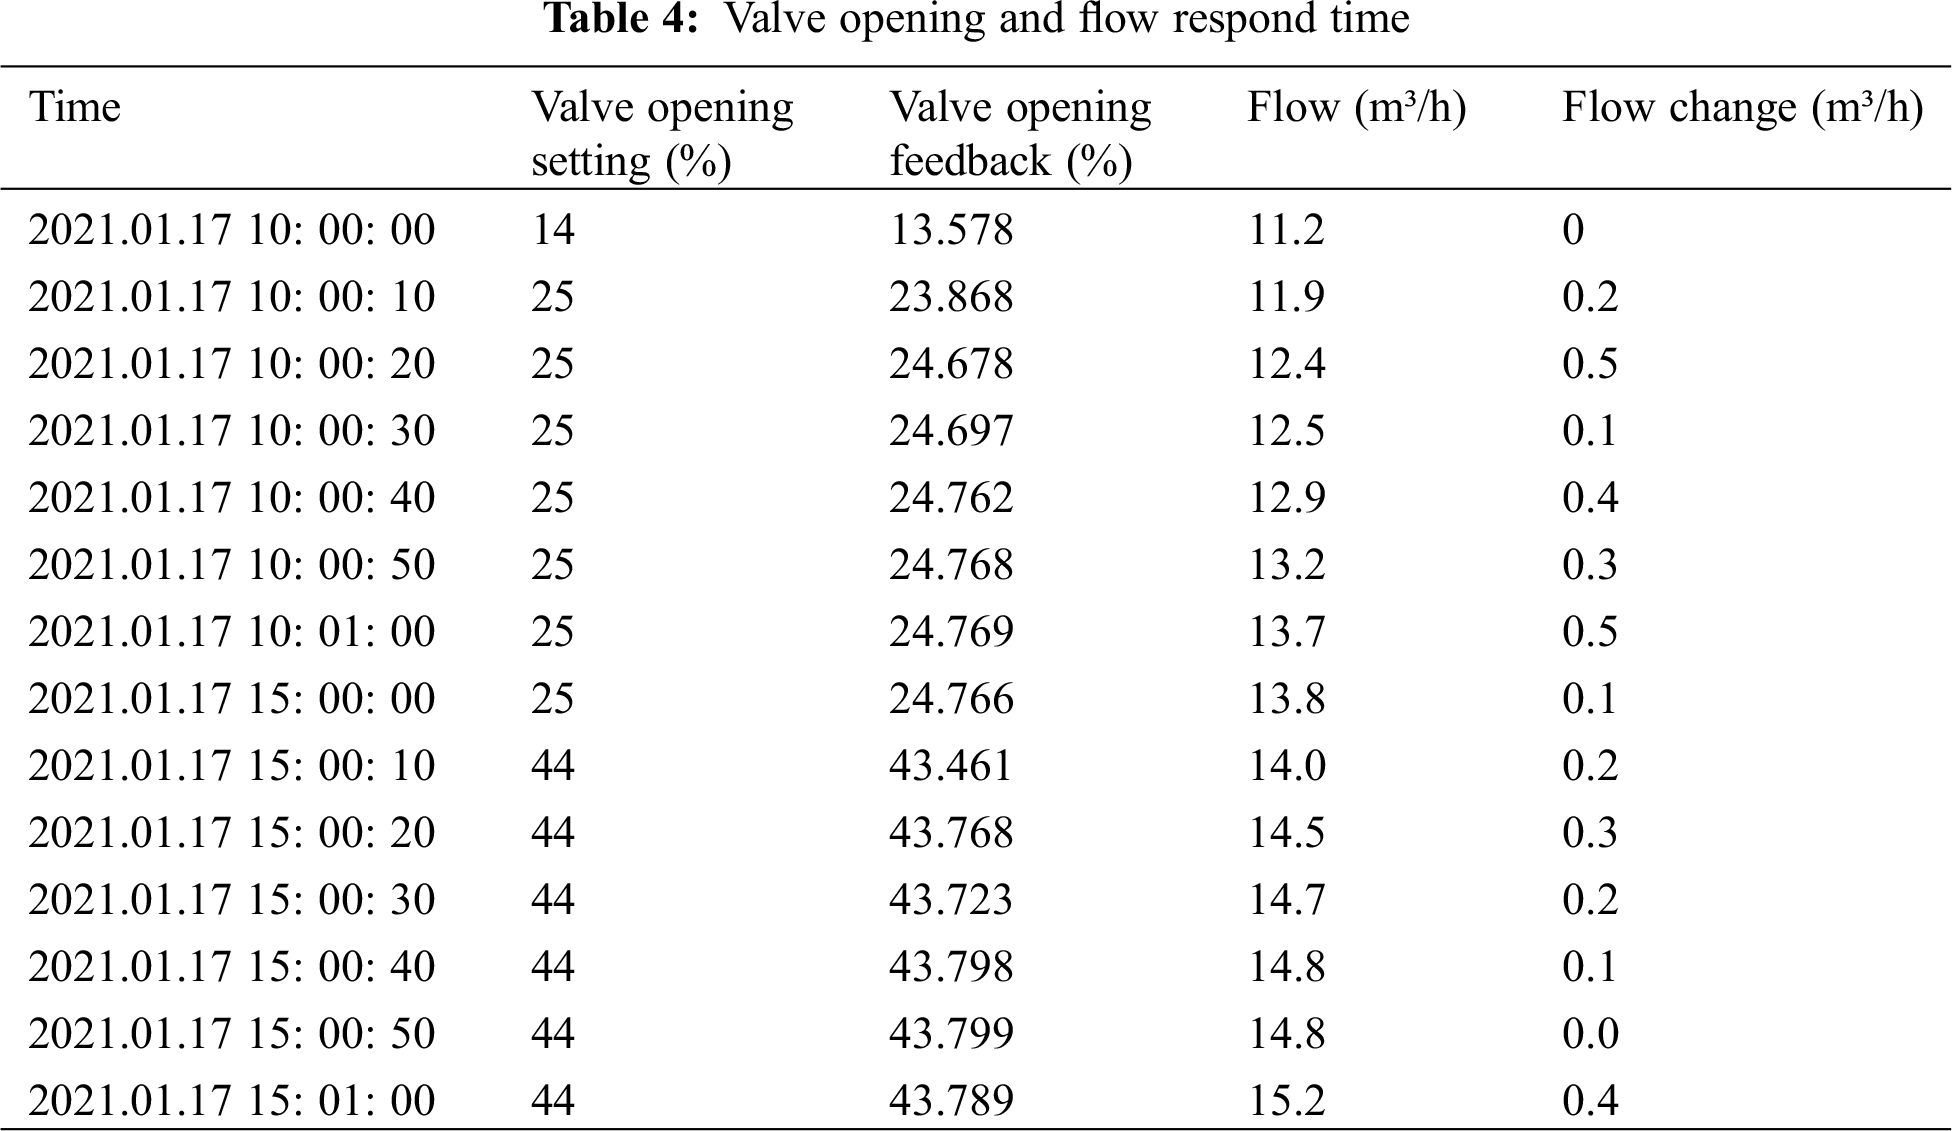
This heating system raises the supply water temperature in first pipeline network by 3–4°C to about 45 at 8:00 am daily. In heating seasons, the manually remote modified data of one day is acquired to manually set the opening of electric regulation valve, and the changes of valve opening and the respond time of valve opening and flow is also recorded. During data acquisition, the vale opening is regulated manually twice. See specific respond time data in the following table.
The respond time of electric regulation valve is about 10 s∼30 s, which may differ due to such factors as operating condition, water source pressure, valve diameter, etc. Generally, it is 66% of full open time, that’s τ = Tmax * 66%. From the data analysis in Tab. 4, when adjusting the opening of electric regulation valve of heating system remotely, it is known from valve opening feedback and flow change values that, the maximum respond time of electric regulation valve is 20 s, minimum respond time is 10 s, and average respond time is 15 s. Since the larger the opening of electric regulation valve is, the longer the respond time will be, so the valve of this system has a good practical effect.
4.2.3 Measured Data Error Test
An on-site acquisition display is installed at the acquisition device in building #6, which can real-time show and record pipeline temperature and room temperature, and the opening of electric regulation valve can be monitored by accessing to master computer software. On January 17, 2021, we monitored on site for ten minutes in the morning, and then compared with remote monitored data. See the comparison results in Tab. 5 below.
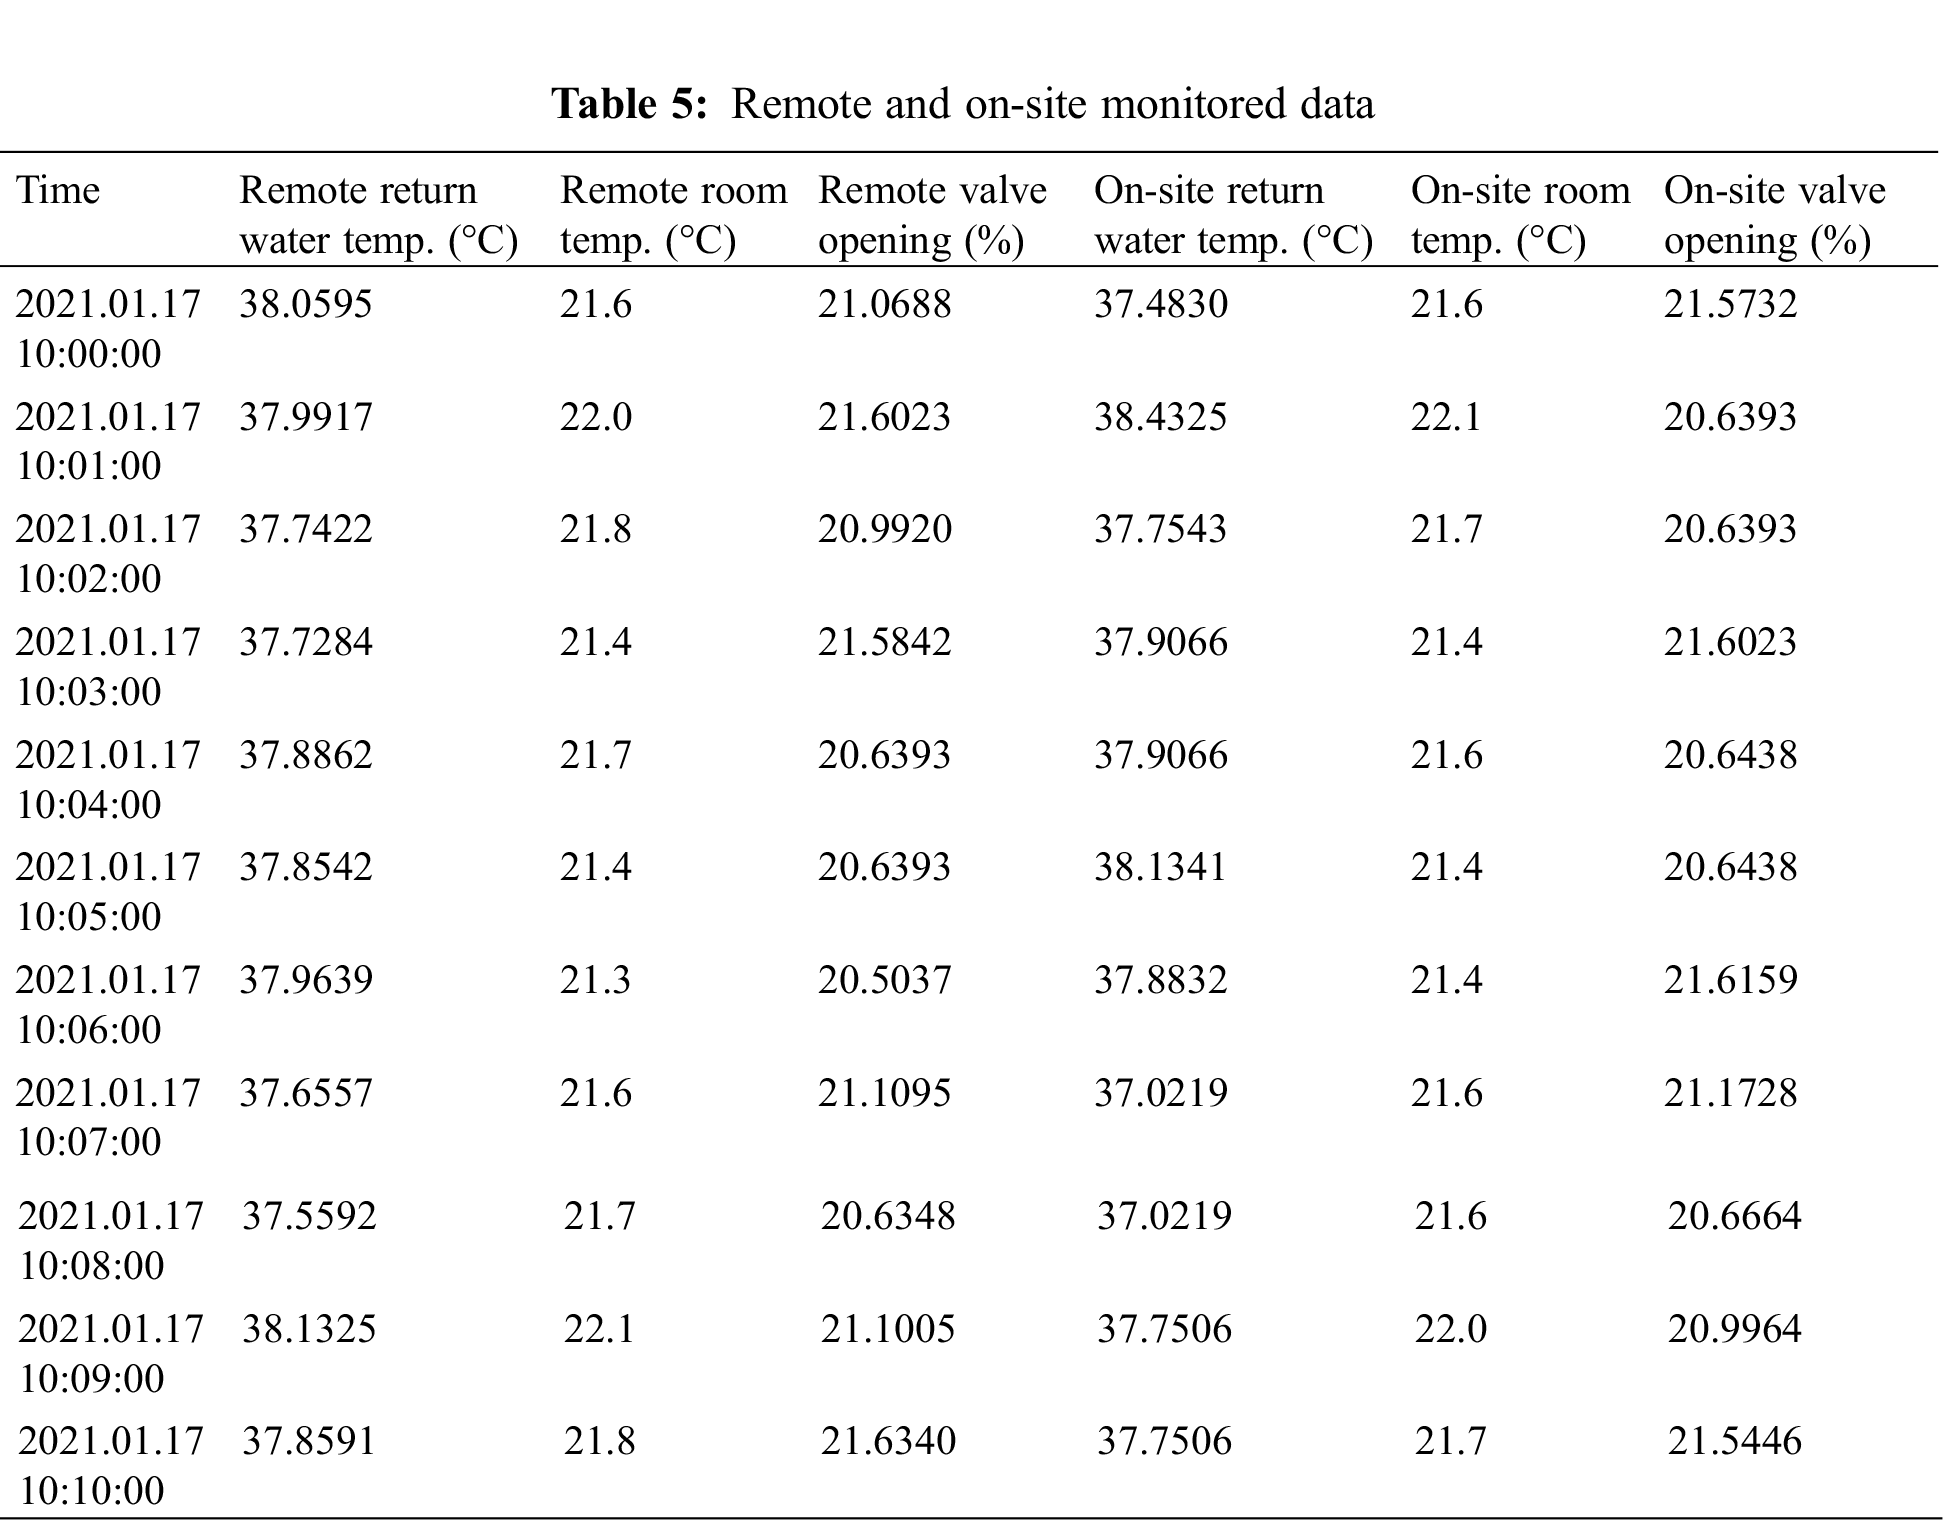
From data error analysis in above table, the maximum error between remote and on-site return water temperature is 0.6338°C, minimum error is 0.1210°C, average error is 0.13873°C; the maximum error between remote and on-site room temperature is 0.3°C, both of which are the same for many times, the minimum error is 0, and average error is 0.03°C; the maximum error between remote and on-site opening of electric regulation valve is 0.9630%, minimum error is 0.0045%, and average error is 0.02294%. As both on-site and remote monitoring instrument have measuring error, so the monitored data error of this system conforms to the theoretical error scope, demonstrating a good data monitoring effect.
4.2.4 Data Trend Curve Prediction
In heating seasons, the weekly data of one building is acquired to generate real-time trend curve and historical trend curve, and then the data of the past one week is summarized, including return water temperature, room temperature, valve opening, etc. The operation and maintenance staff can make judgement on the heating condition of the past week based on this data trend curve, evaluate the heating effect, and improve the heating system in the following work, so as to increase heating efficiency, meet resident needs and reasonably use thermal resource. The specific trend curve interface is shown in Fig. 9.
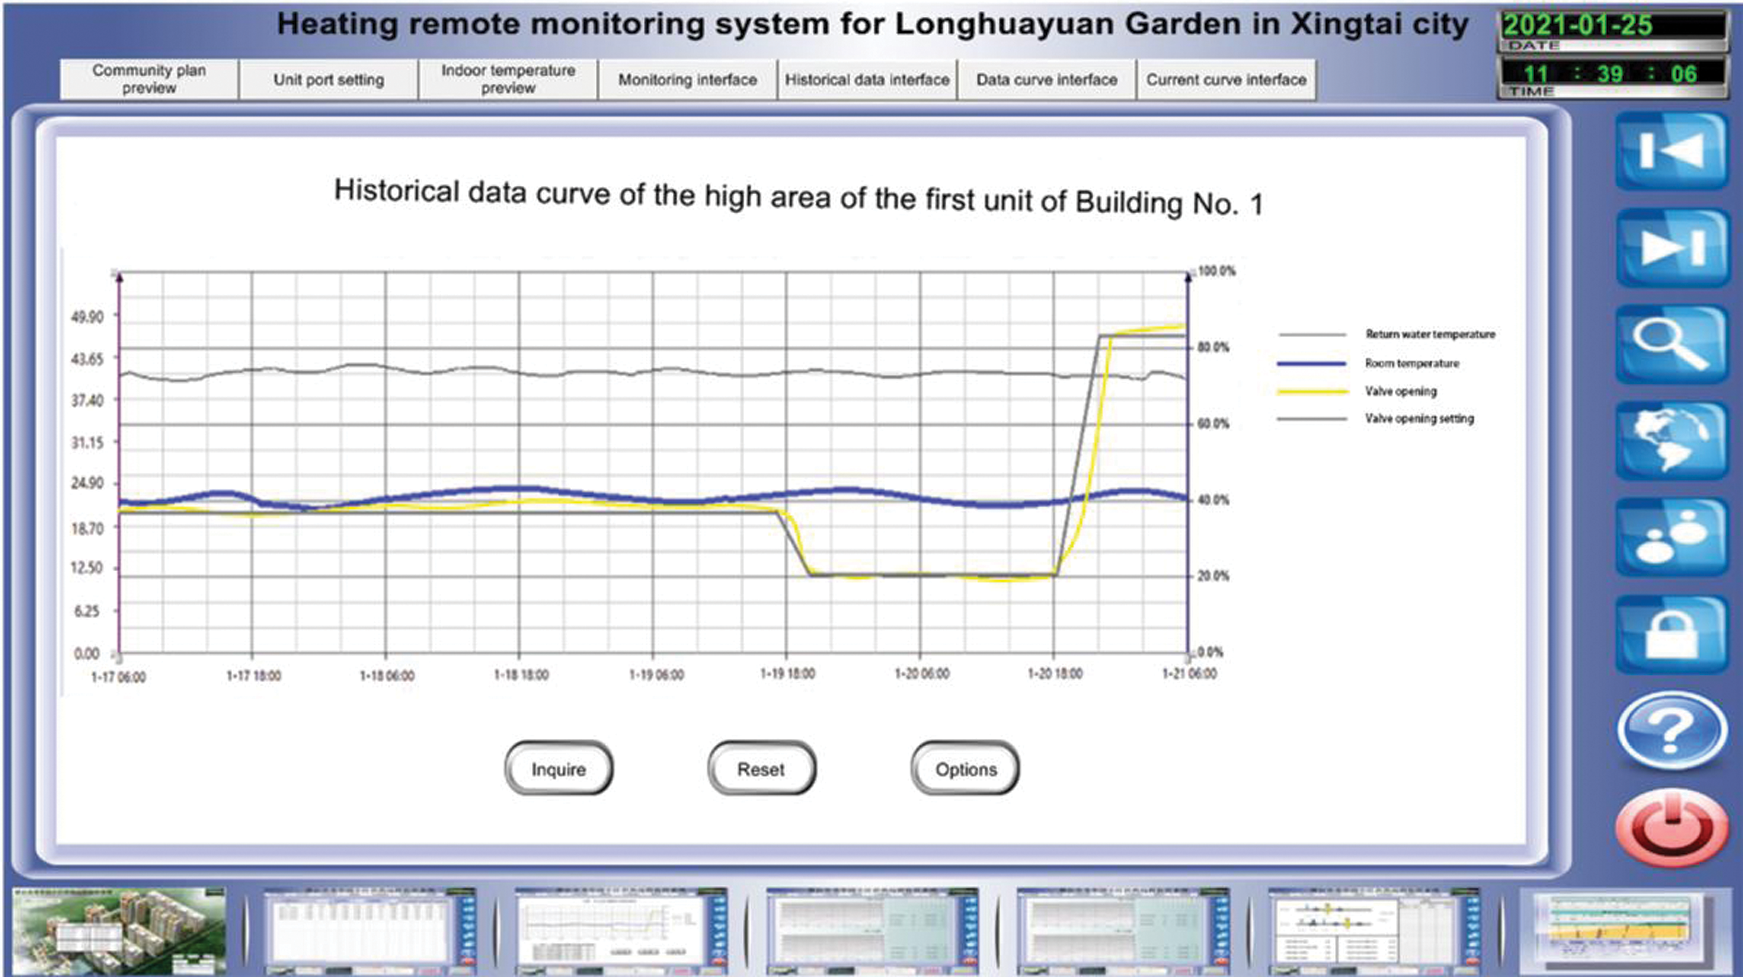
Figure 9: Trend curve interface
The actual measurement of the remote heating monitoring system in a certain district of a certain city, in accordance with the standards for remote data red-write test and general-purpose electric regulation valve’s opening respond time, this remote monitoring system is evaluated. The results indicate that this system has good real-time data acquisition system, normal remote parameter modification, normal data trend analysis capability, and good overall monitoring effect.
This paper constructs a remote communication network and a monitoring system of heating system from monitoring interface, monitoring function and remote communication. By using the drawing function of monitoring system, the trend curve is drawn out to forecast the operation trend. From historical operation data, it is predicted that it is feasible to maintain the return water temperature and room temperature at about 38°C and 21.5°C in current operation state; after installing on-site monitors, the on-site and remote data acquired is compared and analyzed, to obtain the average errors of remote return water temperature and valve opening are 0.13873°C and 0.02294%.
Using IP surveying and mapping technology to realize remote monitoring of heating system in a certain district, achieves the expected purpose, and realizes real-time control of the heating system anytime and anywhere. The development of the monitoring system in this chapter has certain practical significance for the operation and regulation of the remote heating system.
Funding Statement: This work was supported by the Hebei Province Innovation Capability Enhancement Project (19244503D), the Hebei Province Key R&D Program Project (20374504D) and the Hebei Province Higher Education Science and Technology Research and Development Project (ZD2020332).
Conflicts of Interest: The authors declare that they have no conflicts of interest to report regarding the present study.
1. Ma, L. C. (2009). Research and application of Web-based remote monitoring system. Chang’an University, 25(163–164), 186. [Google Scholar]
2. Yang, X. G. (2011). Research on key technology of PLC remote monitoring. Harbin Institute of Technology. [Google Scholar]
3. Chen, L. J., Yuan, H. B., Wang, J. M., Yang, S. R. (2008). Network-based remote centralized heating monitoring system. Microcomputer Information. [Google Scholar]
4. Wang, J. J., Zhai, T. K., Pan, J. W., Duan, N. N., Liu, M. H. (2012). KingScada-based compressor remote control. Control and Instruments in Chemical Industry, 6(805–806), 813. [Google Scholar]
5. Li, D. Y. (2017). Monitoring system of municipal heating systems integrated with remote control. Shandong University. [Google Scholar]
6. Dai, S. Z., Chun, Y. W., Xu, H., Lv, B. L. (2013). Make-up water treatment system based on KingSCADA. Applied Mechanics and Materials, 401–403, 1666. [Google Scholar]
7. Wang, F. C. (2013). Energy consumption oriented network-on-chip mapping method. Journal of Networks, 8(12), 2857–2863. [Google Scholar]
8. Shao, Y. Q., Zhang, W. J., Tang, H., Zeng, X. H. (2012). Implementation of virtual ID-virtual IP mapping method in IOT gateway. Computer Engineering and Applications, 15, 88–92. [Google Scholar]
9. Zhao, H. B., Yu, X., Yang, Y. H. (1999). Analysis and implementation of IP network address mapping technology. Electronic and Applied Technology, 5, 44–46. [Google Scholar]
10. Li, Y. J., Zhu, S. M. (2003). Research and implementation of TCP/IP protocol-based virtual network communication platform. Journal of Chinese Mini-Micro Computer Systems, 24(3), 403–406. [Google Scholar]
11. Vinh, N., Andrew, D. (2018). An I2C based architecture for monitoring legacy manufacturing equipment. Manufacturing Letters, 15, 67–70. [Google Scholar]
12. Yang, C. C. (2015). Design and implementation of header compression and packet concatenation for real-time communication service. Power Systems Engineering Research Center Final Project Reports. [Google Scholar]
13. Chen, Y. (2019). Design and development of monitoring system of heating pipeline well based on IoT. Xi’an University of Technology. [Google Scholar]
14. Zhu, Y. H., Wang, P. (2017). Analysis of hydraulic balancing technology status and application of IoT hydraulic balancing valve. District Heating, 5(80–83), 117. [Google Scholar]
15. Wang, L. J. (2019). Research and development of automatic monitoring system of heating pipeline system. Qingdao University. [Google Scholar]
16. Fan, J. Y., Huang, Y. C., Gan, Q. (2018). Solar central heating system based on smart phone remote monitoring. Computer Products and Circulation. [Google Scholar]
17. Abbasloo, S. (2020). Designing low and ultra-low latency networks. New York University Tandon School of Engineering. [Google Scholar]
18. Waikul, D. M. (2020). Bluetooth-enabled energy monitoring system with wireless data acquisition using web server. Case Western Reserve University. [Google Scholar]
19. Kirtane, A. N. (2020). Energy efficient data writing methods for low power networked wireless devices. San Diego State University. [Google Scholar]
20. Chen, T. J. (2020). Algorithms and experimentation for future wireless networks: From Internet-of-Things to full-duplex. Columbia University. [Google Scholar]
21. Basi, M. N. M. (2019). Enhancement of security for electronic record using virtual local area networks techniques. Mohammed Elghazali Hamza Khalil. [Google Scholar]
22. Eduan, J. S. (2019). Module-level health monitoring of solar pv plants using lora wireless sensor networks. Stellenbosch University. [Google Scholar]
 | This work is licensed under a Creative Commons Attribution 4.0 International License, which permits unrestricted use, distribution, and reproduction in any medium, provided the original work is properly cited. |