| Fluid Dynamics & Materials Processing |
DOI: 10.32604/fdmp.2021.016763
ARTICLE
Assessment of the Application of Subcooled Fluid Boiling to Diesel Engines for Heat Transfer Enhancement
School of Energy and Power Engineering, Shandong University, Jinan, 250061, China
*Corresponding Authors: Guoxiang Li. Email: liguox@sdu.edu.cn; Ke Sun. Email: sunkeke@sdu.edu.cn
Received: 24 March 2021; Accepted: 08 June 2021
Abstract: The increasing demand of cooling in internal combustion engines (ICE) due to engine downsizing may require a shift in the heat removal method from the traditional single phase liquid convection to the application of new technologies based on subcooled fluid boiling. Accordingly, in the present study, experiments based on subcooled flow boiling of 50/50 by volume mixture of ethylene glycol and water coolant (EG/W) in a rectangular channel heated by a cast iron block are presented. Different degrees of subcooling, velocity and pressure conditions are examined. Comparison of three empirical reference models shows that noticeable deviations occur especially when low bulk subcooling and velocity conditions are considered. On the basis of the experimental data, a modified power-type wall heat flux model is developed and its ability to represent adequately reality is tested through numerical simulations against a reference rig case and a practical diesel engine. Computational results show that this modified model can effectively be used for practical engine cooling system design.
Keywords: Subcooled flow boiling; diesel engine; ethylene glycol/water mixture; cast iron heated surfaces; wall heat flux model
The research on the sub-cooled flow boiling heat transfer in modern diesel engine cylinder head design has recently aroused great interest due to the following reasons. Firstly, subcooled flow boiling occurs in critical high heat-flux region or under high thermal load conditions [1]; secondly, the subcooled flow boiling heat transfer enables it to remove the ever increasing thermal load in engine cylinder head, whose rate is order-of-magnitude higher than that of convectional single-phase forced convection heat transfer [2]. However, the boiling process is extremely complex and influenced by multiple parameters, such as temperature [3], velocity [4], pressure [5], material roughness [6], etc., which is still not fully understood yet.
Finlay et al. [7] investigated the subcooled flow boiling heat transfer to 50/50 EG/W in a uniformly heated cylindrical duct with a small cross section made of copper, aluminum and cast iron, respectively. According to the authors, boiling was much less vigorous with the aluminum and cast iron testing sections compared with that of the copper testing section, and nucleate boiling can have a significant influence on heat transfer, particularly at the coolant velocities below 1.0 m/s. After that, Norris et al. [8] conducted laboratory tests to determine the relationship between heat flux and wall temperature by using part of a real diesel engine cylinder head instead of a cylindrical duck, and the experimental results was in good agreement with the prediction of Chen model [9] and Finlay’s experimental data [7]. Unfortunately, the comparison was made within low wall superheat and heat flux range. Abou-Ziyan [10] investigated the subcooled flow boiling heat transfer of water in six different T cross-section ducks heated from bottom cast iron test sample, which simulates the cooling of critical areas in the cylinder heads of diesel engines. It can be seen from the results that the increase in either the width or height aspect ratio of the T-ducts enhances the convection heat transfer coefficients and the boiling heat fluxes considerably. Ramstorfer et al. [11] carried out the experiments of 40/60 EG/W on subcooled flow boiling heat transfer with two different types of coated and one original uncoated cast iron surfaces in a vertical test channel. The experimental results demonstrated that the modified microstructure of the heated surface can markedly intensify the boiling heat transfer process, and the concept could be applied to engine cooling systems.
Recently, Hua et al. [4] conducted subcooled flow boiling experiments on water in a one-side heated rectangular channel with cast iron heated surface. In contrast to the comparison results in Finlay et al. [7], Chen model over-predicted the wall heat flux, according to the authors, it is because that Chen model was not specially developed from data for cast iron heating surface and one-sided short heating condition. Yu et al. [12,13], compared the prediction of four wall heat flux models, proposed by Mcadams et al. [14], Jens et al. [15], Shah [16] and Kandlikar [17], respectively with the experimental subcooled flow boiling heat transfer data in a one-sided heated stainless steel tube using water, 50/50 EG/W and 40/60EG/W as the working fluids. The results showed that these equations failed to predict all the experimental results. Besides, an over-prediction can be seen in the high heat flux region, which is because that these equations were not developed for mixture boiling and one-sided heating. Paz et al. [6] conducted subcooled flow boiling experiments of water in a rectangular one-sided heating channel, and heating samples made of three different materials (copper, aluminum and stainless steel) were tested. The experimental results showed that deviations existed in boiling curves of different heaters, which is largely due to the different effect of interactions between fluid and solid combinations on the boiling process. Subcooled flow boiling on copper and stainless steel heating surfaces was experimentally investigated from both macroscopic and microscopic points of view by Zou et al. [18]. Although there is no obvious difference between the copper and the stainless surface in terms of bubble dynamics, the copper surface outperformed the stainless steel surface in terms of heat transfer coefficient, which is because that the heat conduction from free surface without covering bubbles to the region covered with bubbles is better for the heated surface of copper with a higher thermal conductivity. Recently, Chen et al. [19] conducted the numerical research on thermal property effect of heated surface on bubble growth with microlayer evaporation, and found that the higher the thermal conductivity of the heat transfer surface, the greater the rate of microlayer evaporation. It can be seen form the above findings that wall heat flux models derived from different experimental conditions, for instance, uniformly heated method, copper or aluminum heater, and different fluid-solid combinations rather than 50/50 EG/W and cast iron, would not be suitable for diesel engine coolant passage design.
Consequently, the sub-cooled flow boiling experimental data obtained from the test rig is of crucial significance, and the test rig is used to simulate the characteristic conditions of the coolant channels in the cylinder head regions diesel engines. However, the reprehensive subcooled flow boiling experimental data considering these conditions is not sufficient to either reveal the characteristic of subcooled flow boiling or develop an appropriate wall heat flux model for the application in diesel engine cylinder head design. Therefore, the objective of this work is to study the subcooled flow boiling characteristics under conditions similar to the actual diesel engine operating conditions. Moreover, a subcooled flow boiling correlation exclusively for cast iron heated surface was proposed by using the power-type addition method. And this correlation was incorporated into Computational Fluid Dynamics (CFD) codes and the performance of this modified model proved that it is suitable and accurate for diesel engine cylinder head design.
The experimental apparatus mainly consists of two parts, i.e., the circulate loop and the test section. A schematic diagram of the system is shown in Fig. 1. A storage tank of 150 L was designed to maintain stable bulk fluid temperature. And four immersion heaters with the total maximum power of 4 kW were installed at the bottom of the storage tank. In addition, a PID controller is used to receive the temperature signal from inlet temperature sensor, and control the heaters, thereby achieving and maintaining certain bulk fluid temperature. Likewise, a solenoid valve for high pressure nitrogen was mounted on the top of the storage tank to adjust the pressure in the loop by the PID controller. The fluid was circulated by a variable-speed pump, and the flow rate was kept at the prescribed values with the by-pass loop valve opened.
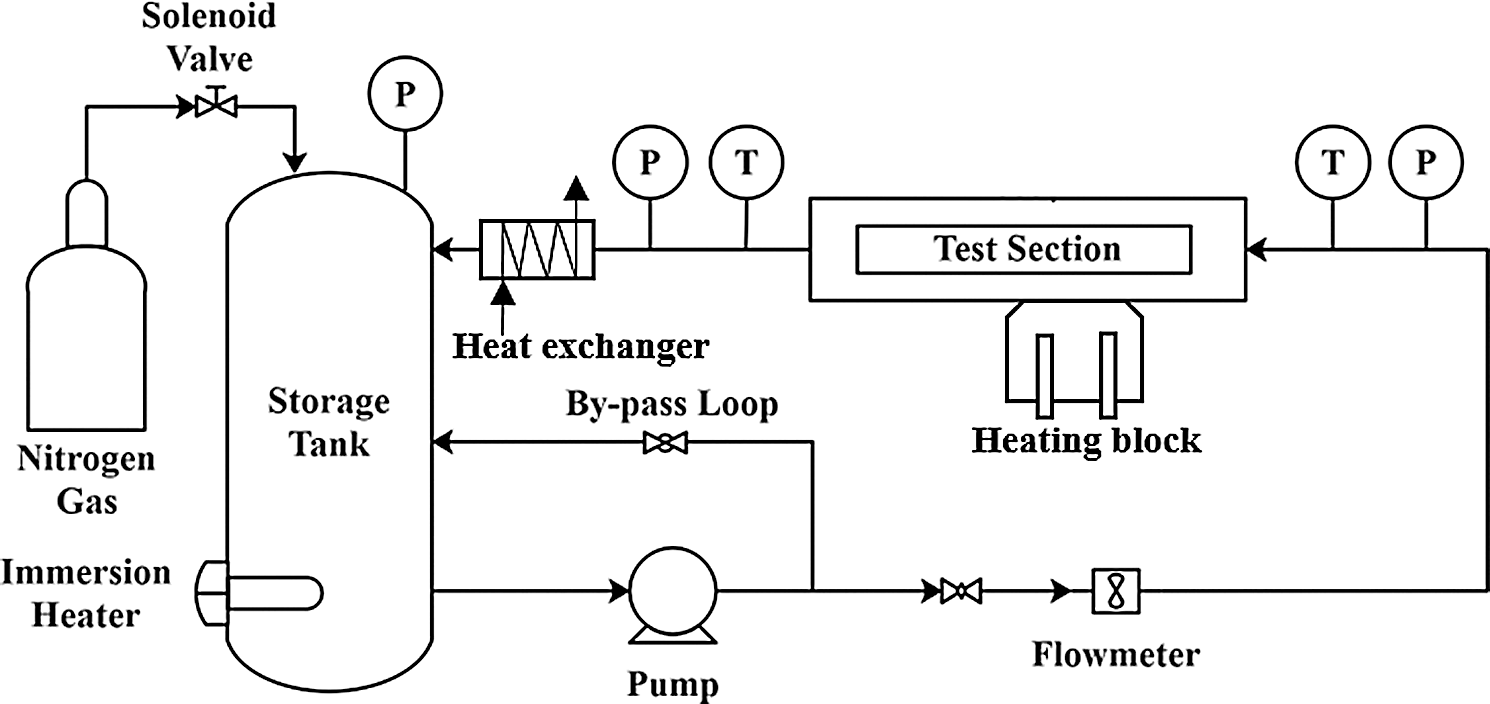
Figure 1: Schematic of boiling system
The test section is shown in Fig. 2, which is a horizontal rectangular test section with the length of 300 mm and a cross sectional area of 38 × 48 mm, located at 2000 mm downstream of a stainless steel rectangular tube, thereby ensuring that the flow in the test section was fully developed, as shown in Fig. 3. The test specimen made of cast iron is in the dimension of 90 × 10 mm and fitted as the bottom surface of the channel, which is located at 110 mm downstream the test section inlet. The test specimen was heated by 7 heating rods inserted below the testing surfaces, which can supply a maximum power of around 7 kW. As shown in Fig. 4, seven K-type thermocouples with the diameter of 1.0 mm were arranged below the test specimen along the vertical direction in two rows, among them, three thermocouples were placed in the upper row and the other four were in the lower row. The distance between the upper row and the test section surface is 3 mm, and that between the upper and lower row is 5 mm. PTFE (Polytetrafluoroethylene) was coated on the surrounding surfaces of the cast iron test sample to minimize thermal diffusion.
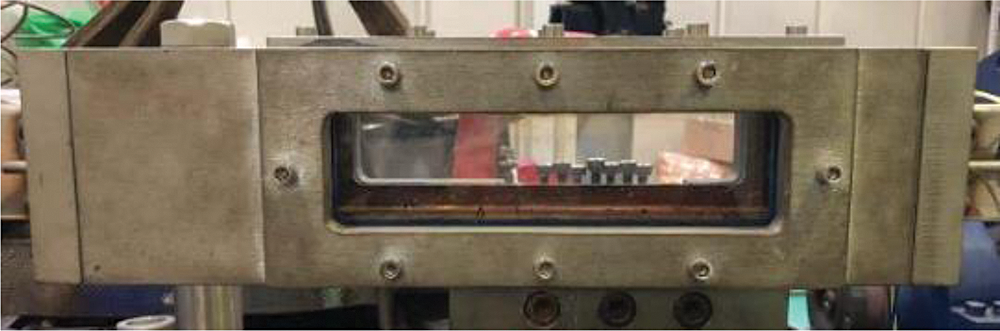
Figure 2: Photo of the test section
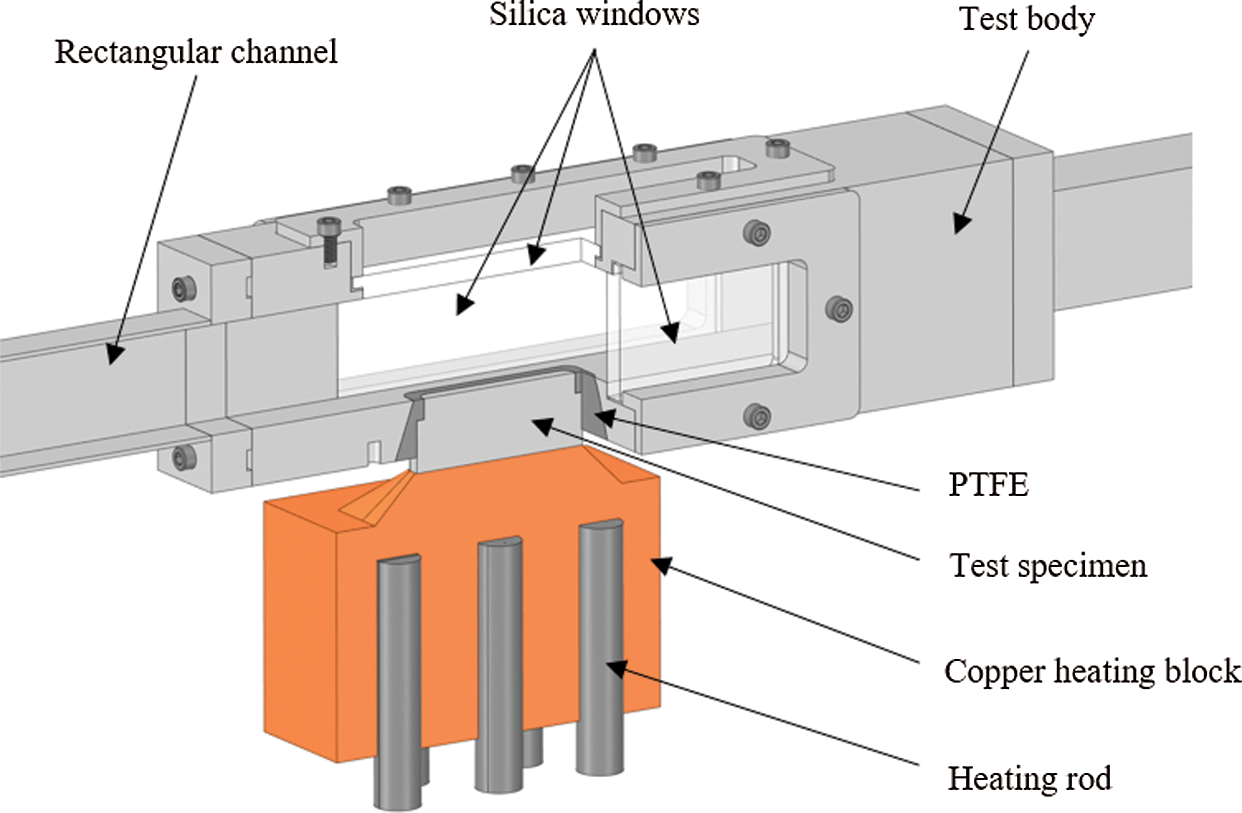
Figure 3: Details of test section
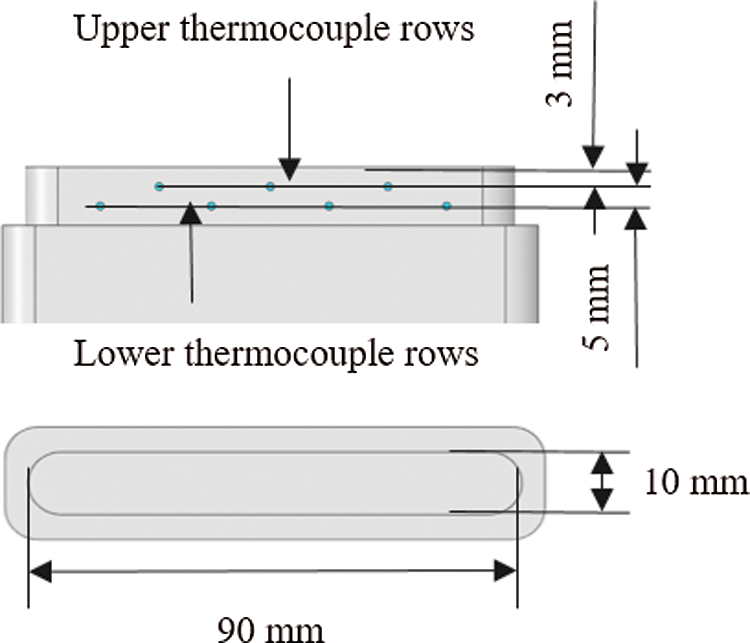
Figure 4: Location of thermocouples and dimension of test specimen
Prior to the formal testing, the bulk fluid was heated to the temperature close to its boiling point (around 95°C) for several hours, in this manner to remove the dissolved gas in the fluid. The experimental range of inlet temperature, bulk velocity and system pressure were set as 70–90°C, 0.25–1 m/s and 1–2 bar, respectively. Under each experimental condition, the test surface was heated from low heat flux to high heat flux, and the data was taken when the system reaches and maintains the thermally steady state for 20 min.
where T1 and T2 are average temperatures of the upper and lower thermocouple rows respectively, H1 (3 mm) and H2 (5 mm) are the distance from the heated surface to the upper and lower thermocouple rows, respectively, as shown in Fig. 4. λ is the thermal conductivity of the test specimen.
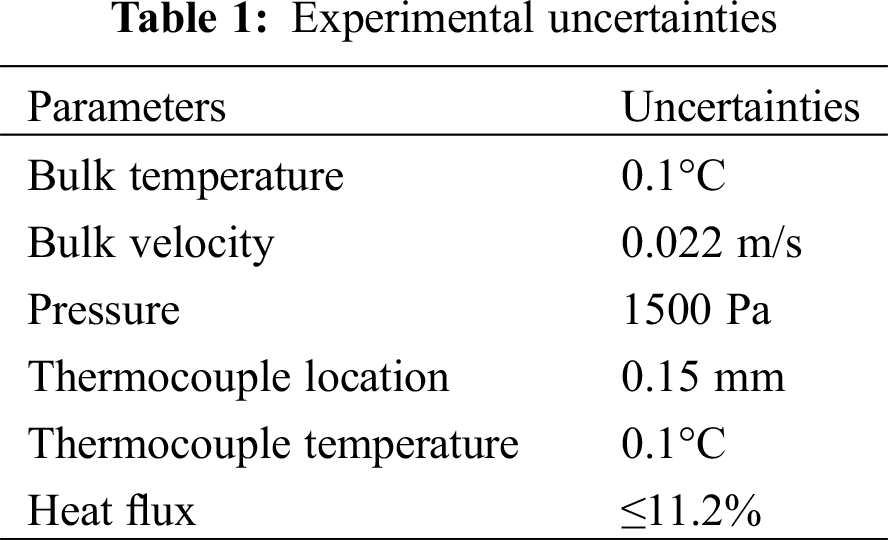
2.3 Experimental Uncertainties
The experimental errors of variables were mainly attributed to the accuracy of sensors, manufacturing tolerances, the layout of thermocouples, undesired heat losses and functions to calculate the indirect variables. Prior to the experiment, all the thermocouples and correspondent data acquisition system were calibrated according to thermal conditions between ice and saturation temperature of water. For the uncertainties of indirect measurement such as heat flux, the Eq. (3) was adopted for the calculation. All calculated and measured uncertainties are listed in Tab. 1.
where
2.4 Fluid Thermophysical Properties
The thermal properties of bulk liquid are required in the data reduction and analysis of this study, which are usually a function of temperature. The effective thermophysical properties of EG/W mixtures are calculated based on the values of pure water and ethylene glycol, and also the concentration of ethylene glycol in the mixtures. The density, specific heat capacity, thermal conductivity and dynamic viscosity of pure liquids and mixtures were evaluated by using semi-empirical equations as suggested in Yu et al. [13].
3 Experimental Result and Discussion
3.1 Single-Phase Heat Transfer
Before the subcooled flow boiling heat transfer experiment, a series of single-phase heat transfer experiments were carried out to study the heat transfer characteristics of one-side heated rectangular channels. The prediction of convective heat flux qsp was calculated as follows:
where the hsp is the single-phase heat transfer coefficient calculated from Dittus-Boelter equation [20]. Tw and Tb are wall temperature and bulk temperature, respectively.
where Rel and Prl are the liquid Reynolds number and Prandtl number, respectively, as can be seen in Eqs. (6) and (7). kl is the thermal conductivity of the bulk liquid. All these values are evaluated at bulk temperature expect μw. Dh is the hydraulic diameter of the test channel.
where ρl, ub, μl and cp,l are bulk density, velocity, dynamic viscosity and specific thermal capacity, respectively. Dh is the hydraulic diameter of the channel, which can be calculated as follows:
where A is the cross-sectional area of the channel, and Pe is the wetted perimeter of the channel. And in this paper, the Dh equals to 42.4 mm.
The comparative results between experimental data and the predicted values can be seen in Fig. 5a. It can be seen that the Dittus-Boelter equation under-predicted the heat flux value, and this trend is in consistence with the results of the previous literatures [4]. Hence, a modified equation was correlated based on the experimental data:
The comparison between experimental heat flux and predictions by modified equation was shown in Fig. 5b. The maximum deviation is within ±10%, which means the modified equation could well predict the convective heat transfer coefficient of this apparatus.
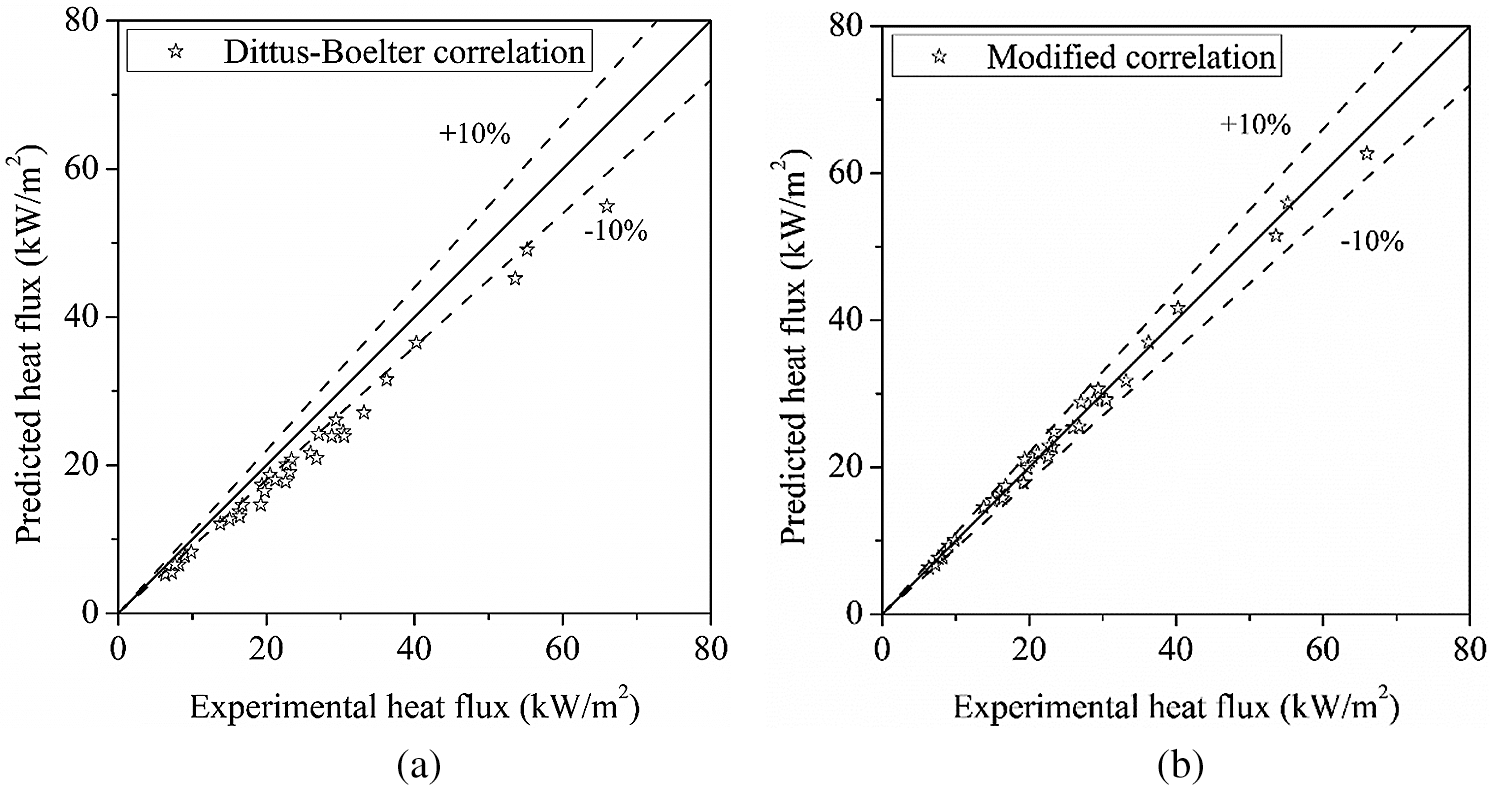
Figure 5: Comparison of experimental convective heat flux with predictions (a) Dittus-Boelter correlation (b) Modified Dittus-Boelter correlation
3.2 Subcooled Flow Boiling Heat Transfer
The coolant temperature, velocity and operation pressure are important control variables of the cooling system of ICEs. Consequently, the effect of these parameters on subcooled flow boiling heat transfer was discussed in more details.
To investigate the effect of subcooling on subcooled flow boiling heat transfer, the boiling curves at constant velocity and system pressure (ub = 1.0 m/s, P = 1.0 bar) are plotted with various inlet temperatures ranging from 70°C to 90°C, as shown in Fig. 6. It can be seen that, in the partially developed boiling region (PDB), the boiling curves at lower inlet temperature would be shifted to the left, whereas in the fully developed boiling region (FDB), the boiling curves merge into an asymptote. This convergence implies that the effect of subcooling on flow boiling vanishes in the FDB region. As shown in Fig. 6, the heat transfer coefficient increases with the decrease of subcooling, which is mainly due to the decreased temperature difference between bulk fluid and wall temperature. As in the boiling region, the heat transfer coefficient curves grow steeper, indicating that the boiling process enhances the heat transfer performance. Moreover, with the decrease of subcooling, the onset of boiling (ONB) initiates earlier.
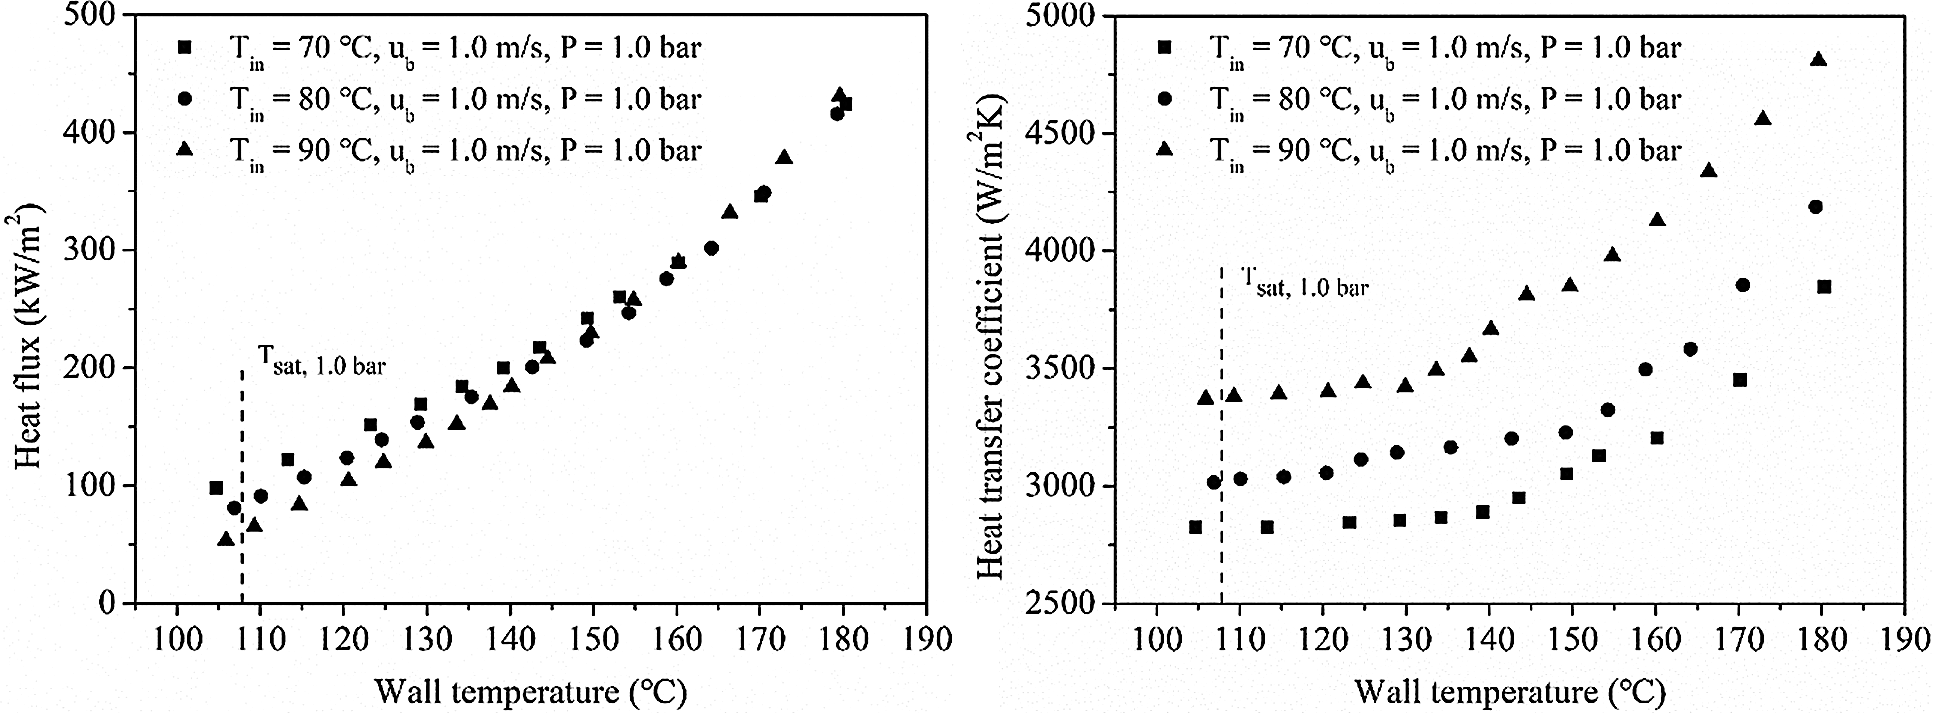
Figure 6: Effect of bulk subcooling on subcooled flow boiling heat transfer (ub = 1.0 m/s, P = 1.0 bar)
Fig. 7 presents the effect of velocity on subcooled flow boiling at constant inlet temperature and system pressure with the velocities (Tin = 80°C, P = 1.0 bar) ranging from 0.25 m/s to 1.0 m/s. With the increase of bulk velocity, the convective heat transfer coefficient increases, leading to higher boiling curve in PDB region due to the fact that in this region the overall heat flux is largely dependent on forced convection. However, this dependence disappears when the boiling falls into the FDB region where the boiling curves converge into the nucleation boiling curve. During the boiling process, the bubble behavior, such as nucleation, growth and departure, is strongly governed by the thermal boundary layer of which the thickness decreases with the increase of bulk velocity [21]. Therefore, the increased bulk velocity would suppress the boiling process, and finally lead to a delay on ONB and convergence to FDB for high bulk velocity cases. This trend is clearly reflected in Fig. 7, that is, as the inlet velocity increases, the heat transfer coefficient curves tend to grow slower initially, and finally merge into an asymptote.
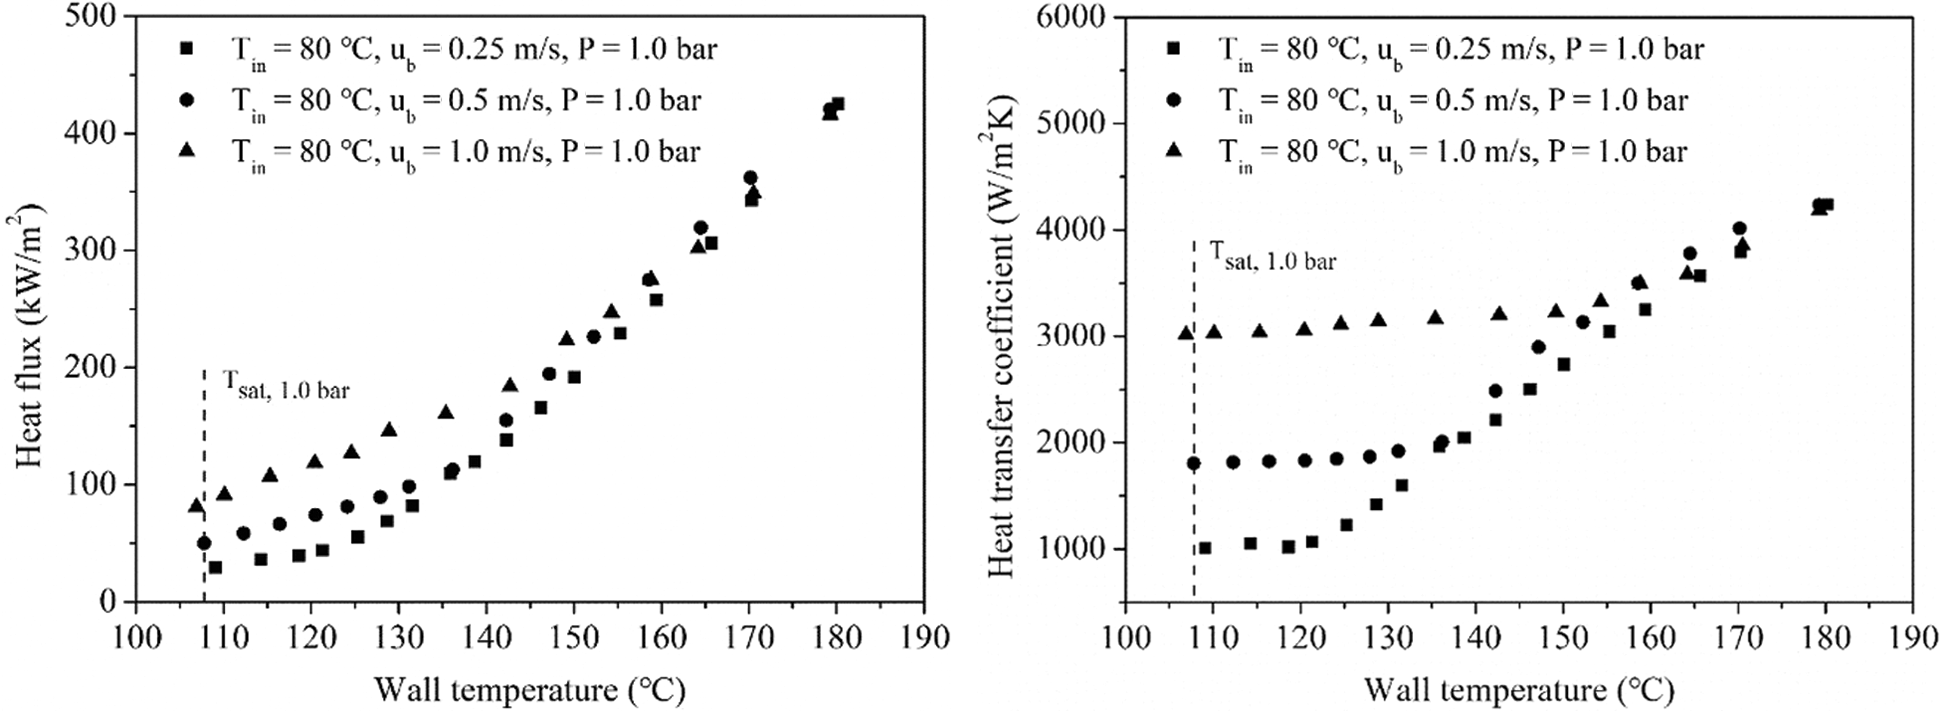
Figure 7: Effect of bulk velocity on subcooled flow boiling heat transfer (Tin = 80°C, P = 1.0 bar)
The boiling curves at different system pressure are plotted in Fig. 8. These data were obtained at the constant inlet temperature of 90°C, bulk velocity of 0.25 m/s and various system pressure of 1.0 bar, 1.5 bar and 2.0 bar, respectively, for which the saturation temperature is 107.8°C, 119.9°C and 129.3°C. It can be seen that, the effect of system pressure on single-phase heat transfer is considerably small, and the boiling curves and heat transfer coefficient curves at different pressures seem to follow a similar development pattern. However, the ONB is delayed with the increase of system pressure, which is mainly due to the enhanced saturation temperature of the 50/50 EG/W mixture.
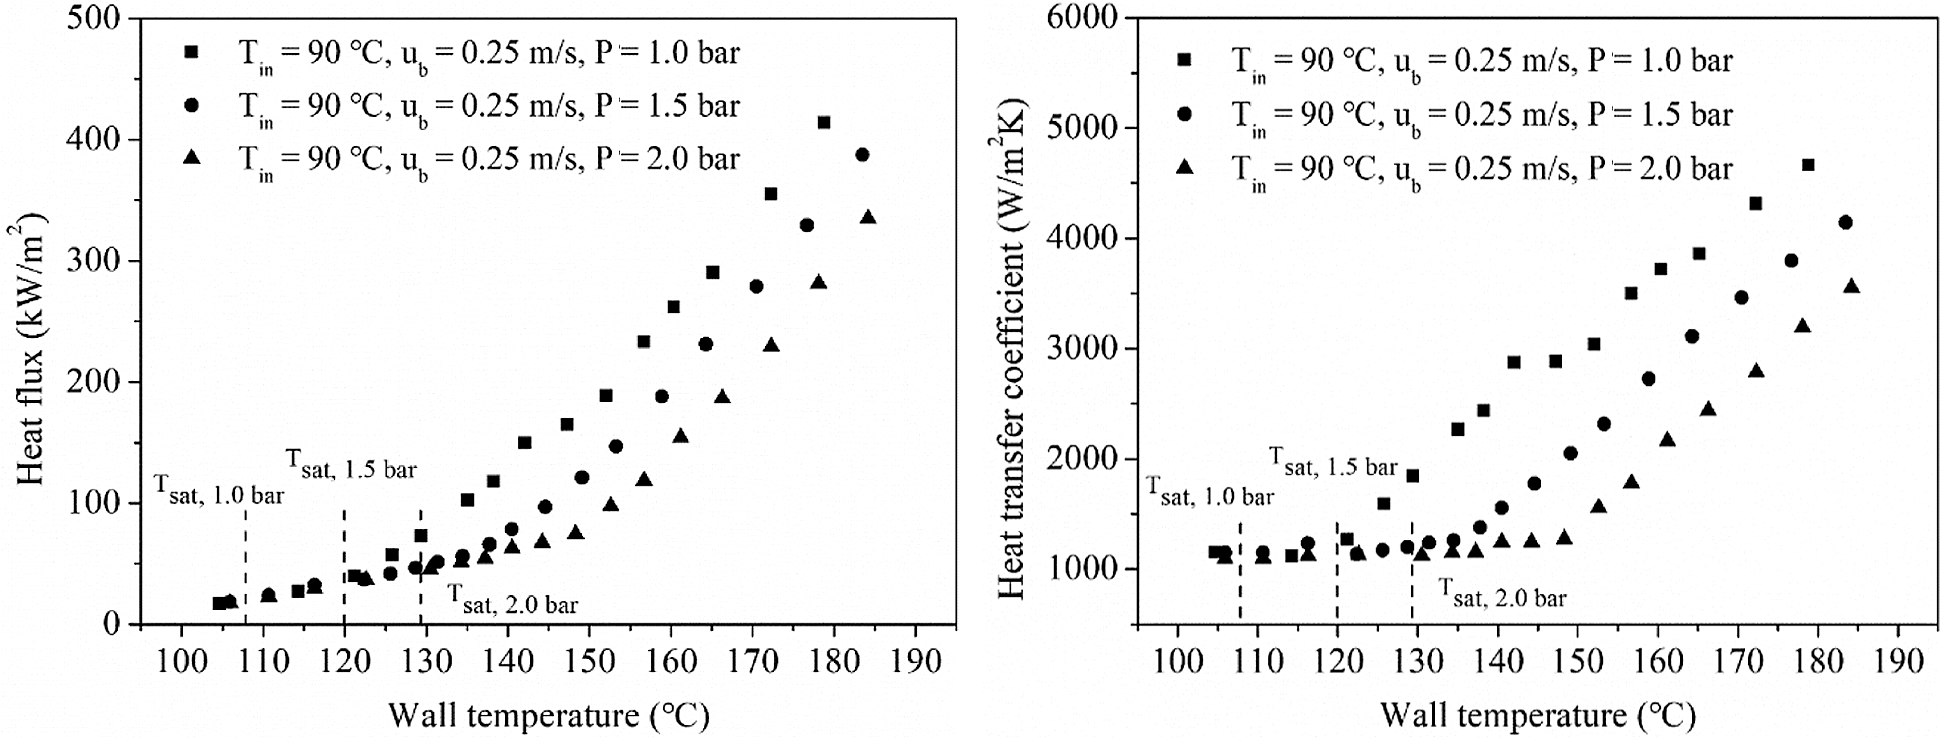
Figure 8: Effect of system pressure on subcooled flow boiling heat transfer (Tin = 90°C, ub = 0.25 m/s)
4 Subcooled Flow Boiling Correlation
4.1 Comparison between Experimental Data and Predictions
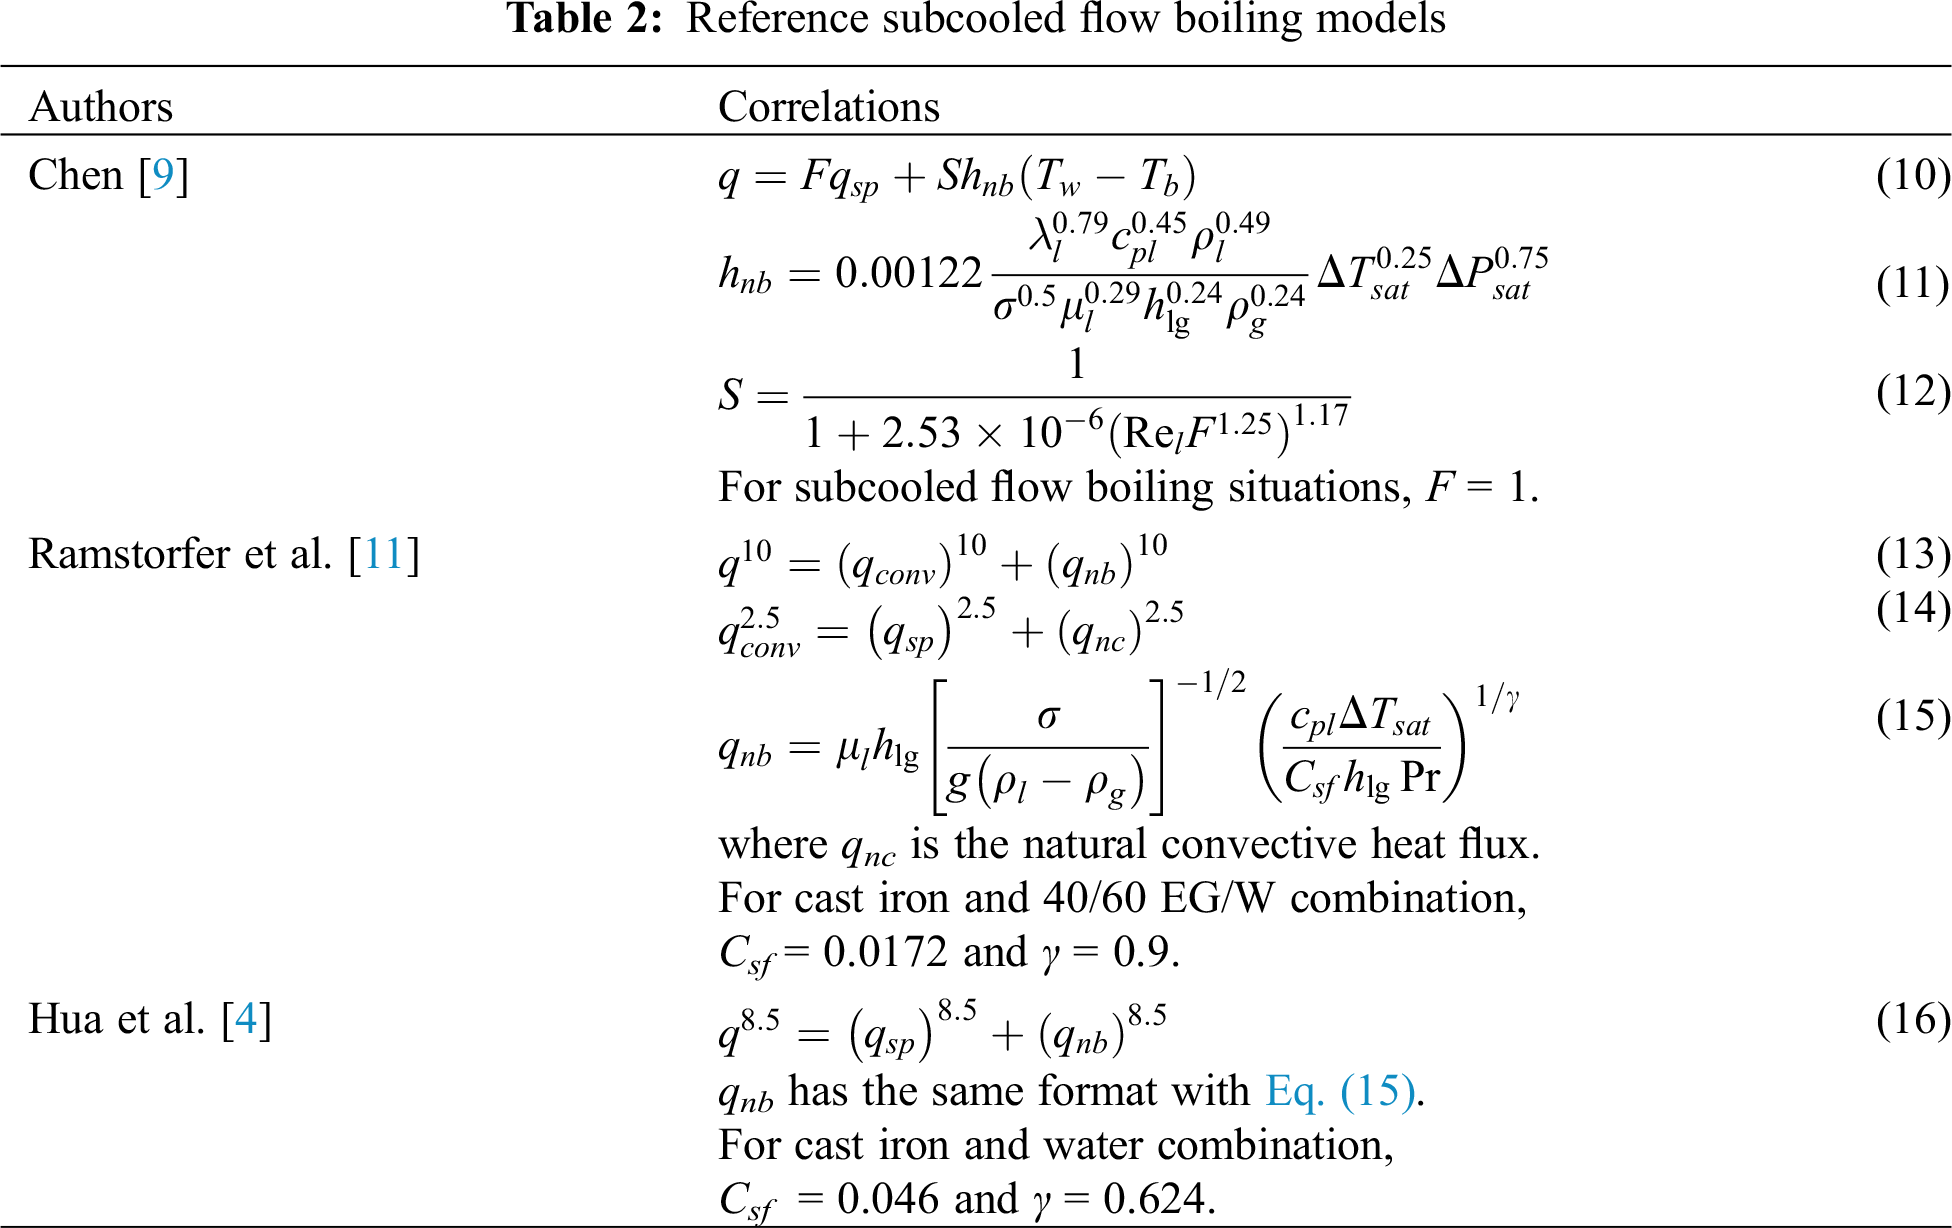
A number of subcooled flow boiling heat transfer models have been proposed in the past decades. However, for the application in engine cylinder head design, the additive or superposition model was exclusively adopted, such as Chen model [9]. The overall heat transfer of this model relies on a combined effect of both single-phase forced convection and nucleate boiling. The successful application of these models to engine cooling passages was presented in [20]. However, the application of Chen model to CFD design is not clear because the definition of an effective hydraulic diameter and velocity scale for the cooling passage is difficult due to its complex and irregular architecture. In view of this issue, one power-type addition type model was proposed by Ramstorfer [11], which mainly focuses on the component with greater influence on the convective and nucleate boiling components. The model could associate the overall flow boiling phenomena with the more dominant mechanism in these two regions, and ensure a smooth transition in between. Moreover, it eliminates the dependence of structure parameters on the calculation of the nucleation boiling term. Consequently, two power-type addition type models proposed for cast iron heated surfaces were chosen as the reference models to make a comparison between prediction and experimental data of this paper. All the reference models are listed in Tab. 2. And all the single-phase forced convective heat flux in these equations was calculated by using Eqs. (4) and (9).
Some representative comparison results between predictions and experimental data are illustrated in Fig. 9. It can be seen that, Chen model [9] over-predicts the wall heat flux of cast iron heated surface, which is in agreement with the results reported in the literature [4]. The large deviation is because that no related parameters accounting for fluid-solid interaction are included in this model, indicating that the Chen model [9] is inappropriate for predicting wall heat flux of diesel engine cylinder heads made of cast iron. Therefore, further improvement of this model was not considered in this paper.
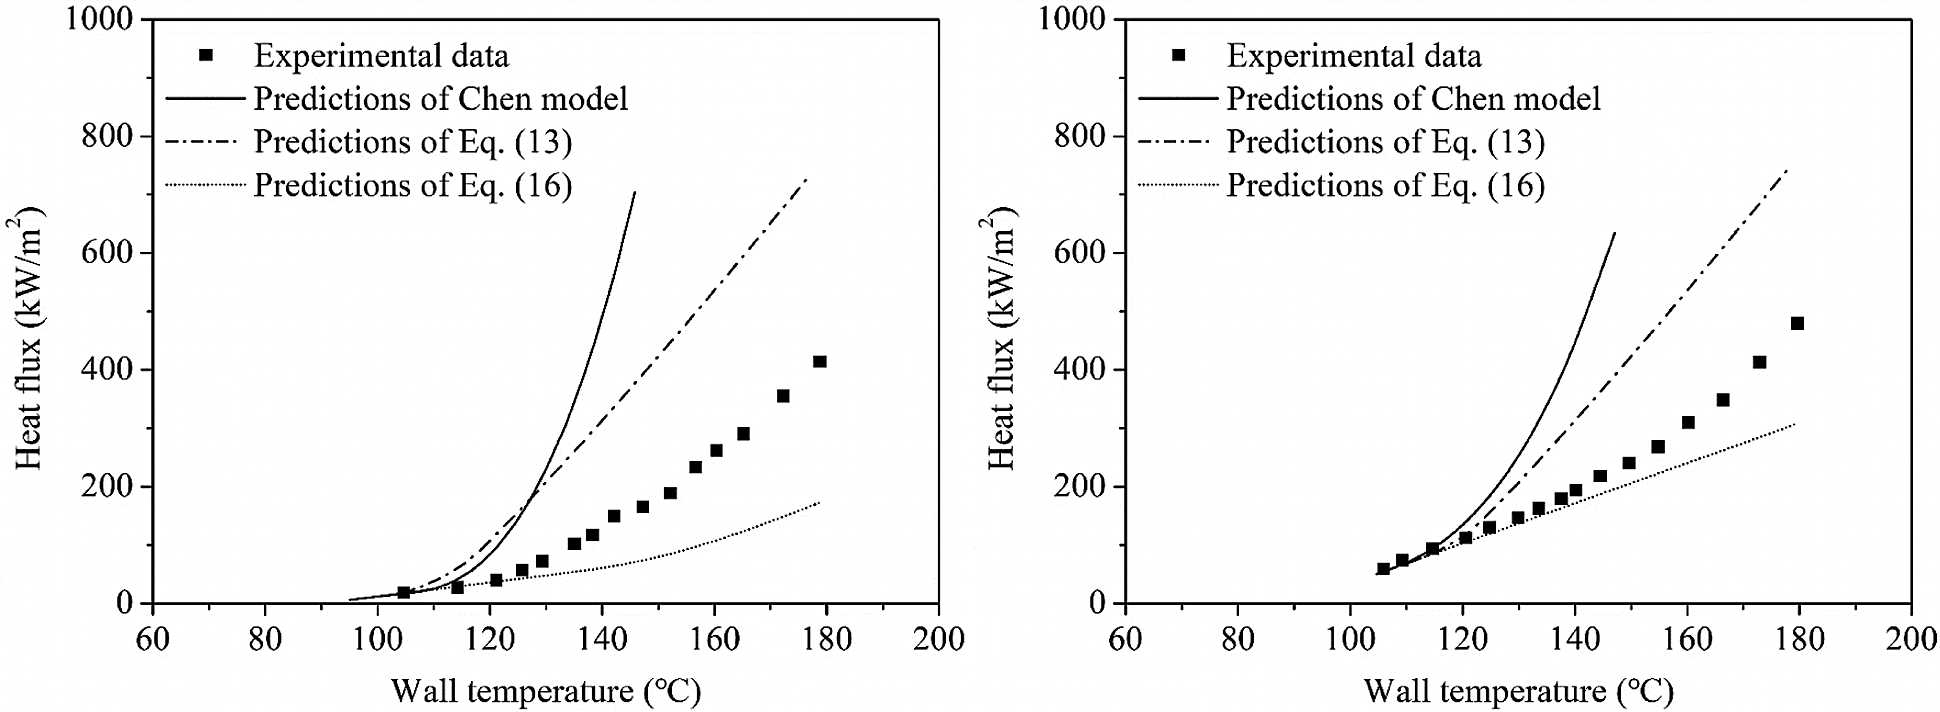
Figure 9: Comparison of heat flux between predicted and experimental data at Tin = 90°C, P = 1 bar (a) ub = 0.25 m/s (b) ub = 1.0 m/s
In the power-type addition models, for the particular measurement conditions considered in this paper, the performance of the reference models is unreasonable with a deviation larger than ±30% in high wall superheat region or fully developed subcooled flow boiling region, especially for low bulk subcooling and velocity conditions. An extensive analysis was made on this noticeable discrepancy. As in this power-type addition model, with the increase of wall superheat, the contribution of nucleation boiling component becomes larger, then the boiling curve will finally merge into the fully developed sub-cooled flow boiling curve. Thus, the deviation in this region is largely due to the poor prediction of nucleation boiling contribution in these models. Rohsenow’s saturated pool boiling equation [22] is utilized for the calculation of this term in reference models, therefore the primitive empirical constants Csf and γ should be derived from experimental data of same fluid-solid combinations, which are important to define the interaction between the working fluid and the heated surface in the boiling process. Although both reference models were proposed for cast iron heated surfaces, the application scope of fluid is different from that of the working fluid in this paper. Consequently, these unmatched empirical constants lead to large deviations in these reference models.
Based on Ramstorfer’s power-type addition method [11], a modified model is developed here to include the experimental data in this paper. Several modifications have been made, for example, new empirical constants Csf and γ take into account the fluid-solid combinations involved in this paper, and exponent n reflects the contribution of forced convection and nucleation boiling components. Moreover, natural convection was excluded, whose contribution to overall heat flux is negligible within the experimental range of this paper:
where qsp term is calculated based on Eq. (4) and Eq. (9). n, Csf and γ are the parameters to be determined.
Eq. (17) was correlated with the experimental data of this paper, and n = 6.5, Csf = 0.027 and γ = 0.7 optimally fit all the data. Fig. 10 presents the results of the comparison between the experimental data and the predictions. It can be seen that most of the deviations are within ±20% and the mean deviations are all less than 10%, indicating that the modified correlation is available for the accurate prediction of the subcooled flow boiling heat flux.
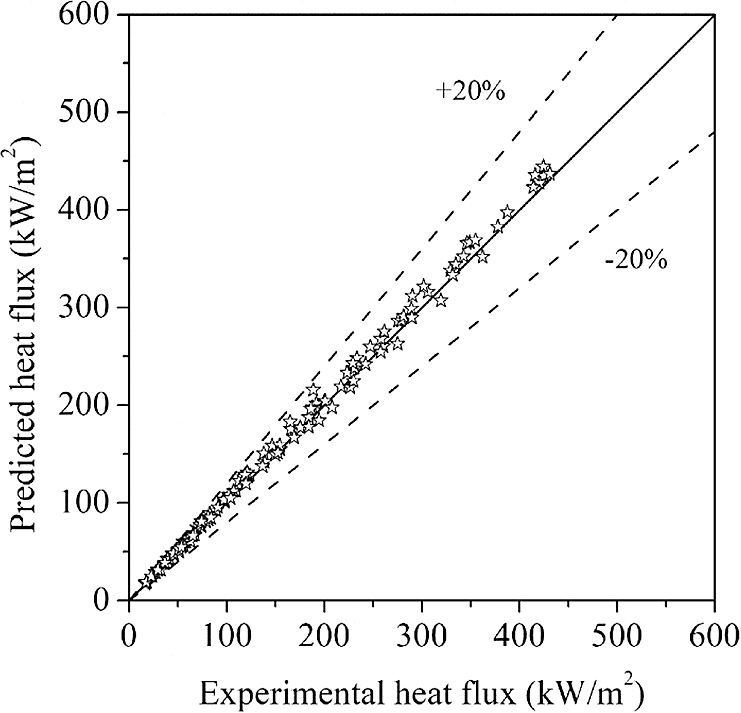
Figure 10: Comparison between experimental data and predictions of proposed correlation
5 Validation of Proposed Correlation in CFD
To validate and access the modified wall heat flux model in CFD application, its ability to represent adequately reality was tested through numerical simulations of a reference rig case and a practical diesel engine. The modified wall heat flux correlation was incorporated into ANSYS Fluent by User Defined Functions (UDF), thereby calculating the heat flux through the heated wall to fluid domain. The single-phase steady state simulation was considered for all cases, and the fluid was regarded as an incompressible flow. The pressure terms were addressed with the second-order discretization, and the momentum equation, turbulent kinetic energy, and turbulent dissipation rate equation were discretized with the second-order upwind scheme. In addition, the SIMPLEC algorithm was used to address the pressure-velocity coupling [23].
Continuity equation:
where ρ is the fluid density, u is the fluid velocity.
Monument equation:
where g is acceleration of gravity, p is the pressure, μ is the dynamic viscosity.
Energy equation:
where H is the enthalpy of the fluid, qw is the wall heat flux, Pr is the Prandtl number, μt is the turbulent viscosity coefficient, σH is a constant.
A standard wall function was adopted in the near-wall region, and the corresponding y+ was controlled within the range from 30 to 90. The fluid flow was considered to be fully turbulent under all the experimental conditions mentioned in this paper, and the k–ε turbulence model was adopted accordingly.
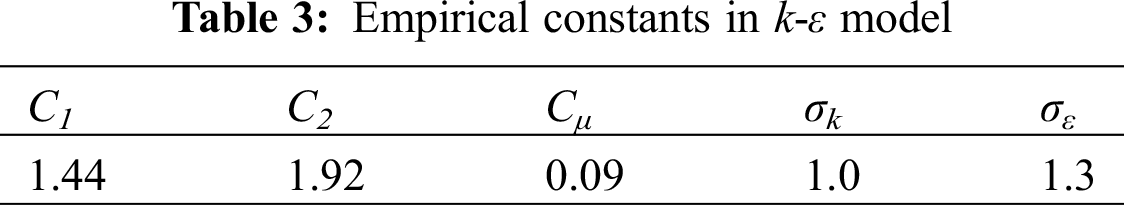
where k and ε are the turbulent kinetic energy and the specific dissipation rate of turbulence, respectively. The empirical constants in k-ε model is given in Tab. 3.
5.1 CFD Validation in Reference Rig Case
In each case, a three-dimensional mesh containing hexagonal elements was generated to cover the entire flow domain. The boundary conditions, such as inlet temperature, outlet pressure and wall temperature, were defined according to experimental conditions in this paper. To ensure grid independence, three meshes with hexahedral cells of number 164262, 263254 and 390126 were used, which are referred to as coarse grid, medium grid and fine grid, respectively. As shown in Fig. 11, the wall heat flux curve of the medium gird is very close to that of the fine grid. Consequently, the model of the medium mesh was selected for simulation, as presented in Fig. 12.
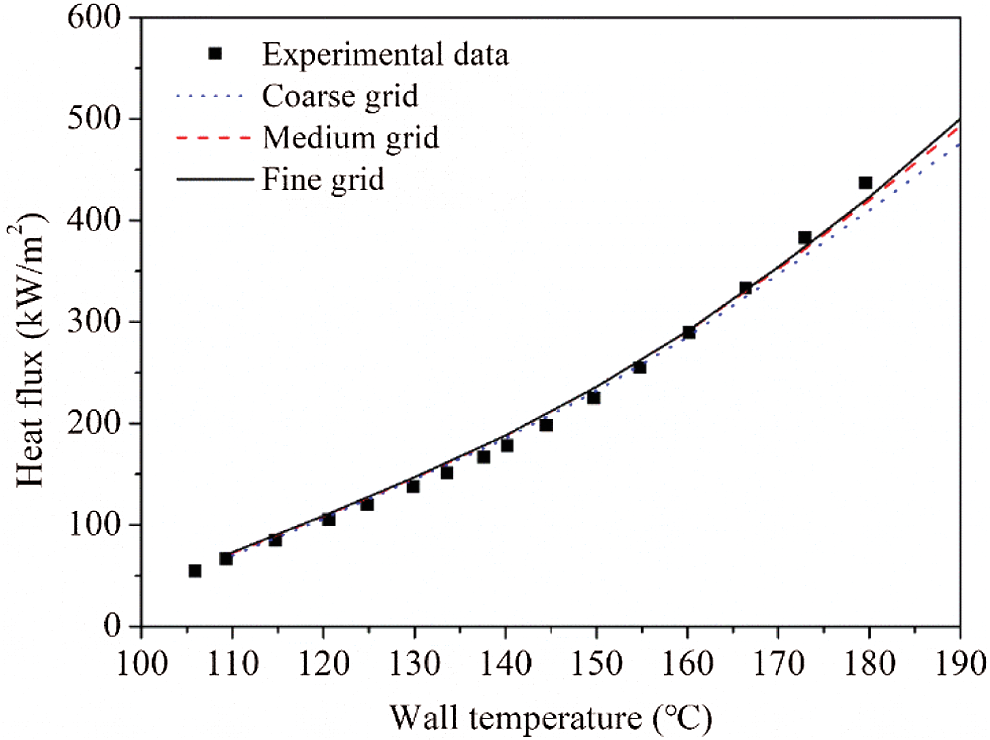
Figure 11: Results of grid sensitivity test (Tin = 90°C, ub = 1.0 m/s, P = 1.0 bar)
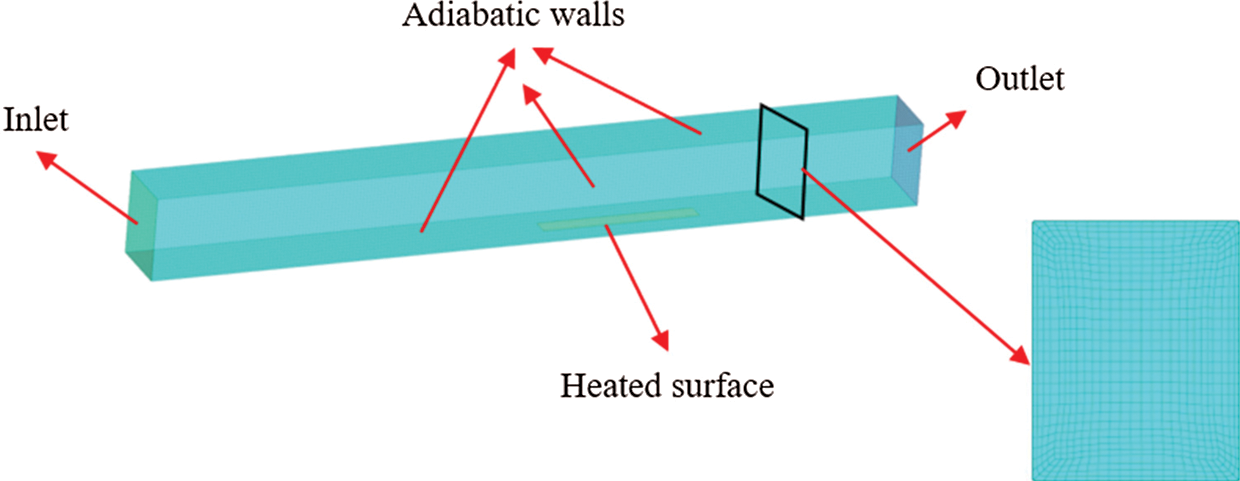
Figure 12: Computational domain of the test channel
The comparison results between CFD predictions and experimental data are shown from Figs. 13–15. It can be seen from the figure that the simulation results are in good agreement with the experimental value, which is because that the effects of subcooling, velocity and pressure on subcooled flow boiling heat transfer are reasonably and accurately predicted by using the modified model.
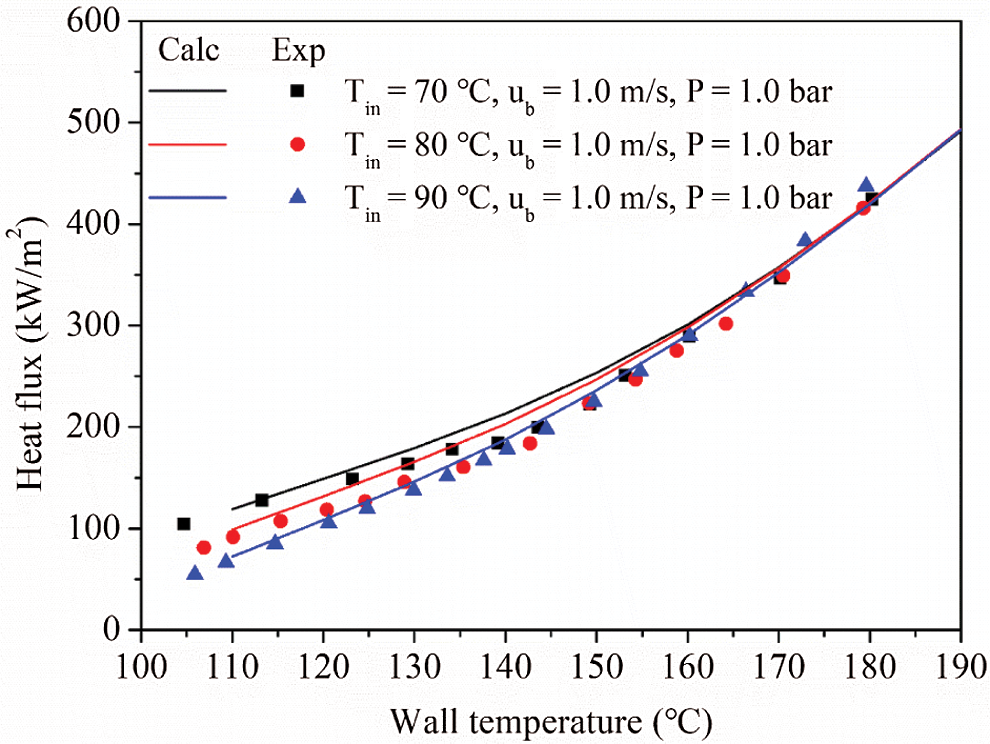
Figure 13: Comparison between simulation results and experimental data under various subcooling conditions
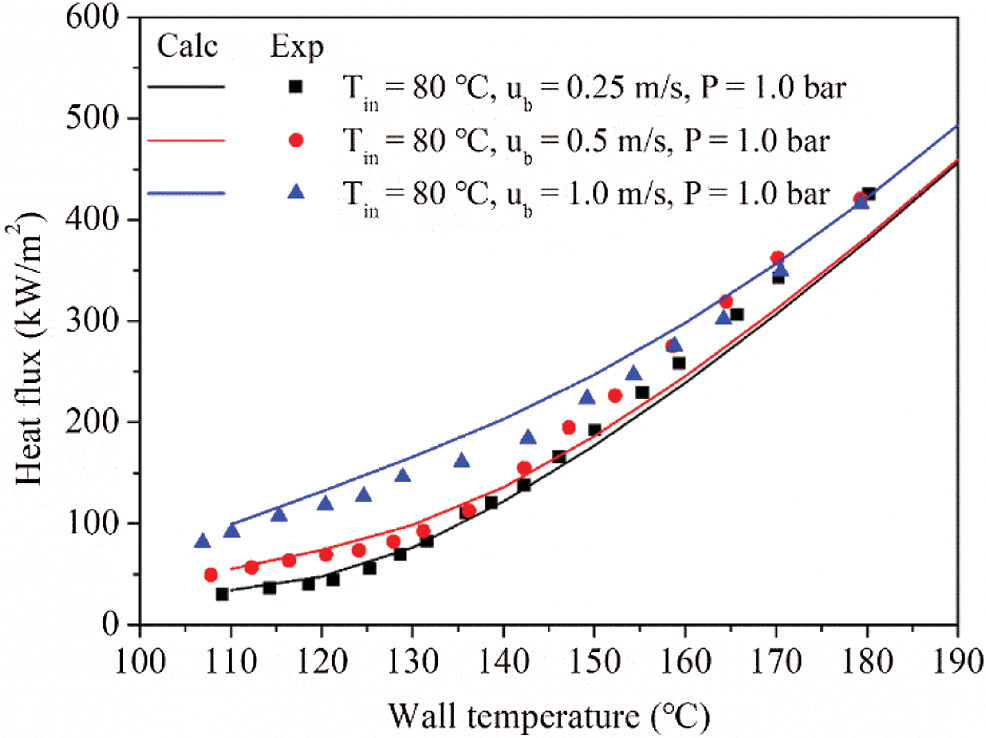
Figure 14: Comparison between simulation results and experimental data under various velocity conditions
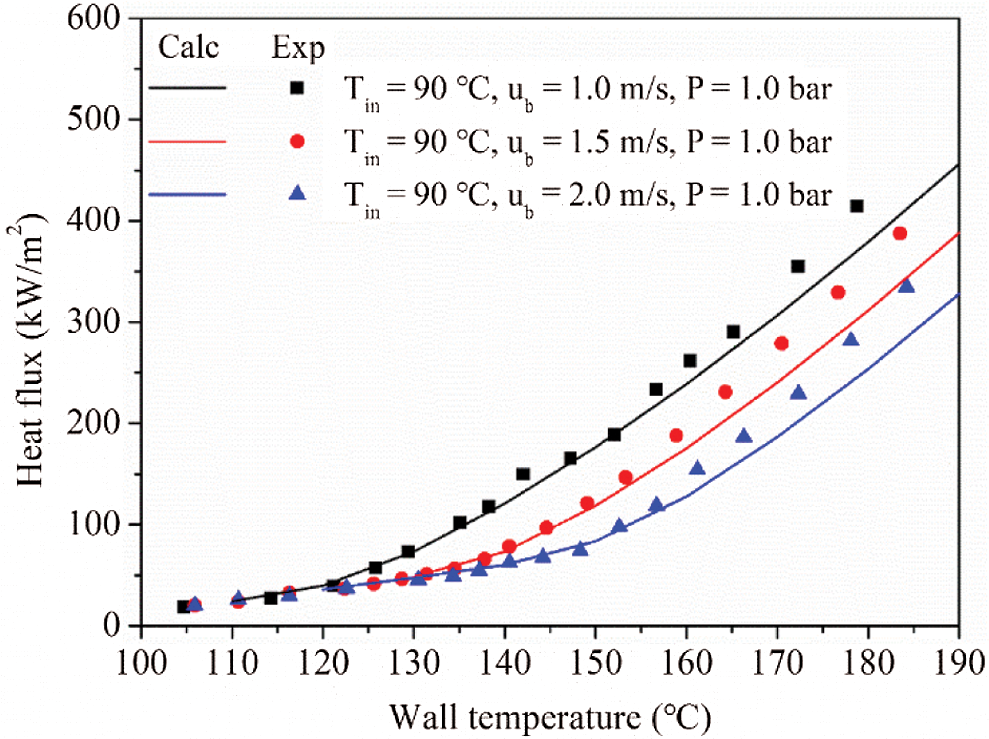
Figure 15: Comparison between simulation results and experimental data under various system pressure conditions
5.2 CFD Validation in Practical Diesel Engine
To further access the performance of the modified model for actual engine applications, the numerical simulation of a four-stroke diesel engine was made. The engine consists of six cylinders with the same structure, and the geometry of calculation domain is illustrated in Figs. 16a and 16b. Both experimental measure and numerical simulation were performed in Cylinder 2 only, and the influence of other cylinders on cylinder was neglected due to the same cylinder structure and the independent cooling condition. The drillings of temperature measuring points are shown in Figs. 16c and 16d.
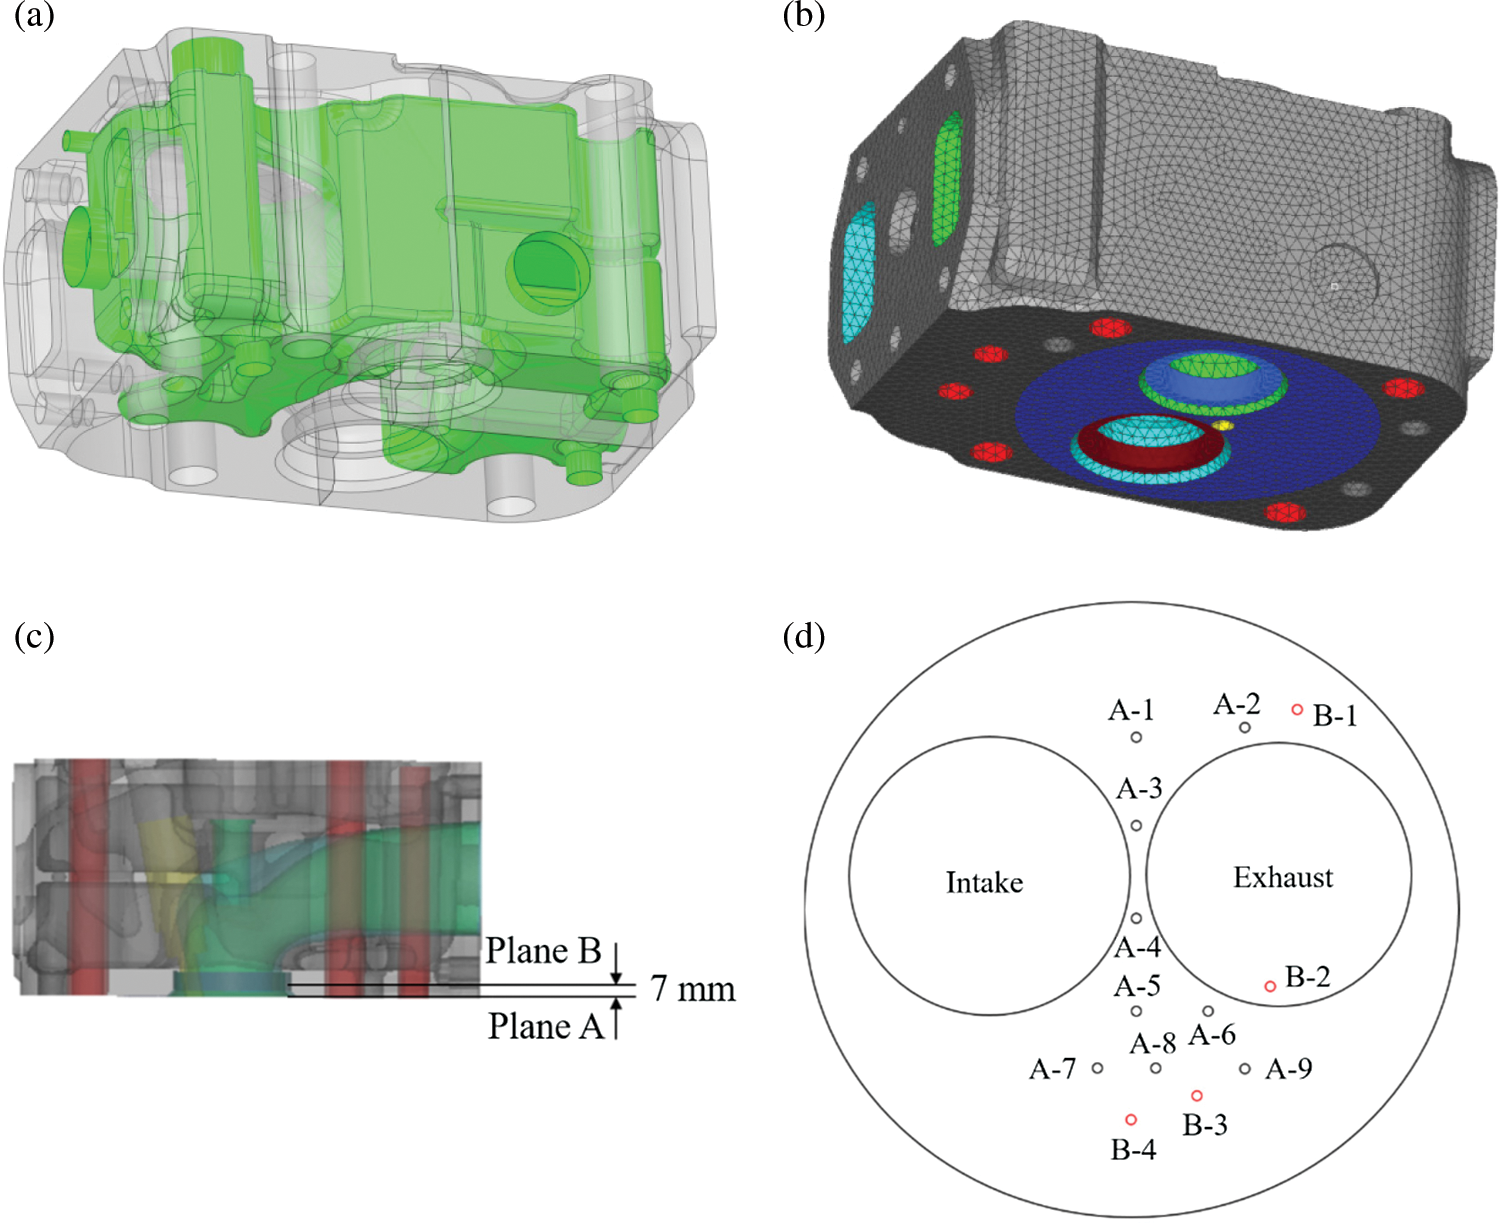
Figure 16: The geometry of cylinder head and temperature measuring points
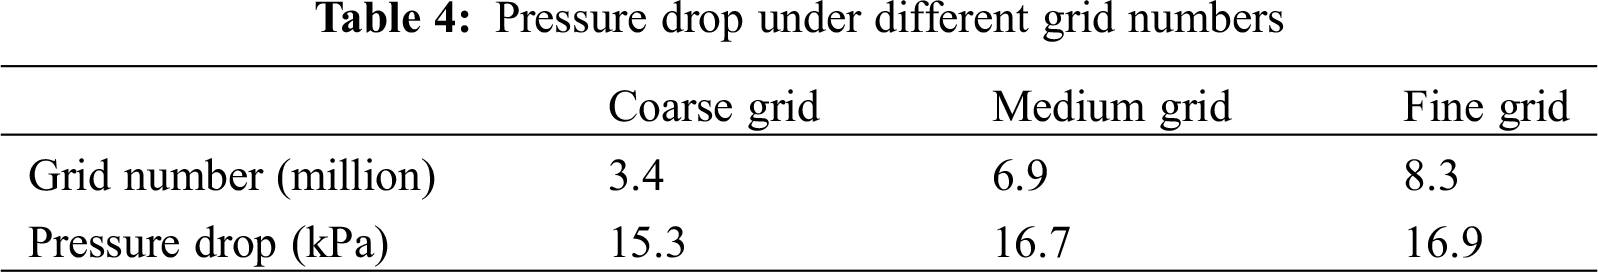
A conjugate heat transfer simulation was made to solve this fluid and solid heat transfer process. The material of the cylinder head is cast iron with the density of 7350 kg/m3, thermal conductivity of 44.8 W/m∙k and the specific heat of 480 J/kg∙K. The pressure drop between the inlet and outlet of coolant passage was chosen as the quantity for the grid refinement study, which has been proved to be very sensitive to the computational grid [24]. Tab. 4 shows the effect of the grid refinement on the pressure drop. According to the mesh sensitivity analysis, the medium grids with number of 6.9 million are refined sufficiently to obtain a convergent value of the pressure drop.
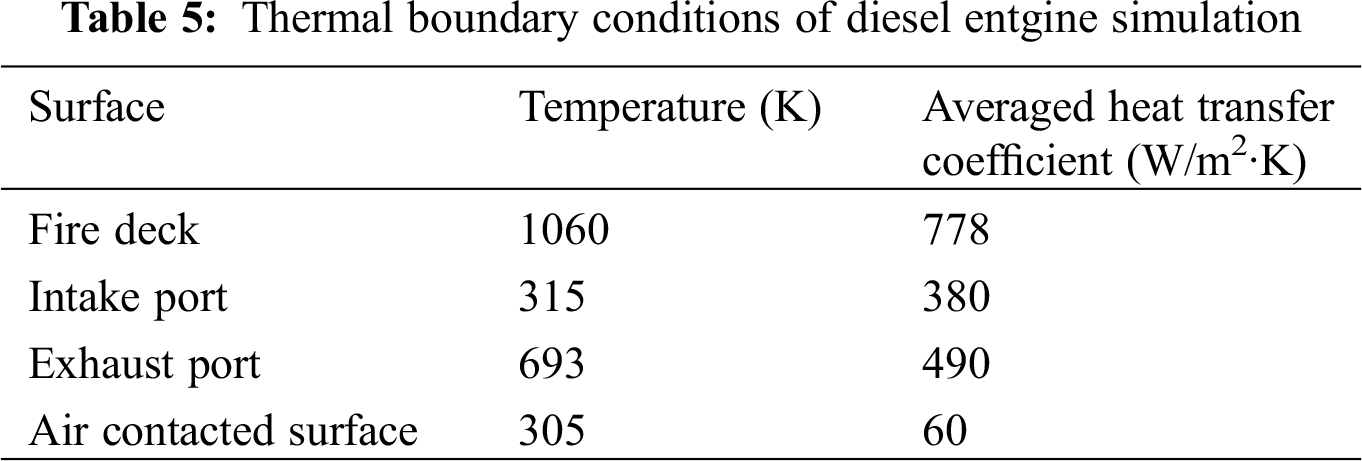
The inlet fluid temperature, velocity and outlet pressure were set as 351 K, 1.5 m/s ad 160 kPa, respectively, according to actual engine working conditions. While the thermal boundary conditions of fire deck, intake/exhaust port were derived from one-dimensional thermodynamic simulations of this engine [24]. All the information of thermal boundary conditions is listed in Tab. 5.
The comparisons of measuring points between experimental data and simulation results with and without boiling wall heat flux model were illustrated in Fig. 17. It can be see that the simulation results of temperature considering boiling are lower than that without considering boiling, also implying that subcooled flow boiling heat transfer exists in engine cylinder coolant passages. The mean deviation of measuring points at Plane A drops from 4.25% without considering the boiling to 1.43% when the boiling is considered; as for the measurement point at Plane B, the mean deviation decreased from 9.33% to 5.63%. Fig. 18 shows the comparisons of temperature distribution on fire deck with and without boiling consideration. When considering the boiling, the maximum temperature drops from 579.2 K to 571.2 K, indicating that the heat transfer is considerably enhanced as the result of subcooled flow boiling regime. Thus, the appearance of boiling heat transfer in engine coolant passages is able to increase the heat transfer performance, which is well captured by the optimized wall heat flux model used in this paper.
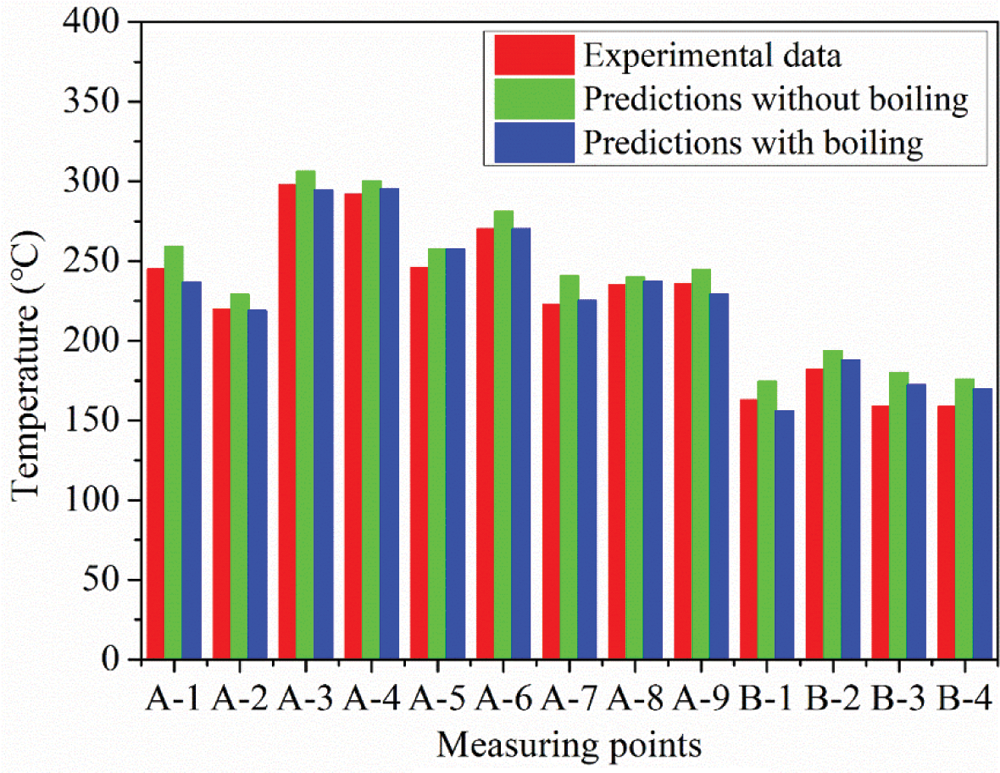
Figure 17: Comparisons between experimental data and predictions at each measuring points
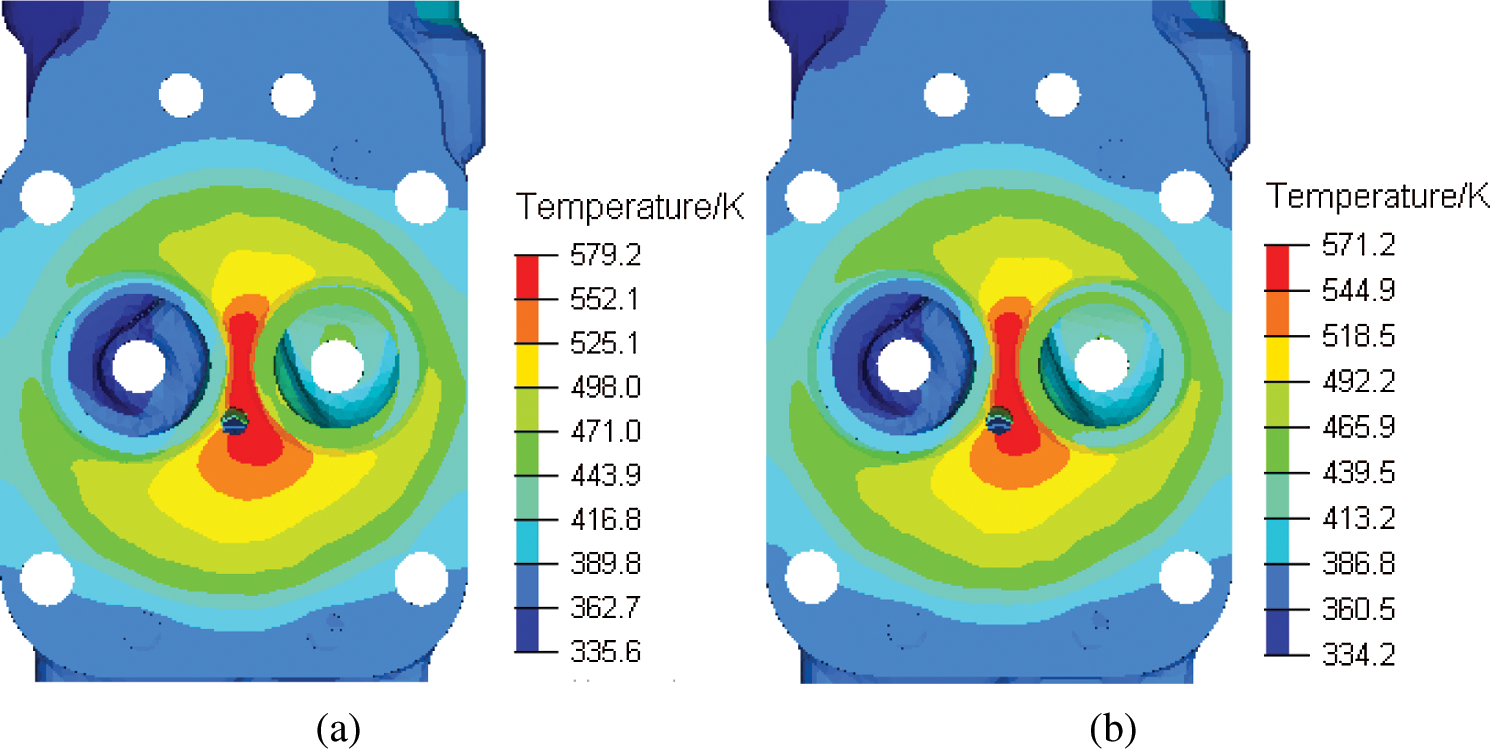
Figure 18: Comparison of wall temperature distribution on cylinder fire deck with and without boiling wall heat flux model (a) Without boiling (b) With boiling
The subcooled flow boiling wall heat flux model is important for ICE cylinder head design. This study reports the subcooled flow boiling experiment of 50/50 EG/W in a horizontal rectangular channel with a flat plane heated surface made of cast iron. The experiment was made under various experimental conditions, aiming to simulate the flow boiling characteristics in the actual cooling passages of diesel engines. A power-type addition model was modified and incorporated into CFD software, of which the performance for the actual diesel engine applications was further accessed. The main conclusions are as follows:
1. With the increase of system pressure, the boiling heat flux tends to decrease, which is due to the enhanced fluid saturation temperature. With the growth of the wall superheat, the effects of subcooling and velocity on boiling heat transfer gradually vanish, and finally the boiling curves merge into the nucleation boiling curves at the system pressure.
2. The comparison of heat flux between the predictions of reference empirical models and experimental results showed large deviations. A modified wall heat flux correlation was proposed based on the power-type addition method, and the maximum deviation is within ±20% compared with the experimental data of this paper.
3. The proposed wall heat flux model can be easily incorporated into CFD codes because no geometry-dependent parameter is required. The comparison between simulation results and experimental data showed the modified model was available for the precise prediction of the subcooled flow boiling heat transfer both in test rig used in this paper and the actual diesel engine.
Funding of Statement: This work was supported by the National Key Research and Development Project of China (Grant No. 2017YFB0103504), and National Natural Science Foundation of China (Grant No. 51576116).
Conflicts of Interest: The authors declare that they have no conflicts of interest to report regarding the present study.
1. Wu, Z., Dong, F., Song, D., Yuan, T. (2018). Experimental and numerical study of boiling heat transfer in engine water jackets using eulerian multiphase model. SAE International. [Google Scholar]
2. Finlay, I. C., Gallacher, G. R., Biddulph, T. W., Marshall, R. A. (1988). The application of precision cooling to the cylinder-head of a small, automotive, petrol engine. SAE International, 97(6), 399–410. [Google Scholar]
3. Sun, K., Hu, X., Li, D., Zhang, G., Zhao, K. (2021). Analysis of bubble behavior in a horizontal rectangular channel under subcooled flow boiling conditions. Fluid Dynamics & Materials Processing, 17(1), 81–95. [Google Scholar]
4. Hua, S., Huang, R., Li, Z., Zhou, P. (2015). Experimental study on the heat transfer characteristics of subcooled flow boiling with cast iron heating surface. Applied Thermal Engineering, 77, 180–191. [Google Scholar]
5. Chen, L., Zhou, P., Huang, R., Han, X., Hua, S. et al. (2018). Experimental investigation on the suppression factor in subcooled boiling flow. Applied Thermal Engineering, 135, 549–558. [Google Scholar]
6. Paz, M. C., Conde, M., Suárez, E., Concheiro, M. (2015). On the effect of surface roughness and material on the subcooled flow boiling of water: Experimental study and global correlation. Experimental Thermal and Fluid Science, 64, 114–124. [Google Scholar]
7. Finlay, I. C., Boyle, R. J., Pirault, J. P., Biddulph, T. (1987). Nucleate and film boiling of engine coolants flowing in a uniformly heated duct of small cross section. SAE Technical Paper 870032. [Google Scholar]
8. Norris, P. M., Hastings, M. C., Wepfer, W. J. (1989). An experimental investigation of liquid coolant heat transfer in a diesel engine. SAE Transactions, 98, 1855–1861. [Google Scholar]
9. Chen, J. C. (1966). Correlation for boiling heat transfer to saturated fluids in convective flow. Industrial & Engineering Chemistry Process Design & Development, 5(3), 322–329. [Google Scholar]
10. Abou-Ziyan, H. Z. (2004). Forced convection and subcooled flow boiling heat transfer in asymmetrically heated ducts of T-section. Energy Conversion and Management, 45(7), 1043–1065. [Google Scholar]
11. Ramstorfer, F., Steiner, H., Brenn, G., Kormann, C., Rammer, F. et al. (2008). Subcooled boiling flow heat transfer from plain and enhanced surfaces in automotive applications. Journal of Heat Transfer, 130(1), 81–99. [Google Scholar]
12. Yu, W., France, D. M., Singh, D., Smith, R. K., Ritter, J. (2014). Subcooled flow boiling of ethylene glycol/water mixtures in a bottom-heated tube. International Journal of Heat and Mass Transfer, 72, 637–645. [Google Scholar]
13. Yu, W., France, D. M., Zhao, W., Singh, D., Smith, R. K. (2016). Subcooled flow boiling heat transfer to water and ethylene glycol/water mixtures in a bottom-heated tube. Experimental Heat Transfer, 29(5), 593–614. [Google Scholar]
14. Mcadams, W. H., Kennel, W. E., Minden, C. S., Carl, R., Picornell, P. M. et al. (1949). Heat transfer at high rates to water with surface boiling. Industrial & Engineering Chemistry, 41(9), 1945–1953. [Google Scholar]
15. Jens, W. H., Lottes, P. A. (1951). Analysis of heat transfer, burnout, pressure drop and density data for high-pressure water. Naval Reactor Division, Argonne National Laboratory. [Google Scholar]
16. Shah, M. M. (1977). A general correlation for heat transfer during subcooled boiling in pipes and annuli. Ashrae Transactions, 83, 202–217. [Google Scholar]
17. Kandlikar, S. G. (1998). Heat transfer characteristics in partial boiling, fully developed boiling, and significant void flow regions of subcooled flow boiling. Journal of Heat Transfer, 120(2), 395. [Google Scholar]
18. Zou, L., Jones, B. G. (2013). Heating surface material’s effect on subcooled flow boiling heat transfer of R134a. International Journal Heat Mass Transfer, 58, 168–174. [Google Scholar]
19. Chen, Z., Wu, F., Utaka, Y. (2018). Numerical simulation of thermal property effect of heat transfer plate on bubble growth with microlayer evaporation during nucleate pool boiling. International Journal of Heat and Mass Transfer, 118, 989–996. [Google Scholar]
20. Robinson, K., Hawley, J. G., Hammond, G. P., Owen, N. J. (2003). Convective coolant heat transfer in internal combustion engines. Proceedings of the Institution of Mechanical Engineers, Part D: Journal of Automobile Engineering, 217(2), 133–146. [Google Scholar]
21. Lucic, A., Emans, M., Mayinger, F., Zenger, C. (2004). Interferometric and numerical study of the temperature field in the boundary layer and heat transfer in subcooled flow boiling. International Journal of Heat & Fluid Flow, 25(2), 180–195. [Google Scholar]
22. Rohsenow, W. M. (1952). A method of correlating heat transfer data for surface boiling of liquids. Transactions of the ASME, 74, 969–976. [Google Scholar]
23. Yan, Q., Li, Y., Zhu, Y., Cheng, K., Huang, X. (2020). CFD-based optimization of hot primary-air pipe networks in power plant milling systems. Fluid Dynamics & Materials Processing, 16(3), 623–636. [Google Scholar]
24. Hu, X., Sun, Q., Li, G., Bai, S. (2019). Numerical investigation of thermo-hydraulic performance of an opposed piston opposed cylinder engine water jacket with helical fins. Applied Thermal Engineering, 159, 113824. [Google Scholar]
 | This work is licensed under a Creative Commons Attribution 4.0 International License, which permits unrestricted use, distribution, and reproduction in any medium, provided the original work is properly cited. |