| Fluid Dynamics & Materials Processing |
DOI: 10.32604/fdmp.2021.016725
ARTICLE
On the Development of an Effective Pressure Driving System for Ultra-Low Permeability Reservoirs
1Research Institute of Petroleum Exploration & Development, PetroChina, Beijing, 100083, China
2College of Engineering Science, University of Chinese Academy of Sciences, Beijing, 100049, China
3Oil and Gas Technology Research Institute of PetroChina Changqing Oilfield Company, Xi’an, 070000, China
*Corresponding Author: Xinli Zhao. Email: zhaoxinli17@mails.ucas.edu.cn
Received: 20 March 2021; Accepted: 13 May 2021
Abstract: Given its relevance to the exploitation of ultra-low permeability reservoirs, which account for a substantial proportion of the world’s exploited and still unexploited reserves, in the present study the development of an adequate water injection system is considered. Due to the poor properties and weak seepage capacity of these reservoirs, the water injection pressure typically increases continuously during water flooding. In this research, the impact on such a process of factors as permeability, row spacing, and pressure gradient is evaluated experimentally using a high-pressure large-scale outcrop model. On this basis, a comprehensive evaluation coefficient is introduced able to account for the effective driving pressure.
Keywords: Ultra-low permeability reservoir; physical simulation; effective development; water flooding; effective driving coefficient
In the past decade, low permeability reservoirs have accounted for a large proportion of world energy resources, in which most reservoirs have a permeability less than 10 mD. In this regard, the effective development of ultra-low permeability oil reservoirs is paramount for the sustained and stable development of the oil industry [1–3]. Even though most of the ultra-low permeability reservoirs have been developed, limited by their poor physical properties and seepage capacity, water injection can hardly establish an effective driving pressure system, resulting in a rapid decline of single well production rate and low oil field recovery [4,5]. Therefore, building an effective driving pressure system is the key to the effective development of ultra-low permeability reservoirs.
At present, methods to establish an effective driving pressure system for ultra-low/ultra-low permeability reservoirs mainly include numerical simulation and physical simulation methods. The numerical simulation method is to introduce the nonlinear seepage theory into mathematical models [6,7], followed by calculations and analysis of reasonable well spacing to achieve effective reservoir driving, in which the nonlinear parameters come from physical simulation experiments. On the other hand, the physical simulation experiment method is to determine whether the well pattern in the oilfield is effectively driven via the starting pressure gradient measured by the small core seepage experiment [8,9]. However, this method has great limitations. In recent years, the large-scale outcrop physical simulation experimental device has developed [10] and achieved significant research advances in the effect of different injection media [11–13]. The analysis relies on low-pressure physical simulation experimental systems for ultra-low permeability large outcrops and develops a method to perform physical simulations of an effective drive in ultra-low permeability reservoirs, guiding the effective development of ultra-low permeability reservoirs.
2.1 Low-Pressure Physical Simulation Experimental System for Ultra-Low Permeability Large Outcrops
The low-pressure physical simulation experimental system for ultra-low permeability large outcrops can be used to simulate the seepage law in plane and sectional flow of ultra-low permeability reservoir, with a broad range scale (0.5 m × 0.5 m × 0.3 m). Teng et al. [10] and Zhu et al. [11] thoroughly described the experimental technique of a low-pressure physical simulation experimental system for ultra-low permeability large outcrops, the details will not be illustrated in this context. However, it is worth noting that, during low-pressure physical simulation experiment system for ultra-low permeability large outcrops, the selected outcrop rock sample, based on satisfying the similarity theory, must have similar porosity and permeability, microscopic pore structure characteristics, fluid seepage law, and clay mineral contents to the actual formation. Otherwise, the experimental results could fail to reflect the actual reservoir production. In this case, the rock sample selected is an outcrop rock sample similar to the actual simulated formation.
2.2 Physical Simulation Evaluation Methods for the Effective Drive in Ultra-Low Permeability Reservoir
Studies have shown that the pressure gradient field and single-well production capacity are the primary evaluation parameters to implement the research of the effective drive on ultra-low permeability reservoirs [12]. The methods such as critical spacing, effective drive coefficient, and numerical reservoir simulations are all based on the filtration theory of ultra-low permeability reservoir to determine whether an effective drive reservoir pressure system can be established by computing the pressure gradient distribution. Meanwhile, production capacity prediction takes capacity as the coefficient to evaluate the effective drive. Based on a broad range of physical simulation experiments, this paper develops two evaluation parameters, namely, the effective drive coefficient and the effective capacity coefficient.
2.2.1 Effective Drive Coefficient
For an ultra-low permeability reservoir, when the fluid flow reaches a steady state at a particular injection pressure gap, areas are not fully involved in the flow due to the existence of a fluid pressure gradient. The ratio of the flow area and the entire unit area is called the effective drive coefficient, which is represented as follows:
where Ep is the effective drive coefficient, U is the entire unit area, and Uno is the unit area not without flow.
This coefficient reflects well pattern status and pressure system effectiveness. As the effective pressure coefficient continuously approaches 0, the nonlinear seepage and quasi-linear seepage areas approach 0, meaning that the entire model remains in the no-flow region. When the maximum value of the effective pressure coefficient is 1, the model is in the flow region, indicating that all of the areas are involved in the flow.
2.2.2 Effective Capacity Coefficient
The ratio of the outcrop model’s measured production capacity to the quasi-linear production capacity (the capacity at which the flow of the entire model becomes a quasi-linear seepage field) is defined as the effective capacity coefficient, as shown in the following equation:
where Qa is the production capacity of the outcrop model actually measured, and Qq is the production of the quasi-linear capacity.
This coefficient reflects the impact of nonlinear seepage on the production capacity of ultra-low permeability reservoir, demonstrating the relative size of a single well production capacity. An effective capacity coefficient of 0 indicates no capacity, while an effective coefficient of 1 corresponds to the quasi-linear seepage of the entire model, in which the impact of nonlinear seepage is negligible.
The effective drive coefficient and the effective capacity coefficient can reflect not only the effect of nonlinear seepage on the effective development of an ultra-low permeability reservoir, but also the impact caused by the reservoir fracture development, fracturing scale, well pattern, and other elements. Therefore, the effective drive coefficient and the effective capacity coefficient comprehensively illustrate the degree of effective development of ultra-low permeability reservoirs.
The effective drive of ultra-low permeability reservoirs can be affected by various factors, which can be broadly divided into two categories. The first category accounts for the reservoir factors, including reservoir permeability, effective thickness, formation pressure, and crude oil viscosity. These parameters are the basis for the establishment of an effective drive. The second category accounts for development and production factors such as well-pattern type, well row spacing, fracturing size, producing pressure differential. These factors are the technological means to establish an effective drive. To illustrate the influence of different factors on the effective drive of ultra-low permeability reservoirs, the following parameters are taken as examples, which are reservoir permeability, producing pressure differential, and row spacing.
3.1 Effects of Reservoir Permeability and Producing Pressure Differential
The inverted nine-spot square well pattern at a typical oil reservoir of PetroChina is taken as an example to explain the impact of reservoir permeability and producing pressure differential on the effective drive of ultra-low permeability reservoir. Fig. 1(a) illustrates the selected inverted nine-spot square well pattern. The water injection wells remain unfractured while the oil production wells are fractured before production. In this example, first, 1/4 unit of the inverted nine-spot square well patterns (one water-injection well and three oil production wells) are selected as the physical simulation experimental subject. Next, an artificial fracture is created on the outcrop rock sample and filled with sand to simulate a hydraulic fracture. According to the similarity theory, its conductivity is determined by the particle size of quartz sand and the proportion of cross-linking agents. The physical model is shown in Fig. 2(b).
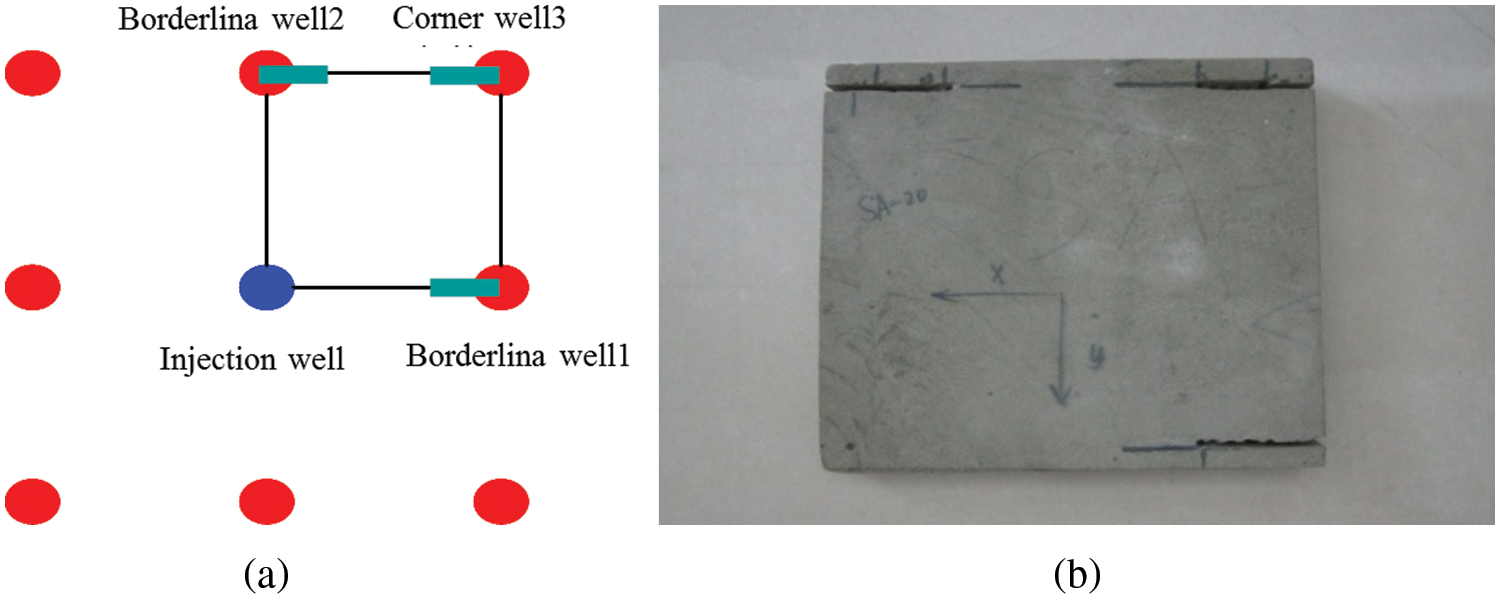
Figure 1: Schematic diagram and physical map of the inverted nine-spot square well pattern (a) Schematic diagram of the inverted nine-spot square well pattern (b) Physical map of the outcrop model
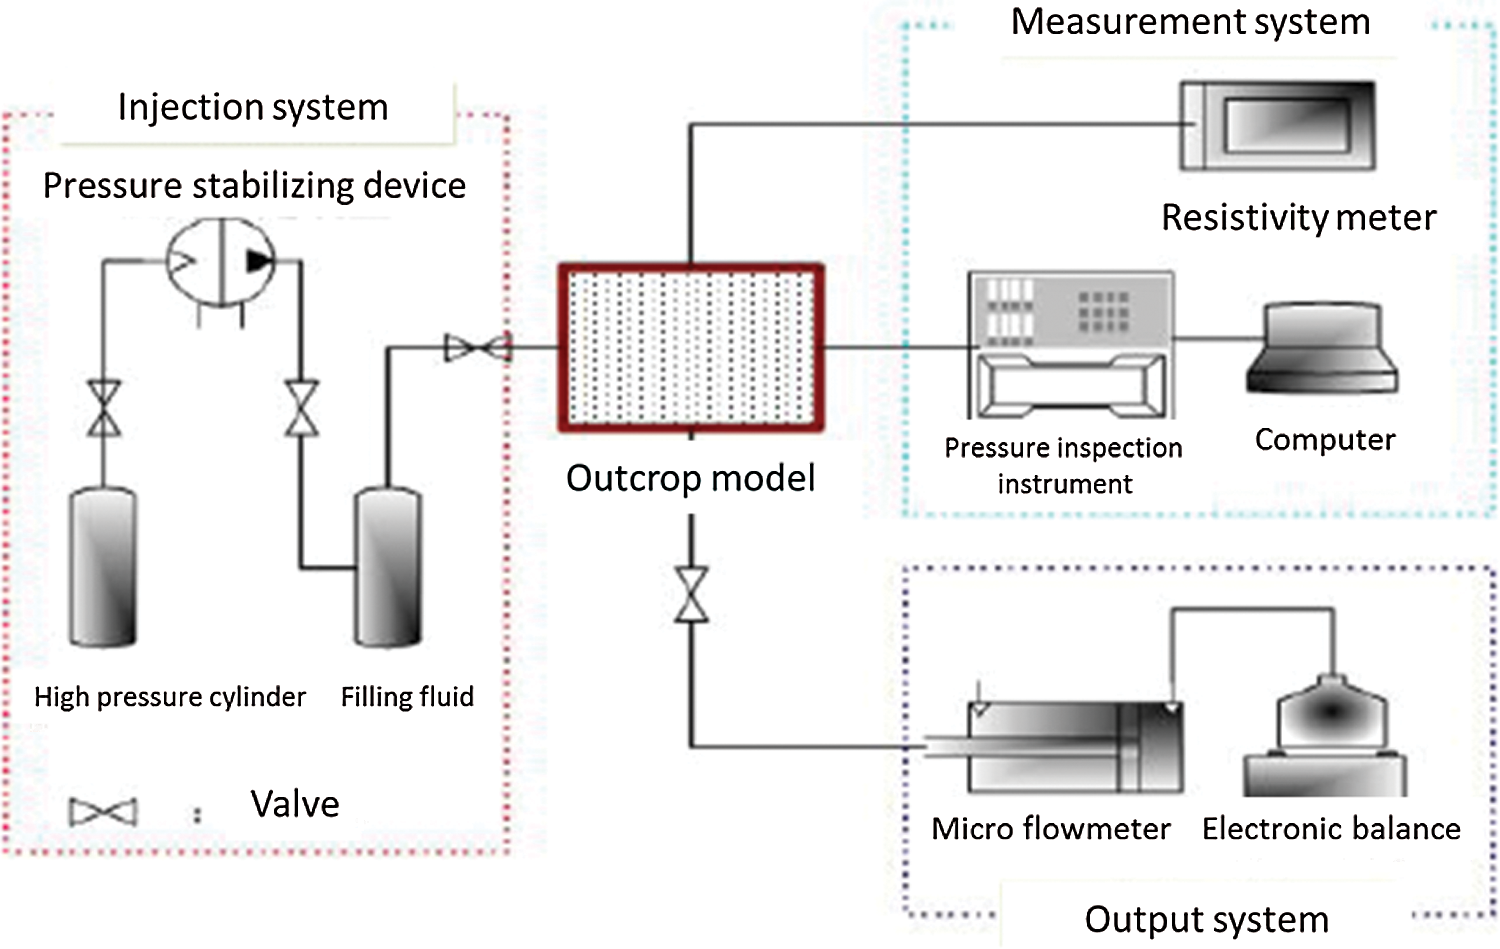
Figure 2: Flow chart of physical simulation experiment
The experimental steps are as follows:
1. Model pretreatment and packaging: the pressure measuring point of the outcrop model is marked with pressure probe installed; after cleaning, the outcrop model was put into an oven to dry. As it dries, the model is taken out from the oven and cools down; meanwhile, packaging mold is prepared based on model size. The model is then cast with temperature and pressure-resistant packaging material.
2. The models were completely saturated with liquid by using the method of multi-point vacuum pumping and water saturation.
3. In the displacement process, the saturated model is connected into the experimental system to conduct water flooding experiment. Under low-pressure displacement, data including pressure field and flowrate are measured. The measurement is repeated after increasing displacement pressure.
4. By recording and processing data including pressure field and flow rate, draw the pressure gradient field and calculate the effective driving factor and effective productivity factor. Based on recorded data including pressure field data and flowrate, the pressure gradient field is plotted and sketched, and the effective drive coefficient and effective capacity coefficient can be obtained.
The flow chart is as follows:
In this study, five different permeabilities were designed, which are 0.3 mD, 0.5 mD, 0.8 mD, 1.5 mD, and 2.0 mD. Six different displacement pressures were setup, which are 0.02 MPa, 0.03 MPa, 0.04 MPa, 0.05 MPa, 0.06 MPa, and 0.10 MPa. The results are shown in Fig. 3.
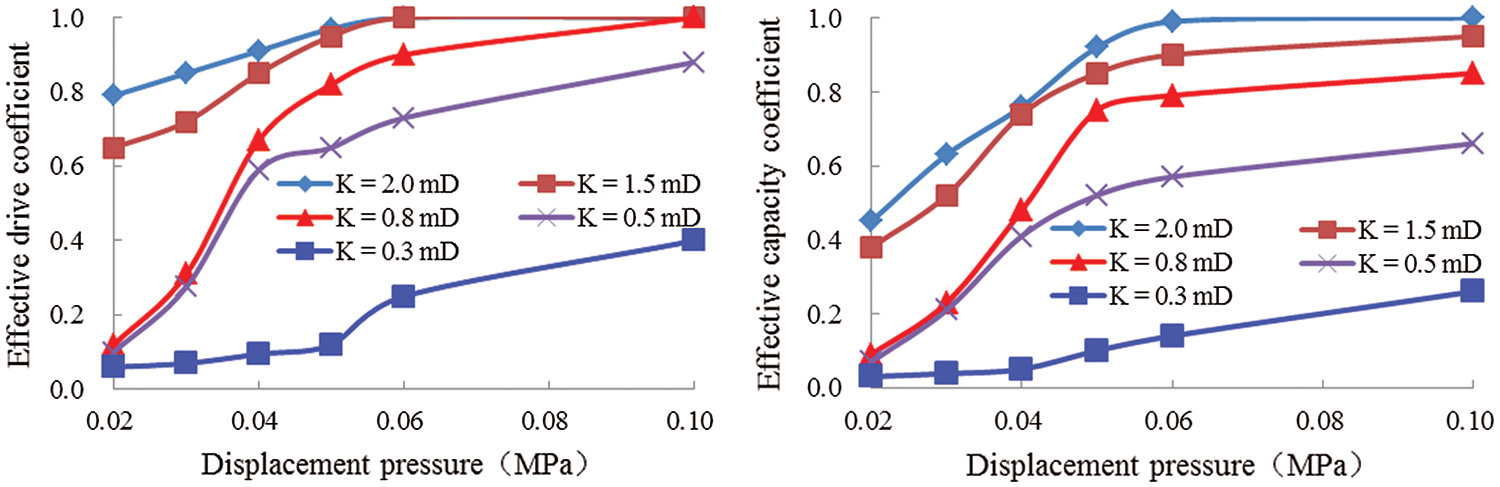
Figure 3: Displacement pressure relations to the effective drive coefficient and the effective capacity coefficient under different permeability
As figures show: (1) Under the same permeability, both the effective drive coefficient and the effective capacity coefficient raise with the increase of displacement pressure. When the permeability is 0.3 mD, the effective drive coefficient and the effective capacity coefficient show a small range of change with the increase of the differential pressure. As soon as the displacement pressure reaches a certain value and continues to increase, the effective drive coefficient and the effective capacity coefficient start to increase. In other words, when the displacement pressure increases from 0.02 MPa to 0.04 MPa, the effective drive coefficient and the effective capacity coefficient increase from 0.06 to 0.09 and from 0.03 to 0.05, respectively. Then, as the displacement pressure continuously increases from 0.04 MPa to 0.06 MPa, the effective drive coefficient and the effective capacity coefficient raise significantly from 0.09 to 0.25 and from 0.05 to 0.14, respectively. In the case where permeability is greater than 0.3 mD, the effective drive coefficient and the effective capacity coefficient raise with the increase of differential pressure. Once the displacement pressure reaches a certain value, the effective drive coefficient and the effective capacity coefficient decrease slightly with an increase in displacement pressure. On the other hand, as the permeability reaches 0.8 mD, the displacement pressure increases from 0.02 MPa to 0.04 MPa, and the effective drive coefficient and the effective capacity coefficient increase from 0.12 to 0.67 and from 0.09 to 0.48, respectively. In contrast, when the displacement pressure increases from 0.04 MPa to 0.06 MPa, the effective drive coefficient and the effective capacity coefficient increase from 0.67 to 0.90 and from 0.48 to 0.79, respectively. (2) Under the same displacement pressure, both the effective drive coefficient and the effective capacity coefficient grow with the rise of the differential pressure. The relations between the displacement pressure and the effective drive coefficient and the effective capacity coefficient differ greatly when the permeability is above or under 0.3 mD. This difference is associated with the microscopic pore structure of its reservoir cores, as shown in Fig. 4, where the distribution characteristics of the reservoir core throat with different permeabilities are shown.
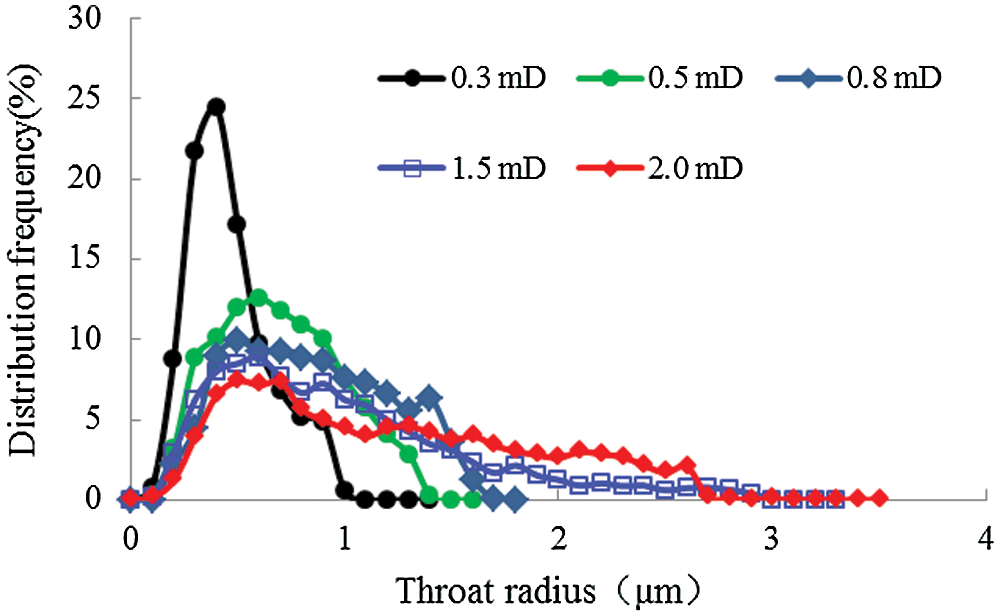
Figure 4: The distributing characteristics of reservoir cores throat at different permeabilities
3.2 Effects of Row Spacing and Producing Pressure Differential
A rectangle well pattern with a permeability of 2.0 mD was used to investigate the effects of different row spacings and producing pressure differentials on the effective drive of the ultra-low permeability reservoir. According to the similarity theory [14], the row spacings of three large outcrop rock sample models, which are 16 cm, 25 cm, and 34 cm, were used to simulate the row spacings of 80 m, 125 m, and 170 m of the actual rectangular well patterns, respectively. The three considered displacement pressures were 0.02 MPa, 0.04 MPa, and 0.07 MPa. The experimental results are shown in Tab. 1 and Fig. 5.
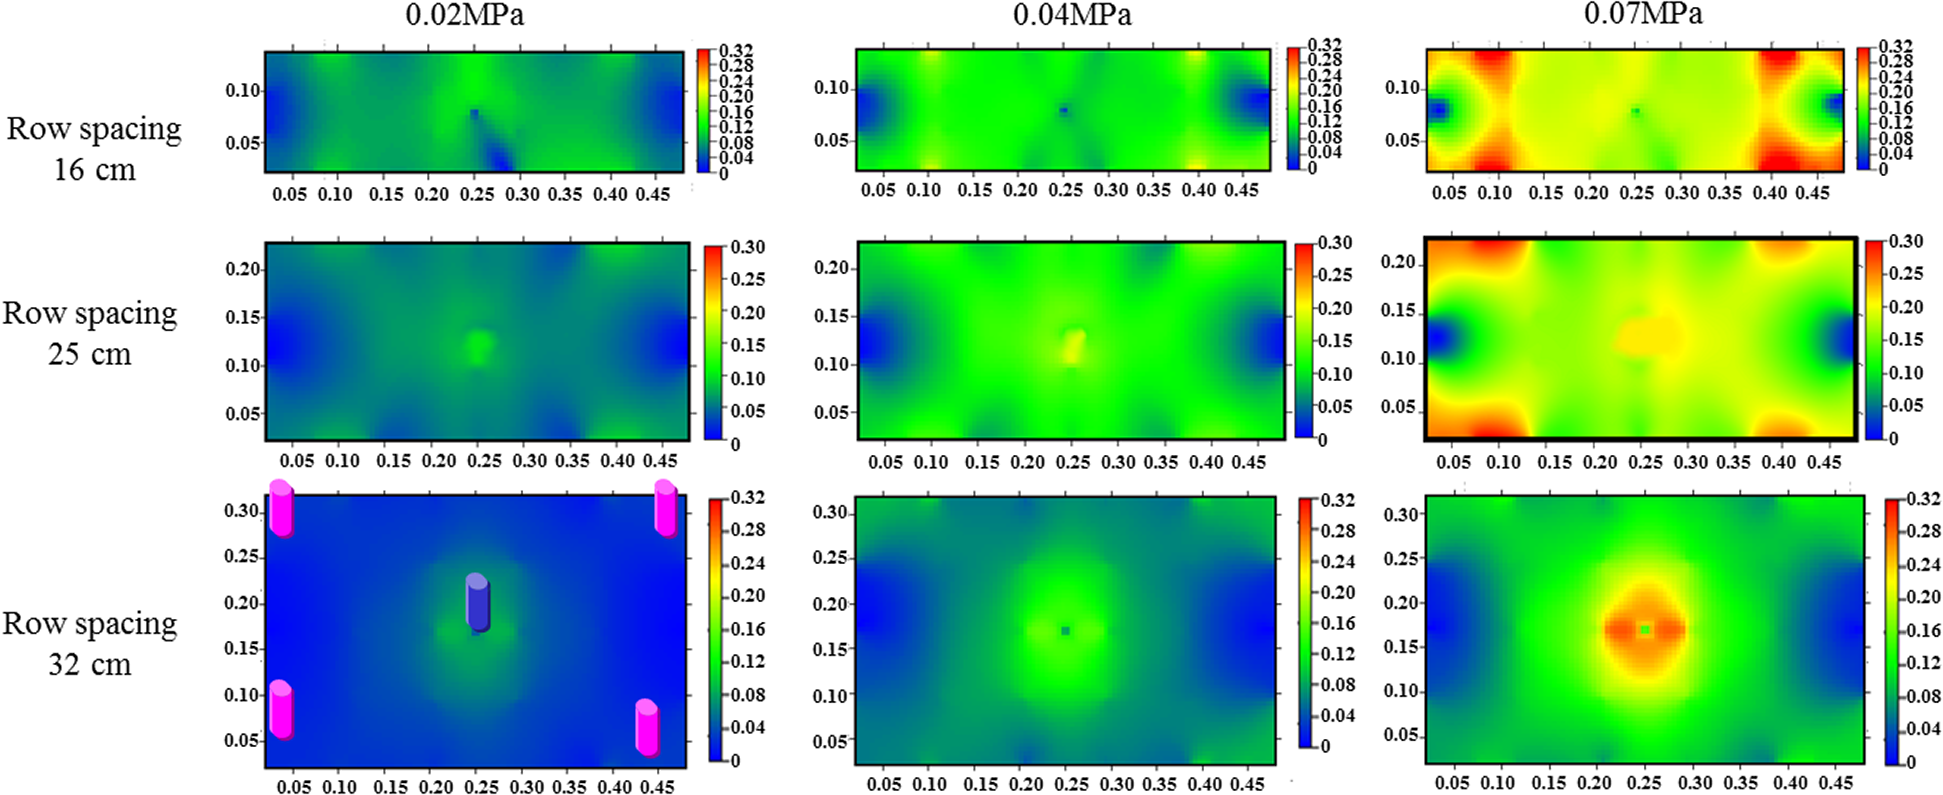
Figure 5: Gradient distribution of the pressure on the rectangular well pattern under different row spacing and producing pressure differential
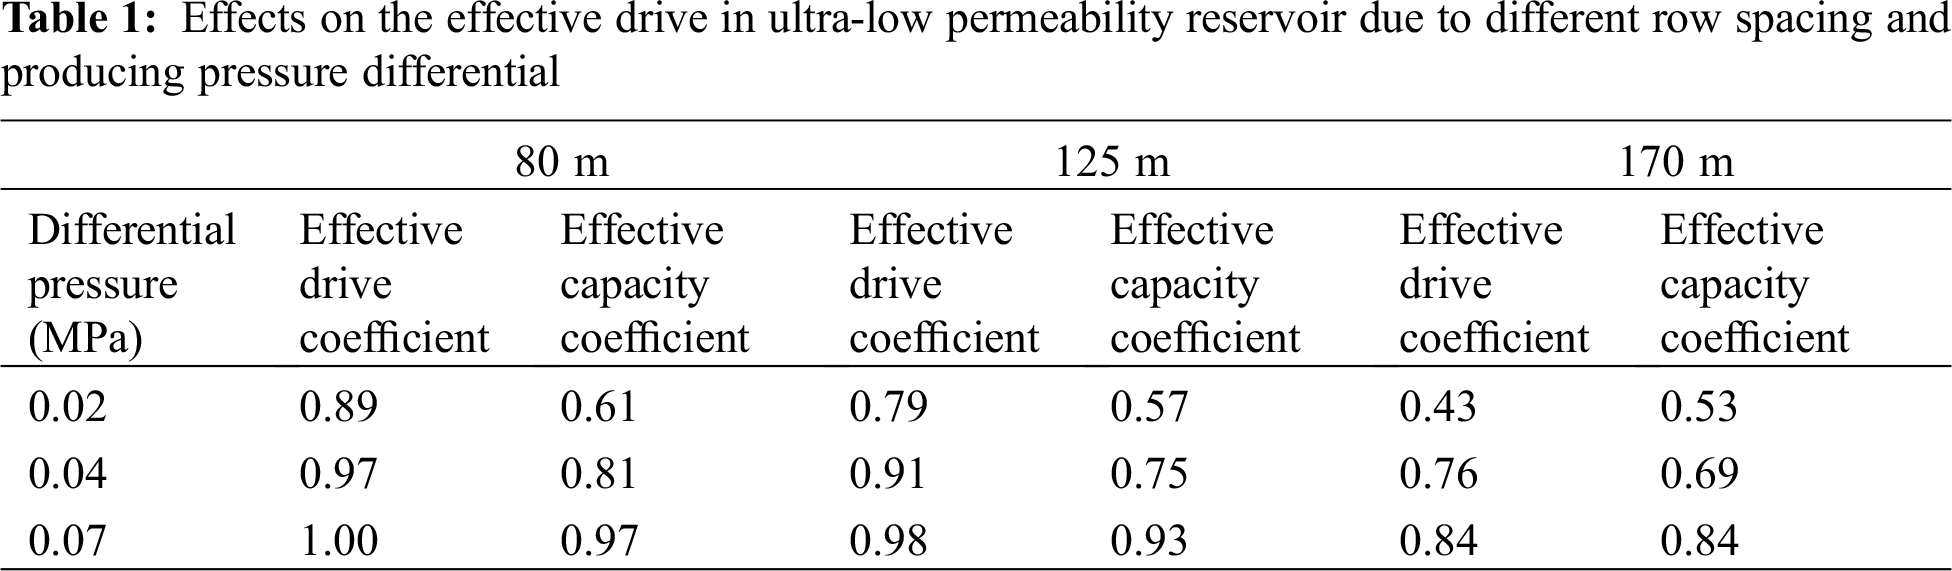
As shown by the above Fig. 1, the effective drive coefficient and the effective capacity coefficient increase with growing displacement pressure and declining row spacing, which can be exemplified by the case in which the displacement pressure equals to 0.02 MPa. The effective drive coefficient and the effective capacity coefficient are 0.43 and 0.53 with a row spacing of 170 m, respectively; the effective drive coefficient and the effective capacity coefficient are 0.79 and 0.57 when the row spacing is 125 m; the two coefficients become 0.89 and 0.61 at a row spacing of 80 m. (2) According to the literature written by Teng et al. [10], the seepage region of an ultra-low permeability reservoir may be divided into dead oil, non-linear seepage, and quasi-linear seepage areas. Then, with the decrease of row spacing or the increase of differential pressure, the non-linear seepage and quasi-linear seepage areas gradually expand while the dead oil area gradually shrinks.
Because of the small pore throat of the ultra-low permeability reservoir, there is a start-up pressure gradient during the displacement process. With the increase of displacement pressure, the injection pressure range gradually spreads outward. As the flow area in the model gets larger, the effective drive coefficient and effective capacity coefficient increase. With the increase of model size, the impact reflected on peripheral area pressure becomes slow, and the start-up pressure gradient cannot be overcome, resulting in the increase of dead oil area and the low effective driving coefficient and effective productivity coefficient.
Therefore, the effective production of ultra-low permeability reservoirs can be improved by increasing reservoir permeability (fracturing), increasing production pressure differential, or narrowing the row spacing.
3.3 Effective Driving Bonds of Ultra-Low Permeability Reservoirs
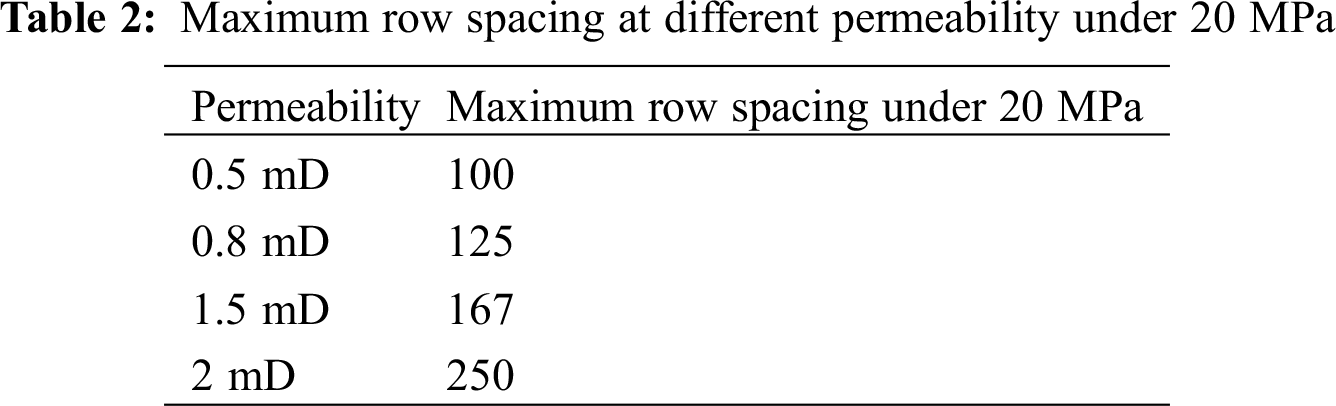
According to studies on the site deployment of the ultra-low permeability reservoir, the production of the wells, the reservoir engineering calculation method (Tab. 2 shows the maximum row spacing at different permeability under 20 MPa), and the converted experimental conditions based on the similarity theory, the effective driving bond of ultra-low permeability reservoir can be determined as follows:
where E is the effective drive coefficient of the colligation of an ultra-low permeability reservoir.
Only when the effective drive coefficient of the colligation is greater than 0.3, can the ultra-low permeability reservoir be utilized effectively. This result provides a supplement and specification of Li’s standard [14] on establishing an effective driving system for a low-permeability oil reservoir.
The application of the above studies on two blocks (Block A and Block B) have shown satisfactory exploration results. As an old area, Block A has a calculated effective drive coefficient of 0.25 based on the original well patterns with a poor water driving performance. The size of the infilling well pattern was 280 m × 200 m, and the effective drive coefficient of colligation was 0.41. After being infilled, each well production has increased by 15% with doubled daily wells group production and a 12% increase of water driving control degree, indicating the achievement of an effective drive. In contrast, as a new area, Block B has a designed well pattern size of 200 m × 200 m with a calculated colligation effective drive coefficient of 0.52. After one year of production, the daily oil production rose steadily, demonstrating the initial success of energy supplements.
Based on the results and discussion, the following conclusions can be drawn:
1. Based on the low-pressure physical simulation experimental system for ultra-low permeability outcrops, two evaluation parameters, namely, the effective drive coefficient and the effective capacity coefficient were introduced to comprehensively illustrate the effective drive of an ultra-low permeability reservoir.
2. The influence of different factors (permeability, row spacing, and producing pressure differential, etc.) on the effective drive of an ultra-low permeability reservoir was analyzed. The studies showed that under the same permeability, the effective drive coefficient and the effective capacity coefficient increase with the increase of the displacement pressure and the decrease of the row spacing. Under the same displacement pressure, both the effective drive coefficient and the effective capacity coefficient increase with the increase of the differential pressure. Moreover, the relations of displacement pressure with the effective drive coefficient and the effective capacity coefficient differ greatly when the permeability was above or under 0.3 mD, which is related to the microscopic pore structure of its reservoir cores. Therefore, the effective production of an ultra-low permeability reservoir can be improved by increasing the reservoir’s permeability (fracturing), increasing producing pressure differential, or narrowing the row spacing.
3. The effective driving bonds of an ultra-low permeability reservoir were determined. Only when the effective drive coefficient of the colligation is greater than 0.3, can the ultra-low permeability reservoir be utilized effectively.
Funding Statement: The authors gratefully acknowledge the financial support from the National Science and Technology Major Project of China (Grant Nos. 2017ZX05013-001 and 2017ZX05069-003).
Conflicts of Interest: The authors declare that they have no conflicts of interest to report regarding the present study.
1. Xu, K. (2013). Current situation and future direction of development of China’s oil & gas exploration and development. A Seminar on New Technology, Procedure and Equipment for Oil (Gas) Exploitation, pp. 11–13. Chengdu, China. [Google Scholar]
2. Ministry of Land and Resources (2020). 2019 national oil and gas mineral reserves bulletin. Beijing: Ministry of Land and Resources. [Google Scholar]
3. Sun, J., Liu, D., Zhu, X., Huang, W., Cheng, L. (2020). Experimental investigation on the pressure propagation mechanism of tight reservoirs. Fluid Dynamics & Materials Processing, 16(3), 425–440. [Google Scholar]
4. Wang, J., Sun, J., Liu, D., Zhu, X. (2019). Production capacity evaluation of horizontal shale gas wells in Fuling district. Fluid Dynamics & Materials Processing, 15(5), 613–625. [Google Scholar]
5. Su, H. B., Zhang, S. M., Sun, Y. H., Wang, X. H., Yu, B. M. et al. (2020). A comprehensive model for oil-water relative permeabilities in low-permeability reservoir by fractal theory. Fractals, 28(3), 2050055. [Google Scholar]
6. Han, G. F., Liu, Y. W., Kumar, N., Zhou, Y. F. (2018). Discussion on seepage governing equations for low permeability reservoirs with a threshold pressure gradient. Advances in Geo-Energy Research, 2(3), 245–259. [Google Scholar]
7. Wang, B. C. (2017). Study on the limit of ultra-low permeability reservoir and the establishment of driving system. China: Northeast Petroleum. [Google Scholar]
8. Zhao, M. W., Cao, M. J., He, H. N., Dai, C. L. (2020). Study on variation laws of fluid threshold pressure gradient in low permeable reservoir. Energies, 13(14), 3704. [Google Scholar]
9. Energy, Oil and Gas Research (2020). Findings from China University of Petroleum provides new data about oil and gas research (The influence of hydraulic fractures on oil recovery by water flooding processes in tight oil reservoirs: an experimental and numerical approach). Energy Weekly News. [Google Scholar]
10. Teng, Q. (2014). Physical simulation experiment method of fractured ultra-low permeability reservoir and its application. Institude of Porous Flow and Fluid Mechanics, Chinese Academy of Sciences, China. [Google Scholar]
11. Zhu, X. L., Meng, Z. Q., Gong, P. Z., Li, G. L., Wang, X. R. (2020). 3D physical simulation of water flooding characteristics of buried hill reservoir with different fracture systems. Journal of Power and Energy Engineering, 8(5), 1–13. [Google Scholar]
12. Wang, X. Y., Yang, Z. M., Liu, X. W., Ding Y. H., Lei, Q. H. (2018). Physical simulation of large-model using cyclic water injection. Research and Exploration in Laboratory, 4(37), 32–48. [Google Scholar]
13. Pang, Z. Y., Hao, Q., He, Y. S., Zhang, Y. G., Kang, Y. L. et al. (2020). A new method for ultra-low permeability reservoir characterization after water flooding development. Journal of Energy Resources Technology, 142(11), 113005. [Google Scholar]
14. Li, D. P. (2008). Key and core for effective development of low-permeability oil reservoir collected works on the oratical technology of research institute of petroleum exploration and development for fifty years (1959–2008), pp. 641–649. Beijing: Petroleum Industry Press. [Google Scholar]
 | This work is licensed under a Creative Commons Attribution 4.0 International License, which permits unrestricted use, distribution, and reproduction in any medium, provided the original work is properly cited. |