| Fluid Dynamics & Materials Processing |
DOI: 10.32604/fdmp.2021.016692
ARTICLE
Experimental and Numerical Analysis of the Relationship between Pressure and Drip Rate in a Vertical Polypropylene Infusion Bag
School of Mechanical Engineering, Anhui Polytechnic University, Wuhu, 241000, China
*Corresponding Author: Weiwei Duan. Email: 2190130134@stu.ahpu.edu.cn
Received: 20 April 2021; Accepted: 13 July 2021
Abstract: Vertical infusion (self-emptying) bags used for Intravenous infusion are typically obtained by moulding a soft envelope of polypropylene. In normal conditions a continuous flow of liquid can be obtained with no need to use a pump. In the present study, the relationship between air pressure effects and the drug drip rate have been investigated experimentally and numerically. After determining relevant experimental data about the descending height of liquid level, the dropping speed and pressure, the ordinary least square method and MATLAB have been used to reconstruct the related variation and interrelation laws. Numerical simulations have been performed to determine the best gas-liquid volume ratio and improve the overall performances of these bags. According to these results, that the biggest effect on the drip rate is produced by the diameters of the used needles.
Keywords: Polypropylene infusion bag; numerical simulations; gas-liquid volume ratio; overall performances; drip rate
Intravenous infusion is commonly used in clinical medicine and infusion bags, whose standard capacity is 250, are widely used for various annual demands [1]. At present, most hospitals lack of that equipment for air purification and hygiene cleaning. Therefore, it is particularly paramount to make infusion bags self-emptying in barometric pressure in the closed infusion process, rather than air circuit. In addition, the right way to regulate the rate of infusion is effective treatment and to control the rate of infusion is an important link to ensure the quality of treatment and care [2]. The study on the pressure and rules of drip rate in the infusion process of vertical polypropylene infusion bags could be practical to guide new structures of infusion bags and to design more reasonable infusion bags [3–6].
With the progress of medical science, more stringent requirements for airtightness, costs in economy, suitability of drug containers, vertical infusion bags have been on the stage, which attracts scholars to conduct numerous researches on vertical infusion bags. Liang et al. [7] have discussed the application of pressurized infusion bag in cardiac arrest. Using the cardioplegia perfusion to protect myocardium is safe, easy to operate the pressure of perfusion and the controllability of capacity are in good controllability. However, they did not simulate the pattern of pressure and simulation within infusion bags was not simulated. Song [8] has analyzed the rapid method to determinate the rate of intravenous drip, which improved the working efficiency. However, according to long-term clinical practices, it could not be used to accurately describe the drip rate of infusion process. Xiao et al. [9] and other researchers have proposed that real-time monitoring of the rate of infusion drip needs to monitor liquid droplets and the liquid level in most cases. In addition, there are few mistakes of measurements to monitor infusion drips, alarms are timely and reliable, due to various factors in the environment, when to call the nurse to replace the liquid still needs further consideration, and timely replacement of liquid still needs further consideration. Most of these aforementioned discussions are based on experience rather than scientific experiments, which demonstrate that this research is not scientific enough.
Scientific experiments are generally based on the theories while the results are often affected by the factors which should be found in comprehensive experiments. In addition, the differences of individuals in experiments often lead to the variety and instability of the results. Therefore, it is difficult to apply data in statistics for medical treatment. In this paper, a kind of simulator of human blood vessel was used to build devices of infusion and make experimental environment closer to real hospitals, then the pressure and drip rate in self-emptying were obtained by using the principle of fluid mechanics. The simulation of flow field was carried out by CFD to obtain the pressure and velocity field. The experimental data were fitted with MATLAB to require condition that the pressure and the drawdown rate of liquid level are in curve relationships and constitute a quartic function; lastly, the biggest factor that affects the infusion rate through experiments would be fingered out [10]. This article provides a theoretical basis for obtaining the design method of the infusion bag and obtaining the drip rate law of intravenous infusion.
As the actual liquid transport speed is comparatively slow (less than 90 drops), which conforms to the laminar flow law, it is possible to calculate the total pipe pressure loss by water head losing and the local pressure loss [11].
The pressure loss of the fluid in the pipe flow is defined as the Eq. (1):
where, l is pipe length, d is pipe diameter, ρ is fluid density, v is fluid speed, and λ is the loss of resistance along the project.
When fluid flows through various local obstruction devices, due to different influential factors, the flow is extremely complex and not easy to be calculated theoretically; hence the local pressure loss is generally calculated by the following Eq. (2):
where, ζ is the coefficient of local resistance.
Therefore, the total pressure loss in the pipeline is the Eq. (3):
Infusion process diagram is shown in Fig. 1, and the Eq. (4) can be obtained by Bernoulli equation in the initial state.
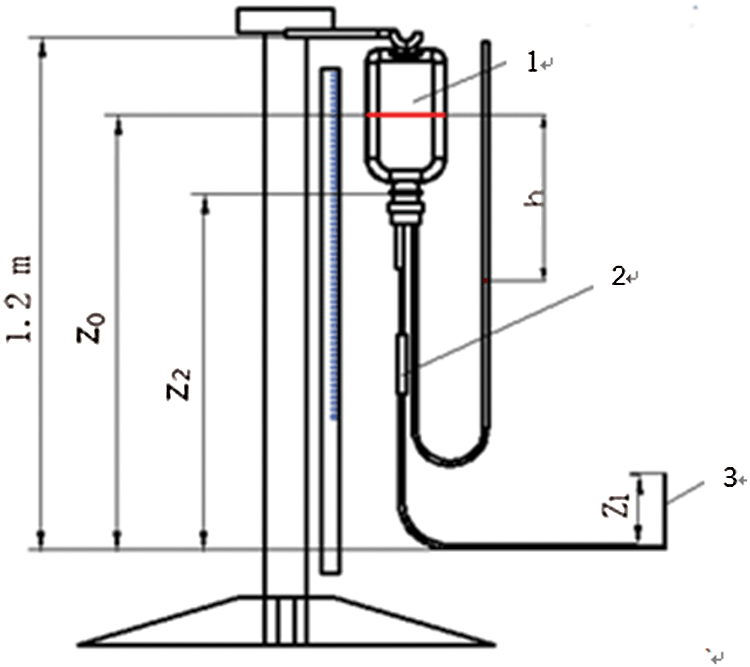
Figure 1: Schematic diagram of infusion process, 1—gas zone, 2—murphy tube, 3—water column of 24 mm height
At the end of the state, Eq. (5) can be obtained as follows:
At initial condition, v0 is the speed of the liquid in the bag. p0 is the air pressure, v1 is the speed of the needle in the initial state. v2 and p2 is the speed and pressure of the liquid at a certain state. p1 and z2 are the pressure and height of the venous blood vessel simulator. z0 and z2 are the height from the liquid in bag to the arm of the venous blood vessel simulation device height in the initial state and the state of the infusion bag in any state, Δp1 and Δp2 are the total pipeline loss in the infusion process.
In Murphy tube, one hundred drops of liquid is about 6.5 ml, which can be converted to the velocity of 15 drops/ml. The output of the local loss of the needle accounts for a large proportion of water head losing, and the proportion of the input needle takes up a small proportion in all the energy loss, hence the latter is negligible. As the local pressure loss becoming larger with the higher speed, and reaching the maximum speed at the initial state, the corresponding local pressure loss in the initial state is selected.
When the needle external diameter is 0.5 mm, the internal diameter is 0.3 mm, and the initial speed is 57 drops/min, the flow rate could be calculated as 0.83 m/s. And when the final drip rate is 40 drops/min, the flow rate could be of 0.58 m/s. Confirming the table to get the local energy loss coefficient ζ of the needle with external diameter of 0.5 mm, it can be measured that the value of z0, z1, and z2 of the 250 ml infusion bag are 1.14 m, 24 cm and 1.025 m. Substituting z0, z1, v0, v1, p1, p2 into Eqs. (1)–(5) to acquire the minimum value of P2 is –2640 Pa when dripping at 40 drops/min.
3 Flow Field Simulation of Infusion Process
In order to find the appropriate modeling method and to determine the reasonable boundary conditions and flow patterns, the infusion bag with the capacity of 250 ml was taken as an example, the FLUENT [12,13] software was used to simulate the unsteady flow of the infusion process in the initial state and near the evacuating state [14–16].
3.1 The Implementation of 3D Models
In this chapter, a 250 ml infusion bag was taken as an example and the simulation process of which is similar to other polypropylene infusion bags with different volumes. The theoretical data of three vertical polypropylene infusion bags and infusion tubes were obtained from measurements of Vernier calipers and rulers. Combined with the height of the infusion tube from the venous vessels described in Chapter 2, UG software was adopted to establish 3D models of infusion bottles and tubes. Finally, the model was implemented as follows: the liquid volume of the infusion bag was 250 ml; the initial liquid height in the bottle (the distance between the liquid surface and the bottle mouth) was 40.5 mm; the inner diameter of the output needle was 0.3 mm. The model is shown in Fig. 2.
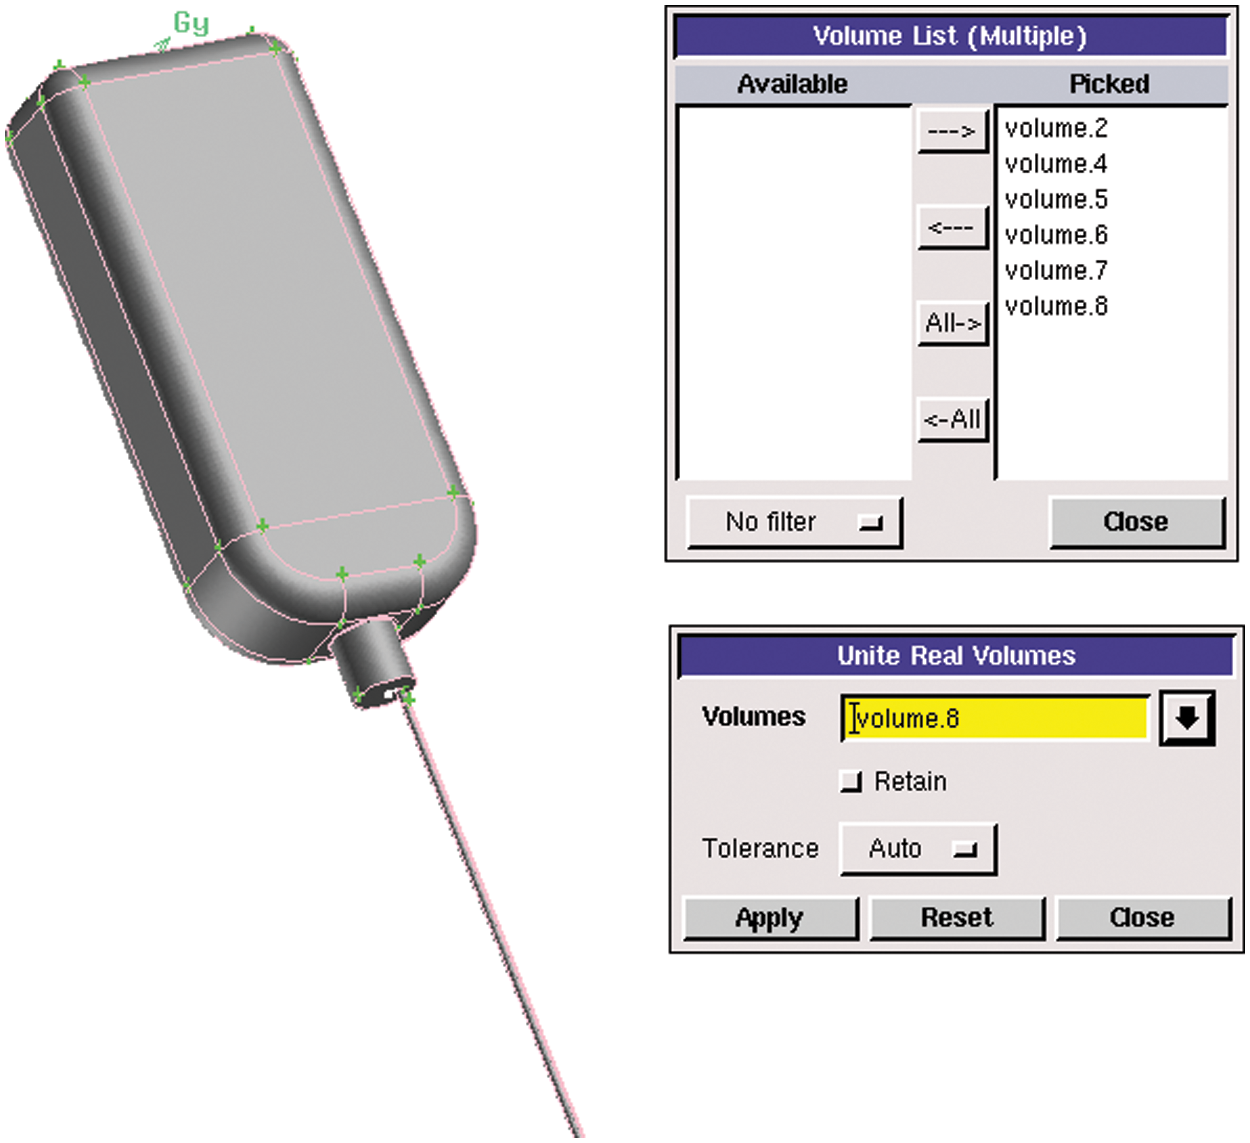
Figure 2: Infusion bag model
In general, the calculation of denser grids is extremely accurate and time-consuming. The tubes were meshed by a high-density grid while the polypropylene infusion bag was meshed by a low-density grid. This method not only guaranteed the calculation accuracy but also took into account the calculation economy. The grid was divided by hexahedral structured mesh, and tetrahedral unstructured mesh according to the structural characteristics of each part. Before the grid was specifically divided, the model needed to be processed accordingly.
1. Firstly, all the independent parts such as the bottle, the bottom of the bottle and the tube were combined as a whole by Boolean operation, and then the overall model was divided according to the meshing needs. The operation of the merged model is shown in Fig. 3.
2. The infusion bottle model was divided into several parts according to the structure and size. A surface was created to divide the body. Fig. 3 shows the segmentation operation of the model. There was a big difference between the size of the tube and the bottom of the bottle. Thus, the mesh needed to be divided separately. The rest of the body was also divided in the same way.
3. For parts such as the bottle and the tube, the relevant surface should be meshed before dividing the body grids. Fig. 4 demonstrates the meshing operation of the tube section by surface meshing. Fig. 5 illustrates the grid of the middle section of the infusion bottle, which adopts quadrilateral structure. The surface meshing size of each part is determined according to the structure size.
4. The body meshing was performed on the basis of surface meshing. Considering the structural characteristics of infusion bottles and tubes, the cooper method was adopted. Fig. 6 is the operation of structural body meshing. The unstructured mesh was used for the lower part of the bottle and the common surfaces of the adjacent body share a set of grids, which was convenient for later analysis and calculation. The body meshing of infusion bottle is shown in Fig. 7 and the total number of grids is about 1.7 million.
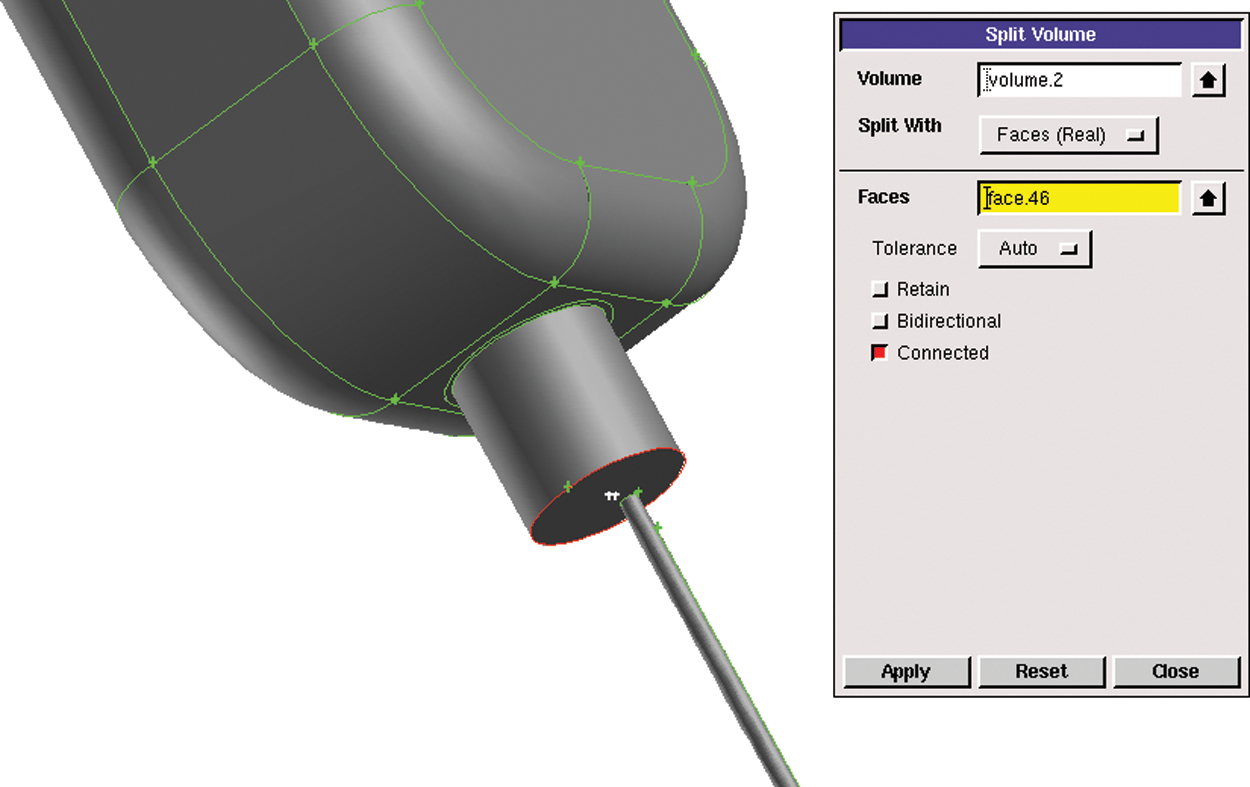
Figure 3: Segmentation operation of model
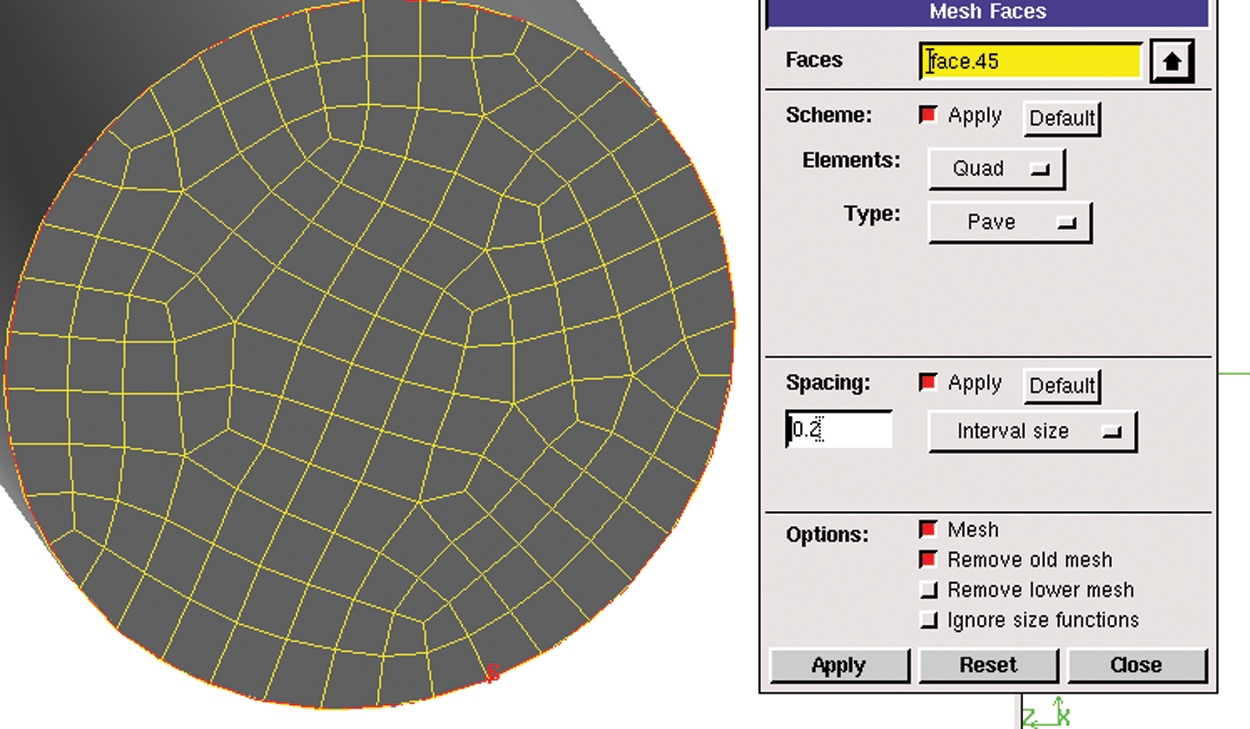
Figure 4: Surface meshing operation
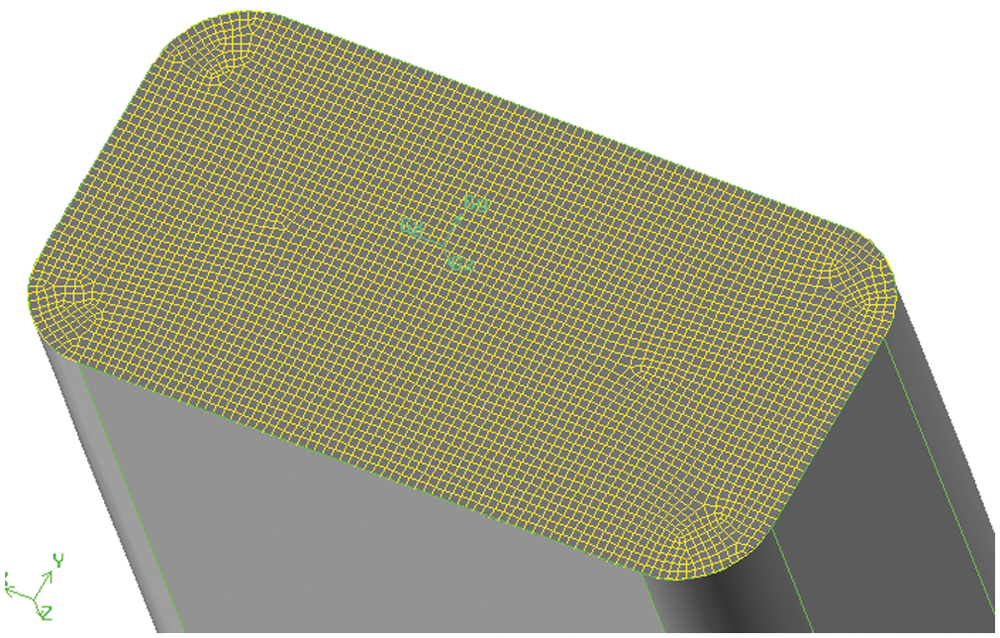
Figure 5: Middle section mesh of infusion bottle
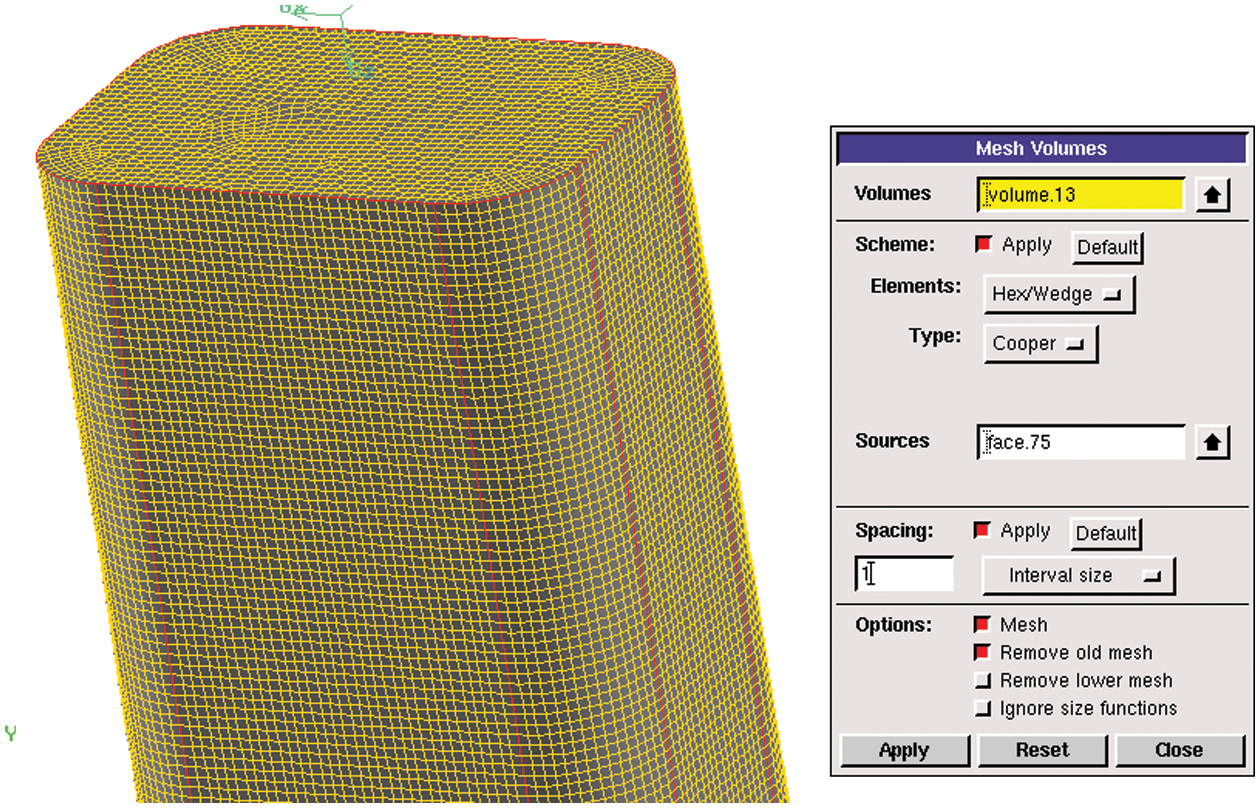
Figure 6: Body meshing operation
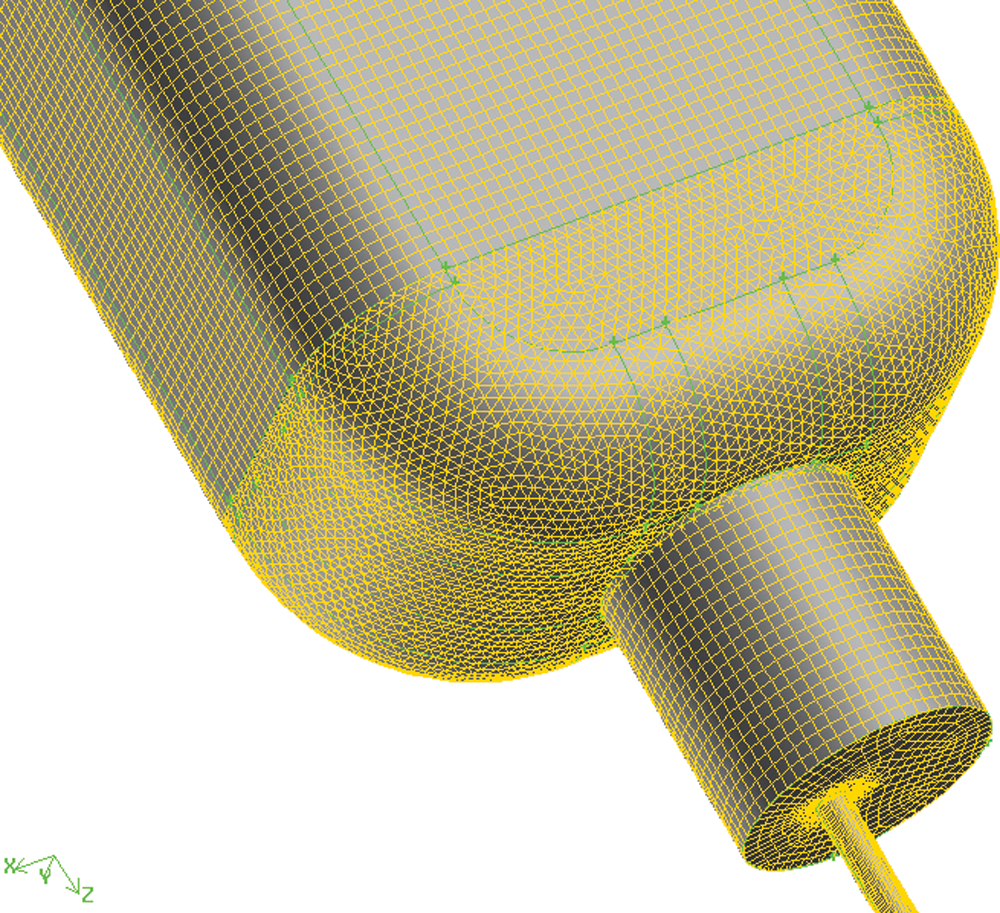
Figure 7: Body meshing of infusion bottle
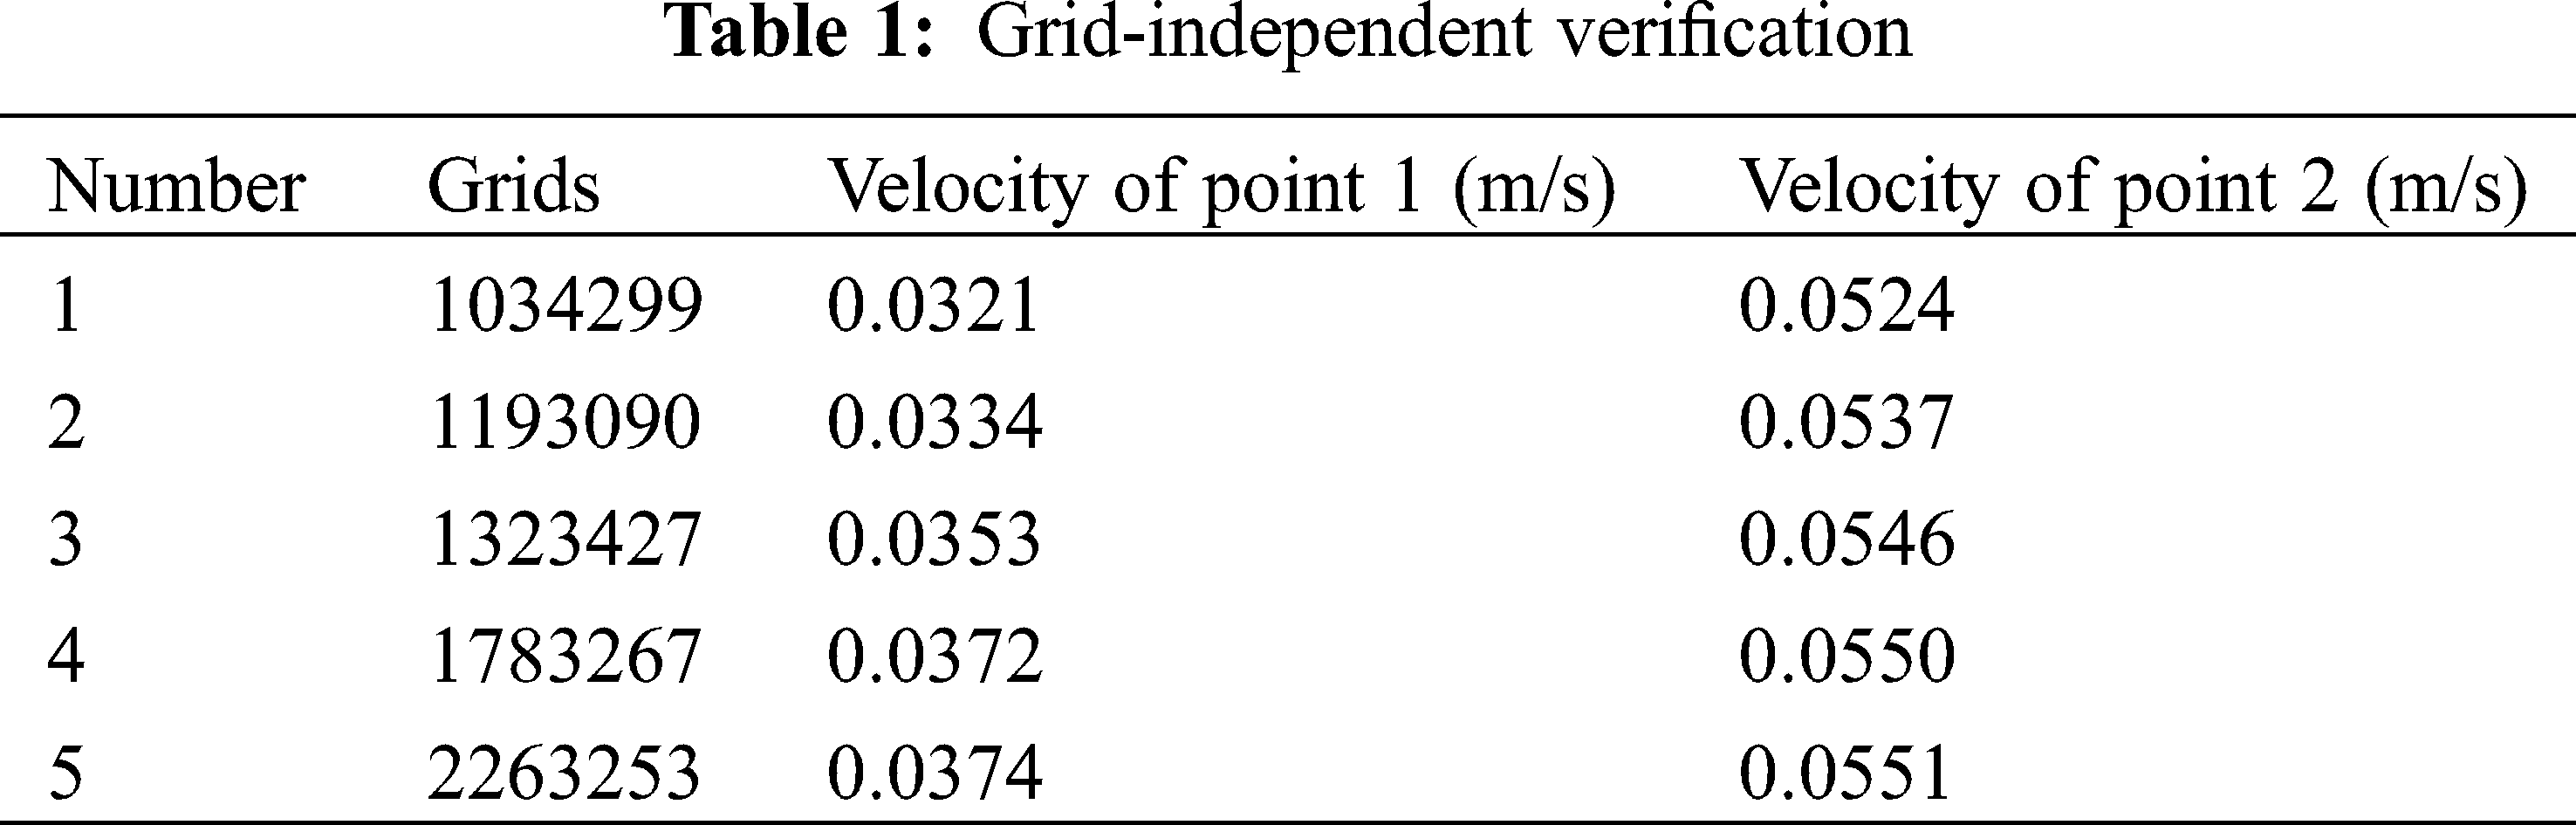
Two speed monitoring points were set at the exit of the infusion bag and the middle of the tube respectively, as shown in Fig. 8. Grid-independent verification was shown in Tab. 1.
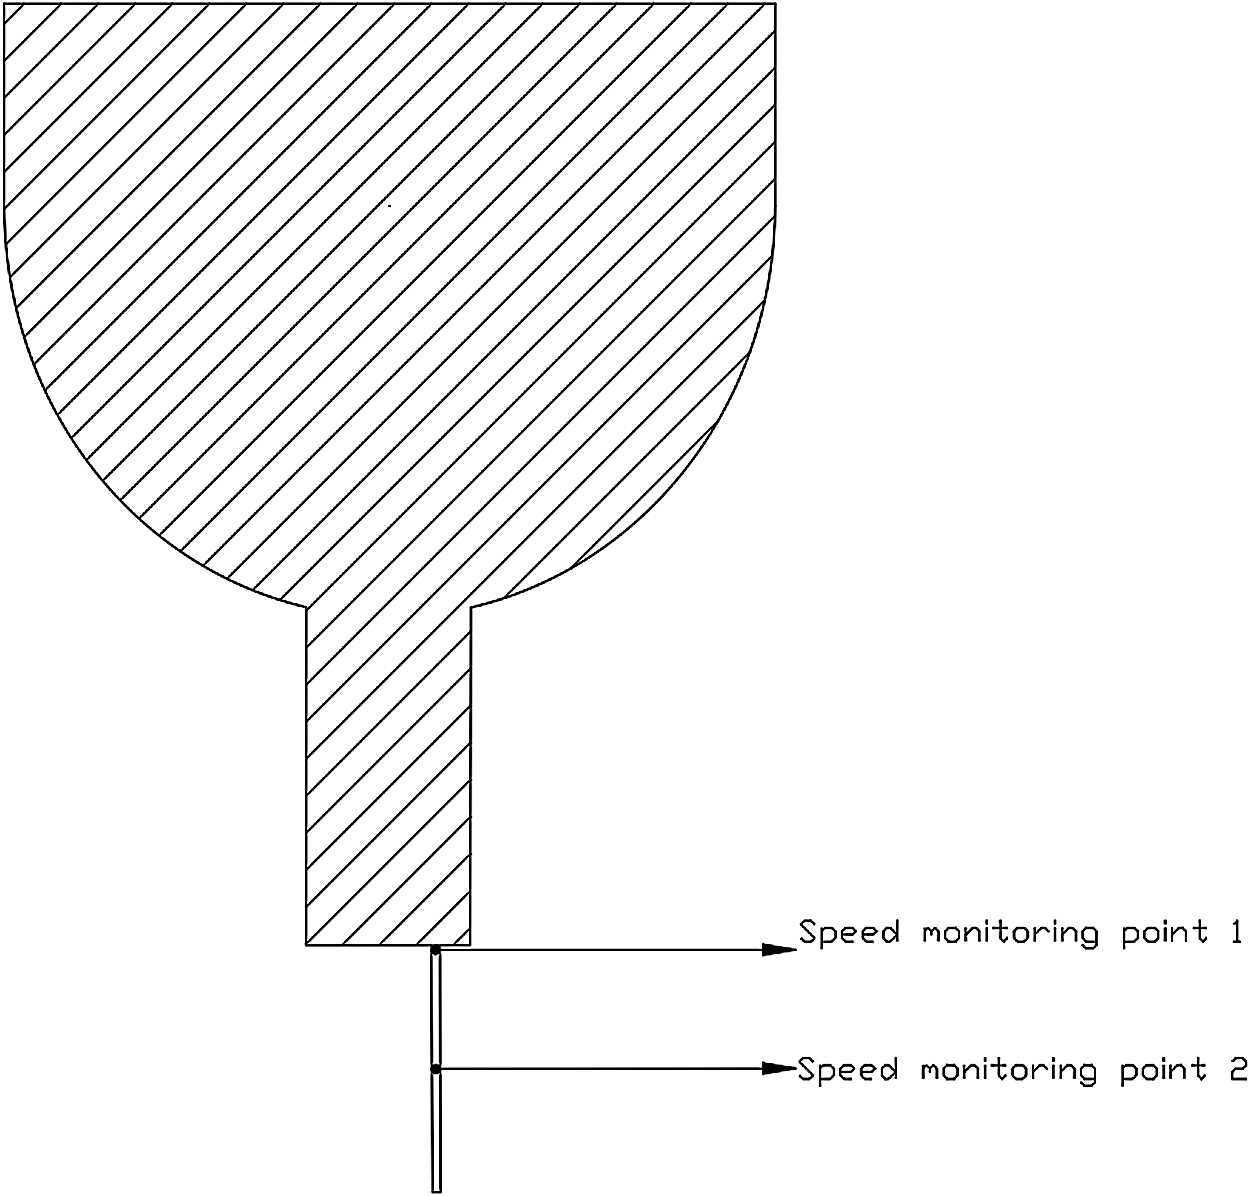
Figure 8: Speed monitoring points
For the flow in the infusion bottle, the liquid in the bottle was continuously reduced and the liquid level was continuously decreasing as time goes by, which was an unsteady flow. Besides, the infusion bottle was constantly deformed and the gas phase pressure in the bottle was constantly changing with the liquid level. The flow field analysis cannot analyze the deformation of the bottle and the pressure change in the bottle due to the deformation of the bottle body could not be obtained. Therefore, the deformation of the bottle was not taken into consideration in this calculation. A fixed position was taken for steady-state analysis in order to analyze the flow rate at the outlet under the conditions of a given bottle pressure and the height of the liquid level in the bottle.
3.4 Setting Boundary Conditions
(1) Calculating Model and Boundary Conditions
Calculation time was Steady. Viscous Model was Laminar. The VOF [17,18] gas-liquid two-phase flow model was adopted with the gas phase as the main term and the liquid phase as the second term. The calculation type was Steady state; the viscous flow model used a laminar flow equation. The outlet was a pressure outlet with a pressure of 2,500 Pa, shown in Fig. 9. All the remaining wall conditions were set as WALL. The VOF model was set as shown in Fig. 10. Solution Methods were PISO, and Under-Relaxation factors were all set to 0.2. Other parameters were default. Because it is a steady state calculation, the under-relaxation factors were adjusted to 0.2 in order to improve the stability of the calculation.
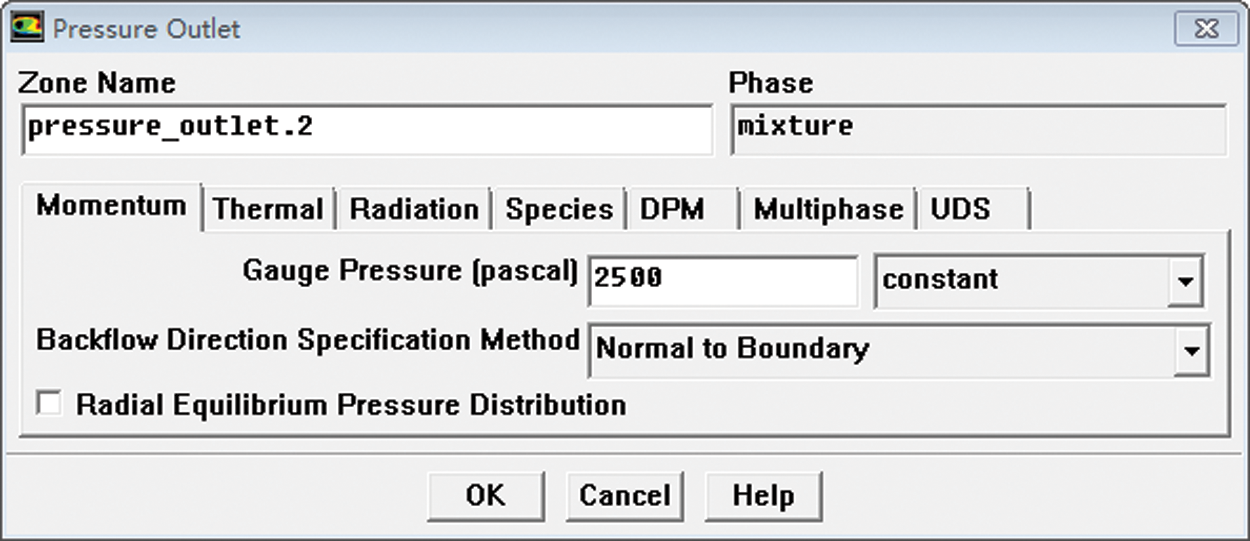
Figure 9: Outlet boundary condition setting
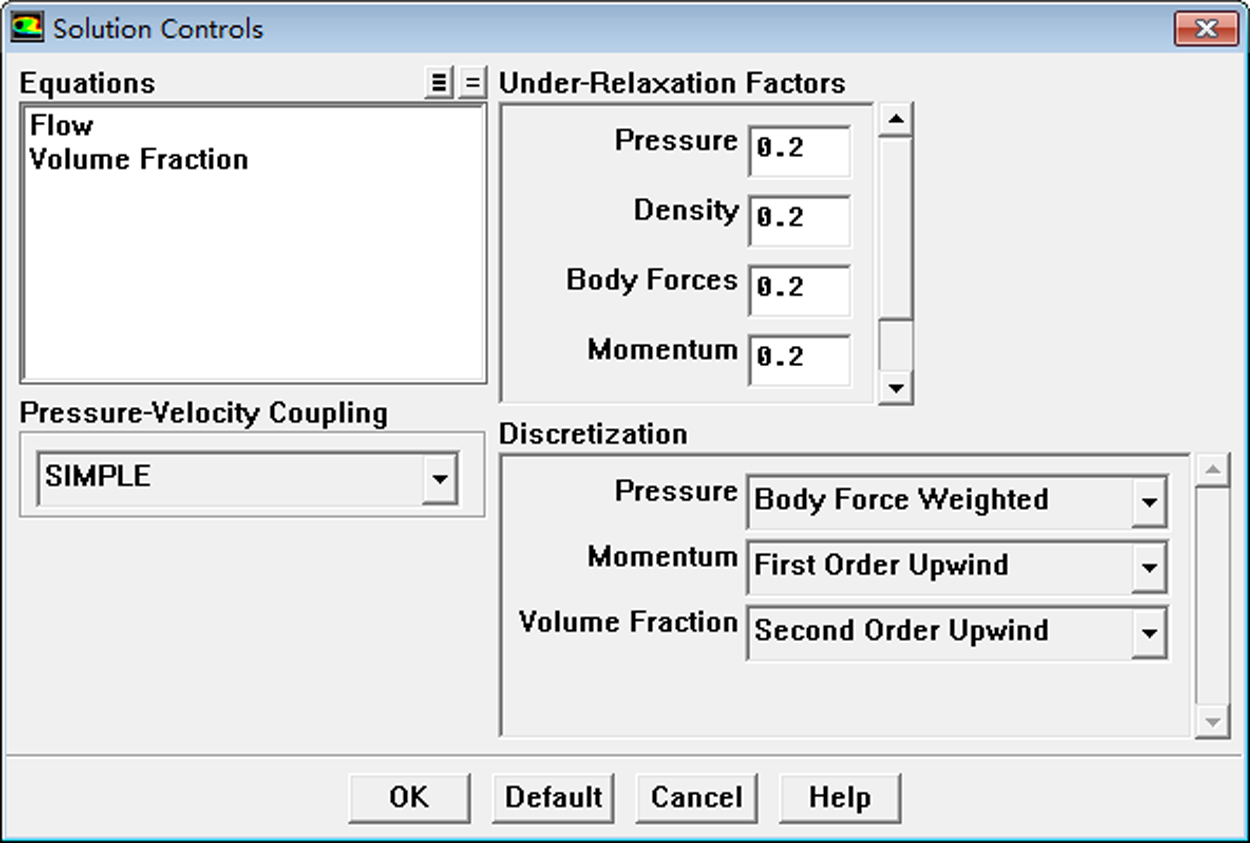
Figure 10: VOF model setting
The VOF method determine the free face by studying the volume ratio function of fluid and mesh in the grid cell, and track the change of fluid rather than the motion of particles on the free face. The definition function for the existence of the phase flow point on the grid is as follows (Eq. (6)):
The mass conservation formulation is shown in Eq. (7), the difference equation is shown in Eq. (8), and the difference grid is shown in Fig. 11.
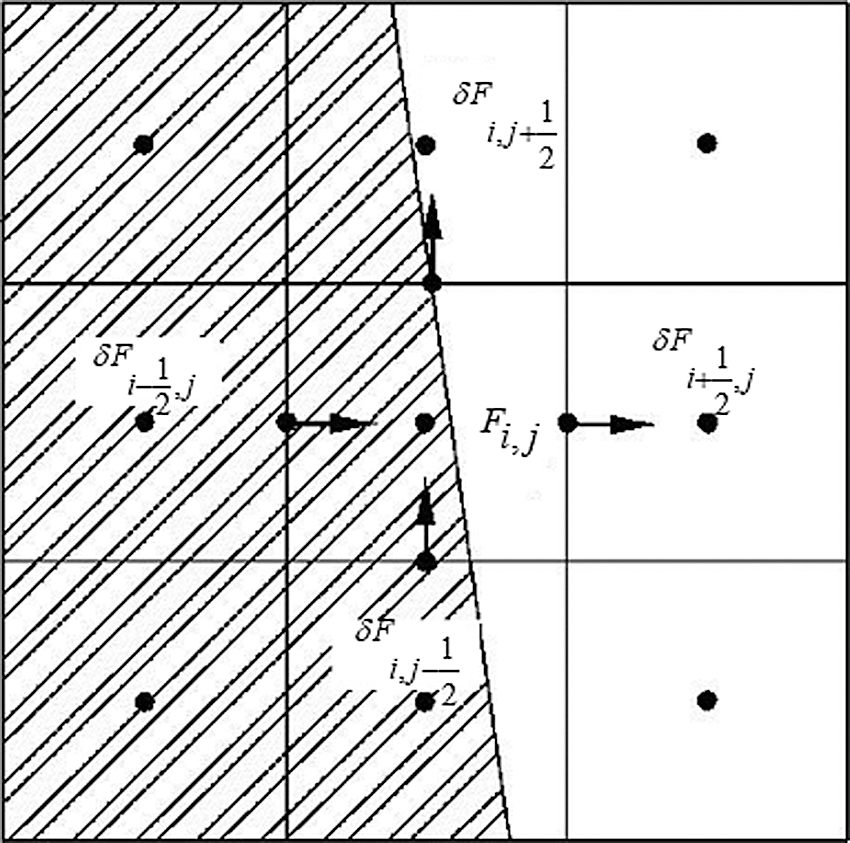
Figure 11: Variables on grid cell
(2) Initialization
After the relevant settings were completed, and the flow field initialized, the gas phase area was defined first, and then calculation was performed. Then the gas phase area was under “patch” process. The gas percentage in gas phase area (The gas phase was located in the upper part of the infusion bottle.) was set as 1. Fig. 12 is the “patch” operation. When calculating, the residual graph was opened and the exit velocity value was monitored to judge whether the calculation was over.
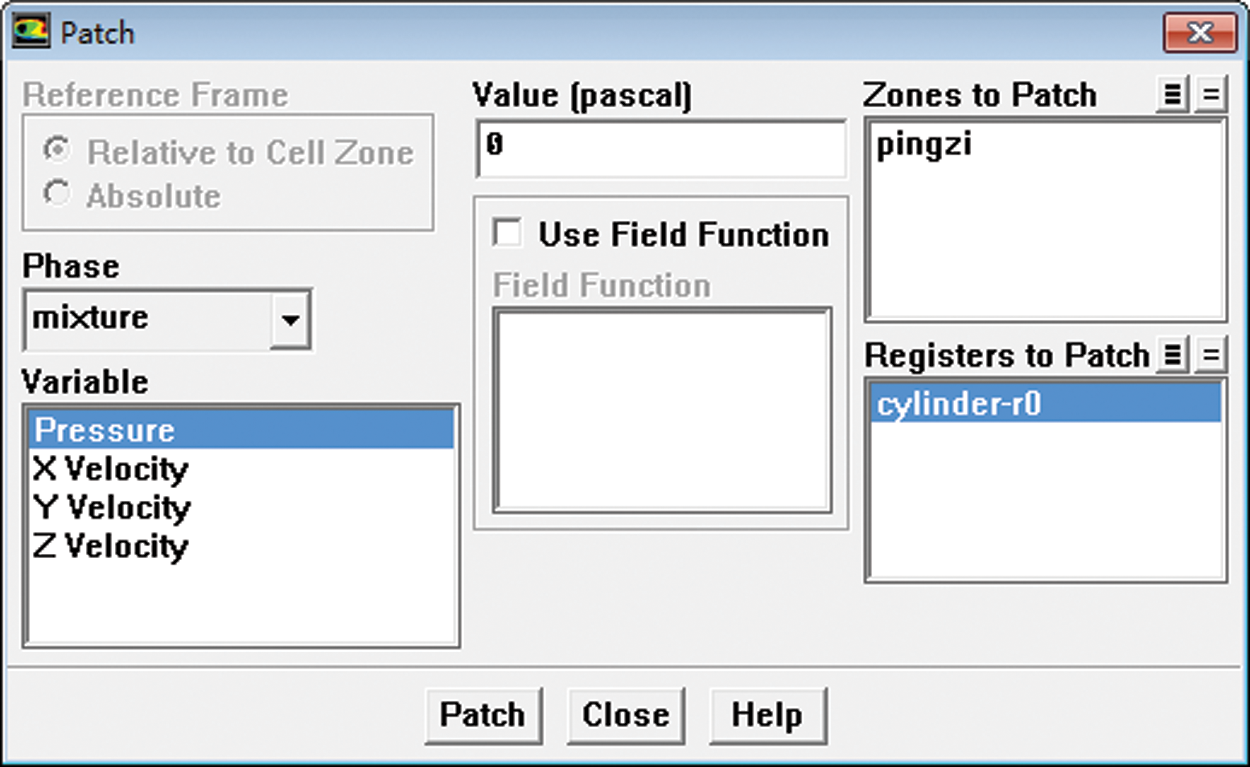
Figure 12: Initial flow field patch settings
In the initial stage of infusion, the model was implemented as follows: the volume of the infusion bottle was 250 ml; the height of the upper gas was 45 mm; the diameter of needle was 0.3 mm. When the air was approached, the initial height of the liquid in the bottle was 40.5 mm, and the needle’s diameter was 0.3 mm. Thus, a two-part fluid model and meshing were implemented. The grid division with the total number of 567,778 is shown in Fig. 13.
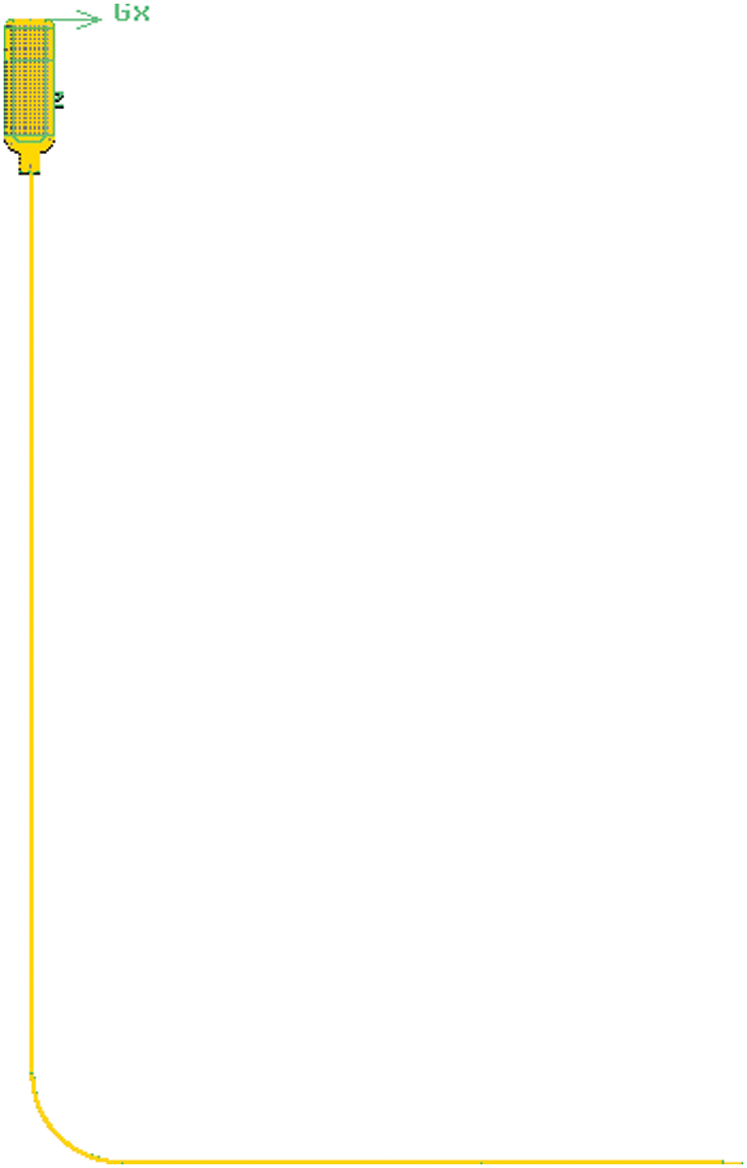
Figure 13: Meshing
At the end of the infusion, the model was used as the calculation area. The pressure on the liquid surface was set at –2,980 Pa, the pressure at the outlet of the needle was set at 2,400 Pa, and the flow medium was simplified as water. The infusion process simulated the flow condition within 3 s from this state. In order to compare with the experimental data and to verify the reliability of the simulation, the speed point P was set at the center of needle outlet section in the calculation process.
The contour of velocity of the infusion bag outlet at the beginning of infusion is showed in Fig. 14. It can be seen that the speed of the fluid is maximum at the center and the speed of fluid near the tube was 0, which is consistent with the theoretical analysis. Through the “report” function of FLUENT the average value of speed taken out of the outlet is converted into the dripping rate. The dripping rate at the beginning of infusion is about 57 drops. When the pressure in the bottle is –2,000 Pa, the dripping rate is about 44 drops at the end.
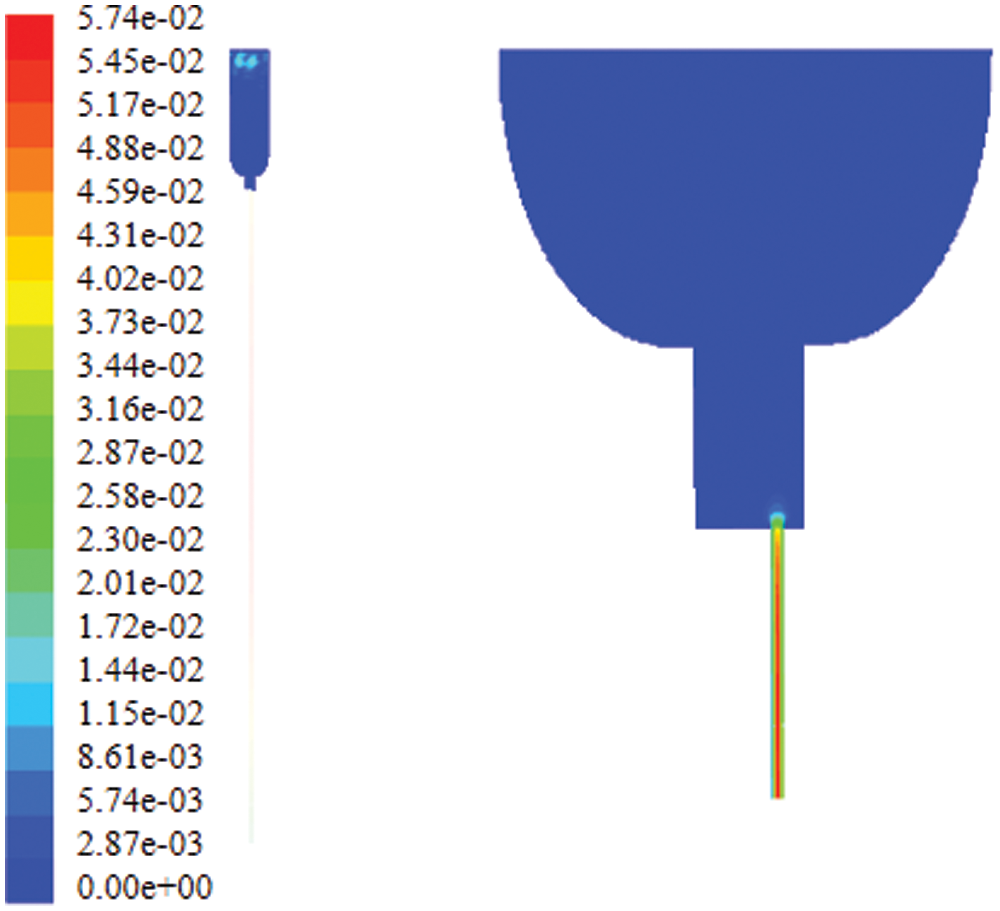
Figure 14: Contour of velocity of the infusion bag outlet
Fig. 15 shows contour of velocity of the infusion bag inlet. It can be seen that the speed of the fluid is maximum at needle axis, which is approximately 0.5 m/s, while the speed declines gradually to zero near the tube wall.
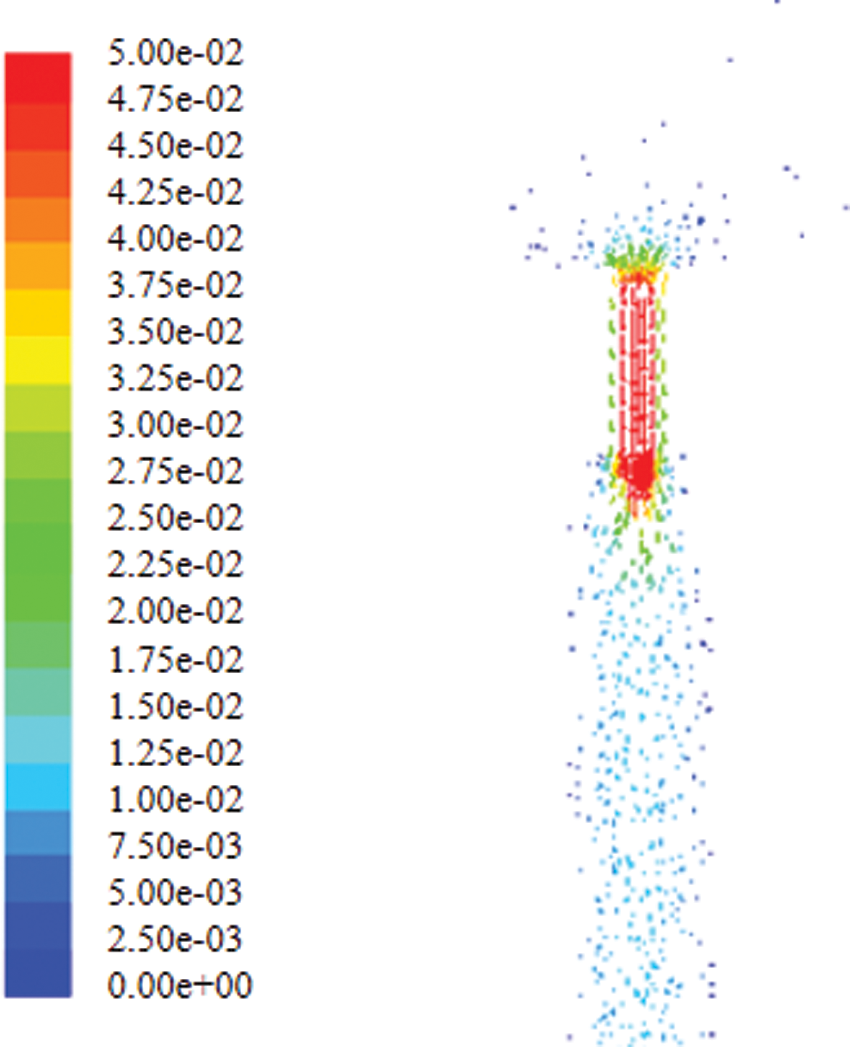
Figure 15: Contour of velocity of the infusion bag inlet
Fig. 16 shows the pressure distribution in the bag. It can be seen that the pressure increases with the increase of the height. This is because the height of tube is 1 m, and the pressure difference is the manifestation of static pressure. The outlet boundary condition is the pressure outlet and the pressure value is 2,500 Pa and the pressure difference between it and the negative pressure is the static pressure of 1 m, which is reasonable.
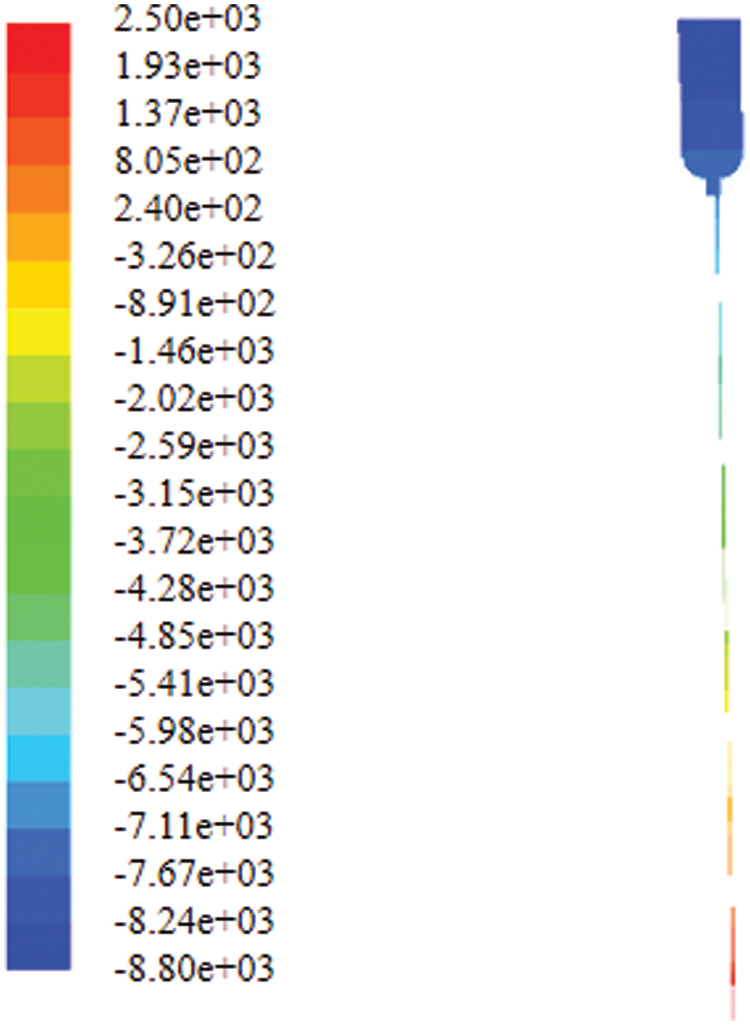
Figure 16: Contour of static pressure in the bottle
In the calculation process, a pressure measurement point P1 and a velocity measurement point P2 are respectively set, where P1 is located above the liquid inside the bottle (this point is always air), and P2 is the center point of the needle outlet section.
Fig. 17 shows pressure change at a distance of 20 mm from the top of the bag. As time goes by, the pressure in the bottle gradually decreases. As can be seen from Fig. 18, the pressure at P1 above the bottle was gradually decreasing linearly with time in the first 3 s. In about 1 s, the negative pressure reaches –2,993 Pa. This is caused by the increase in the air volume in the bottle as the decrease of the liquid level, which is consistent with the actual physical change.
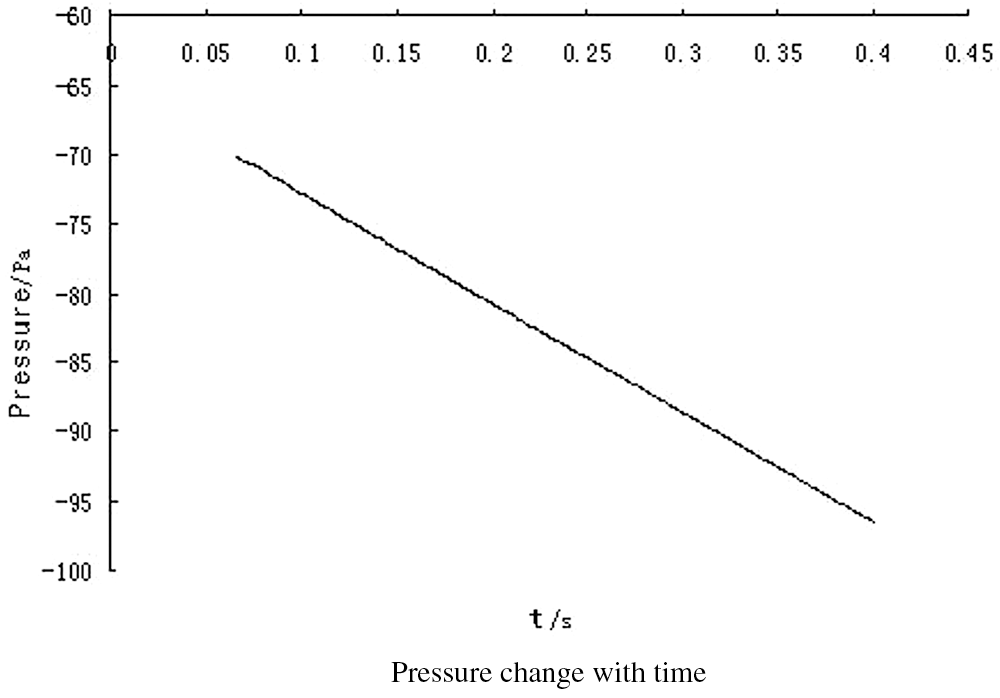
Figure 17: Pressure change with time
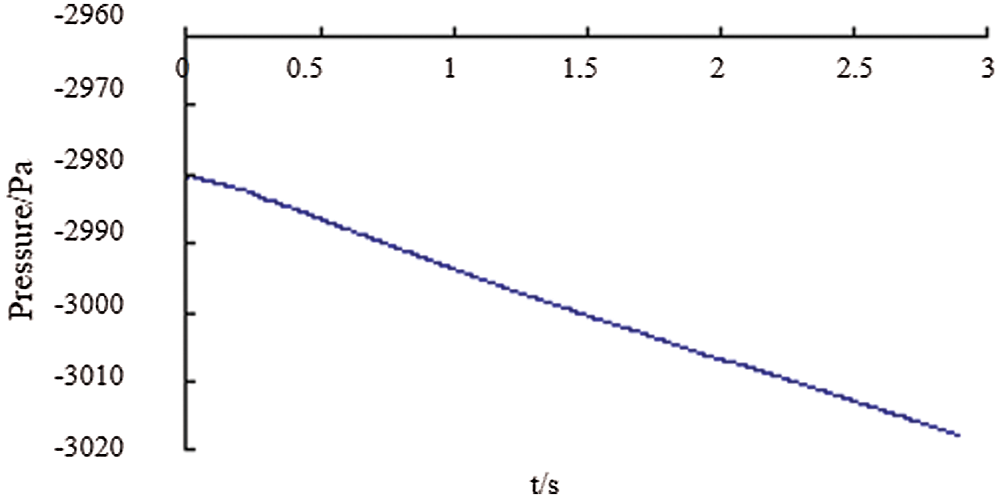
Figure 18: The pressure at P1 point with time
The outlet velocity curve at a distance of 20 mm from the top of the bag with time can be seen from Fig. 19, and Fig. 19(b) is the partial enlarged view of Fig. 19(a). It indicates that the speed fluctuates slightly at first and then gradually stabilizes.
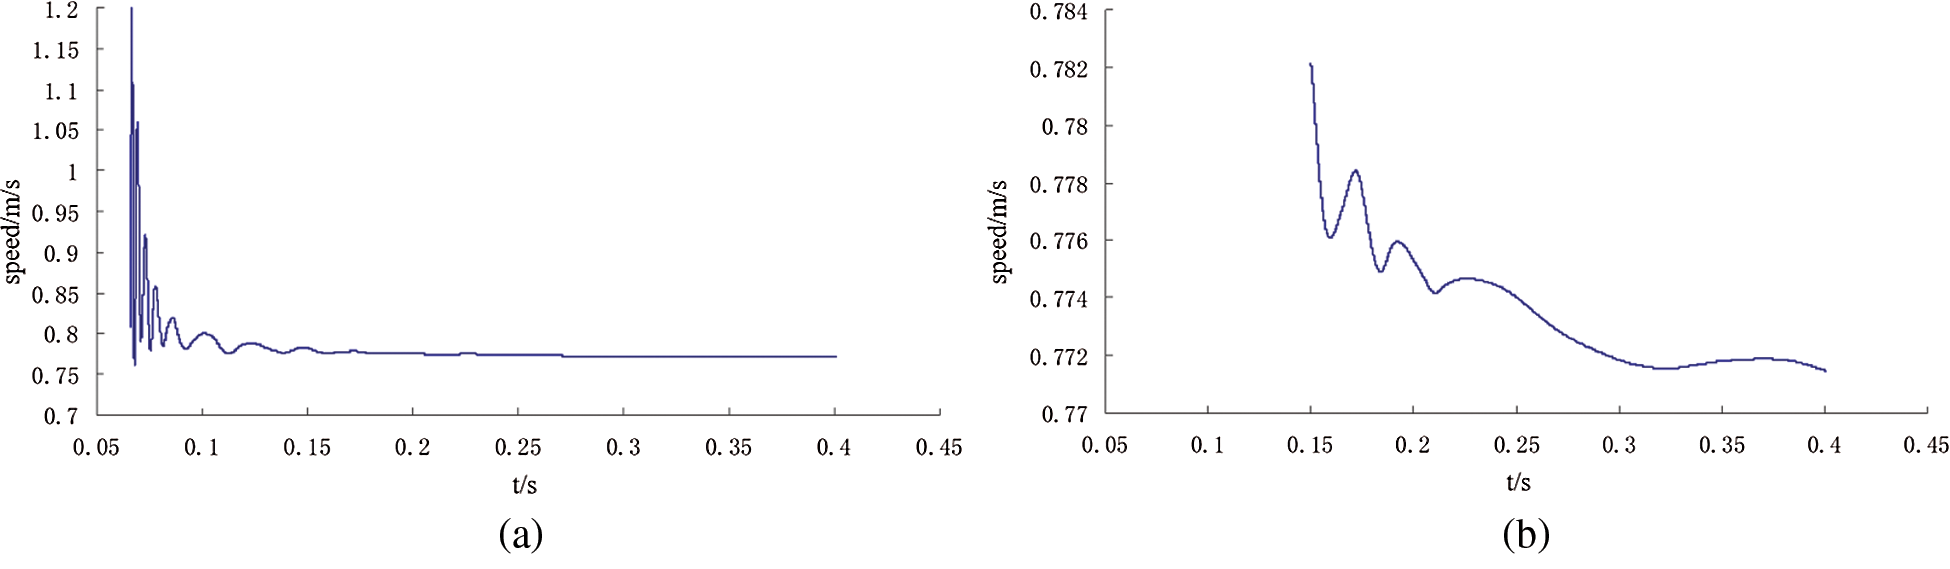
Figure 19: Outlet peed curve with time curve
It can be seen from Fig. 20(a) that except for the unstable in the first 0.5 s, the speed gradually tends to be stable and decreases with time. The speed value is 0.499 m/s at 1 s, 0.498 m/s at 2 s and 0.496 m/s at 3 s. Fig. 20(b) is a partial enlarged view of Fig. 20(a), from which the variation of the speed is more clearly.
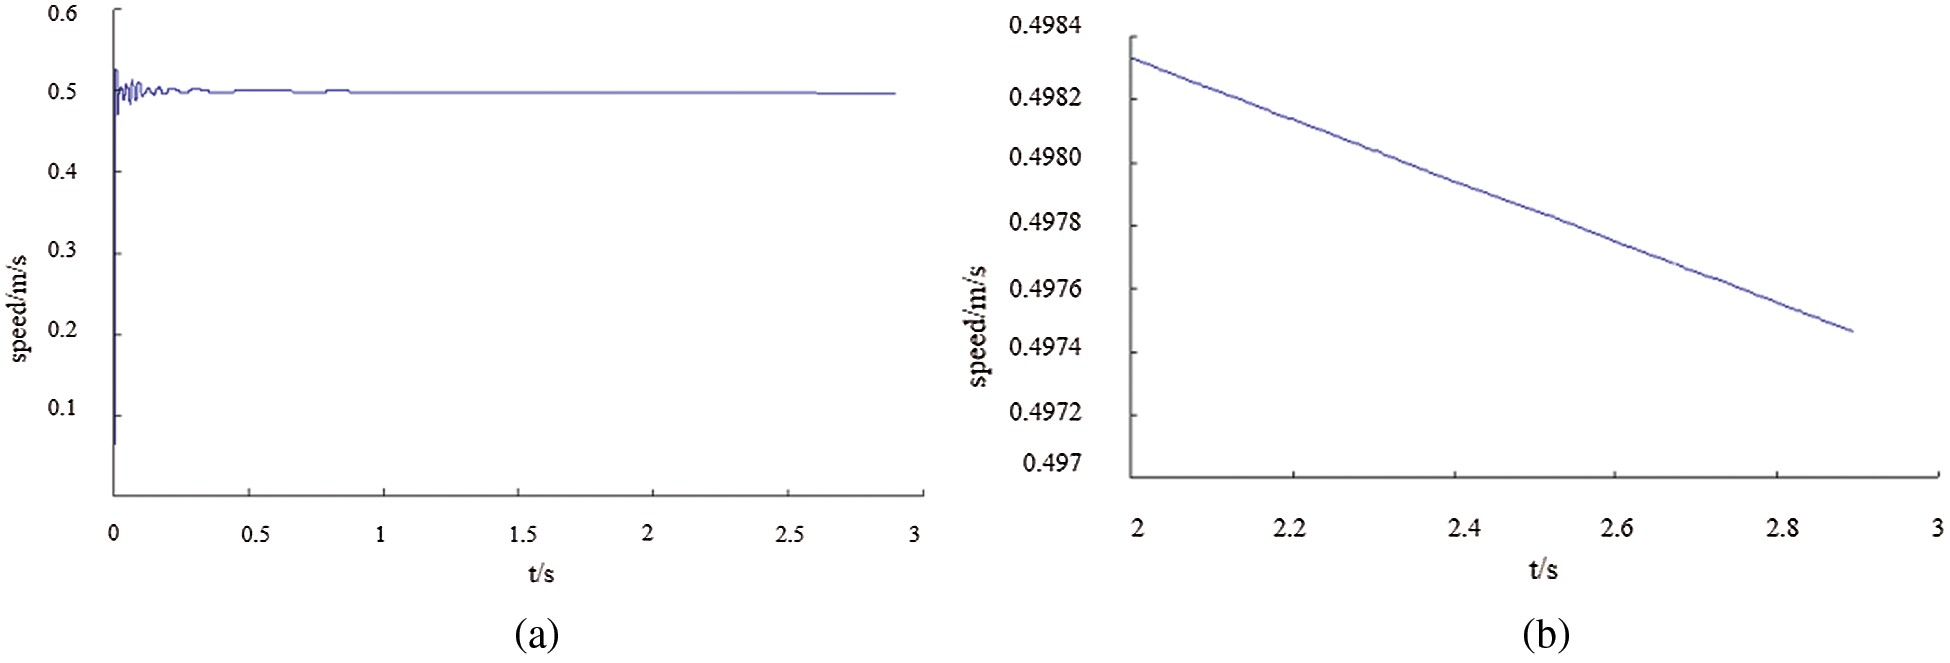
Figure 20: (a) Velocity of point P2 changes with time, (b) Speed change curve within 2–3 s
The previous part simulated the internal flow field of infusion bag during human intravenous infusion. However, some boundary conditions may be set inaccurately due to the deformation of infusion bag, leaving the simulation results be different from the actual data. In this paper, a simulated experimental device for human intravenous injection was implemented. Through experiments, a lot of data such as the pressure and droplet rate of infusion bag liquid during human intravenous injection were obtained. According to numerical analysis of the data, an accurate variation rule of the pressure and droplet rate in human intravenous infusion bag was implemented.
4.1 Human Intravenous Simulator
Human beings’ central venous pressure is normally 5 to 12 cm of water column, which is less than the peripheral venous pressure. In order to be safe and reliable, the static pressure of 24 cm was designed for the intravenous simulation device pressure which is twice the maximum normal value. If the total mechanical energy of the needle at the needle exit was always larger than the static pressure, the liquid would pass through the device smoothly, so that the infusion can be completed normally. Therefore, it is reasonable to judge whether there is a blood return by confirming if the liquid could flow out of the simulation device.
The entire infusion process test equipment included: a thickened clawed bag stopper with adjustable frame, multiple of disposable infusion sets, multiple medical infusion tubes (needle size is 0.5 mm), an infusion tube with small needle (for U-tube to measure pressure), stopwatch, paper, pen, tape.
The infusion bag test bench device was mainly composed of the infusion of soft bags, a Murphy tube, connecting hose and designed fixed frame. Infusion soft bag was fixed on the soft bag holder; one end of the Philippine tube was fixed on the frame with one end connected to the bottom of the tube and the other hanging on the liquid recovery box. One side of the hose was connected to the bottom of the infusion soft bag and the other side to the fixed frame. Both the main mark and the secondary bar were equipped with the scale marks; the main benchmark bar was installed on the main scale while the sub-bar was installed on the sub-standard in order to read the infusion of the soft bag level and the height of the hose level easily. The main scale and the sub-scale that could slide up and down to facilitate the liquid level descent height calibration were equipped with a guide sleeve fitted with fastening nut and a pointer, which will help to read the data.
In airtight infusion, with the liquid flowing out of the bag, the volume inside the bag was getting smaller and the bag started deforming gradually and the drip rate became slowly, there is a certain relationship between the output of liquid volume, pressure of infusion bag and the drop velocity. Because it was difficult to measure the volume of the output liquid and there was a part of the liquid remained in the tube, the mathematical model with the volume as an independent variable and drip as the dependent variable was inappropriate. Due to the height of the liquid drop can be observed without interrupting the experimental observation, the relationship between the height drop and the titer can be better observed by viewing the drop level of the liquid as an independent variable [19].
In the infusion process, the pressure inside the bag is real-time changing with the continuous flow of liquid. The conventional infusion device usually directly hangs the infusion bag at a certain height and the infusion was performed by inserting an infusion tube into the rubber stopper. Because there was no way to penetrate the internal measurement of pressure, the pressure changes cannot be measured by the infusion of soft bottles in the infusion process. In order to obtain real-time infusion process infusion bottle pressure and the pressure of the changing pattern, put forward a pressure measurement device, as shown in Fig. 21.
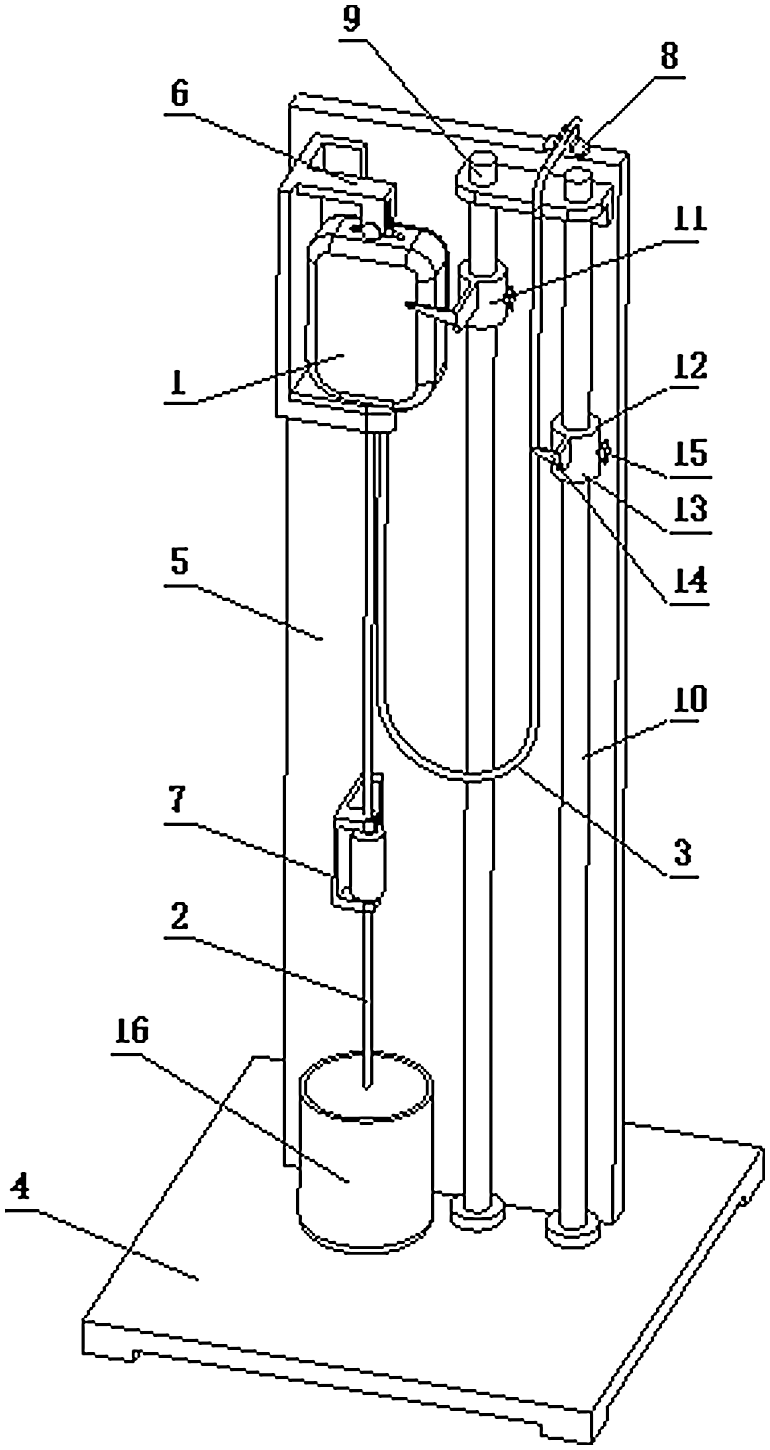
Figure 21: Infusion test bench device diagram. 1—Polypropylene infusion bag, 2—Murphy’s tube, 3—Connected hose, 4—Block, 5—Vinyl holder, 6—Fluoride retainer, 7—Murphy’s holder, 8—Hose holder, 9—Main benchmark, 10—Sub-bar, 11—Main scale, 12—Sub-scale, 13—Sleeve, 14—Pointer, 15—Fastening nut, 16—Liquid recovery box
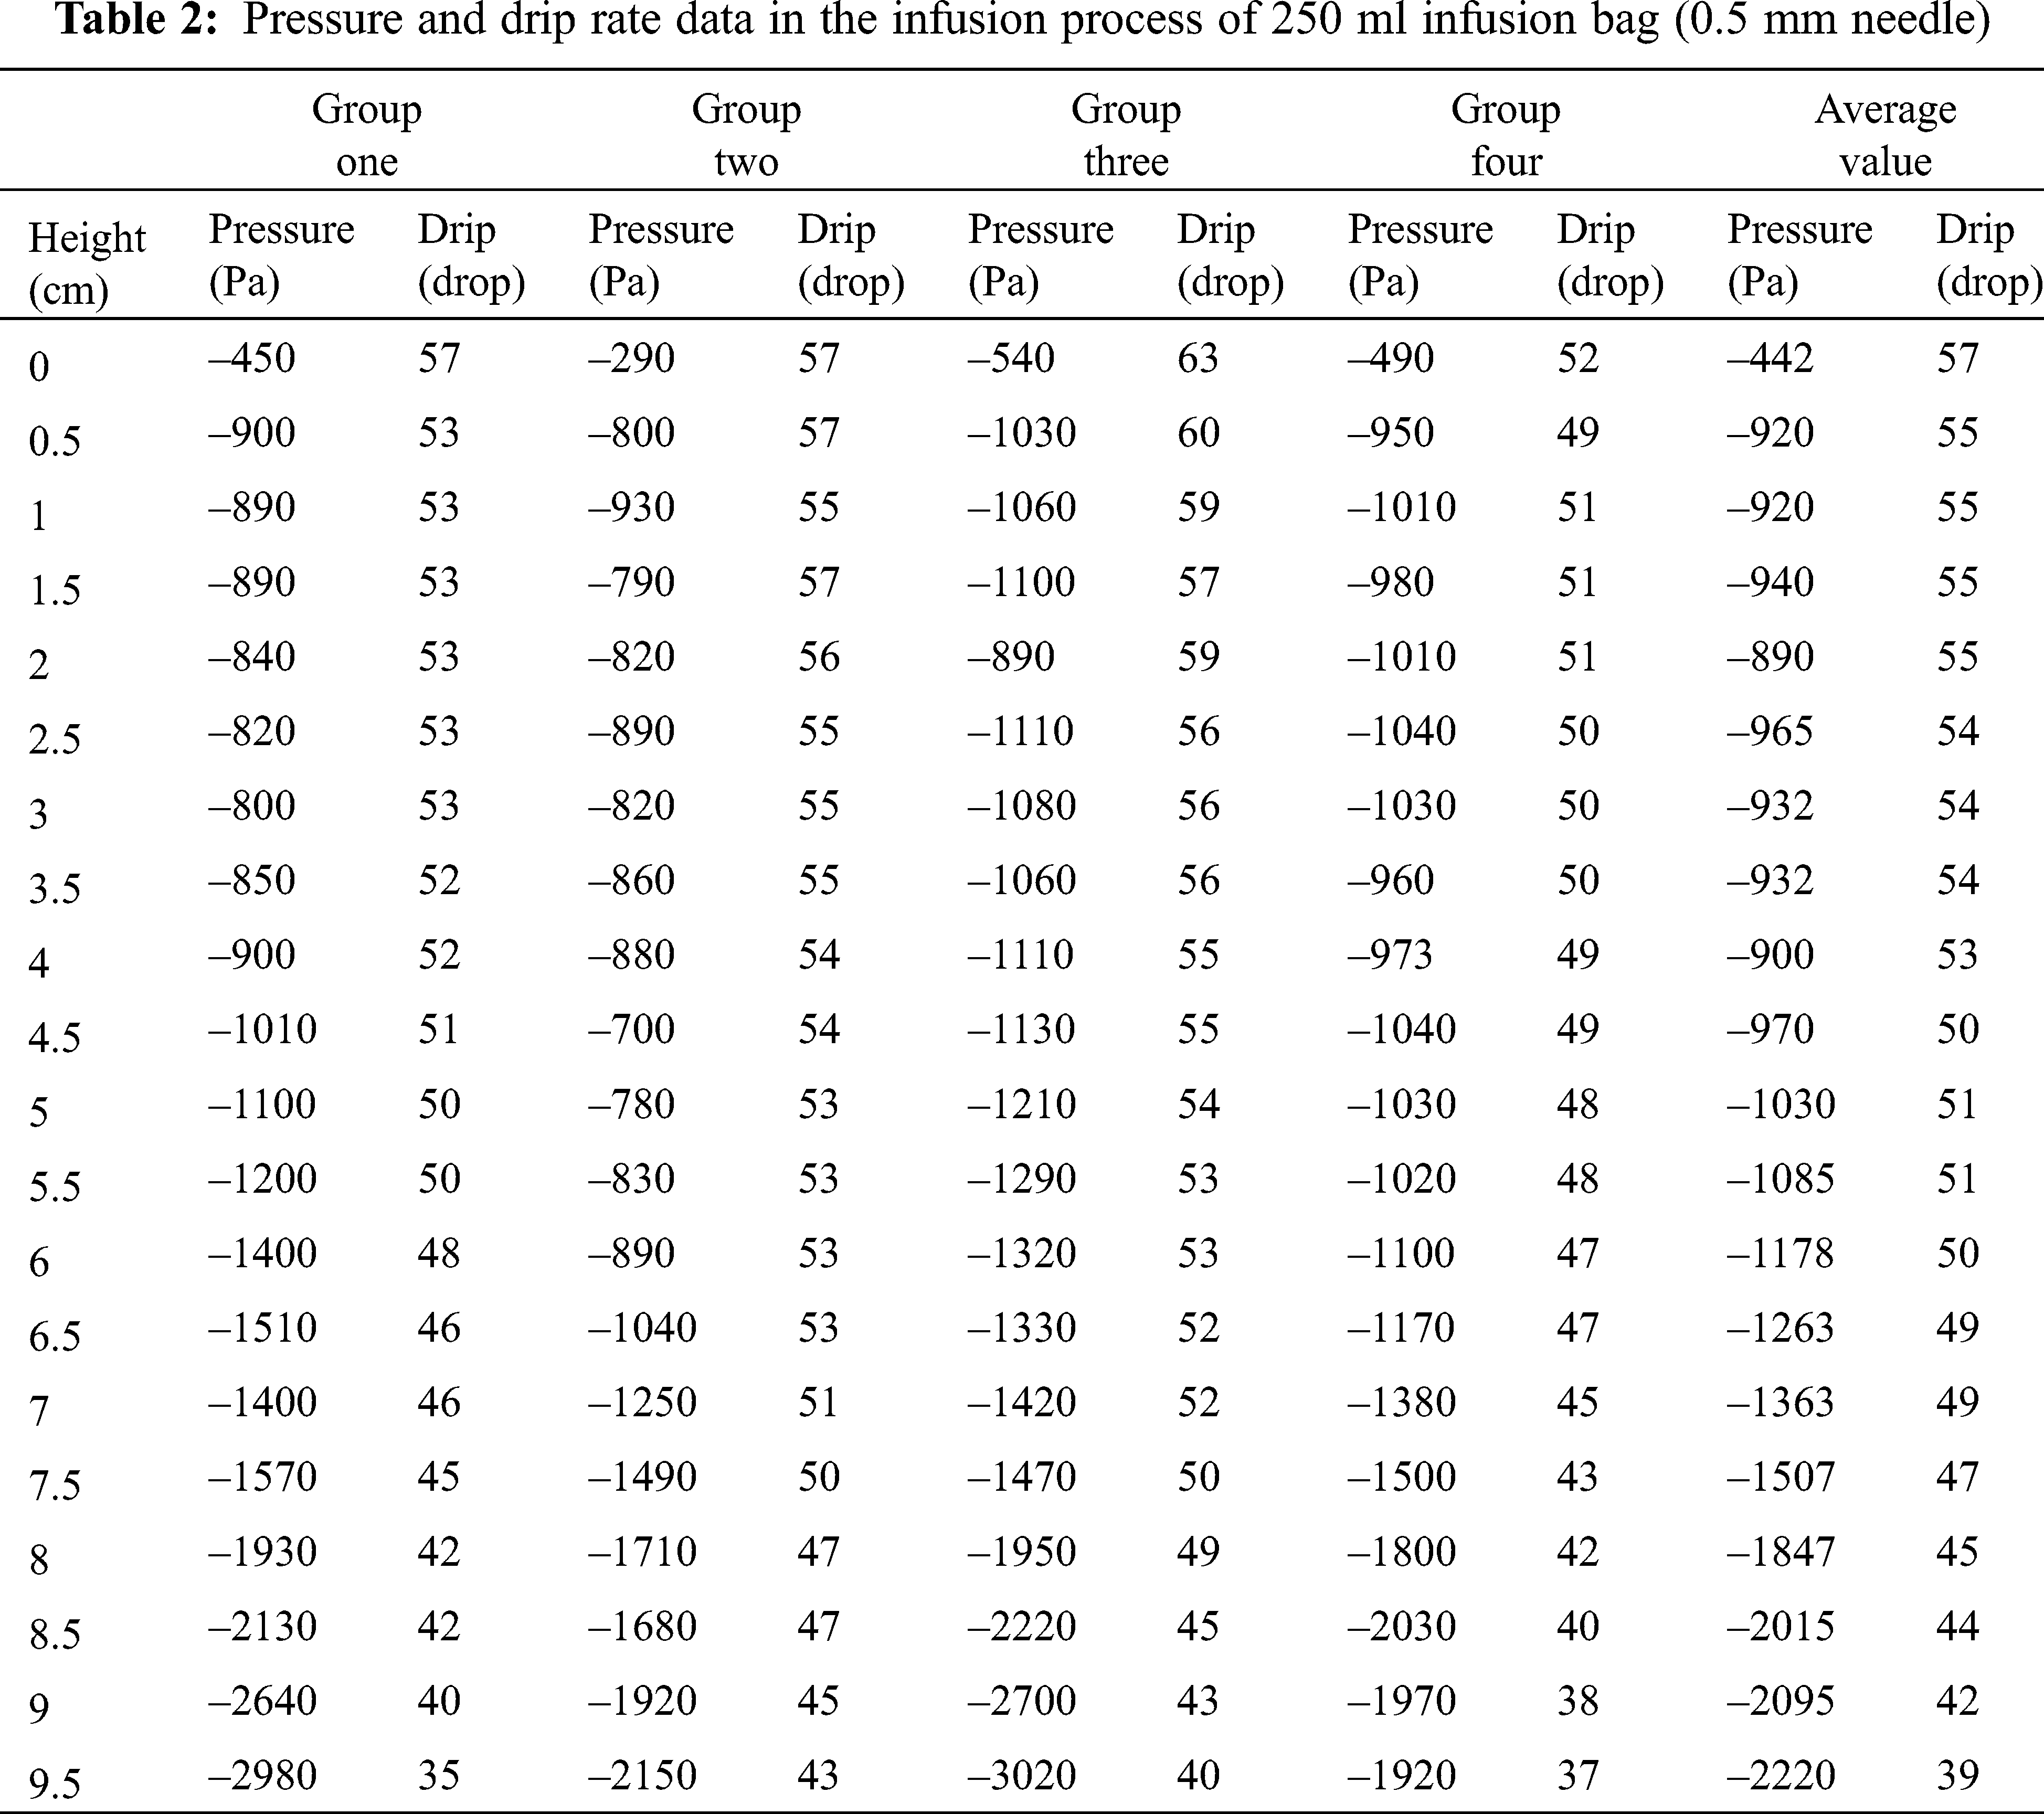
Dripping rate refers to the droplets in per unit time of the Murphy tube. In the initial state, the liquid level in the Murphy tube should not be higher than half of the height of the Murphy, which facilitated the statistical drip rate. Using cylinder to measure 100 drops, and calculating each drop’s volume, then converted into meters per second. Through the scale of the ruler that connected to infusion bag, the liquid declining level can be measured. The drip rate measurement was shown in Fig. 22. The principle of measuring the liquid height was shown in Fig. 23 and the measurement of the 0.55 mm needle was shown in Tab. 2.
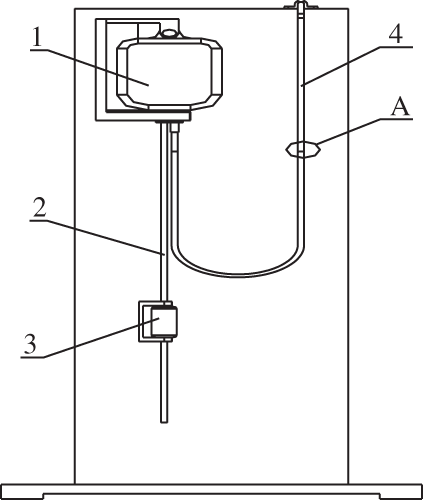
Figure 22: Schematic diagram of the pressure test device. 1—Polypropylene infusion bag; 2—infusion tube; 3—Murphy tube; 4—U-tube, A—liquid level
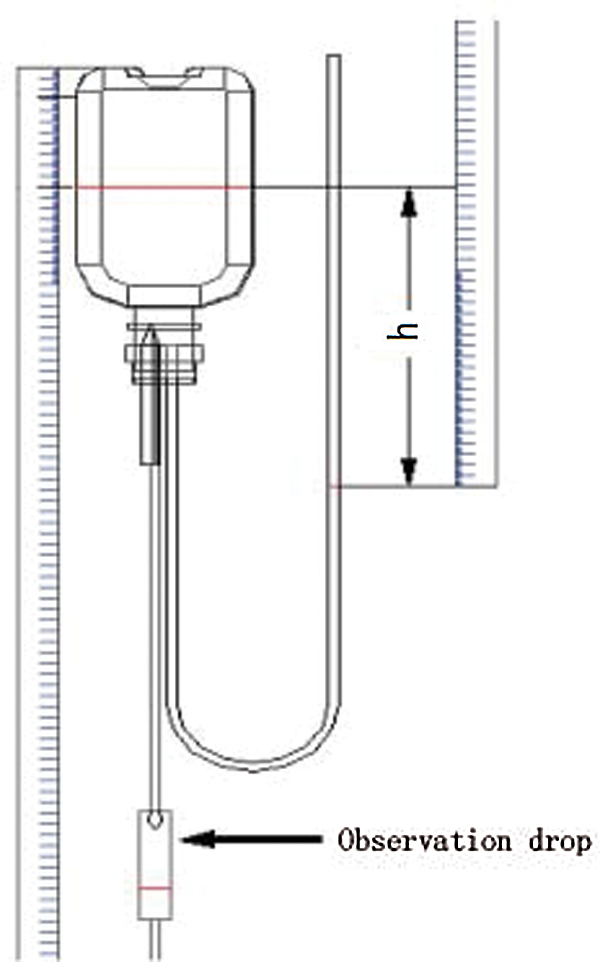
Figure 23: Schematic diagram of drip rate measurement
4.3 The Implementation of Mathematical Model
After the implementation of an experimental platform, according to the above description, the device was used to measure the droplet velocity. An infusion experience was made with the specification of 250 ml to detect the variation of droplet velocity and the liquid drop height in unit time. The relationship between the droplet velocity and liquid drop height in the tube was observed. With 8–10 groups of experiment, the most interfering factors were removed, and the remaining four groups were averaged. An experimental model of pressure in different volumes of bags between the droplet velocity and the drop height was conducted by means of numeric analysis to conclude the law of drip velocity. The data of droplet velocity can be seen in Tab. 2. The surface drop height value h, pressure P and the drip value V measured in above experiment were input into the MATLAB [20] software for analyzing the obtaining of the change curve and the function formula of drop rate as well as the height when the liquid dropped to h; the coefficients of the fitted curve was gained with least square fitting of a polynomial. Finally, the quartic mathematical model was implemented [21].
The function formulas between droplet velocity or pressure in the infusion process and the liquid surface are as following Eqs. (6) and (7) show:
h is dropping height, V is droplet velocity, P is pressure in soft bags.
The formal Eqs. (8) and (9) were obtained by least squares polynomial fitting:
The coefficients p1, p2, p3, p4, p5 and b0, b1, b2, b3 can be obtained by solving the above-mentioned normal equations.
MATLAB was applied to build the mathematical model between the 250 ml polypropylene infusion bag droplet velocity, pressure and liquid level:
(1) The level of drop heights, pressure values and drop rate values were put into MATLAB software:
Height:
Drip:
Pressure:
(2) The correct function was selected to guarantee the corresponding point on the function image as much as possible. So the formula for the 4 power function of velocity and liquid drop height is as the following:
And the cubic function of pressure and liquid drop height is as the following:
(3) The functions are output to obtain the mathematical relationship of the height drop change, which are as the following:
4.4 Effect of Needle Diameter on Droplet Velocity
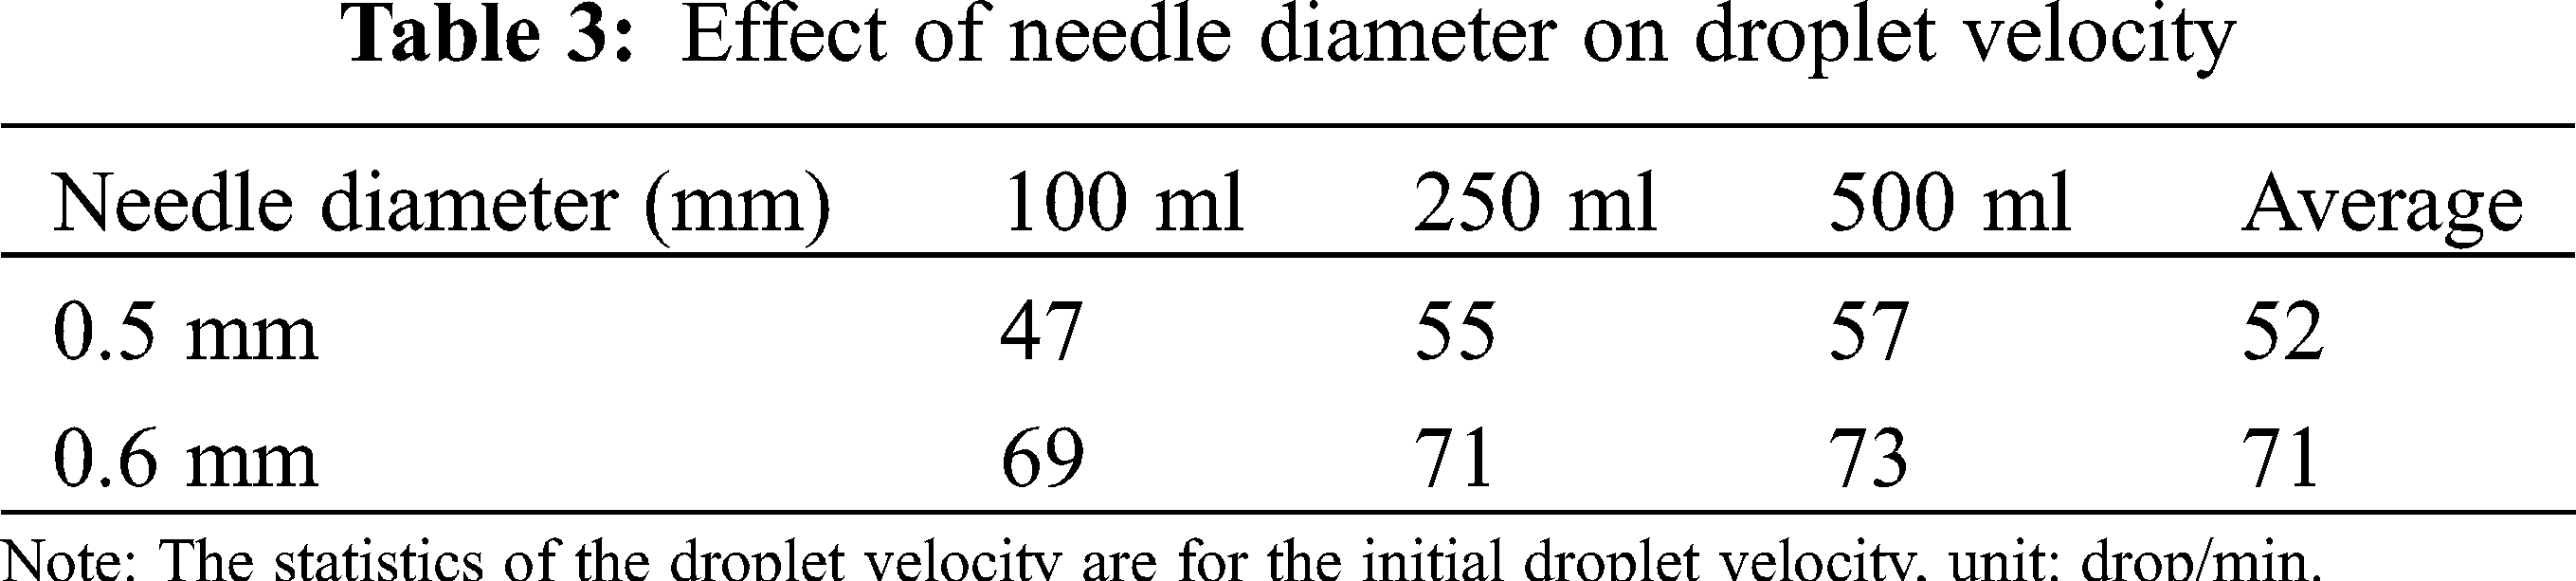
At the beginning of the experiment, the same infusion tube was used in the first several groups until that the initial droplet velocity was found diverse. Because the needle diameter was so small that long glucose infusion will leave the glucose crystal remain in the needle diameter, leading to various experimental data. Therefore, new tubes should be replaced every time. There are various factors that can impact the droplet velocity such as the hanging height, level height, material, structure, deformation of infusion bag and the pipeline loss along infusion process, but according to the experimental analysis, the most influential factor is the needle diameter, which is the needle local piping loss.
It can be seen from Tab. 3, in the range of the errors permitted, when the needle diameter was same, the droplet velocity increased with the increase of the infusion bag capacity; for the same specifications of the infusion bag, while the needle diameter increases, drip significantly changes with the increase in the diameter of the needle. Therefore, the relationship between needle diameter capacity and droplet velocity will be concluded from Tab. 3.
With the development of medicine, sealing and economy, the applicability of medicines’ storage containers have become higher and higher, and the vertical infusion bags have been put on the medical stage. Therefore, the analysis of the vertical infusion bag has become the focus of many scholars and drives them to conduct more researches on the thickness profile of the vertical infusion bag. Under the condition of meeting the required drip rate, there is a lack of research on optimal control of the gas-liquid ratio in the bottle. Certain pharmaceutical companies also companies are manual controlling the gas-ratio, so that some medicine bottles are not used up. Therefore, through the model analysis and the flow field analysis of the vertical infusion bag, the gas-liquid ratio in the vertical infusion bag can be simulated, which can effectively achieve the energy-saving effects and effectively reduce its unusable volume. The possibility of pre-simulation makes it easy to provide pharmaceutical companies with certain reliable data and put them into use. The fully enclosed infusion has been proven effectively in avoiding contamination of infusions by bacterial, viruses, and dust in the air, improving the safety and effectiveness of infusion, and gradually becoming the mainstream of the infusion industry [22,23].
There are a large number of researches and practical application cases on the vertical polypropylene infusion bag. For example, Liu Gexin, a bioengineering and clinical researcher, proposed that the wall thickness of the infusion bag could affect the infusion performance. The contour of Von Mises stress distribution showed that under the same capacity condition and VON Mises stress change, the Von Mises stress changes insignificantly when the wall thickness of 500 mL bag is 0.2 mm and 0.3 mm. When the wall thickness is 0.3 mm and 0.5 mm, the maximum Von Mises stress reduces by 28%. The maximum Von Mises stress area of each bag is on the side wall of the bag. The actual dosing space has a relationship with the thickness of the vertical infusion bag wall. The wall thickness of the 100 ml bag type is from 0.2 mm to 0.5 mm, and the actual dosing space is reduced by 27%, respectively. The actual dosing space of the 250 mL and 500 mL bags is reduced by 54% and 49%, respectively. The greater the wall thickness is, the larger the actual dosing space of the vertical infusion bag. The wall thickness also has a certain influence on the emptying rate. The vertical infusion bag indicates that when the wall thickness of the bag becomes from 0.2 mm to 0.5 mm, the emptying rate is 11%. Under the same wall thickness, the emptying rate of high-standard volume vertical infusion bag is significantly higher than that of low-standard one [24,25]. The final determination of the wall thickness also needs to consider factors such as the air permeability, moisture permeability and puncture resistance of the vertical infusion bag. Liu Gexin and other bioengineering and clinical researchers did not consider it.
Wang Huasheng explained in the Chinese Journal of Infectious Diseases that the fully closed infusion method used the pressure of atmospheric pressure to directly act on the wall of the bag. The bag body shrank automatically to allow the liquid enter the human body by itself, avoiding the contact between the infusion and the air, and preventing the contamination of the infusion by bacteria, viruses, and dust in the air. The vertical polypropylene infusion bag had almost no adsorption on insulin nitroglycerin and paclitaxel, which ensured that the infusion was safe and effective.
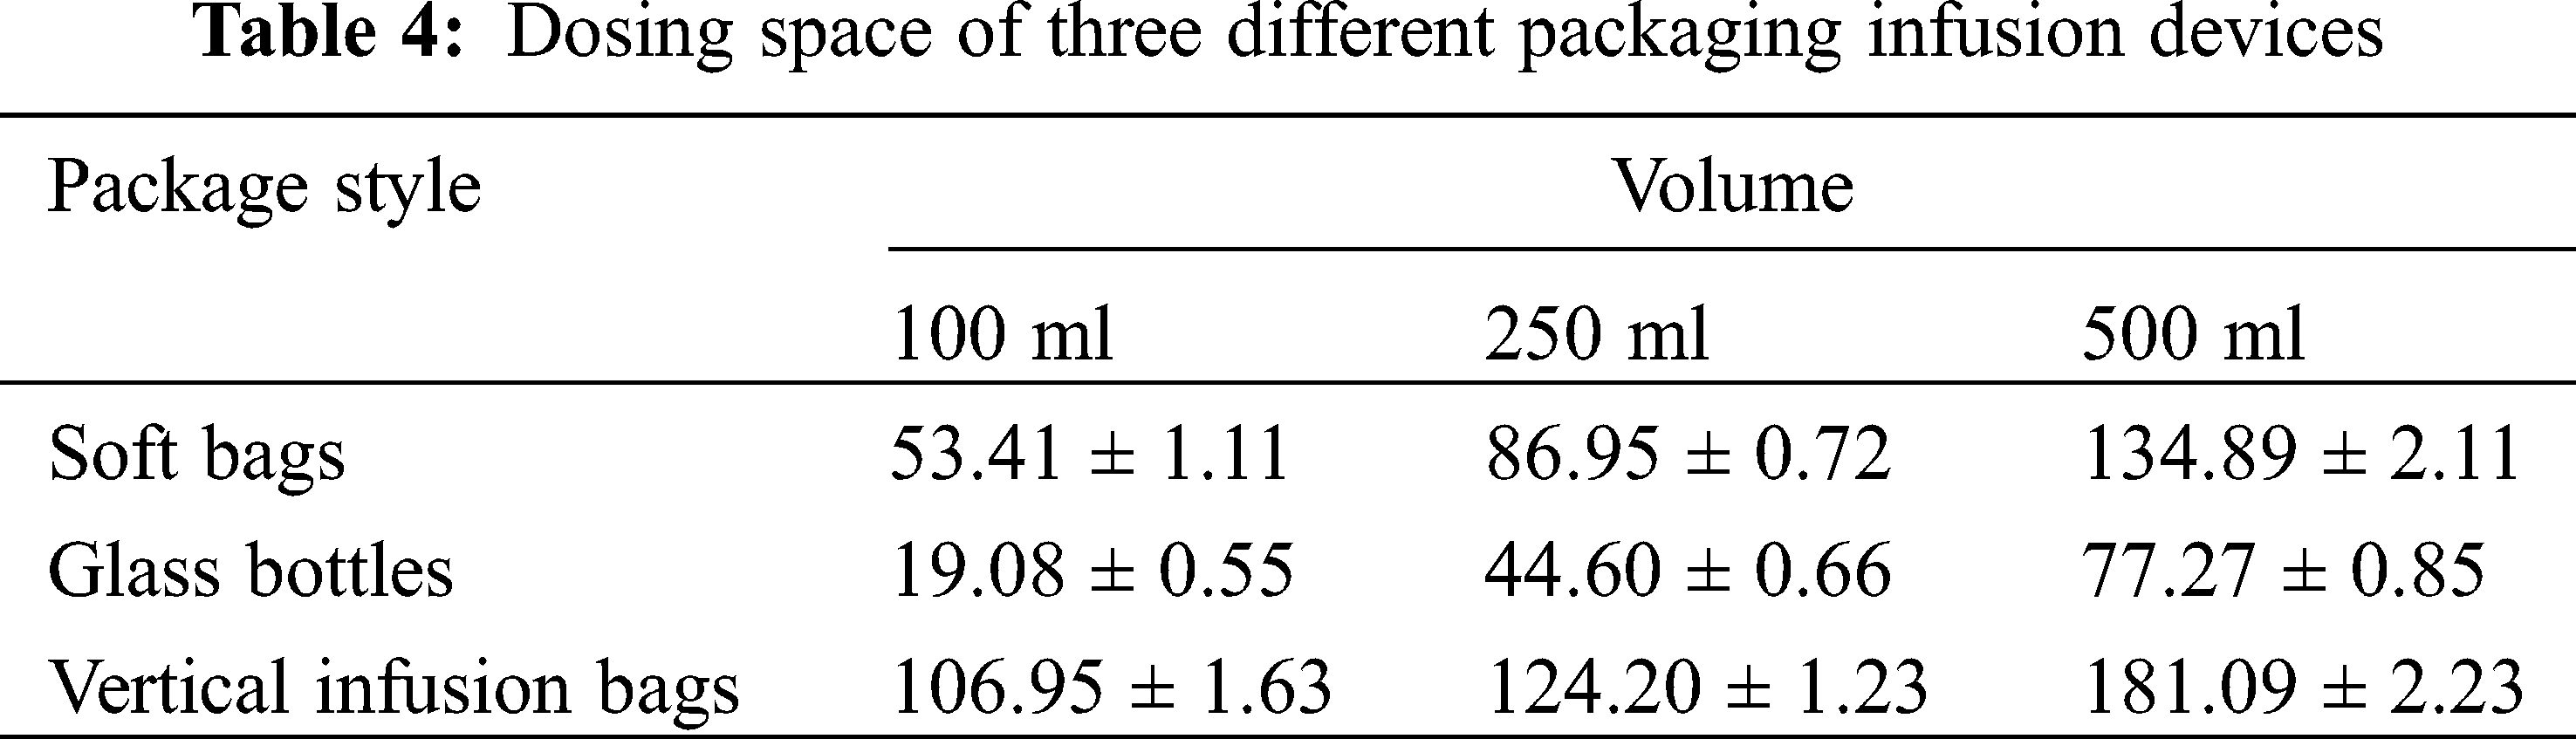
Chen Wei, from the Department of Pharmacy, Tongji Hospital affiliated to Huazhong University of Science and Technology, examined the clinical performance of the vertical polypropylene infusion bag, and explained the vertical polypropylene infusion bag was completely transparent and had a high light transmittance which was convenient for clinical inspection to ensure the safety of medication. The maximum dosing space was greatly increased, which was convenient for clinical use [26]. The maximum dosing space of different infusion devices was different, the maximum dosing space of the vertical polypropylene infusion bag is the largest, the maximum dosing space of the soft bag is second and the maximum dosing space of the glass bottle is the smallest. The different packages of each infusion specification are compared in Tab. 4, and the difference is statistically significant.
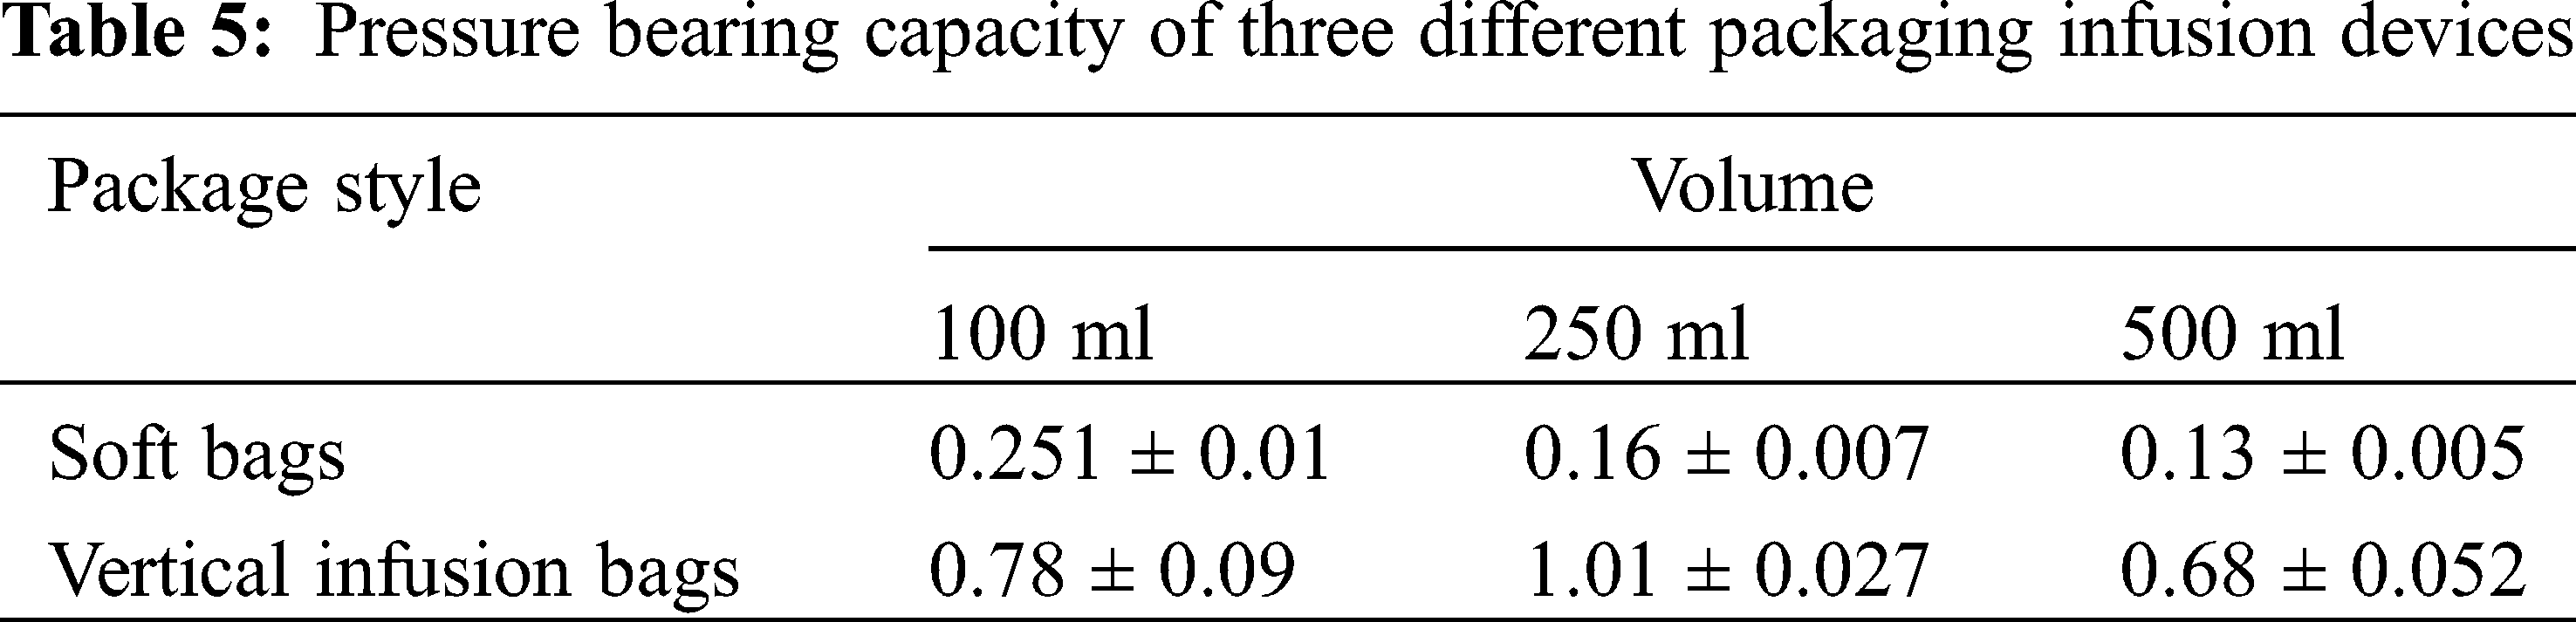
The vertical infusion bag is especially convenient to add large-volume traditional Chinese medicine injections; its packing material is extremely flexible to withstand temperature changes, and can withstand a high maximum pressure, which is convenient for transportation and storage. The material of the infusion bag can be upright like a glass bottle, which is in line with the clinical operation habits of nursing staff and improves the work efficiency. The vertical polypropylene infusion bag integrates all the advantages of glass bottles, plastic bottle, and non-soft bags and it has extremely high clinical value. Compared with soft bags, the maximum pressure that the vertical polypropylene infusion bag can withstand is significantly higher. Pressure bearing capacity of three different packaging infusion devices are compared in Tab. 5, and the difference is statistically significant.
The quality of the vertical polypropylene infusion bag was investigated in the Journal of Hunan University of Traditional Chinese Medicine. Taking the vertical polypropylene infusion bag as the research object, comparing the multi-layer co-extruded infusion bag and the polypropylene infusion bottle, the light transmittance, adaptability, and adsorption of them were studied. Among them, the vertical polypropylene infusion bag and the polypropylene infusion bottle are mainly made of polypropylene; the material of the multi-layer co-extruded infusion bag is composed of polyethylene, polyamine, and polypropylene. In clinical applications, polypropylene infusion bottles, like glass infusion bottles, are semi-open infusion containers, and vertical polypropylene infusion bags and multi-layer co-extruded infusion bags are fully enclosed infusion containers. In the light transmittance test, the vertical polypropylene infusion bag, the multi-layer co-extruded infusion bag and the polypropylene infusion bottle were detected by an ultraviolet spectrophotometer. It is generally believed that the transmittance of the vertical polypropylene infusion bags and the multi-layer co-extruded infusion bags is greater than 75.0%, and the test samples are of good quality, all of which are higher than the standard. The average transmittance of the three was (95.20 ± 0.55)%, (91.96 ± 0.84)%, and (93.78 ± 0.37)% (P < 0.05). The transmittance of the vertical polypropylene infusion bags is better than that of the multi-layer co-extruded infusion bags. Comparing the multi-layer co-extruded infusion bags and the polypropylene infusion bottles, the light transmittance, adaptability and adsorption of them were investigated. The vertical polypropylene infusion bag is a new type of patented infusion packaging container. Compared with the multi-layer co-extruded infusion bag, it is not easy to be broken and easy to transport; it has good transparency, small deformation, and good adaptability; its material is chemically stable and is suitable for drugs; it can be placed upright, which is in line with operating habits. In addition, compared with the polypropylene infusion bottle, it does not need to introduce air during use, effectively avoiding secondary pollution [27–30].
1. According to the principle of fluid mechanics, the theoretical exhaust pressure at the end of the drip rate of 40 drops/min was –2,640 Pa.
2. The results simulated by CFD showed the maximum speed inside the needle was at the position of axis, approximately 0.5 m/s, and the speed near the wall gradually decreased to zero. However, from the actual situation, the material of the infusion bag and the deformation of the force also have an effect on the drip rate. The necessary coupling analysis of these parameters can make the graphics and data more comprehensive and accurate.
3. A human blood vessel vein simulator and measuring devices were used to obtain relevant data about pressure and drop rate. The least squares method and MATLAB software were used to simulate the relation of inside pressure, fluid speed and liquid height. The inside pressure and liquid height were in the cubic function relation while the drop rate and the liquid height were in the quadric function relation.
4. Through the experiments, it could be concluded that the needle diameter was one of the most effective factors among all influencing factors. However, the force analysis of the infusion bag has not been carried out by ANSYS software. If the analysis by ANYSY software is combined with experiments and simulations, the transient changes of the infusion process can be better reflected, the data can be more accurate, and the simulation results can be more convincing.
Funding Statement: This article belongs to the project of “The University Synergy Innovation Program of Anhui Province (GXXT-2019-004)”; “Teaching Research Project of Anhui Education Department (2019jyxm0229)”.
Conflicts of Interest: The authors declare that they have no conflicts of interest to report regarding the present study.
1. Liu, G. H. (2009). Factors affecting the infusion rate and its adjustment method. Nursing Practice and Research, 6(1), 88–90. [Google Scholar]
2. Kinna, S., Jayshree, T., Dushyant, V. (2020). Comparison of glottis views with fixed-height pillow vs. adjustable-pillow height by pressure infusion bag for successful intubation. Bali Journal of Anesthesiology, 4(2), 35. [Google Scholar]
3. Ranjana, B., Jyoti, P., Anurag, K. (2019). Pharmacokinetic-pharmacodynamic (PK-PD) modelling of effect of naringenin & its surface modified nanocarriers on associated & core behaviours of autism spectrum disorders (ASD). Planta Medica International Open, 6(2), e41–e49. [Google Scholar]
4. Matey, J. M., Moreno de Simon, M. D., García-Ruiz, C., Montalvo, G. (2019). A validated GC-MS method for ketamine and norketamine in hair and its use in authentic cases. Forensic Science International, 301, 447–454. [Google Scholar]
5. Chen, X., Min, L. H. (2020). Design and application of a new type of double-headed infusion set. Chinese Clinical Nursing, 12(1), 92. [Google Scholar]
6. Darás Orenga, M. Á., Gellida Vilarroig, M., Vives Piqueres, L., Sanz García, M., Inoges, R. T. et al. (2019). Comparative study of different epidural infusion sets at maximum speeds for labor analgesia. Revista Española de Anestesiología y Reanimación, 67(4), 179–186. [Google Scholar]
7. Liang, Y. Y., Wu, J. T., Lan, Y. N., Lan, Q. (2012). Application of pressurized infusion bag in pediatric cardiac arrest fluid infusion. Nursing Practice and Research, 9(19), 46–47. [Google Scholar]
8. Song, Z. F. (2010). Intravenous infusion rate rapid determination method. Chinese Journal of Traumatology, 18(2), 126. [Google Scholar]
9. Xiao, Z., Liu, J. S., Wang, L., Zhang, T. N. (2011). Design and implementation of real-time monitoring system for infusion drip rate. Studies, 26(11), 19–21. [Google Scholar]
10. Wang, G. S. (2019). Fluid-structure coupling simulation and experimental verification of compression process of multi-chamber infusion soft bag. Journal of Medical Biomechanics, 34(S1), 183. [Google Scholar]
11. Long, T. Y., Cai, Z. J. (2019). Fluid mechanics. Beijing: China Architecture & Building Press. [Google Scholar]
12. Zhao, H. W., Chen, Y. H., Liu, X. G. (2019). Optimization of the heat dissipation structure and temperature distribution in an electric vehicle power battery. Fluid Dynamics & Materials Processing, 15(4), 293–305. DOI 10.32604/fdmp.2019.08361. [Google Scholar] [CrossRef]
13. Du, J., Wu, X., Li, R. N., Cheng, R. R. (2019). Numerical simulation and optimization of a mid-temperature heat pipe exchanger. Fluid Dynamics & Materials Processing, 15(4), 293–305. DOI 10.32604/fdmp.2019.08361. [Google Scholar] [CrossRef]
14. Fang, J., Wang, L., Hong, Y., Zhao, J. D. (2021). Influence of solid-fluid interaction on impact dynamics against rigid barrier: CFD-DEM modelling. Géotechnique, 1–16. [Google Scholar]
15. Alekseeenko, V. V., Yashchenko, V. P., Sukhanova, K. M., Shestakov, A. N. (2021). Determination of elasticity modulus of flexible reinforced PVC hoses material at temperature change based on experimental studies and finite element modeling. IOP Conference Series: Earth and Environmental Science, 751(1), 012071. [Google Scholar]
16. Guo, H., Zhou, Y., Li, Y., Zhang, Z., Li, H. (2021). An experiment-based simplified method for the model of building groups in CFD simulation. Advances in Civil Engineering, 1–13. [Google Scholar]
17. Yu, D. L., Zhang, H. L., Zeng, X., Liao, D. H., Wu, N. X. (2021). Influence of nozzle orifice shape on the atomization process of Si3N4 in a dry granulation process. Fluid Dynamics & Materials Processing, 17(3), 569–586. DOI 10.32604/fdmp.2021.014711. [Google Scholar] [CrossRef]
18. Tawfiq, C. (2019). Droplet breakup regime in a cross-junction device with lateral obstacles. Fluid Dynamics & Materials Processing, 15(5), 545–555. DOI 10.32604/fdmp.2019.01793. [Google Scholar] [CrossRef]
19. Philipp, E., Braitsch, M., Bichsel, T., Mühlebach, S. (2016). Diluting ferric carboxymaltose in sodium chloride infusion solution (0.9% w/v) in polypropylene bottles and bags: Effects on chemical stability. European Journal of Hospital Pharmacy–Science and Practice, 23(1), 22–27. [Google Scholar]
20. Chen, P. X., Huang, K., Wang, F. H., Xie, W. J., Wei, S. et al. (2019). Simulation of heat and mass transfer in a grain pile on the basis of a 2D irregular pore network. Fluid Dynamics & Materials Processing, 15(4), 367–389. DOI 10.32604/fdmp.2019.07762. [Google Scholar] [CrossRef]
21. Cai, G. C. (2019). Modern numerical analysis. Beijing: Science Press. [Google Scholar]
22. Carly, W., Dominic, F., Galal, H. G., Ann, B., Bryony, D. F. (2020). Patients’ perspectives on the quality and safety of intravenous infusions: A qualitative study. Journal of Patient Experience, 7(3), 380–385. [Google Scholar]
23. Zeng, F. Q. C. (2019). Discussion on the clinical effect of nursing safety management on reducing the risk of intravenous infusion. The Medical Forum, 23(9), 1301–1302. [Google Scholar]
24. Le, G. G., Vieillard, V., Mouraud, S., Do, B., Marabelle, A. et al. (2020). Stability of nivolumab in its original vials after opening and handing in normal saline bag for intravenous infusion. European Journal of Cancer, 135, 192–202. [Google Scholar]
25. Chambers, D. J. (2018). Principles of intravenous drug infusion. Anaesthesia & Intensive Care Medicine, 20(1), 61–64. [Google Scholar]
26. Liu, X. H., Cheng, Z. P., Chen, D. G. (2013). The influence of wall thickness of vertical polypropylene infusion bag on infusion performance. Bioengineering and Clinical, 9(2), 3–6. [Google Scholar]
27. Maxime, P., Bertrand, D., Wadih, A. C., Brigitte, N., Laurent, S. et al. (2018). Effectiveness of in-line filters to completely remove particulate contamination during a pediatric multidrug infusion protocol. Scientific Reports, 8(1), 1–8. [Google Scholar]
28. Marzie, F., Abdolreza, M., Vahid, V. (2021). Influence of solvent type on the ability and properties of the boehmite nanoparticles embedded emulsion polyvinyl chloride nanocomposite ultrafiltration membranes. Iranian Polymer Journal, 1–15. [Google Scholar]
29. Jain, D., Bhagat, H., Jain, D. (2020). Effect of intravenous lignocaine infusion on the quality of emergence in patients undergoing transsphenoidal resection of pituitary tumors—A prospective, randomized controlled trial. Surgical Neurology International, 11. [Google Scholar]
30. Lv, J., Zhang, M. L., Liu, H. Y., Wang, Y., Ma, Y. F. (2018). Study on the influence of reserved air volume in Non-PVC double valve soft bag on the quality of intravenous infusion. Journal of Nurses Training, 33(17), 1614–1616. [Google Scholar]
 | This work is licensed under a Creative Commons Attribution 4.0 International License, which permits unrestricted use, distribution, and reproduction in any medium, provided the original work is properly cited. |