| Fluid Dynamics & Materials Processing |
DOI: 10.32604/fdmp.2021.015779
ARTICLE
A Numerical Study on the Extinguishing Performances of High-Pressure Water Mist on Power-Transformer Fires for Different Flow Rates and Particle Velocities
1State Grid Henan Electric Power Company, Zhengzhou, 450018, China
2State Grid Henan Electric Power Company Maintenance Company, Zhengzhou, 450000, China
3Zhengzhou Key Laboratory of Electric Power Fire Safety, Zhengzhou, 450001, China
4State Grid Henan Electric Power Research Institute, Zhengzhou, 450052, China
5School of Building Environment Engineering, Zhengzhou University of Light Industry, Zhengzhou, 450001, China
*Corresponding Author: Haowei Yao. Email: yaohaowei@zzuli.edu.cn
Received: 20 January 2021; Accepted: 20 April 2021
Abstract: In order to study the extinguishing performance of high-pressure-water-mist-based systems on the fires originating from power transformers the PyroSim software is used. Different particle velocities and flow rates are considered. The evolution laws of temperature around transformer, flue gas concentration and upper layer temperature of flue gas are analyzed under different boundary conditions. It is shown that the higher the particle velocity is, the lower the smoke concentration is, the better the cooling effect on the upper layer temperature of flue gas layer is, the larger the flow rate is and the better the cooling effect is.
Keywords: High-pressure water mist; transformer fire; particle velocity; smoke concentration
Currently, transformers are one of the most essential equipment in the power system. Studies show that the transformer failure can impose significant hazards, including unplanned power outages [1,2]. Meanwhile, the transformer contains a large amount of fuel oil, which is very prone to fire [3]. It is worth noting that suppression of fire in a high-voltage electric appliance is an enormous challenge [4]. Accordingly, fire can be considered as one of the important factors affecting power safety [5]. On the other hand, instability of the power grid adversely affects economic development [6]. Consequently, it is of significant importance to ensure the safe operation of transformers [7,8].
Water mist fire extinguishing technology is an emerging technology that uses water as the distinguishing medium. It has superior characteristics, including high fire extinguishing speed and low water consumption so that it has become increasingly popular in fire protection systems [9–14]. In this scheme, High-pressure water mist is applied to produce small droplets [15], which can bypass obstacles [16,17], while providing promising insulation for electrical equipment. Studies show that this approach has a good performance in extinguishing electric fires. The water mist has a high heat absorption capacity and does not transmit the radiative heat flux [18–22]. The main extinguishing mechanism of water mist is endothermic cooling and oxygen isolation asphyxiation [23], which is widely used in most fire prevention and extinguishing methods [24]. However, regulations on water mist systems are inadequate. In order to resolve this shortcoming, further investigations should be carried out to better understand the interactions between water mist and fire [25].
With the development of science and technology, numerical methods have been widely applied to simulate the transformer fire [26–28]. In order to reduce the damages originating from the transformer, numerous investigations have been carried out on the fire extinguishing of transformers with water mist. In this regard, Li et al. [29] implemented a fusion digital simulation (FDS) model for a demonstration section of the cable corridor of the urban utility tunnel and analyzed the performance of the water mist fire extinguishing system with low, medium, and high operating pressures under different spatial structures, fire source positions, and ambient air velocities. It was found that when the water mist sprinkler is turned on, sprayed droplets encounter high-temperature smoke in the fire and gasify. Then the high-temperature water vapor rises upward, thereby increasing the volume of the mixed fuel and the water vapor. Subsequently, the contact area with oxygen increases and the upper part temperature of the corridor increases greatly. After a period of time, the sprinkler sprays all over the space and cools down the hot smoke in the fire so that the fire temperature stabilizes within a certain time of control. Gałaj et al. [30] analyzed the impact of water mist flow rate on the temperature distribution in a closed space. Wang et al. [31] implemented a model based on the full-scale electrical corridor test platform and compared the influence of water mist spray intensity and sprinkler installation method on the fire extinguishing performance of high-pressure water mist for different fire sources, ventilation wind speeds and cable densities. Accordingly, it was found that the cooling rate of side spray sprinklers outperforms that of vertical sprinklers. Meanwhile, it was concluded that increasing the spray intensity has no impact on the cooling rate and the fire-extinguishing performance. Wang et al. [32] studied the influence of working pressure on the effectiveness and safety of high-pressure water mist in case of electric fires. In a closed environment of 4 m × 4 m × 5 m, water mist sprinklers were tested at different spray pressures. The results showed that as the nozzle pressure increases, the particle size of the water mist decreases continuously. Moreover, it was found that the pressure has a significant impact on the particle size of the water mist. However, when the pressure exceeds a certain value, the influence of the pressure on the droplet size reduces. Such a decrease rate is high in the direct injection scheme compared to that in that dispersion approach. Chen et al. [33] carried out the spray test of 220 kV on a full-scale transformer with a high-voltage bushing. The results showed that the transformer current does not change significantly before and after spraying, indicating the live insulation capability of the water mist in protecting the transformer. Shi et al. [34] used a smoke analyzer and a thermocouple device to investigate the suffocation effect of the high-pressure water mist system on the extinguishing performance of the oil pan, and found that the suffocation effect exists when the sprinkler is on the top, while there is no suffocation for the side sprinkler. However, the fire extinguishing rate of the top sprinkler is high so that the corresponding fire extinguishing time is low. Zhang et al. [35] studied the urban utility tunnel with openings at both ends and used FDS to simulate fire and study the effect of the sprinkler layout on the fire extinguishing performance. It was found that the water mist fire extinguishing effect is good when there is no cable trough. Moreover, when there is a cable trough, the fire extinguishing performance improves with side sprinklers. Meanwhile, it was found that when sprinklers are installed along the longitudinal direction, the fire extinguishing effect at 3 m is better than that at 2 m. This achievement can be used to appropriately increase the sprinkler spacing and reduce costs. Dai et al. [36] carried out a full-scale fire experiment study on a 35 kV outdoor transformer to explore the combustion characteristics of substations in case of fire. Obtained results showed that transformer fires have hidden, three-dimensional, and multi-scale combustion characteristics. Fire sources of different scales collide and merge during the combustion process. In the full combustion stage, the flame on the upper part of the transformer has instable flame oscillations and separation. The flame form is mainly adherent flames at the bottom, while continuous and intermittent flames originating from diffusion combustion appear at the top. Moreover, the temperature distribution gradually decreases along the vertical direction. Along the horizontal direction, high temperatures appear in the middle, while low temperatures appear on both sides.
Transformer fire not only imposes significant economic losses but also may cause casualties. Generally, effective factors of high voltage water mist fire extinguishing in transformers are revealed through experiments. In the present study, the fire extinguishing performance of the transformer is analyzed by simulating the high voltage water mist system. In this regard, different flow rates and particle velocities are considered in the simulations. Then the temperature distribution around the transformer, concentration of the flue gas and the upper temperature of the flue gas layer are compared. This article is expected to provide a theoretical and technical reference for the safe and stable operation of the transformer and promote the development and application of high-pressure water mist fire extinguishing technology.
It is worth noting that FDS is often used to simulate the flue gas flow and heat transfer process during the combustion in fire simulation scenarios and is widely used in the fire field. The basic governing equations are as follows [37]:
The equation of the mass conservation is mathematically expressed as follows:
The momentum conservation equation is expressed as follows:
The energy conservation equation is described as:
Equation of state is described as:
For most applications, FDS uses a combustion model based on the mixing-limited and infinitely fast reaction of lumped species. Lumped species are reacting scalar quantities that represent a mixture of species. For example, air is a lumped specimen, which is a mixture of nitrogen, oxygen, water vapor, and carbon dioxide. It is worth noting that the reaction of fuel and oxygen is not necessarily instantaneous and complete, and several optional schemes are designed to predict the extent of the combustion in under-ventilated spaces.
For an infinitely fast reaction, reactant species in a given grid cell are converted to produce species at a rate determined by a characteristic mixing time,
In the simulated fire scene, if only the flame thermal effect is considered, the mixed component combustion model can meet the requirements. However, in order to study the concentration of smoke and carbon monoxide, carbon dioxide and other gases produced in the fire, the finite chemical reaction model should be introduced into the calculation. In general, the simplified equation for the combustion of hydrocarbons such as oil products is mathematically expressed as [38]:
The rate of the chemical reaction is denoted as:
where A and
The cumulative volume distribution of the liquid spray ejected from the nozzle in FDS software can be represented by a combination of log-normal and Rosin-Rammler distribution functions [39]:
The movement of water droplets released after the nozzle is described as:

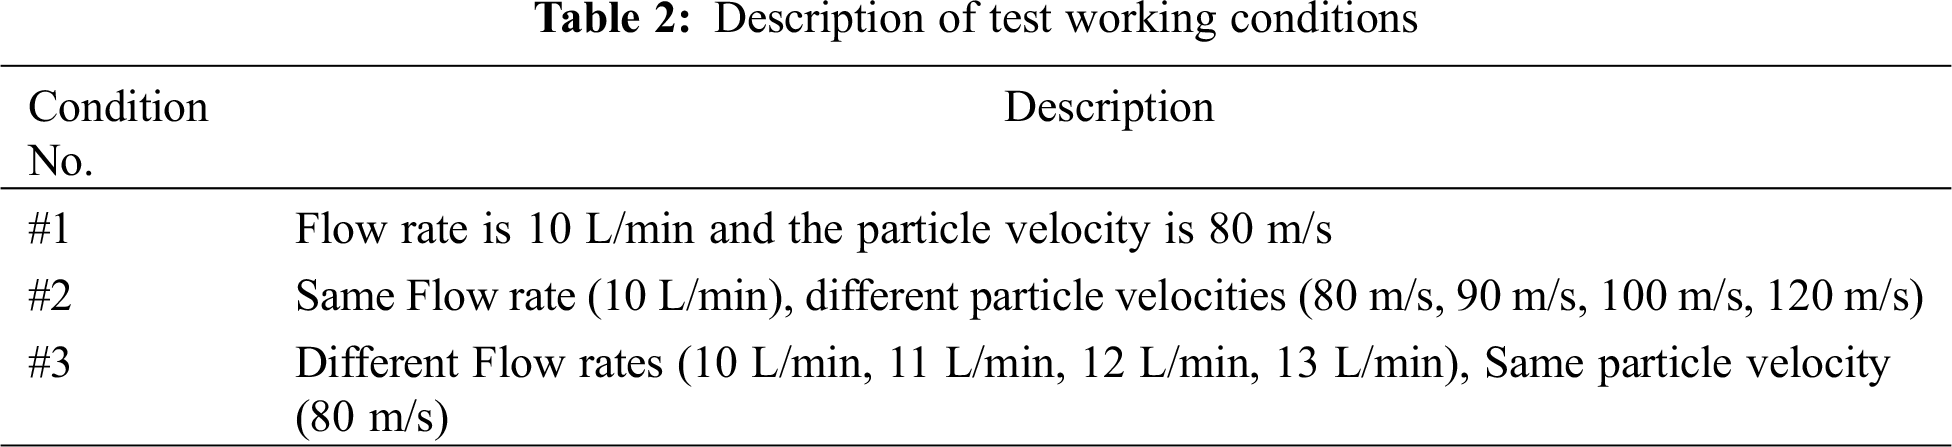
In this section, considering the transformer object, a transformer model of 4 m × 11.5 m × 7.7 m (x × y × z) is implemented by the Pyrosim software simulation. Tab. 1 shows the layout description.

Figure 1: The horizontal distribution of thermocouples

Figure 2: Configuration of the distribution of the smoke concentration measurement devices

Figure 3: Configuration of the temperature measurement points in the upper layer of the smoke layer
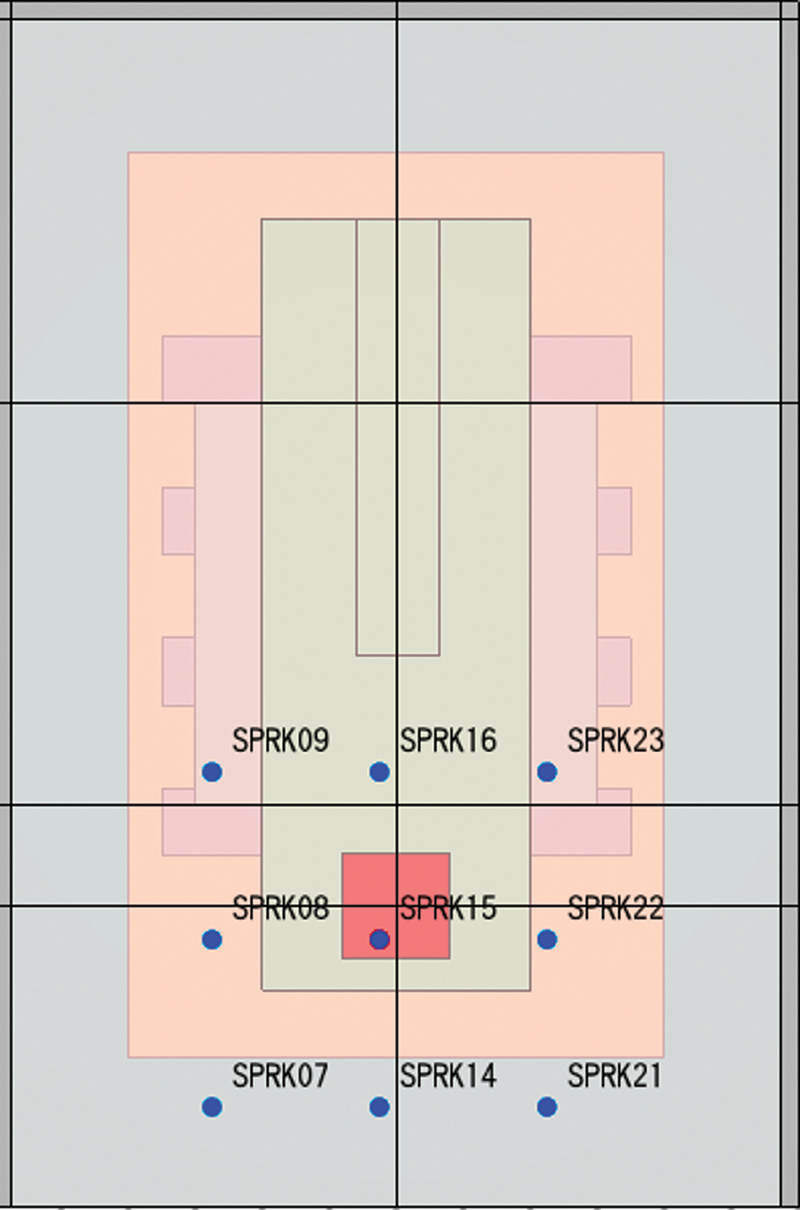
Figure 4: Configuration of the spraying device
3.1.2 Description of the Measurement Points
THCP, THCP 05, THCP 10, and THCP 15 denote 4 thermocouples at different heights located directly above the center of the fire source, which are located on the first, second, third, and fourth layer, respectively. The near point above the fire source is denoted as THCP, while the far point is determined as THCP05.
THCP 31, THCP 20, THCP 03, and THCP 01 are the thermocouples on the same plane of the ignition point, located in four positions, including front, back, left, and right side of the center of the fire source, respectively (The thermocouple ring that is closer).
THCP 35, THCP 24, THCP 04, THCP 02 are the thermocouples on the same plane of the ignition point, located in four positions, including the front, back, left, and right side of the center of the fire source (The thermocouple ring that is farther, i.e., the second ring).
Soot density 06, Soot density 01, 11, and 08 are the smoke and dust concentration measurement points in the front, back, left and right side of the plane above the center of the fire source. Meanwhile, Soot density 06 is the near point in front of the center of the fire source, and Soot density 07 denotes the far point.
The temperature of the upper layer of flue gas refers to the temperature of the flue gas at the top of the space where the transformer is located when a transformer fire occurs.
3.2 Simulated Working Conditions
According to the purpose of the test, the following working conditions are set to test the fire extinguishing effect of the high-pressure water mist system: Working condition 1 is that the fire source position is fixed, the flow rate is 10 L/min and the particle velocity is 80 m/s. In working condition 2, the fire source position is fixed, the flow rate is 10 L/min, and particle velocities are different, including 80 m/s, 90 m/s, 100 m/s and120 m/s. Working condition 3 is that the position of the fire source is fixed, with different flow rates of 10 L/min, 11 L/min, 12 L/min and 13 L/min, while the particle velocity is 80 m/s. Tab. 2 shows the description of test working conditions.
3.3 Simulation Parameter Setting
Model parameters as shown in Tab. 3.
In the process of the FDS simulation, the simulation area is categorized into three parts equally. Tab. 4 shows that the cell size is 0.25 m × 0.25 m × 0.25 m.
4 Comparative Analysis of Simulation Results
4.1 Thermocouple Temperature Curve Analysis
(1) Analysis of results of working condition 1
Fig. 5 illustrates that the temperature at the first layer of the thermocouple (THCP) is relatively high. This location is the closest to the fire source, and the temperature is 793°C. The temperatures of the remaining three layers are 353°C, 168°C, and 105°C. It is observed that the closer to the fire source, the higher the temperature, and vice versa. The temperature of the thermocouple (THCP31) in the front of the fire source varies significantly, and the temperature is about 150°C. On the other hand, the temperature of the thermocouple at the left (THCP03), right (THCP01) and rear (THCP20) positions of the fire source is about 50°C. Therefore, it is found that the fire source has a greater influence on the temperature in front of the fire source.
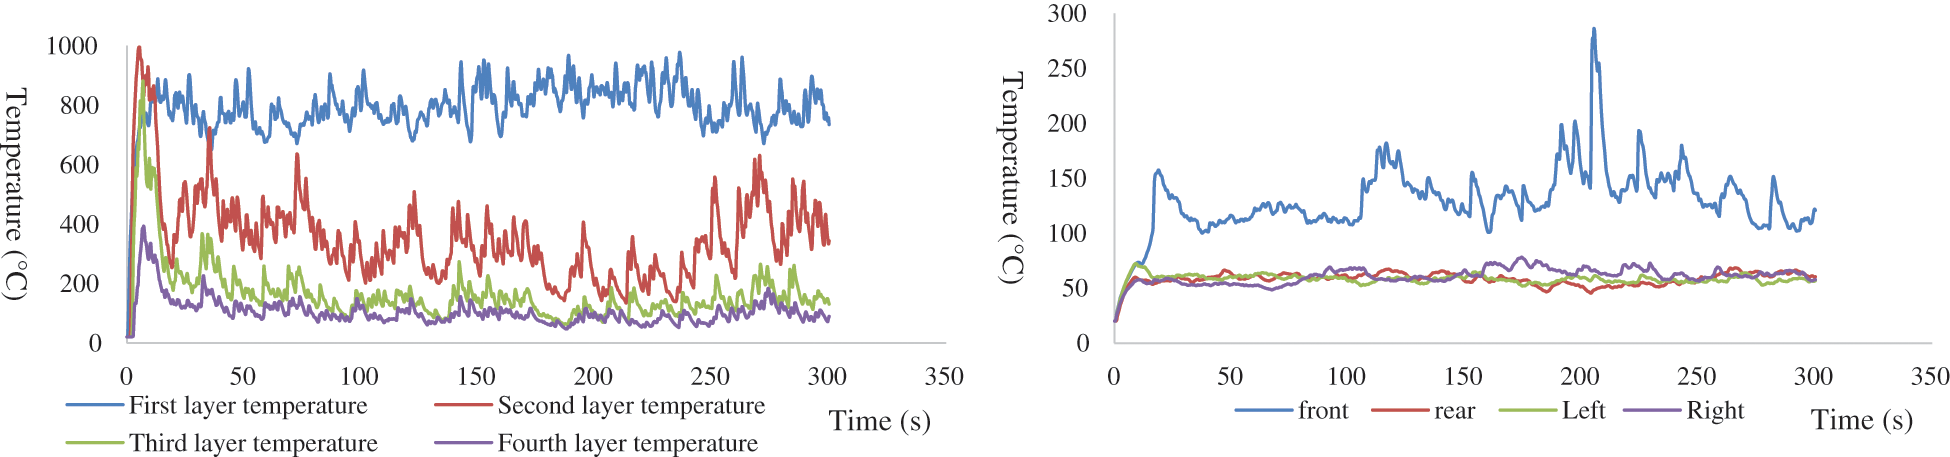
Figure 5: Temperature change curve at different locations around the fire source
(2) Analysis of results of the working condition 2
Fig. 6 shows that under the conditions of different particle velocities (80 m/s, 90 m/s, 100 m/s, 120 m/s) the following conclusions are obtained:
1. The average temperature changes of the first layer of thermocouple (THCP) above the fire source are 793°C, 817°C, 822°C and 843°C. Moreover, it is found that the temperature increases as the particle velocity increases. Therefore, under this condition, the high-pressure water mist with high particle velocity at the first layer above the fire source has a poor cooling effect on the fire source.
2. The average temperature changes of the second layer of the thermocouple (THCP05) above the fire source are 353°C, 349°C, 306°C and 315°C. The temperature rises at 120 m/s. It should be indicated that the higher the particle velocity, the better the cooling effect.
3. The average temperature changes of the first ring of the thermocouple (THCP31) in front of the fire source are 130°C, 123°C, 141°C and 175°C. Therefore, when the particle velocity is 80 m/s and 90 m/s, the temperature decreases as the velocity increases. This shows that the high-pressure water mist system has a cooling effect. At velocities of 100 m/s and 120 m/s, the temperature rises, which shows that there is no cooling effect.
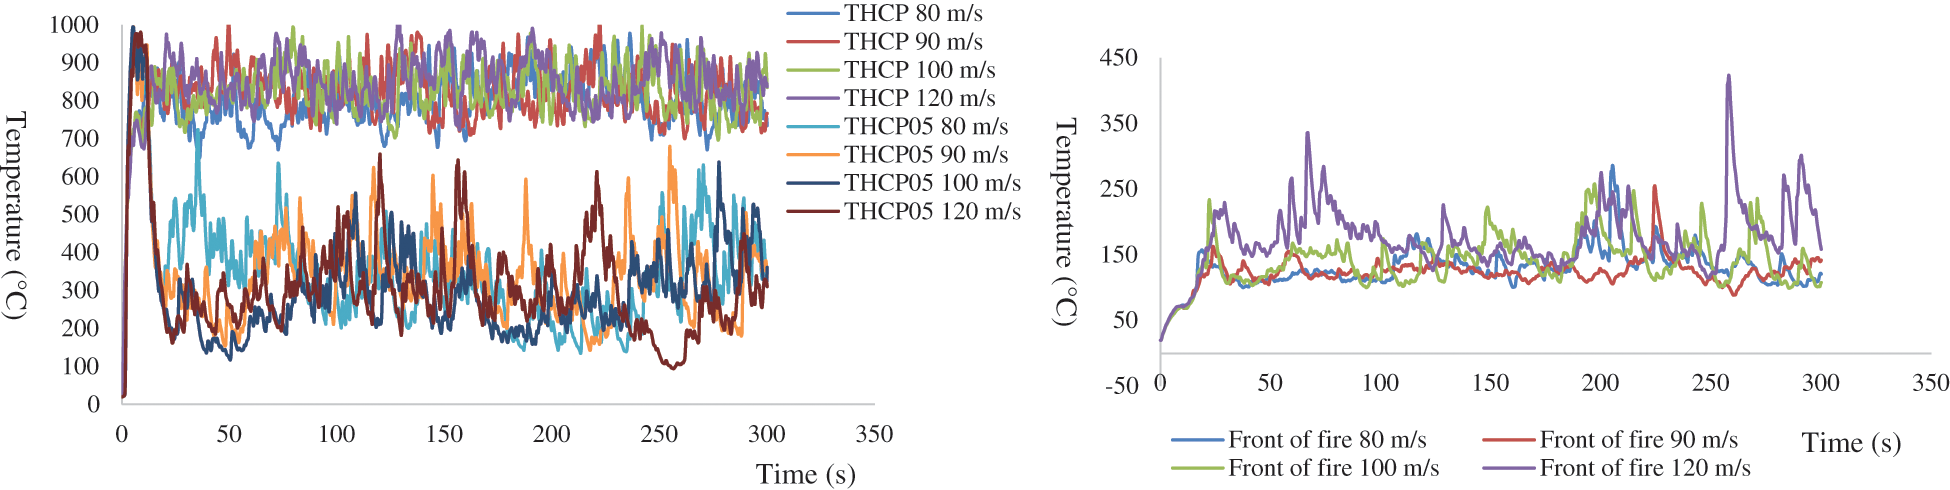
Figure 6: Temperature change curve at different locations around the fire source at the same flow rate and different particle velocities
(3) Analysis of results of working condition 3
Fig. 7 shows that the temperature of the near point (THCP) above the fire source is higher than that of the far point (THCP05). Therefore, the closer to the fire source, the higher the temperature. At flow rates of 10 L/min, 11 L/min, 12 L/min and 13 L/min, the average temperatures of the near point (THCP) above the fire source are 793°C, 844°C, 821°C and 858°C, respectively. The average temperature changes of the remote point (THCP05) above the fire source are 353°C, 324°C, 337°C and 242°C. Meanwhile, the cooling effect with a high flow rate is reasonable. The average temperature changes in front of the fire source (THCP31) are 130°C, 131°C, 129°C, and 131°C. It is worth noting that the higher the flow rate, the better the cooling effect.
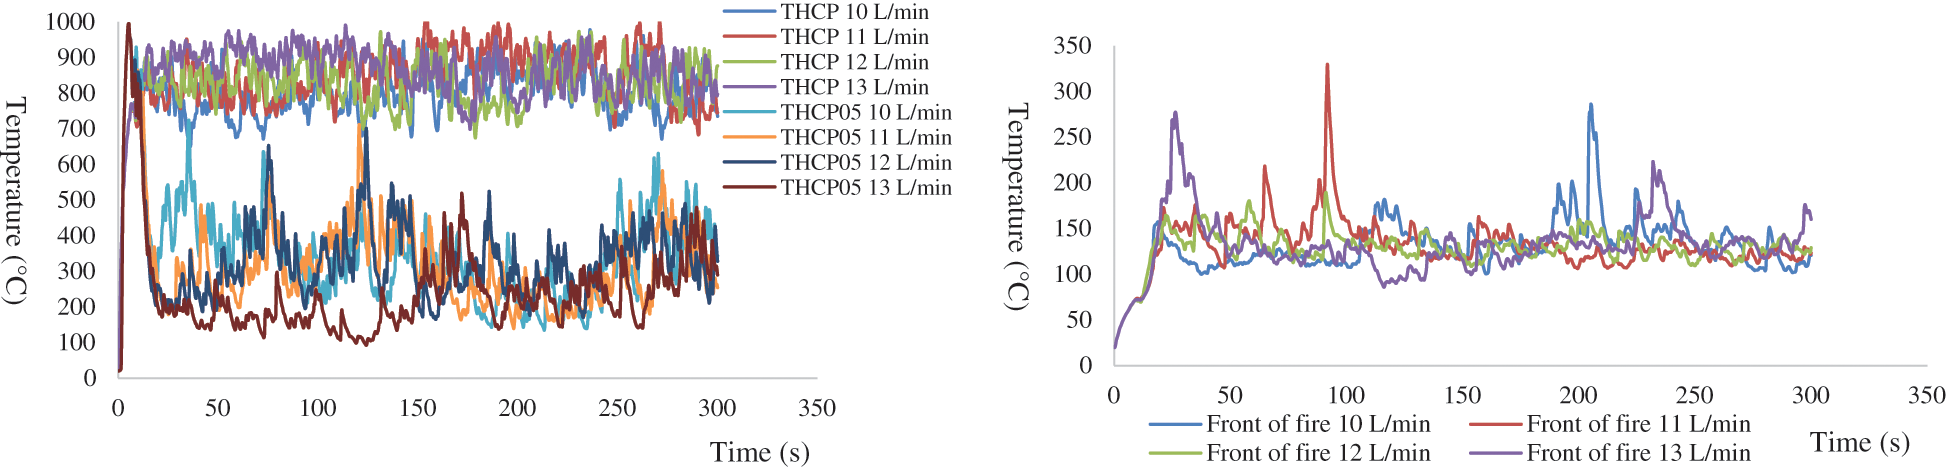
Figure 7: Temperature change curve at different locations around the fire source at different flow rates and same particle velocity
4.2 Analysis of the Smoke Concentration Curve
(1) Analysis of results of working condition 1
Tab. 5 shows that the average smoke concentration directly above the fire source is 1.2 × 10⁻⁴ kg/m3, and the average smoke concentrations in the four directions above the fire source are 5.36 × 10⁻⁵ kg/m3, 5.70 × 10⁻⁷ kg/m3, 4.24 × 10⁻⁶ kg/m3 and 7.07 × 10⁻⁶ kg/m3. Moreover, it is found that the smoke concentration directly above and in front of the fire source is higher.

(2) Analysis of results of working condition 2
Tab. 6 presents that at different particle velocities (80 m/s, 90 m/s, 100 m/s, 120 m/s), the average smoke concentration changes directly above the fire source are 2.66 × 10⁻⁵ kg/m3, 2.59 × 10⁻⁵ kg/m3, 2.33 × 10⁻⁵ kg/m3 and 2.43 × 10⁻⁵ kg/m3. The average smoke concentration changes in the front position above the fire source are 5.36 × 10⁻⁵ kg/m3, 5.30 × 10⁻⁵ kg/m3, 5.30 × 10⁻⁵ kg/m3 and 5.37 × 10⁻⁵ kg/m3. It is observed that the concentration of the flue gas is reduced by increasing the particle velocity directly above the fire source. On the front side of the fire source, increasing the particle velocity has little effect on the flue gas concentration.

(3) Analysis of results of the working condition 3
Tab. 7 presents that the average smoke concentration changes at the center position directly above the fire source under different flow rates are 2.66 × 10⁻⁵ kg/m3, 2.61 × 10⁻⁵ kg/m3, 2.66 × 10⁻⁵ kg/m3 and 2.04 × 10⁻⁵ kg/m3. Moreover, the average values of the smoke concentration in the front position above the fire source are 5.36 × 10⁻⁵ kg/m3, 5.29 × 10⁻⁵ kg/m3, 5.32 × 10⁻⁵ kg/m3 and 5.29 × 10⁻⁵ kg/m3. It is found that there is no obvious change in the flue gas concentration as the flow rate changes.

4.3 Analysis of the Temperature Change Curve of the Upper Layer of the Smoke Layer
(1) Analysis of results of the working condition 1
Fig. 8 shows that the upper layer temperature of the smoke layer reaches the maximum value of 900°C in about 10 s, and then gradually drops to a stable value of 100°C in about 50 s, with an average value of 172°C.
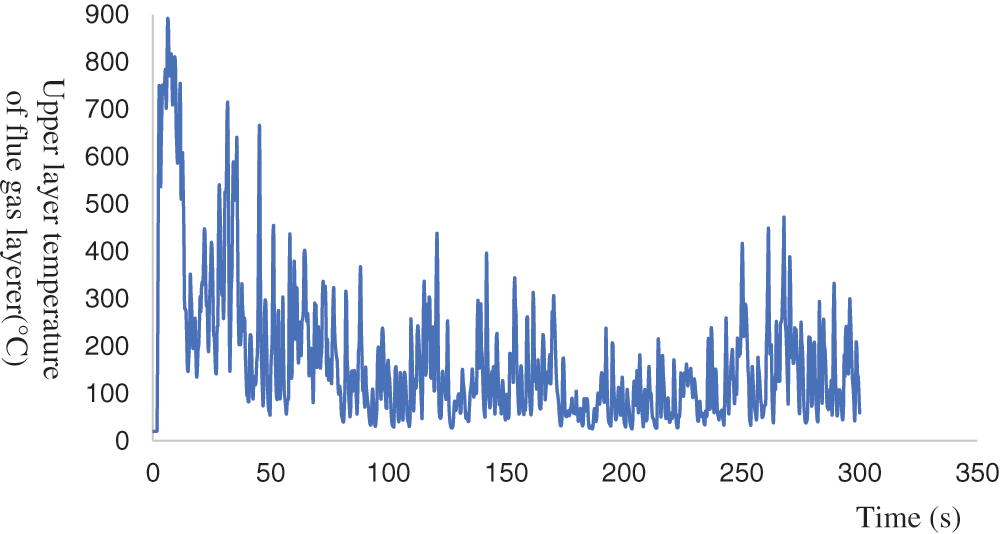
Figure 8: Temperature change curve of the upper layer of the smoke layer
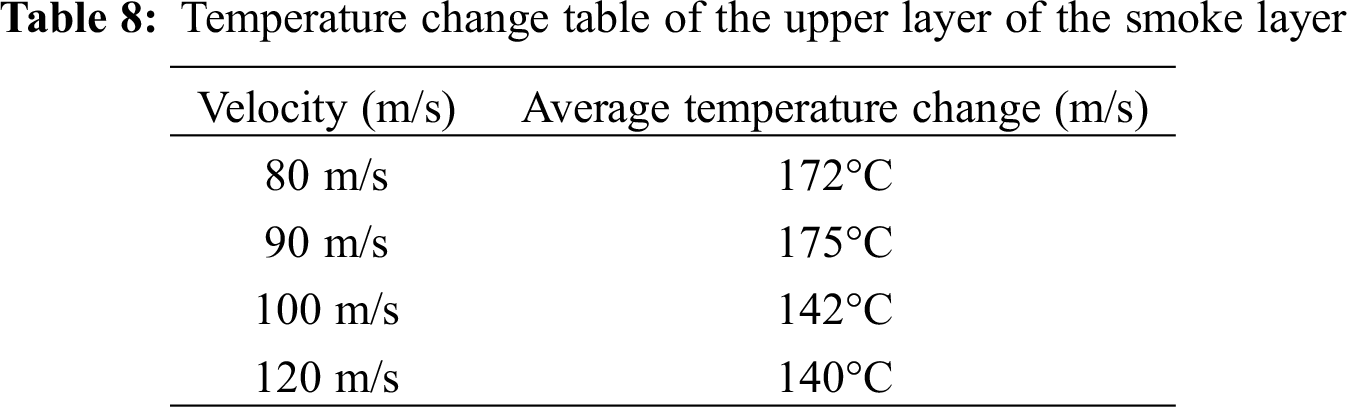
(2) Analysis of results of the working condition 2
Tab. 8 show that at different particle velocities of 80 m/s, 90 m/s, 100 m/s and 120 m/s, the average temperature changes in the upper layer of the smoke layer are 172°C, 175°C, 142°C and 140°C, respectively. The overall change trend shows that the working condition with high particle velocity has a reasonable cooling effect on the temperature of the upper layer of the smoke layer.
(3) Analysis of results of the working condition 3
Tab. 9 shows that the average temperature changes of the upper layer of the smoke layer at different flow rates are 172°C, 177°C, 184°C and 136°C. Moreover, it is found that the flow rate increases and the temperature of the upper layer of the smoke layer decreases, which plays a cooling role.

Transformer fire will not only cause casualties but also bring economic losses. In the present study, the key control factors of high voltage water mist fire extinguishing for the transformer under different boundary conditions are revealed by experiments. By analyzing the experimental results, theoretical and technical support for the safe and stable operation of the transformer equipment is provided. Moreover, the development and application of the high-pressure water mist fire extinguishing technology are provided. The following conclusions are drawn from the present study:
1. The closer to the fire source, the higher the temperature, and the farther away from the fire source, the lower the temperature. Around the fire source, the temperature and smoke concentration on the front side of the fire source are higher.
2. Under the conditions of different particle velocities, analyzing the temperature changes at the near point and far point above the fire source and in front of the fire source shows that increasing the particle velocity can reduce the temperature around the fire source, the concentration of flue gas and the temperature of the upper layer of flue gas layer.
3. Under different flow rates, analyzing the temperature changes at the near and far points above the fire source and in front of the fire source shows that increasing the flow rate reduces the temperature around the fire source and has a negligible effect on the flue gas concentration.
Funding Statement: This work was supported by Science and Technology Project Funded by State Grid Henan Electric Power Company (521702200004), Henan Province Key R&D and Promotion Special (Technology Research) Project (212102210016), Opening Fund of State Key Laboratory of Fire Science (SKLFS) under Grant No. HZ2021-KF11.
Conflicts of Interest: The authors declare that they have no conflict of interest to report regarding the present study.
1. Zhu, Z. G. (2017). Analysis of a transformer accident. Metallurgical Industry Automation, 41(4), 64–67. [Google Scholar]
2. Wang, H. F., Chen, C., Hu, L., Wang, X. J. (2018). Reflection and prevention of transformer fire typical case. Distribution & Utilization, 35(11), 78–82. [Google Scholar]
3. Zhang, B., Zhang, J., Huang, Y., Wang, Q., Fan, M. (2019). Burning process and fire characteristics of transformer oil: A study focusing on the effects of oil type. Journal of Thermal Analysis and Calorimetry, 139(3), 1839–1848. [Google Scholar]
4. Lu, J. Z., Chen, B. H., Liang, P., Sun, Y., Fang, Z. et al. (2019). Experimental evaluation of protecting high-voltage electrical transformers using water mist with and without additives. Fire Technology, 55(5), 1671–1690. [Google Scholar]
5. Liu, Y., Chen, B. H., Wu, C. P., Liang, P., Sun, Y. C. et al. (2020). Development of true type transformer fire extinguishing test platform and coupling fire-extinguishing test. Fire Science and Technology, 39(7), 966–969. [Google Scholar]
6. Bracale, A., Carpinelli, G., de Falco, P. (2019). Probabilistic risk-based management of distribution transformers by dynamic transformer rating. International Journal of Electrical Power and Energy Systems, 113, 229–243. [Google Scholar]
7. Fauzi, N. A., Ali, N., Ker, P. J., Thiviyanathan, V. A., Mun, L. H. (2020). Fault prediction for power transformer using optical spectrum of transformer oil and data mining analysis. IEEE Access, 99, 1. [Google Scholar]
8. Bucci, G., Ciancetta, F., Fioravanti, A., Fiorucci, E., Prudenzi, A. (2020). Application of SFRA for diagnostics on medical isolation transformers. International Journal of Electrical Power & Energy Systems, 117, 105602. [Google Scholar]
9. Chen, Q., Wei, X., Chen, G., Wang, Z. G., Li, G. J. et al. (2020). Research on the atomization characteristics of fine water under different pressure. Fire Science and Technology, 39(6), 803–806. [Google Scholar]
10. Liang, Q., Xu, H., Sun, N. N. (2018). Development on experimental device of water mist fire extinguishing system and teaching practice. Experimental Technology and Management, 35(2), 85–88+93. [Google Scholar]
11. Liu, Q. Y., Yi, X. Y., Lv, Z. H., Zhang, Z. (2019). Progress on water mist fire suppression effectiveness. Science Technology and Engineering, 19(22), 11–19. [Google Scholar]
12. Zhou, Y., Bu, R., Gong, J., Zhang, X., Fan, C. et al. (2018). Assessment of a clean and efficient fire-extinguishing technique: Continuous and cycling discharge water mist system. Journal of Cleaner Production, 182(1), 682–693. [Google Scholar]
13. Zhang, P., Tang, X., Tian, X., Liu, C., Zhong, M. et al. (2016). Experimental study on the interaction between fire and water mist in long and narrow spaces. Applied Thermal Engineering: Design, Processes, Equipment, Economics, 94, 706–714. [Google Scholar]
14. Yu, H. Z. (2020). The ceiling height limits for water mist protection of two solid combustible fire hazards in open environment. Fire Technology, 57, 163–187. [Google Scholar]
15. Liu, H. R., Wang, C., Cordeiro, I., Yuen, A., Chen, Q. et al. (2020). Critical assessment on operating water droplet sizes for fire sprinkler and water mist systems. Journal of Building Engineering, 28, 10900. [Google Scholar]
16. Liu, Y., Wang, X., Liu, T., Ma, J., Zhao, Z. (2020). Preliminary study on extinguishing shielded fire with water mist. Process Safety and Environmental Protection, 141, 344–354. [Google Scholar]
17. Shrigondekar, H., Chowdhury, A., Prabhu, S. V. (2018). Characterization of a simplex water mist nozzle and its performance in extinguishing liquid pool fire. Experimental Thermal and Fluid Science: International Journal of Experimental Heat Transfer, Thermodynamics, and Fluid Mechanics, 93, 441–455. [Google Scholar]
18. Lv, D., Tan, W., Zhu, G., Liu, L. (2019). Gasoline fire extinguishing by 0.7 mpa water mist with multicomponent additives driven by CO2. Process Safety and Environmental Protection, 129, 168–175. [Google Scholar]
19. Shi, J. T., Ren, W. X., Liu, X. (2019). Novel technology for fire suppression using nitrogen-water nist in enclosed spaces. Geomatics, Natural Hazards and Risk, 11(1), 22–39. [Google Scholar]
20. Lu, J. Z., Chen, B. H., Liang, P., Sun, Y., Fang, Z. et al. (2019). Experimental evaluation of protecting high-voltage electrical transformers using water mist with and without additives. Fire Technology, 55, 1671–1690. [Google Scholar]
21. Leonid, A. D., Vladimir, Y. L., Alexei, P. K, Siaka, D., Jennifer, X. W. (2020). A comparative analysis of shielding of thermal radiation of fires using mist curtains containing droplets of pure water or sea water. International Journal of Thermal Sciences, 152, 106299–106299. [Google Scholar]
22. Hiroki, G., Taichi, N., Yuto, T., Mizuho, O., Takuma, K. et al. (2020). Protection from thermal radiation of hazardous fires: Optimizing microscale droplet size in mist barriers using radiative transfer analysis. Process Safety and Environmental Protection, 143, 114–120. [Google Scholar]
23. Chen, B. Y., Yang, Y. B., Bing, Z., Shi, J., Wang, X. P. (2019). Study on the influence of fine water mist particle size on fire extinguishing effect of cable cabin in underground utility tunnel. Fire Science and Technology, 38(6), 832–836. [Google Scholar]
24. Lun, P. Y., Zhang, Q., Li, X. K. (2020). Experimental study on the pulse water mist fire suppression system performance in a confined space. Journal of the Brazilian Society of Mechanical Sciences and Engineering, 42(5), 258. [Google Scholar]
25. Wang, Z., Wang, W. H., Wang, Q. S. (2016). Optimization of water mist droplet size by using CFD modeling for fire suppressions. Journal of Loss Prevention in the Process Industries, 44, 626–632. [Google Scholar]
26. Lei, L., Chen, W., Li, H., Shi, S. (2020). Numerical simulation of fire-smoke diffusion caused by vehicles in a tunnel. Fluid Dynamics & Materials Processing, 16(5), 837–856. [Google Scholar]
27. Triveni, M. K., Panua, R. (2018). Numerical study of natural convection in a right triangular enclosure with sinusoidal hot wall and different configurations of cold walls. Fluid Dynamics & Materials Processing, 14(1), 1–21. [Google Scholar]
28. Du, J., Wu, X., Li, R., Cheng, R. (2019). Numerical simulation and optimization of mid-temperature heat pipe exchanger. Fluid Dynamics & Materials Processing, 15(1), 77–87. [Google Scholar]
29. Li, Y., Lei, L., Kan, Q., Xiang, K. (2019). Comparative analysis of the effectiveness of water mist fire extinguishing system in cable corridor. Fire Science and Technology, 38(11), 1548–1552. [Google Scholar]
30. Gaaj, J., Tunio, N., Wolny, P., Drzymaa, T. (2020). Analysis of the impact of water flow rate on the temperature variability in a closed room during the extinguishing of a-group fire using a hybrid water mist suppression system. Sustainability, 12(2), 8700–8700. [Google Scholar]
31. Wang, Y., Sun, Y. M., Lei, L. (2020). Study on fire temperature characteristics and fire extinguishing effectiveness test of electrical utility tunnel. Safety & Security, 41(2), 36–41. [Google Scholar]
32. Wang, M. W., Tao, B., Li, J. W., He, Y. H. (2020). Experimental study on the effectiveness and safety of water mist in electrical fire fighting. Fire Science and Technology, 39(7), 969–972. [Google Scholar]
33. Chen, B. H., Deng, J., Sun, Y. C., Li, B., Fang, Z. et al. (2020). Study on electrical insulation performance of water mist for electrical transformer. Fire Science and Technology, 39(1), 67–69. [Google Scholar]
34. Shi, X. T., Shi, H. J., Tian, H., Chen, J., Yao, J. (2019). Experimental study on fire extinguishing mechanism of oil pan by water mist. Fire Science and Technology, 38(11), 1556–1560. [Google Scholar]
35. Zhang, J., Shu, N., He, J. Z., Huang, H. B. (2019). Influence of sprinkler arrangement on water mist fire extinguishing in utility tunnel. Fire Science and Technology, 38(2), 236–239. [Google Scholar]
36. Dai, C. R., Chen, G., Zhu, B., Xu, L., Chen, P. et al. (2020). Full scale experimental research on combustion characteristics of outside transformer fire. Fire Science and Technology, 39(3), 318–321. [Google Scholar]
37. Zhu, S., Huo, R., Hu, L. H. (2008). The influence of grid division and the extension of computational area at the opening on the FDS simulation results. Journal of Safety and Environment, 4, 131–135. [Google Scholar]
38. Zhao, Z. W. (2010). Study on the application of common fire numerical simulation software FDS. Shanxi Architecture, 36(13), 364–365. [Google Scholar]
39. Lan, Z. Y., Li, X. J. (2021). FDS fire simulation modeling method. For Woodwork Buildings in Southern China Architecture and Culture, 2, 237–238. [Google Scholar]
 | This work is licensed under a Creative Commons Attribution 4.0 International License, which permits unrestricted use, distribution, and reproduction in any medium, provided the original work is properly cited. |